Article

Laser Powder Bed Fusion Fabrication of a Novel Carbide-Free Bainitic Steel: The Possibilities and a Comparative Study with the Conventional Alloy

Department of Industrial Engineering, University of Padova, Via Marzolo 9, 35131 Padova, Italy
*
Author to whom correspondence should be addressed.
Metals 2024, 14(1), 113; https://doi.org/10.3390/met14010113
Submission received: 13 December 2023 / Revised: 9 January 2024 / Accepted: 15 January 2024 / Published: 17 January 2024
(This article belongs to the Section Additive Manufacturing)

Abstract

:
A newly developed medium-carbon carbide-free bainitic steel was fabricated for the first time utilizing the laser powder bed fusion (L-PBF) technique. Process parameters were optimized, and a high density of 99.8% was achieved. The impact of austempering heat treatment on the bainite morphology and transformation kinetics was investigated by high-resolution microstructural analysis (SEM, TEM, and EDS) and dilatometric analysis, and results were compared with conventionally produced counterparts. Faster kinetics and finer microstructures in the L-PBF specimens were found as a consequence of the as-built microstructure, characterized by fine grains and high dislocation density. However, a bimodal distribution of bainitic ferrite plate thickness (average value 60 nm and 200 nm, respectively) was found at prior melt pool boundaries resulting from carbon depletion at such sites.

1. Introduction

Metal additive manufacturing (MAM) has emerged as a highly appealing manufacturing technique both in industry and academia [1]. MAM offers several advantages over conventional methods, including lower material waste during fabrication, shorter production lead time, enhanced flexibility, and the ability to achieve full, dense [2] net-shape components with complex geometry and high reproducibility thanks to the latest advancements [3]. These advantages have contributed to the widespread adoption of MAM in various industries. Gisario et al. [4] reported that the ability to produce customized parts enhances the industrial interest in MAM processes. These techniques can be categorized into different groups [1], with laser powder bed fusion (L-PBF) being the most diffused method. Extensive research on L-PBF is available in the literature [5,6,7,8,9,10], highlighting its superior accuracy and the high quality of the final components it produces. L-PBF involves the deposition of layers of powders on a build platform and the subsequent melting, adopting a high-power laser beam. The process is repeated in asynchronous cycles until the completion of the CAD-designed component. It is common knowledge that various parameters, such as laser power, scan speed, layer thickness, hatch spacing, and scan strategy, need to be optimized for each specific material during the L-PBF fabrication. These parameters directly influence the final microstructure and properties of fabricated components [11], which explains why extensive research is dedicated to parameter optimization [12]. However, despite many advantages, MAM processes comprise certain challenges and limitations. Firstly, they have a low mass production rate; electrical, thermal, and mechanical anisotropy in various directions [13,14]; high surface roughness; and wide dimensional/geometrical tolerances [15].
In the past two decades, Bhadeshia, Caballero, and Garcia-Mateo, applying the theories of the displacive transformation, developed a new generation of advanced high-strength steels manufactured by conventional methods characterized and exceptional mechanical performances: nanostructured bainitic steels, also called low-temperature bainitic steels or superbainitic steels [16,17,18]. These are silicon-based steels (>1.5 wt.%) characterized by ultimate tensile strength values above 2000 MPa and elongation up to 20% [19,20]. These findings have thus served as inspiration for numerous studies that have led to the development of novel steel compositions with tailored properties, which have found applications in various industrial sectors thanks to the remarkable weight reduction of the structures [21,22,23,24,25,26,27,28]. For example, currently, tunnel boring machines, high-power generators, components for wind turbines [29], and diesel injector systems [29] are manufactured with nanostructured steels.
These remarkable mechanical characteristics are attributed to the composite microstructure, consisting of bainitic ferrite and carbon-enriched retained austenite, which is generally achieved after isothermal holdings above martensite start (Ms) temperature after austenitization [30]. Furthermore, low-temperature bainite formation results in finer microstructures due to the higher strength of the parent phase (austenite) that inhibits the growth of the bainitic ferrite plates.
On the one hand, the strength is ascribed to bainitic ferrite, characterized by a submicron-nanometric scale, which contributes to the solution strengthening and dislocation forests. On the other hand, the major contribution to the ductility is associated with the TRIP effect, i.e., the strain-induced martensitic transformation of the retained during loading; then, the contribution of twins in austenite should be considered as a strain hardening mechanism that enhances the ductility of these microstructures [31].
Furthermore, a considerable silicon content (>1.5 wt.%), coupled with the addition of aluminum, is considered to suppress the cementite precipitation during the isothermal holding treatments. As silicon and aluminum are not soluble in cementite, their presence in austenite delays or even impedes the cementite formation in austenite, making the austenite highly carbon-enriched and stable at room temperature. In fact, the high carbon in the solid solution enables the reduction of the onset of the martensitic transformation below room temperature, impeding any other phase transformation after the final cooling stage. Retained austenite, in addition, can be differentiated into two morphologies: the film-like morphology and the block-like morphology [32]. The film-like structure substitutes with bainitic ferrite inside the sheaves and is characterized by a carbon content usually superior to 1% (which confers high mechanical and thermal stability). The latter exists between the sheaves and is commonly considered by lower carbon content. Thus, the composition and heat treatment parameters play an important role in the constituent phases and distribution and size of austenite in the microstructure, directly affecting the mechanical performance of the final components.
Nevertheless, the primary obstacles to the widespread industrial adoption of these steel grades lie in the poor weldability and the slow transformation kinetics of the bainitic reaction. Firstly, the high hardenability of these steels leads to martensite formation in the heat-affected zone, which depletes the material’s ductility and toughness. On the other hand, the latter makes the time required to complete the bainitic transformation during isothermal treatments sustainable only for niche applications. There are several approaches that lead to an acceleration of the bainitic transformation, such as the chemical modification that includes a reduction of the carbon content, as with the steel considered in this study, which, in turn, slightly reduces the mechanical strength and the partial substitution of silicon with aluminum. At the same time, thermomechanical processes, called ausforming or two-step austempering treatments, lead to a reduction in the required time to achieve the completion of the bainitic transformation. Ausforming accelerates the bainitic transformation since the deformations modify the activation energy for the bainitic ferrite formation, leading to stress- and strain-induced transformations that enhance the transformation kinetics [28,33,34,35,36]. Additionally, double-step treatments [24,37] lead to the acceleration of the bainitic transformation by the formation of a first population of bainitic ferrite at high temperatures, where the reaction kinetic is generally faster compared to low-temperature transformation. Moreover, this provides nucleation sites for bainitic ferrite plates, which are refined since they formed at a low temperature, significantly reducing the incubation period. Finally, the resulting bimodal distribution of bainitic ferrite plates results in better mechanical performances.
Extensive research has been conducted on the L-PBF production of stainless, tool [38,39], and maraging steels [40,41,42] and silicon-containing ferrous alloys for the production of soft magnetic devices or electrical applications, with [43] and without post-manufacturing heat treatments [43,44]. However, despite the numerous advantages of bainitic steels and their use in demanding applications that require both high strength and elongation, to the best of our knowledge, there is a lack of research on their fabrication using the L-PBF method. Furthermore, it is also unclear whether it is possible to fabricate fully dense parts with mechanical and microstructural characteristics comparable to those produced using conventional methods.
Moreover, it is important to note that the microstructure and chemical composition of the alloys considered in the previous studies mentioned are completely different from the case of carbide-free bainitic and low-alloyed high-strength steels. Most studies have focused on the MAM process wire arc additive manufacturing (WAAM) technique [45,46,47] or on the production of coating by means of laser cladding [48,49,50]. Despite higher productivity, less expensive equipment, and larger components compared to the L-PBF method, WAAM is associated with a lower surface quality, higher distortions, and a significantly higher number of defects, particularly at the interpass zone (e.g., the formation of brittle phases, i.e., martensite), and residual stresses, which are among the disadvantages of WAAM method. Thus, L-PBF could potentially be a more reliable and promising technique for the production of high-quality bainitic steels [45,51,52,53].
In the current investigation, an attempt was made for the L-PBF fabrication of novel carbide-free nanostructured bainitic steel with a newly developed composition of medium-carbon, high-silicon, and carbide-free bainitic steel (0.4C-3.2Si-2.6Mn-0.1Al) [24,28] developed following the bainite transformation theory proposed by Bhadeshia. The parameter optimization had been performed to obtain high-density specimens. Moreover, the effect of post-fabrication heat treatments on the specimen microstructure was also analyzed and compared with the conventional alloy developed by the same authors [24] by means of dilatometry and microstructural observations (SEM, TEM, XRD). The carbon concentration is maintained at a medium level to improve weldability and achieve low Ms [54] to obtain a carbide-free bainitic microstructure [32,37,55,56]. Furthermore, Si and Al were added to avoid cementite precipitation from untransformed retained austenite during isothermal treatments and control the reaction kinetic of the bainitic transformation [21,57,58], while manganese stabilizes and strengthens austenite.

2. Experimental Procedures

2.1. L-PBF Fabrication and Parameter Optimization

Argon-atomized powders of a newly developed, medium-carbon bainitic steel were employed in this study with the chemical composition shown in Table 1 (wt.%), with the estimated Ms equal to 245 °C (dilatometric studies reported elsewhere [23,26] along with melting temperatures estimated by JMatPro v7.0 [59] simulations of the phase diagram, as illustrated in Figure 1).
The diameter size range of the powder was 15–53 µm, measured with a Malvern laser granulometry (Malvern Panalytical, Malvern, United Kingdom).Figure 2a,b depict the SEM micrographs of the produced powder, highlighting the overall spherical shape of the particles with a few cases of satellite defects on the surface of the big ones (less than 53 µm). In addition, an in-depth analysis of the microstructure of the particles, as shown in Figure 2c, reveals a martensitic microstructure (α’), which could be a consequence of the rapid cooling during the atomization process, inhibiting the diffusional transformations, such as the pearlitic ones.
L-PBF samples were fabricated with a commercial Renishaw AM400 (Renishaw, Dundee Township, IL, USA) system, with a YAG fiber laser with a laser spot size of 70 µm and a maximum nominal laser power of 400 W. The system was equipped with an automatic powder feeding and recycling system under a controlled atmosphere of argon (99.99%). Cubic samples with dimensions of 10 × 10 × 10 mm3 were fabricated on triangular support using process parameters summarized in Table 2, with the aim of detecting the possible correlation of process parameters with consequent pore density and microstructural characteristics. Process parameters considered in this study were laser power (LP) and scanning speed (SS), while hatch space (HS) and layer thickness (LT) were kept constant. A bidirectional scanning strategy with a rotational angle of 67 degrees between two consecutive layers, as displayed in Figure 2d, was utilized, and the fabrication process was conducted without preheating the build platform.

2.2. Porosity, Melt Pool, and Microstructural Analysis

Pore analysis of L-PBF-fabricated specimens was performed to evaluate the density of the samples, the distribution of porosities, and their properties. It is worth mentioning that since powder particles could be entrapped in pore sites, the conventional Archimedes method was not applied for density analysis, while microscopic and image analyses were performed as an alternative for higher precision of the reported results. To have a clear idea regarding the variation of porosity from the surface to the center, specimens were cut cross-sectionally from the center both along the build direction and along the transverse direction, and porosity analysis was performed both near surface and in the center of the specimens. To quantify the porosity of the samples, cross-sectioned surfaces of the specimens were ground and polished up to a mirror finish according to standard metallographic sample preparation up to 1 µm diamond polycrystalline suspension. Porosity assessment was performed by optical microscopy (OM) using a LEICA DMRE optical microscope (Leica Microsystems S.r.l., Milan, Italy). With the aim of having a good statistical model for the pore characterization, 5 pictures were taken from each magnification of 50, 100, and 200× from both the center and surface of the cross-sectioned surface, according to the procedure reported by the authors in [9,10,60]. Subsequently, the images were analyzed with ImageJ 1.54d [61], and statistical analysis was performed utilizing the OriginLab 2023b software [62]. It is worth mentioning that in order to remove excess impurities caused by metallographic sample preparation, specimens were washed ultrasonically in 10% ethanol solution in distilled and deionized water for 10 min and rinsed with acetone prior to the optical microscopy observations. Furthermore, the melt pools were evaluated after etching the specimens with Nital 2 etchant solution (98% ethanol and 2% nitric acid). Ten photos were taken at 50 and 100× magnifications and analyzed using ImageJ software as well.
Grain structure and microstructural constituents were studied along the building direction by scanning electron microscopy (SEM Zeiss EVO MA10, Zeiss, Oberkochen, Germany) equipped with an electron dispersive spectroscopy (EDS) detector of INCA (Oxford Instruments, Oxfordshire, UK). To reveal the grain and the solidification structure, Rigsbee and Vander Arend chemical etchant solution, consisting of 2 g of ammonium, 2 mL of hydrofluoric acid, 50 mL of acetic acid, and 150 mL of water, was used, while microstructural constituents were revealed by Nital2 etching [63]. Compositional variation was also analyzed through EDS measurements performed at 20 kV accelerating voltage. TEM analysis was performed with a FEI Tecnai G2 TEM (FEI Company, Hillsboro, Oregon) microscope operating at 120 kV. Samples were prepared for TEM analysis according to [24], including mechanical thinning up to 50 µm with SiC papers, cutting 3 mm discs with a disc puncher, and twin-jet electropolishing up to perforation with a Struers Tenupol 3 system. A 95% acetic acid (CH3COOH) and 5% perchloric acid (HClO4) solution was used as an electrolyte at 45 V and at room temperature for the electropolishing of the specimens.

2.3. Hardness Measurements

Hardness was evaluated through Vickers HV0.3 measurements utilizing the Leitz DURIMET (Leica Microsystem S.r.l., Milan, Italy) hardness tester. Measurements were performed on the same cross-sectioned surface of the samples, previously prepared for the porosity and melt pool analysis, both near the surface and at the center of the specimens. Additionally, to have a clear idea regarding the hardness and microstructural variation in each melt pool, measurements were also performed at various points at melt pool boundaries and at the center as well. Measurements were also performed on heat-treated samples. It is worth mentioning that the reported results for the hardness measurement in the current manuscript are the average value of a minimum of 20 measurements that had been performed in each case.

2.4. Heat Treatment and Comparison with Conventionally Fabricated Material

The austempering heat treatment was performed on L-PBF-fabricated samples in order to compare its effect on the microstructure and the constitutive phases with the bulk material produced by conventional methods and with identical composition [24]. Both L-PBF and conventional alloys were subjected to the same austempering treatment. Cylindrical samples with a diameter of 4 mm and length of 10 mm were prepared by machining procedures. Heat treatments were performed utilizing a DIL 805 A/D (TA Instruments, Hüllhorst, Germany) high-resolution quenching dilatometer with an induction heating coil. Specimens were austenitized at 900 °C for 5 min in order to guarantee full austenitization and homogeneous solid solution, then cooled at 325 °C and held at the same temperature for 3 h to achieve bainitic transformation completion, and finally cooled at room temperature. Heating and cooling rates were set equal to 10 °C/s based on previous studies [24]. Heating and isothermal holding periods were performed in a vacuum, while gaseous argon was used as a coolant. Specimen’s temperature was monitored with a K-thermocouple spot welded on the center of the specimen surface, and the change in length was measured with a fused silica push rod and an LVDT (linear variable differential transducer) system. The heat-treated samples were compared through SEM observation and XRD diffraction measurements for phase identification and quantification, utilizing a Siemens D500 X-ray diffractometer (Siemens, Munich, Germany) with a Cu Kα radiation tube, working at 40 kV and 30 mA. A 2θ angular range between 40 and 105° was analyzed with scan step of 0.025° and counting time of 3 s per step. For phase quantification, Rietveld analysis was performed with the support of Maud software 2.996 [64]. Carbon content was determined according to the equation presented by Chen et al. [65]. Moreover, bainitic ferrite plate thickness was also measured by analyzing the obtained SEM images through the linear intercept method in the transverse direction with respect to the length of the sheaves. A stereological correction was applied, multiplying the measured thickness by a factor of 2/π, according to the method presented by Garcia-Mateo et al. [66].

3. Results

3.1. General Characterization

Twelve different sets of parameters and corresponding specimens were analyzed in the current investigation. Specimens of groups 8 to 12 were eliminated during the fabrication before the end of the L-PBF, as illustrated in Figure 3, process as a consequence of over-melted powder and the presence of several spatters that developed during the laser scans and adversely affected the quality of powder deposition. This might be ascribed to ineffective laser power–scan speed combinations and the specimen position on the building platform with respect to the gas flow, as mentioned in references [67,68].
General observations of the specimens highlighted the presence of cracks in the cross-sectioned surface near the supports (Figure 4). However, for the specimens of group one, cracks are also observed in the center of the cross-sectioned surface, as shown in Figure 4. Moreover, specimens of groups six and seven depicted over-melting signs on the surface, which was a consequence of the high energy input density. For all specimens, melt pools were continuous, and the measurement of the melt pool width was intuitive. However, the melt pool height, which corresponds to the layers as depicted in Figure 5, highlights the lower sensitivity of the melt pool height with the process parameters, resulting from the combined effect of laser power and scan speed on the height of the melt pools.
Moreover, the hardness measurement of the specimens, both in the center and adjacent to the surface, is summarized in Table 3. The obtained results revealed that, in general, for all specimens, the hardness adjacent to the surface was lower by 15 to 25 HV than the center of the specimens. For the case of group one, the difference was more significant, which could be a result of the higher porosity for this group when adjacent to the surface. Specimens of group one indicated the highest hardness among all, with a value of 539 HV. Furthermore, the lowest hardness corresponded to group six with a value of 465 HV, highlighting a slight correlation between the hardness value and the energy input density.

3.2. Pore Density

Pore analysis was performed to shed light on the correlation of energy input density with the surface defect distribution and size (Figure 6). Specimens of group one showed the worst condition compared to other groups in both the thickness of the layer (in the cross-section) and the pore size. The thickness of the high-porosity region near the surface measured 2.54 mm for specimens belonging to group one, signifying a denser concentration of pores adjacent to the boundaries of the manufactured specimens. In contrast, the thickness of such a high-porosity zone was comparatively less prominent in the other groups when compared to group one.
The total number of detected pores adjacent to the surface was 30,857 counts for the specimen of group one with an interquartile (Q1–Q3) value of 41.38 µm2, which reduced to 6770 counts for the specimens of group 6, with an interquartile surface of 222.51 µm2, highlighting the reduction of surface pore count from sample 1 to sample 6 and an increase in the size of the pores close to the surface. Though, considering both lower pore count and size, specimens of group 2 showed more encouraging results regarding the surface condition, with a total number of 8427 pores and an interquartile pore surface area of 90.46 µm2. The surface pores of specimens of group 1 and group 2 are shown in Figure 6. On the other hand, pore analysis of the center of the specimens unveiled better performance of group seven compared to other specimens, with a total pore count of 3739 and an interquartile surface area of 19.12 µm2. Considering the pore count, specimens of group 6 had the highest pore count, with a total number of 6510, which decreased significantly for the specimens of group 7, with a pore count of 3739. However, in the case of considering the pore surface area in the interquartile region, a higher pore surface area for the specimens of group 2, with a value of 45.75 µm2, was observed, which was significantly higher than specimens of group 6, with a value of 18.59 µm2. Moreover, there existed a meaningful correlation between the energy input density (considered in the current investigation) and the overall pore density. As shown in Figure 7, pore density gradually decreases from 2.15% for the specimens of group two to 0.24% for group seven, highlighting significant improvement in pore density with an increase in energy input density. However, pore density increased with a further increase in energy input density from 74.2 (for group 7) to 89.4, indicating an interquartile surface area of 19.12 for group 6. It is worth mentioning that the pore surface area was considered instead of the pore size or pore equivalent diameter, which is generally considered for reporting the pore analysis. In this way, pore analysis is more accurate irrespective of the shape of the defects and could accurately consider various types of pores, such as lack of fusion (LOF), gas pores, and keyholes. Therefore, the surface area was chosen as the characteristic parameter to enable a more precise comparison of specimens and the assessment of manufacturing defects. The shape of the pores was generally LOF for the specimens of groups two to five, while groups one, six, and seven presented a few signs of keyhole defects. In general, specimens of group seven indicated the best condition by both lower pore count and size, emphasizing the presence of an optimum energy input density for the production of almost full-density components from the novel bainitic steel under investigation. The optical micrograph of the cross-section of the as-built cubes is depicted in Figure 8, while the statistical analysis of the pore surface area for L-PBF specimens is summarized in Table 4. Finally, the analysis of transverse porosity compared to the building direction has shown similar results, with an uncertainty of 0.2%.

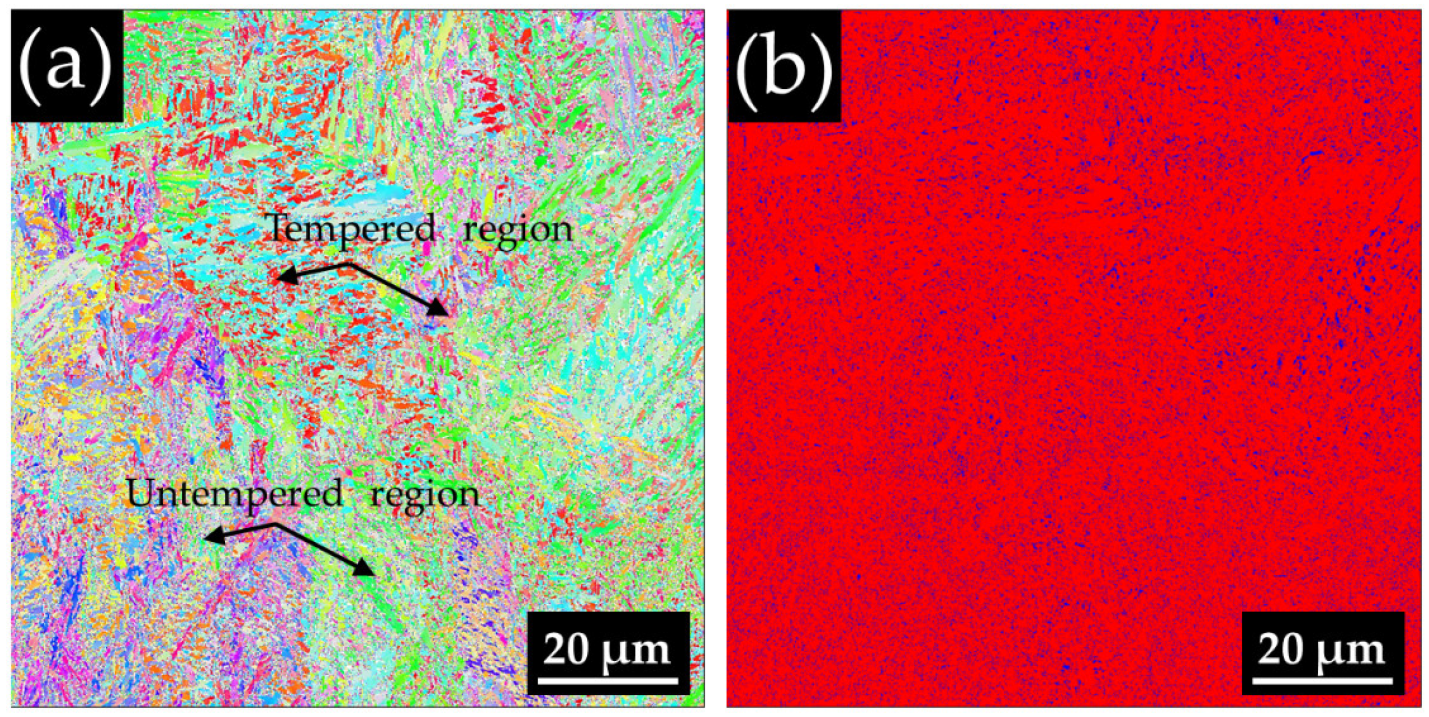
3.3. Microstructural Analysis

Microstructural analysis of the as-built samples at the cross-sectioned surface is provided in Figure 9. For the sake of simplicity, only the microstructure of sample 7 is reported herein, as it is representative of the printed specimens, and analogous considerations can be undertaken for all the fabricated specimens. Moreover, it is the one characterized by the best characteristics in terms of pore density. As depicted in Figure 5, the etched surface revealed the melt pool boundaries and the various fabricated layers. A stark contrast can be observed between the top layer of each cube and the layers below. As reported in the work from Seede et al. [23], this is a direct consequence of the heating cycles that the cubes underwent during the fabrication. Furthermore, as illustrated in Figure 9a, it can be noted that within the single layer, there is a different reaction to the etching. Indeed, there are dark and brighter regions within the single layer, which are induced by microstructural inhomogeneity.
Firstly, as shown in the magnified SEM micrograph in Figure 9, there is a discontinuous sub-structure with different levels of epitaxial growth in different regions of the microstructure. At the melt pool sides, a columnar structure was detected that extends toward the central region of the melt pool track (highlighted by red arrows), with a thickness of less than 1 µm, in agreement with [69]. The low thickness is indicative of very high solidification cooling rates that have been undergone during the build process, whereas in Figure 9, columnar grain growth stretching across the melt pool boundary was also observed.
Concerning the microstructural constituents around the melt pool boundary, a martensitic microstructure of the material can be observed in Figure 10a (displayed at higher magnification in Figure 10b), as well as an auto-tempered portion of the material (Figure 10a, magnified in Figure 10c) at the core. Moreover, both in the tempered and in the untempered zone (Figure 11a), small blocks of retained austenite can be observed, as illustrated in the phase distribution map depicted in Figure 11b. The discontinuity of the microstructural constituents is highlighted by hardness measurements performed on several fabricated layers, revealing that around the melt pool boundaries, where the microstructure is mainly martensitic, the material is harder (492 ± 7 HV0.3) with respect to the tempered regions (444 ± 6 HV0.3).
Furthermore, to better analyze the distribution of the alloying elements in the as-built L-PBF-fabricated samples, SEM-EDS was employed. The EDS elemental map, depicted in Figure 12, clearly shows the uniform distribution, which is also in correspondence with fabrication defects.

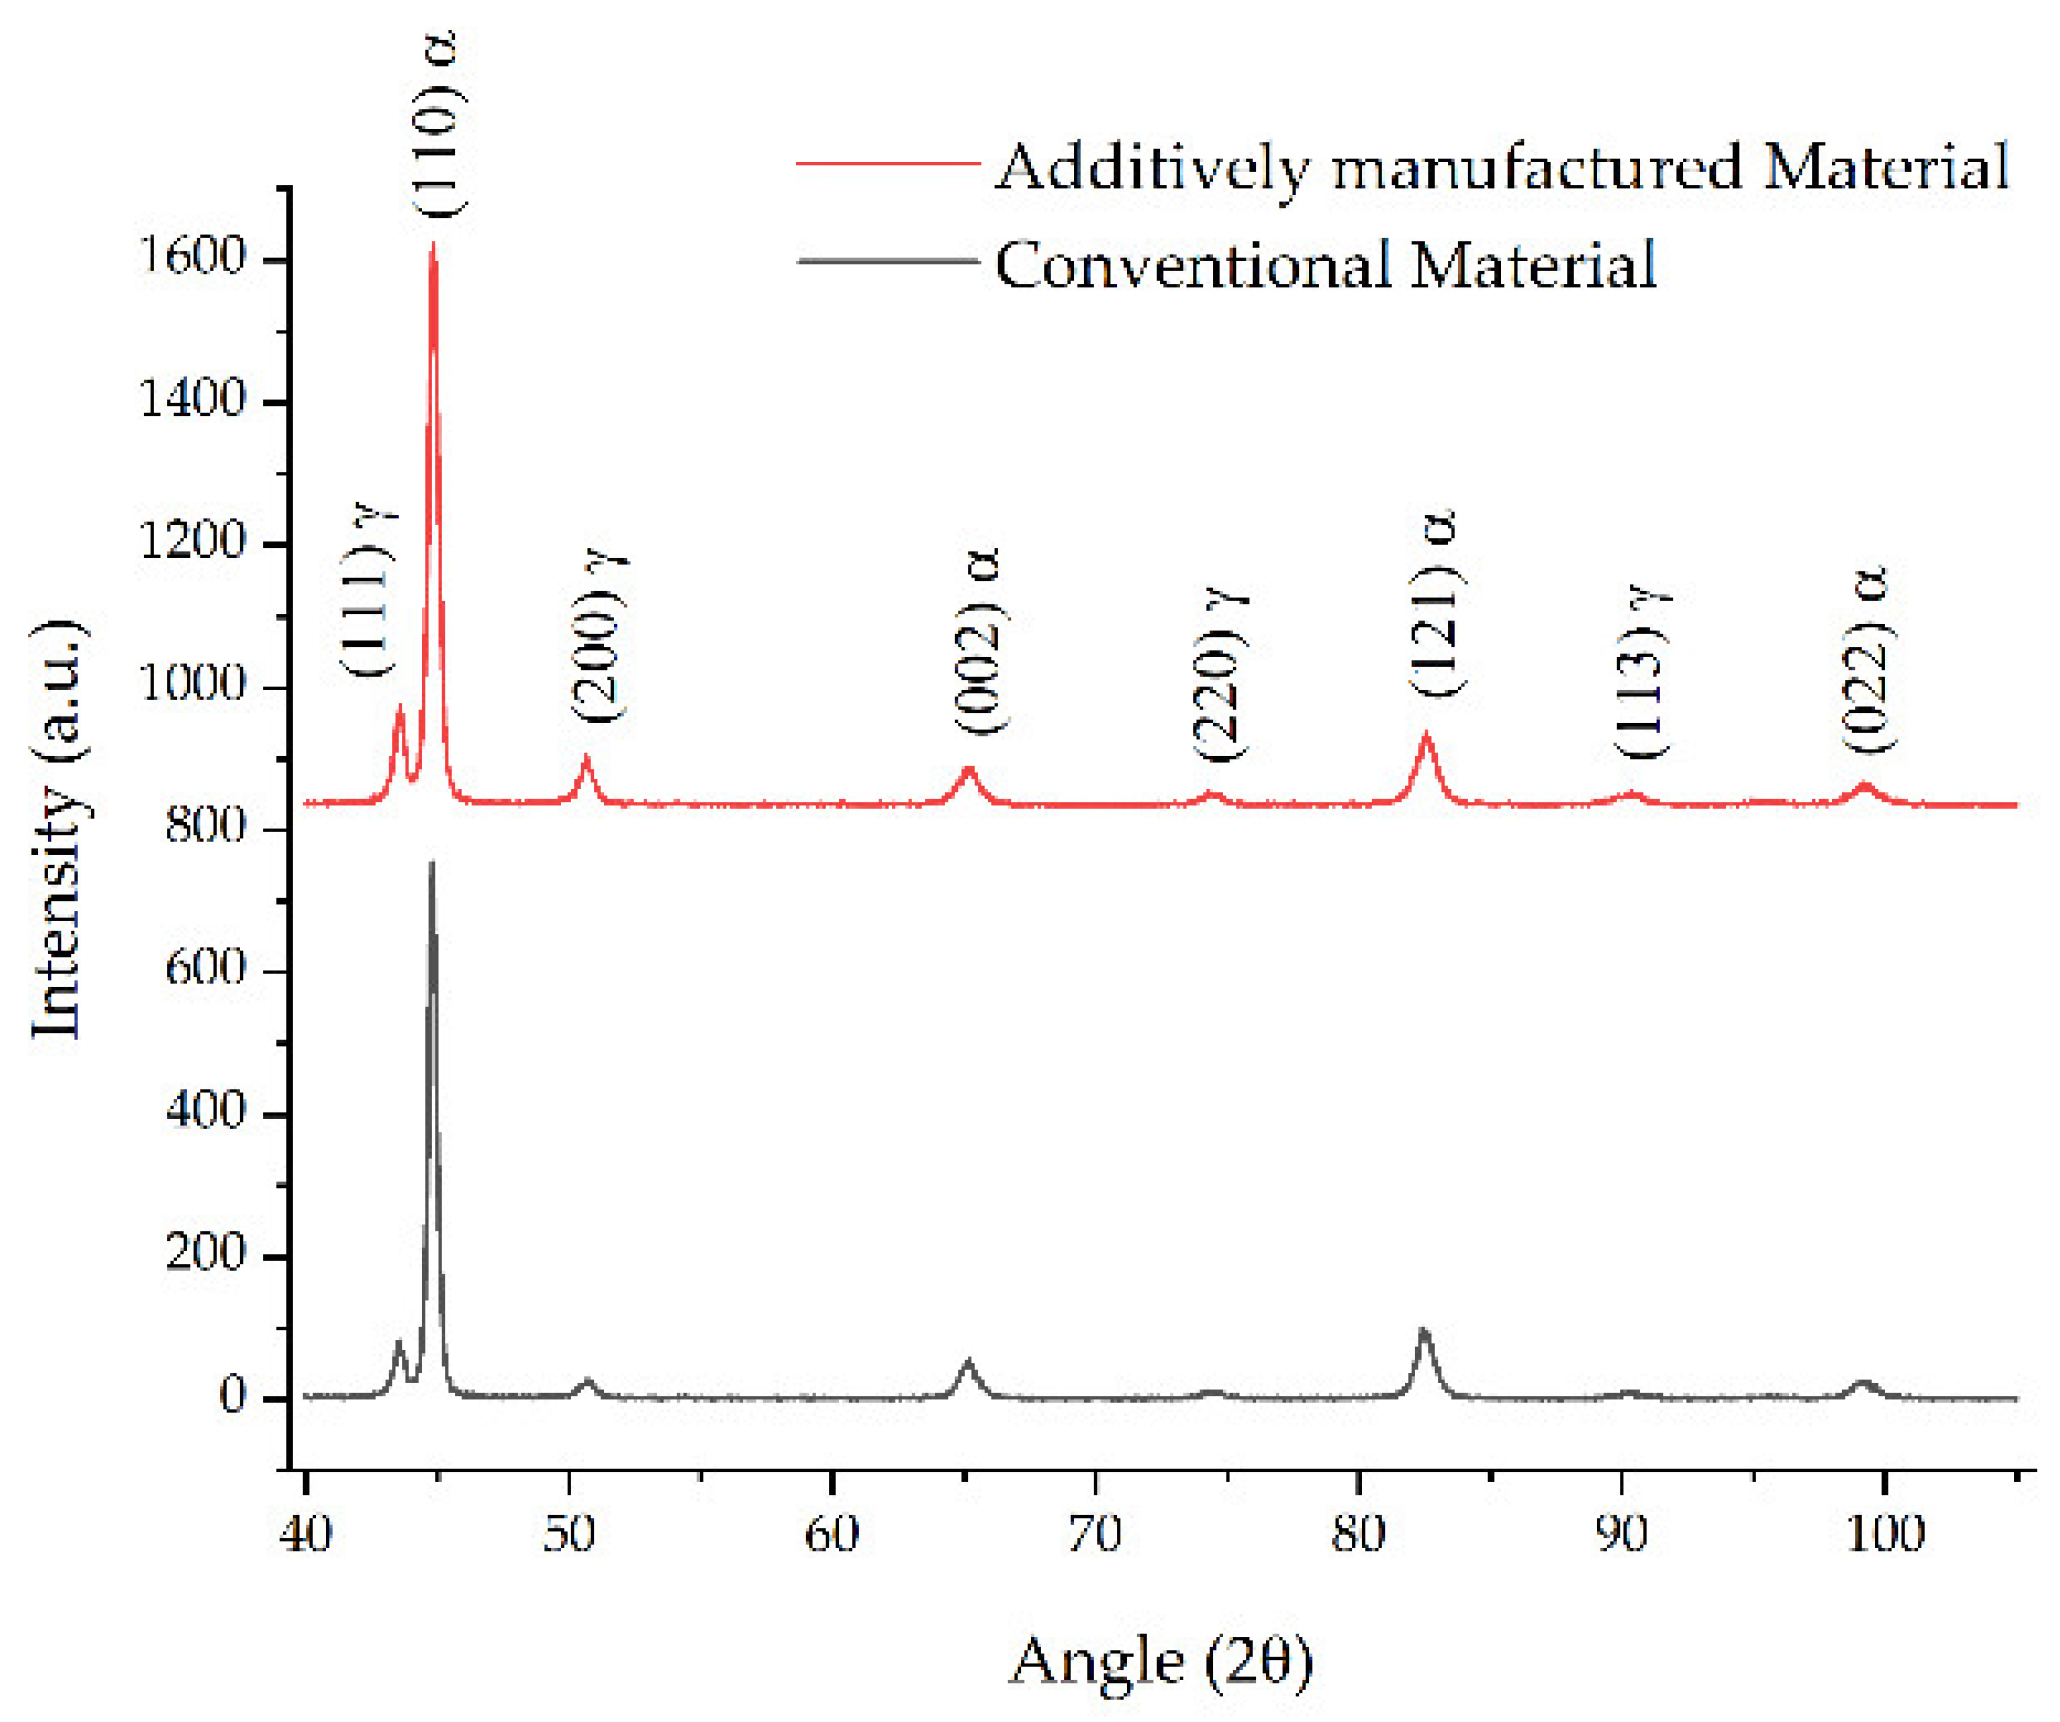
3.4. Comparative Study after Heat Treatment between Conventional Material and L-PBF-Fabricated Sample

The typical dilatometric curve time vs. relative change in length (RCL) and differential relative change in length (DRCL) recorded for the conventional and L-PBF specimen are reported in Figure 13a,b. Focusing on the time vs. RCL (Figure 13a), the curve is characterized by the typical S-shape and three different stages can be individuated. Firstly, the curves are characterized by an incubation period (highlighted in the inset in the figure), during which the transformation did not start, or the variation in the RCL is not detectable. Then, during the second stage, a rapid increase in the RCL can be observed, while bainite is forming, until the end of the transformation, where the RCL becomes constant and a plateau is reached. Moreover, in the insert in Figure 13, it can be observed that both the incubation period and total dilatation at the end of the bainitic transformation (0.38 and 0.51, respectively) are lower in the L-PBF-fabricated sample with respect to the conventional sample.
In Figure 13b, the typical time vs. DRCL, showing a conventional bell shape, is depicted. Being a reflection of the RCL [70], the curve indicated that after the incubation time, the transformation rate increases, reaching a maximum value, then decreases to 0 when the transformation is almost completed, suggesting that the transformation becomes more sluggish as the volume fraction of the formed bainite increases. From the curve, it can be observed that the kinetic and the peak time transformation rates [71] are smaller in the case of the L-PBF-fabricated specimens in comparison with the conventional material (558 and 1100 s, respectively). Furthermore, from the application of the approach developed by San-Martin and co-authors [70], for the evaluation of the end of the transformation of the DRCL curve, considering a FW@M, with @ = 1/20, it was found that the end of the transformation is reached after 2376 s in the case of additively manufactured material and after 3530 s in the case of the conventional bulk material.
In Figure 14 and Figure 15, both SEM TEM micrographs depicting the microstructure of the bulk and L-PBF-fabricated samples are reported. Starting from the bulk material, after austempering, it exhibits a carbide free-bainitic microstructure consisting of bainitic ferrite and carbon-enriched retained austenite, with both a film (γf) and blocky (γb) morphology. Similarly, the additive-manufactured samples exhibit similar microstructures. However, it is possible to observe a few differences in the microstructure despite identical microstructural constituents. From the micrograph, it is possible to observe that sheaves in the L-PBF samples appeared shorter compared with the conventional bulk material. In the case of the conventional bulk material, the thickness is 83 ± 39 nm, while in the additive-manufactured specimens, the plate thickness is 60 ± 15 nm; moreover, the length of the sheaves is significantly lower, with more impingement. Regarding the austenite morphology, in the conventional material, larger blocks also appeared, located between different sheaves and at the grain boundaries; in the case of L-PBF samples, they appear smaller. Furthermore, from TEM observations (Figure 15b), high dislocation forests in bainitic ferrite were observed in additive manufacturing specimens in comparison with the conventional material.
However, the major differences in the microstructure were observed at the prior melt pool boundaries. As displayed in the SEM micrograph in Figure 16, there is a bimodal distribution of bainitic ferrite with thick ferritic plates that modifies the overall phase balance. Results of the XRD analysis are reported in Figure 17 and Table 5. As shown by the Rietveld refinement, both for the conventionally fabricated material and the L-PBF-fabricated, the microstructure consists of bainitic ferrite and carbon-enriched retained austenite. In particular, regarding the conventional material, the presented carbon content is at an average value, considering both the filmy morphology and block morphology; in fact, during refinement, the two populations were not distinguished in this work. Concerning bainitic ferrite, Rietveld refinement showed tetragonality and carbon supersaturation, which is in agreement with Caballero et al. [72].

4. Discussion

4.1. General Aspects and Challenges

From the process parameter optimization performed in the current investigation, it could be stated that the possibility of reaching full-density components from the novel bainitic alloy developed by the authors is straightforward, with comparable mechanical and microstructural characteristics to those of the conventional counterpart. It must be emphasized that the process parameter window for obtaining high densities without cracking and other defects is quite narrow for the material under investigation. Generally, residual stresses are generated in L-PBF components resulting from extreme thermal gradients within melt pools, leading to the formation of large quantities of thermal expansion and shrinkage and non-uniform plastic deformation between adjacent melt pools [73,74,75]). The shrinkage occurring during the solidification of each melting pool is restrained by the adjacent solidified melt pools and successive fabricated layers. In general, with an increase in laser power or the reduction of the scan speed, the amount of shrinkage substantially increases, leading to the formation of cracks, delamination, and distortion of the part [73,75]. However, the density and probability of cracking during the L-PBF process are more dependent on laser power as a result of a stronger temperature profile, which is reported to be more sensitive to laser power rather than scan speed [76]. Thus, a sharper temperature gradient caused by higher laser power might consequently lead to higher thermal gradients, leading to higher residual stress magnitudes, thereby increasing the risk of crack formation. However, in the process window chosen for the current investigation, cracks were observed in the case of mild laser powers with low scan speeds, which are in line with the previous investigations. The most conspicuous conclusion to emerge from the experimental results is the possibility of obtaining almost full-density L-PBF components from bainitic steels with low defects overall.

4.2. As-Built Microstructure

The last deposited layer in the as-built microstructure consists of the martensite due to the high cooling rates achieved during the L-PBF process, which is in the order of 106–107 °C/s [77]. On the other hand, moving from a melt pool core toward the bottom of the cross-section parallel to the building direction, variations in the microstructural constituents can also be observed, evidenced by the different coloring achieved due to the etching. The explanation for such inhomogeneity observed within the single layer lies in the layer-by-layer fabrication process involved in the laser bed fusion process. Firstly, once the n layer is deposited, the developed microstructure after solidification is austenite, which, upon rapid cooling to room temperature, transforms into martensite. Moreover, since the martensite finish temperature of the steel is higher than room temperature (~150 °C), it ensures the complete transformation of γ to α’ in the melt pool region of the deposit. In agreement with the findings of Dilip et al. [62] or the result reported by Seede and co-authors [23], the material deposition during LPBF is comparable to a welding process in which every n + 1 deposited layer affects the microstructure of the previously deposited one. Indeed, the deposition of a new layer of the melt pool boundary is exposed to a large amount of energy, which leads to a significant increase in temperature, which results in material austenitization. After the deposition, this newly austenitized layer will again transform into martensite. On the other hand, further away from the boundary, they will reach lower temperatures below Ac3 or even below Ac1, resulting in different degrees of layer auto-tempering, which is supported by the detected hardness gradient, as reported in [69].
The presence of a significant amount of retained austenite at the melt core can be ascribed to local mechanical stabilization phenomena [16] and the high cooling rates that hinder the transformation of the parent phase (austenite), which is the product of the solidification into martensite upon cooling. Displacive transformations involve the coordinated movement of atoms, but this coordination cannot be maintained in the presence of robust defects like grain boundaries [16]. Consequently, martensite plates formed through this mechanism are unable to traverse austenite grain boundaries, resulting in the possibility of detecting the columnar grain boundaries, which are the prior austenite grains in this particular case. In addition, this high number of boundaries and smaller defects like isolated dislocations impede the progress of these transformations but can often integrate into the martensite lattice. However, significant deformation of austenite and stresses, in this case, derived from the LPBF process before its transformation, obstructs martensite growth, leading to a decrease in transformation fraction despite a higher density of nucleation sites. In addition, in the heat-affected zone by the deposition of a subsequent layer, where reheating occurs, as reports Deb et al. [78], the material may also achieve partial austenitization, and carbon partitioning may occur, leading to the chemical stabilization of austenite, increasing the retainable volume fraction. On the other hand, it must be considered that during the L-PBF process, decarburization can also occur. Zhao et al. [79] reported that, at elevated temperatures, carbon is more active than iron with the oxygen present in the atmosphere and in the powders. Thus, carbon tends to react with oxygen, forming CO and creating a carbon-depleted zone at the melt pool boundaries. Unfortunately, it was not possible to clearly identify which phenomenon makes the larger contribution because it was not possible to measure the carbon content at that scale with the techniques adopted in this research.

4.3. Response of the L-PBF-Fabricated and the Conventional Alloys to Austempering Treatments

To elucidate the possibility and the characteristics of obtaining a bainitic microstructure from the AM-fabricated material, a comparison with the conventional bulk material after heat treatment was performed.
From the analysis of the dilatometric curves and SEM investigation, it could be stated that the conventional and the L-PBF cases exhibited different responses to the heat treatments. On the one hand, for the L-PBF, the transformation kinetic is faster, the incubation time is lower, and the transformation reaches completion in a shorter period. On the other hand, after austempering heat treatment, both bulk and additively manufactured specimens exhibited, as expected, a carbide-free bainitic microstructure with bainitic ferrite and carbon-enriched austenite. However, a finer microstructure was observed in the former.
These differences could be ascribed to the influence of the prior microstructure, in particular, a difference in the prior austenite grain size and in the strength of undercooled austenite, which influences bainite growth and the ratio between the nucleation at the grain boundaries and the autocatalytic, being bainitic transformation displacive in nature. Since the microstructure of the L-PBF-fabricated material has a microstructure with a hierarchical nature [80], the density of dislocations and the low-angle boundary are very large in comparison with conventional material [81]. In addition, as reported by Li et al. [81], in a situation where the number of low grain boundaries is high, the austenitization process is accelerated, and smaller prior austenite grains (PAG) are formed, as demonstrated by thermal etching. As a consequence of smaller PAGB, as reported by Hu et al. [82], the bainitic reaction is accelerated. In addition, the higher austenite yield strength, deriving from the smaller grain boundaries combined with the higher dislocation density, as shown previously in TEM micrographs (Figure 12), which acts as nucleation sites for bainitic ferrite, and the plate thickness is considerably lower in the case of the AM sample.
Furthermore, as reported by Chakraborty et al. [83], due to the nanometric thickness of the plates of the bainitic ferrite in the L-PBF samples, populated by tangles of dislocations, the glide of linear defects is restricted, obstructing plastic deformation, leading to a possible improvement in the strength level. Caballero and Garcia-Mateo [21] reported, in fact, that the outstanding properties of nanostructured bainite are related to the properties of bainitic ferrite; that is, in the dominant phase, the lower the thickness and the higher the dislocation density, the higher the yield strength offered by the material. Furthermore, as established by Langford and Cohen [84,85,86,87], there is a linear relationship describing the effect of bainitic ferrite plate thickness (L, μm), σ = 115 L , enhancing the importance of the investigation of the steel grades produced not only by an appropriate alloy design but also with AM methods.
Moreover, the large dislocation density, especially in the L-PBF specimens, plays an important role in the carbon distribution and the carbide precipitation since TEM observations and XRD measurements, both on conventional and L-PBF specimens, failed to detect cementite particles. On the one hand, it is well known that silicon prevents its precipitation due to its lower solubility in cementite [88,89]; on the other hand, as reported by Caballero and Garcia-Mateo [84], carbon is trapped at the crystal defects, preventing the precipitation. The absence of cementite particles dispersed in the bainitic ferrite matrix affects the material toughness and the response to the impact loads in a very significant way; indeed, it is well known from Caballero et al. [90] that cementite depletes the toughness because it is brittle and exhibits a high tendency to crack under impact loading and the dislocation pile-up. Finally, it is remarkable that this carbon distribution contributes positively to material strengthening since the strengthening due to carbon in solid solutions varies with the square root of the weight fraction [84].
Furthermore, even though there is a difference in the final dilatation of the specimens between the conventional and the L-PBF, this does not represent a variation in the volume fraction of bainitic ferrite formed, as the XRD analysis confirmed, but is derived from the impact of the prior austenite grains. The volume fraction of bainite is not dependent on the PAG size because it is controlled by the T0 curve and the chemical driving force of the bainitic transformation that depends on the isothermal transformation temperature [16].
On the subject of the non-homogeneous bainitic microstructure in the L-PBF case, the explanation can be found as a combination of two possible competitive phenomena. First is the coalescence of bainite, which is similar to the case of welding [91,92,93,94]. Bhadeshia and co-authors [91,92,93,94] demonstrated and evidenced the possibility that bainitic plates sharing the same crystallographic orientation can coalesce at the early stage of the transformation when strong impingement is not occurring. On the other hand, such morphology of bainite can be correlated with the decarburization process during the layer deposition described before. However, the latter hypothesis requires further investigation. In addition, regions with bainite morphology different from those of conventional materials may contribute to different performances in terms of mechanical properties, as reported by Bhadeshia [95]. Furthermore, Rietveld’s refinement of the acquired XRD pattern can contribute to the explanation of the microstructural observation. In particular, the lower carbon enrichment in retained austenite may derive from the local decarburization that occurred in the specimens during the additive manufacturing fabrication.
In the end, as deduced from the review by Morales-Rivas et al. [20], L-PBF fabrication of bainitic steels may therefore represent an opportunity for the production of nanostructured steels with ultra-high strength combined with high ductility without the use of expensive alloying elements or complex thermomechanical treatments.

5. Conclusions

This paper investigated the fabrication of a novel medium-carbon carbide-free bainitic steel employing laser powder bed fusion. The effect of process parameters, e.g., laser power and scan speed, on the density and the as-built microstructure was studied. Moreover, the response and the effect of austempering treatments on the microstructure of the L-PBF-fabricated specimen were studied and compared with the conventionally fabricated material. The main conclusions of the current study can be summarized as follows:
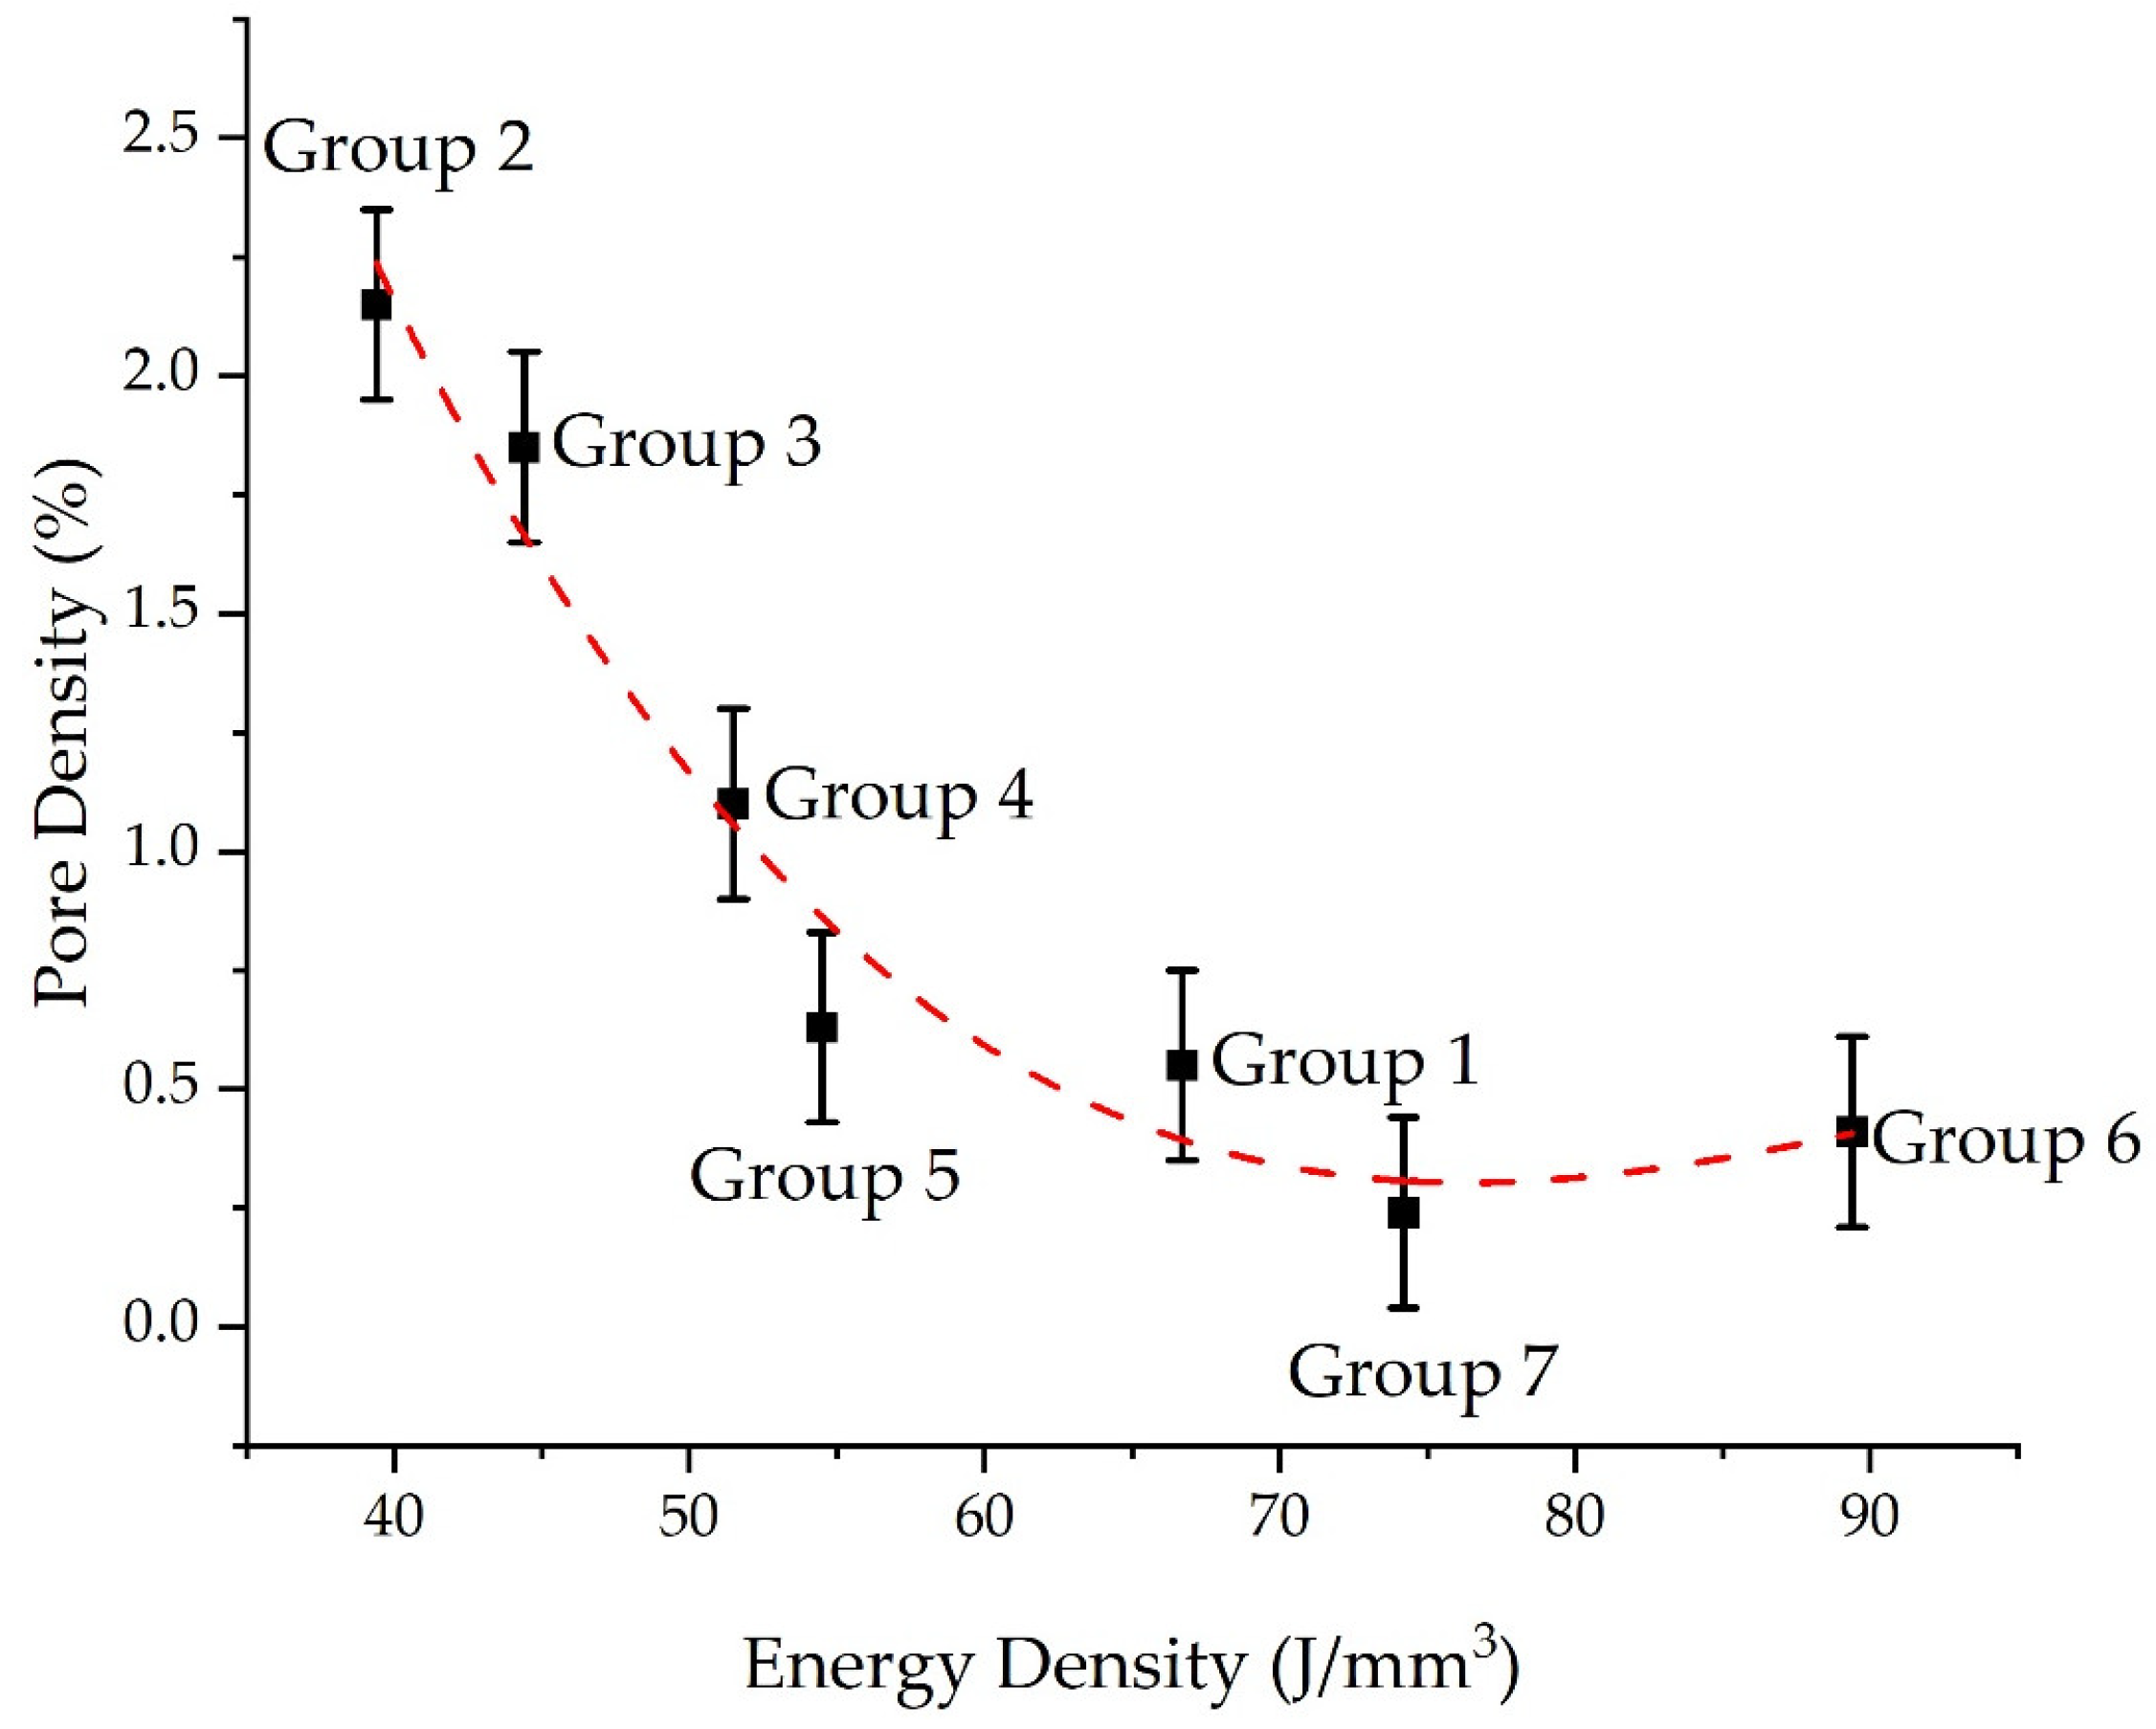
  • The pore density decreases as the energy density input decreases;
  • L-PBF-fabricated samples exhibited a carbide-free bainitic microstructure with fine bainitic ferrite plates in comparison with the conventionally fabricated material due to the finer prior austenite grains generated as a consequence of the L-PBF process;
  • L-PBF-fabricated samples showed a faster transformation kinetic of the bainitic transformation due to acceleration provided by the finer prior austenite grain size.

Author Contributions

Conceptualization, M.F., M.D. and L.P.; methodology, A.Y. and M.F.; software, A.Y. and D.L.; validation, L.P. and M.D.; formal analysis, M.F. and A.Y.; investigation, M.F., A.Y. and D.L.; resources, M.D.; data curation, M.F. and A.Y.; writing—original draft preparation, M.F. and A.Y.; writing—review and editing, M.F., A.Y., L.P. and M.D.; visualization, M.F.; supervision, M.D. and L.P.; project administration, M.D.; funding acquisition, M.D. All authors have read and agreed to the published version of the manuscript.

Funding

The research was conducted within the frame of the “Progetto di grande rilevanza Italia–Russia”, “Investigation on 3D-printing of Advanced High Strength Steels with TRIP effect for realization of self adapting aerospace structural elements”, financed by the Ministero degli Affari Esteri e della Cooperazione Internazionale MAECI.

Data Availability Statement

The raw data with the findings of this article cannot be shared since there is ongoing research on this topic.

Conflicts of Interest

The authors declare no conflicts of interest.

References

  1. Sing, S.L.; Yeong, W.Y. Laser Powder Bed Fusion for Metal Additive Manufacturing: Perspectives on Recent Developments. Virtual Phys. Prototyp. 2020, 15, 359–370. [Google Scholar] [CrossRef]
  2. Ouyang, Z.; Yang, L.; Pi, Z.; Wang, Z.; Yan, C.; Shi, Y. Robot-Assisted Laser Additive Manufacturing for High-Strength/Low-Porosity Continuous Fiber-Reinforced Thermoplastic Composites. Compos. Sci. Technol. 2024, 247, 110397. [Google Scholar] [CrossRef]
  3. Merz, B.; Nilsson, R.; Garske, C.; Hilgenberg, K. Camera-Based High Precision Position Detection for Hybrid Additive Manufacturing with Laser Powder Bed Fusion. Int. J. Adv. Manuf. Technol. 2023, 125, 2409–2424. [Google Scholar] [CrossRef]
  4. Gisario, A.; Kazarian, M.; Martina, F.; Mehrpouya, M. Metal Additive Manufacturing in the Commercial Aviation Industry: A Review. J. Manuf. Syst. 2019, 53, 124–149. [Google Scholar] [CrossRef]
  5. DebRoy, T.; Wei, H.L.; Zuback, J.S.; Mukherjee, T.; Elmer, J.W.; Milewski, J.O.; Beese, A.M.; Wilson-Heid, A.; De, A.; Zhang, W. Additive Manufacturing of Metallic Components—Process, Structure and Properties. Prog. Mater. Sci. 2018, 92, 112–224. [Google Scholar] [CrossRef]
  6. Khademzadeh, S.; Carmignato, S.; Parvin, N.; Zanini, F.; Bariani, P.F. Micro Porosity Analysis in Additive Manufactured NiTi Parts Using Micro Computed Tomography and Electron Microscopy. Mater. Des. 2016, 90, 745–752. [Google Scholar] [CrossRef]
  7. Khademzadeh, S.; Gennari, C.; Zanovello, A.; Franceschi, M.; Campagnolo, A.; Brunelli, K. Development of Micro-Laser Powder Bed Fusion for Precision Additive Manufacturing of Inconel 718. Materials 2022, 15, 5231. [Google Scholar] [CrossRef]
  8. King, W.E.; Anderson, A.T.; Ferencz, R.M.; Hodge, N.E.; Kamath, C.; Khairallah, S.A.; Rubenchik, A.M. Laser Powder Bed Fusion Additive Manufacturing of Metals; Physics, Computational, and Materials Challenges. Appl. Phys. Rev. 2015, 2, 041304. [Google Scholar] [CrossRef]
  9. Yazdanpanah, A.; Franceschi, M.; Revilla, R.I.; Khademzadeh, S.; De Graeve, I.; Dabalà, M. Revealing the Stress Corrosion Cracking Mechanism and Superior Electrochemical Behaviour of Alloy 718 Prepared by Laser Powder Bed Fusion Assessed by Microcapillary Method. Corros. Sci. 2022, 208, 110642. [Google Scholar] [CrossRef]
  10. Yazdanpanah, A.; Franceschi, M.; Rebesan, P.; Dabalà, M. Correlation of Lack of Fusion Pores with Stress Corrosion Cracking Susceptibility of L-PBF 316L: Effect of Surface Residual Stresses. Materials 2022, 15, 7151. [Google Scholar] [CrossRef]
  11. Bian, L.; Shamsaei, N.; Usher, J.M. Laser-Based Additive Manufacturing of Metal Parts: Modeling, Optimization, and Control of Mechanical Properties; CRC Press: Boca Raton, FL, USA, 2018; ISBN 9781498739986. [Google Scholar]
  12. Sun, J.; Yang, Y.; Wang, D. Parametric Optimization of Selective Laser Melting for Forming Ti6Al4V Samples by Taguchi Method. Opt. Laser Technol. 2013, 49, 118–124. [Google Scholar] [CrossRef]
  13. Song, B.; Zhao, X.; Li, S.; Han, C.; Wei, Q.; Wen, S.; Liu, J.; Shi, Y. Differences in Microstructure and Properties between Selective Laser Melting and Traditional Manufacturing for Fabrication of Metal Parts: A Review. Front. Mech. Eng. 2015, 10, 111–125. [Google Scholar] [CrossRef]
  14. Lopez Taborda, L.L.; Maury, H.; Pacheco, J. Design for Additive Manufacturing: A Comprehensive Review of the Tendencies and Limitations of Methodologies. Rapid Prototyp. J. 2021, 27, 918–966. [Google Scholar] [CrossRef]
  15. Thomas, D.S.; Gilbert, S.W. Costs and Cost Effectiveness of Additive Manufacturing: A Literature Review and Discussion; NIST: Gaithersburg, MD, USA, 2014; pp. 1–96. [Google Scholar]
  16. Bhadeshia, H.K.D.H. Bainite in Steels: Theory and Practice; Maney Publishing: London, UK, 2006; Volume 19, ISBN 9781909662742. [Google Scholar]
  17. Caballero, F.G.; Bhadeshia, H.K.D.H.; Mawella, K.J.A.; Jones, D.G.; Brown, P. Very Strong Low Temperature Bainite. Mater. Sci. Technol. 2002, 18, 279–284. [Google Scholar] [CrossRef]
  18. Garcia-Mateo, C.; Bhadeshia, H.K.D.H. Nucleation Theory for High-Carbon Bainite. Mater. Sci. Eng. A 2004, 378, 289–292. [Google Scholar] [CrossRef]
  19. Morales-Rivas, L.; Yen, H.W.; Huang, B.M.; Kuntz, M.; Caballero, F.G.; Yang, J.R.; Garcia-Mateo, C. Tensile Response of Two Nanoscale Bainite Composite-Like Structures. Jom 2015, 67, 2223–2235. [Google Scholar] [CrossRef]
  20. Morales-Rivas, L.; Garcia-Mateo, C.; Sourmail, T.; Kuntz, M.; Rementeria, R.; Caballero, F.G. Ductility of Nanostructured Bainite. Metals 2016, 6, 302. [Google Scholar] [CrossRef]
  21. Garcia-Mateo, C.; Caballero, F.G.; Sourmail, T.; Kuntz, M.; Cornide, J.; Smanio, V.; Elvira, R. Tensile Behaviour of a Nanocrystalline Bainitic Steel Containing 3 wt% Silicon. Mater. Sci. Eng. A 2012, 549, 185–192. [Google Scholar] [CrossRef]
  22. Avishan, B.; Yazdani, S.; Caballero, F.G.; Wang, T.S.; Garcia-Mateo, C. Characterisation of Microstructure and Mechanical Properties in Two Different Nanostructured Bainitic Steels. Mater. Sci. Technol. 2015, 31, 1508–1520. [Google Scholar] [CrossRef]
  23. Seede, R.; Shoukr, D.; Zhang, B.; Whitt, A.; Gibbons, S.; Flater, P.; Elwany, A.; Arroyave, R.; Karaman, I. An Ultra-High Strength Martensitic Steel Fabricated Using Selective Laser Melting Additive Manufacturing: Densification, Microstructure, and Mechanical Properties. Acta Mater. 2020, 186, 199–214. [Google Scholar] [CrossRef]
  24. Franceschi, M.; Miotti Bettanini, A.; Pezzato, L.; Dabalà, M.; Jacques, P.J. Effect of Multi-Step Austempering Treatment on the Microstructure and Mechanical Properties of a High Silicon. Metals 2021, 11, 2055. [Google Scholar] [CrossRef]
  25. Franceschi, M.; Pezzato, L.; Settimi, A.G.A.G.; Gennari, C.; Pigato, M.; Polyakova, M.; Konstantinov, D.; Brunelli, K.; Dabalà, M.; Dabal, M. Effect of Different Austempering Heat Treatments on Corrosion Properties of High Silicon Steel. Materials 2021, 14, 288. [Google Scholar] [CrossRef]
  26. Franceschi, M.; Pezzato, L.; Gennari, C.; Fabrizi, A.; Polyakova, M.; Konstantinov, D.; Brunelli, K.; Dabalà, M.; Dabal, M. Effect of Intercritical Annealing and Austempering on the Microstructure and Mechanical Properties of a High Silicon Manganese Steel. Metals 2020, 10, 448. [Google Scholar] [CrossRef]
  27. Franceschi, M.; Soffritti, C.; Fortini, A.; Pezzato, L.; Garagnani, G.L.; Dabalà, M. Evaluation of Wear Resistance of a Novel Carbide-Free Bainitic Steel. Tribol. Int. 2023, 178, 108071. [Google Scholar] [CrossRef]
  28. Franceschi, M.; Bertolini, R.; Fabrizi, A.; Dabalà, M.; Pezzato, L. Effect of Ausforming Temperature on Bainite Morphology in a 3.2% Si Carbide-Free Bainitic Steel. Mater. Sci. Eng. A 2023, 864, 144553. [Google Scholar] [CrossRef]
  29. Zhang, F.; Yang, Z. Development of and Perspective on High-Performance Nanostructured Bainitic Bearing Steel. Engineering 2019, 5, 319–328. [Google Scholar] [CrossRef]
  30. Putatunda, S.K. Fracture Toughness of a High Carbon and High Silicon Steel. Mater. Sci. Eng. A 2001, 297, 31–43. [Google Scholar] [CrossRef]
  31. Królicka, A.; Żak, A.M.; Caballero, F.G. Enhancing Technological Prospect of Nanostructured Bainitic Steels by the Control of Thermal Stability of Austenite. Mater. Des. 2021, 211, 110143. [Google Scholar] [CrossRef]
  32. Efremenko, V.G.; Hesse, O.; Friedrich, T.; Kunert, M.; Brykov, M.N.; Shimizu, K.; Zurnadzhy, V.I.; Šuchmann, P. Two-Body Abrasion Resistance of High-Carbon High-Silicon Steel: Metastable Austenite vs Nanostructured Bainite. Wear 2019, 418–419, 24–35. [Google Scholar] [CrossRef]
  33. Eres-Castellanos, A.; Morales-Rivas, L.; Latz, A.; Caballero, F.G.; Garcia-Mateo, C. Effect of Ausforming on the Anisotropy of Low Temperature Bainitic Transformation. Mater. Charact. 2018, 145, 371–380. [Google Scholar] [CrossRef]
  34. Eres-Castellanos, A.; Caballero, F.G.; Garcia-Mateo, C. Stress or Strain Induced Martensitic and Bainitic Transformations during Ausforming Processes. Acta Mater. 2020, 189, 60–72. [Google Scholar] [CrossRef]
  35. Eres-Castellanos, A.; Hidalgo, J.; Morales-Rivas, L.; Caballero, F.G.; Garcia-Mateo, C. The Role of Plastic Strains on Variant Selection in Ausformed Bainitic Microstructures Studied by Finite Elements and Crystal Plasticity Simulations. J. Mater. Res. Technol. 2021, 13, 1416–1430. [Google Scholar] [CrossRef]
  36. Garcia-Mateo, C.; Eres-Castellanos, A.; Somani, M.; Porter, D.; Latz, A.; Lieven, B.; Caballero, F.G. Developing Nanostructured Bainite by Means of Ausforming. In Proceedings of the THERMEC 2018, Paris, France, 9–13 July 2018. [Google Scholar]
  37. Lan, H.; Du, L.; Zhou, N.; Liu, X. Effect of Austempering Route on Microstructural Characterization of Nanobainitic Steel. Acta Metall. Sin. Engl. Lett. 2014, 27, 19–26. [Google Scholar] [CrossRef]
  38. Kempen, K.; Yasa, E.; Thijs, L.; Kruth, J.P.; Van Humbeeck, J. Microstructure and Mechanical Properties of Selective Laser Melted 18Ni-300 Steel. Phys. Procedia 2011, 12, 255–263. [Google Scholar] [CrossRef]
  39. Campanelli, S.L.; Contuzzi, N.; Ludovico, A.D. Manufacturing of 18 Ni Marage 300 Steel Samples by Selective Laser Melting. Adv. Mater. Res. 2010, 83–86, 850–857. [Google Scholar] [CrossRef]
  40. Santana, A.; Eres-Castellanos, A.; Jimenez, J.A.; Rementeria, R.; Capdevila, C.; Caballero, F.G. Effect of Layer Thickness and Laser Emission Mode on the Microstructure of an Additive Manufactured Maraging Steel. J. Mater. Res. Technol. 2023, 25, 6898–6912. [Google Scholar] [CrossRef]
  41. Karlapudy, S.P.; Nancharaiah, T.; Subba Rao, V.V. Influence of Post-Heat Treatment on Microstructure, Texture, and Mechanical Properties of 18Ni-300 Maraging Steel Fabricated by Using LPBF Technique. Prog. Addit. Manuf. 2023, 1–16. [Google Scholar] [CrossRef]
  42. Casalino, G.; Campanelli, S.L.; Contuzzi, N.; Ludovico, A.D. Experimental Investigation and Statistical Optimisation of the Selective Laser Melting Process of a Maraging Steel. Opt. Laser Technol. 2015, 65, 151–158. [Google Scholar] [CrossRef]
  43. Lemke, J.N.; Simonelli, M.; Garibaldi, M.; Ashcroft, I.; Hague, R.; Vedani, M.; Wildman, R.; Tuck, C. Calorimetric Study and Microstructure Analysis of the Order-Disorder Phase Transformation in Silicon Steel Built by SLM. J. Alloys Compd. 2017, 722, 293–301. [Google Scholar] [CrossRef]
  44. Garibaldi, M.; Ashcroft, I.; Simonelli, M.; Hague, R. Metallurgy of High-Silicon Steel Parts Produced Using Selective Laser Melting. Acta Mater. 2016, 110, 207–216. [Google Scholar] [CrossRef]
  45. Wu, B.; Pan, Z.; Ding, D.; Cuiuri, D.; Li, H.; Xu, J.; Norrish, J. A Review of the Wire Arc Additive Manufacturing of Metals: Properties, Defects and Quality Improvement. J. Manuf. Process. 2018, 35, 127–139. [Google Scholar] [CrossRef]
  46. Ron, T.; Levy, G.K.; Dolev, O.; Leon, A.; Shirizly, A.; Aghion, E. Environmental Behavior of Low Carbon Steel Produced by a Wire Arc Additive Manufacturing Process. Metals 2019, 9, 888. [Google Scholar] [CrossRef]
  47. Nagasai, B.P.; Malarvizhi, S.; Balasubramanian, V. Mechanical Properties of Wire Arc Additive Manufactured Carbon Steel Cylindrical Component Made by Gas Metal Arc Welding Process. J. Mech. Behav. Mater. 2021, 30, 188–198. [Google Scholar] [CrossRef]
  48. Guo, Y.; Li, Z.; Yao, C.; Zhang, K.; Lu, F.; Feng, K.; Huang, J.; Wang, M.; Wu, Y. Microstructure Evolution of Fe-Based Nanostructured Bainite Coating by Laser Cladding. Mater. Des. 2014, 63, 100–108. [Google Scholar] [CrossRef]
  49. Guo, Y.; Feng, K.; Lu, F.; Zhang, K.; Li, Z.; Hosseini, S.R.E.; Wang, M. Effects of Isothermal Heat Treatment on Nanostructured Bainite Morphology and Microstructures in Laser Cladded Coatings. Appl. Surf. Sci. 2015, 357, 309–316. [Google Scholar] [CrossRef]
  50. Jiang, Y.L.; Fang, J.X.; Ma, G.Z.; Tian, H.L.; Zhang, D.B.; Cao, Y. Microstructure and Properties of an As-Deposited and Post Treated High Strength Carbide-Free Bainite Steel Fabricated via Laser Powder Deposition. Mater. Sci. Eng. A 2021, 824, 141791. [Google Scholar] [CrossRef]
  51. Martina, F.; Ding, J.; Williams, S.; Caballero, A.; Pardal, G.; Quintino, L. Tandem Metal Inert Gas Process for High Productivity Wire Arc Additive Manufacturing in Stainless Steel. Addit. Manuf. 2019, 25, 545–550. [Google Scholar] [CrossRef]
  52. Wanwan, J.; Chaoqun, Z.; Shuoya, J.; Yingtao, T.; Daniel, W.; Wen, L. Wire Arc Additive Manufacturing of Stainless Steels: A Review. Appl. Sci. 2020, 10, 1563. [Google Scholar]
  53. Su, A.; Aldalur, E.; Veiga, F.; Artaza, T. Wire Arc Additive Manufacturing of an Aeronautic Fitting with Different Metal Alloys: From the Design to the Part. J. Manuf. Process. 2021, 64, 188–197. [Google Scholar]
  54. Bhadeshia, H.K.D.H.; Honeycombe, R.W.K. Steels and Properties; Butterworths-Heinemann: Oxford, UK, 2017; ISBN 9780081002704. [Google Scholar]
  55. Mueller, I.; Rementeria, R.; Caballero, F.G.; Kuntz, M.; Sourmail, T.; Kerscher, E. A Constitutive Relationship between Fatigue Limit and Microstructure in Nanostructured Bainitic Steels. Materials 2016, 9, 831. [Google Scholar] [CrossRef]
  56. Garcia-Mateo, C.; Caballero, F.G.; Sourmail, T.; Smanio, V.; De Andres, C.G. Industrialised Nanocrystalline Bainitic Steels. Design Approach. Int. J. Mater. Res. 2014, 105, 725–734. [Google Scholar] [CrossRef]
  57. Fonstein, N. Advanced High Strength Sheet Steels: Physical Metallurgy, Design, Processing, and Properties; Springer: Cham, Switzerland, 2015; ISBN 9783319191652. [Google Scholar]
  58. Fonstein, N.; Jun, H.J.; Huang, G.; Sriram, S.; Yan, B. Effect of Bainite on Mechanical Properties of Multiphase Ferrite-Bainite-Martensite Steels. Mater. Sci. Technol. 2011, 1, 634–641. [Google Scholar]
  59. Saunders, N.; Guo, Z.; Li, X.; Miodownik, A.P.; Schillé, J.P. Using JMatPro to Model Materials Properties and Behavior. Jom 2003, 55, 60–65. [Google Scholar] [CrossRef]
  60. Yazdanpanah, A.; Revilla, R.I.; Franceschi, M.; Fabrizi, A.; Khademzadeh, S.; Khodabakhshi, M.; De Graeve, I.; Dabalà, M. Unveiling the Impact of Laser Power Variations on Microstructure, Corrosion, and Stress-Assisted Surface Crack Initiation in Laser Powder Bed Fusion-Processed Ni-Fe-Cr Alloy 718. Electrochim. Acta 2024, 476, 143723. [Google Scholar] [CrossRef]
  61. Schneider, C.A.; Rasband, W.S.; Eliceiri, K.W. NIH Image to ImageJ: 25 Years of Image Analysis. Nat. Methods 2012, 9, 671–675. [Google Scholar] [CrossRef]
  62. Corporation, O. Origin(Pro), Version 2023b; OriginLab Corporation: Northampton, MA, USA, 2022. [Google Scholar]
  63. Voort, V. Metallography Principles and Practice; McGrawHill: New York, NY, USA, 1999; ISBN 9780871706720. [Google Scholar]
  64. Lutterotti, L. Maud: A Rietveld Analysis Program Designed for the Internet and Experiment Integration. Acta Crystallogr. Sect. A Found. Crystallogr. 2000, 56, s54. [Google Scholar] [CrossRef]
  65. Cheng, L.; Bottger, A.; Keijser, D.T.H.; Mittemeijer, E.J. Lattice Parameters of Iron-Carbon and Iron-Nitrogen Martensites and Austenites. Scr. Metall. Mater. 1990, 24, 509–514. [Google Scholar] [CrossRef]
  66. Garcia-Mateo, C.; Jimenez, J.A.; Lopez-Ezquerra, B.; Rementeria, R.; Morales-Rivas, L.; Kuntz, M.; Caballero, F.G. Analyzing the Scale of the Bainitic Ferrite Plates by XRD, SEM and TEM. Mater. Charact. 2016, 122, 83–89. [Google Scholar] [CrossRef]
  67. Kotzem, D.; Arold, T.; Niendorf, T.; Walther, F. Influence of Specimen Position on the Build Platform on the Mechanical Properties of As-Built Direct Aged Electron Beam Melted Inconel 718 Alloy. Mater. Sci. Eng. A 2020, 772, 138785. [Google Scholar] [CrossRef]
  68. Chua, K.H.G.; Choong, Y.Y.C.; Wong, C.H. Investigation of the Effects on the Print Location during Selective Laser Melting Process. Proc. Int. Conf. Prog. Addit. Manuf. 2018, 2018, 613–618. [Google Scholar] [CrossRef]
  69. Dilip, J.J.S.; Ram, G.D.J.; Starr, T.L.; Stucker, B. Selective Laser Melting of HY100 Steel: Process Parameters, Microstructure and Mechanical Properties. Addit. Manuf. 2017, 13, 49–60. [Google Scholar] [CrossRef]
  70. San-Martin, D.; Kuntz, M.; Caballero, F.G.; Garcia-Mateo, C. A New Systematic Approach Based on Dilatometric Analysis to Track Bainite Transformation Kinetics and the Influence of the Prior Austenite Grain Size. Metals 2021, 11, 324. [Google Scholar] [CrossRef]
  71. Xu, Y.; Xu, G.; Mao, X.; Zhao, G.; Bao, S. Method to Evaluate the Kinetics of Bainite Transformation in Low-Temperature Nanobainitic Steel Using Thermal Dilatation Curve Analysis. Metals 2017, 7, 330. [Google Scholar] [CrossRef]
  72. Caballero, F.G.; Miller, M.K.; Garcia-Mateo, C. Carbon Supersaturation of Ferrite in a Nanocrystalline Bainitic Steel. Acta Mater. 2010, 58, 2338–2343. [Google Scholar] [CrossRef]
  73. Kruth, J.-P.; Deckers, J.; Yasa, E.; Wauthlé, R. Assessing and Comparing Influencing Factors of Residual Stresses in Selective Laser Melting Using a Novel Analysis Method. Proc. Inst. Mech. Eng. Part B J. Eng. Manuf. 2012, 226, 980–991. [Google Scholar] [CrossRef]
  74. Gu, D.D.; Meiners, W.; Wissenbach, K.; Poprawe, R. Laser Additive Manufacturing of Metallic Components: Materials, Processes and Mechanisms. Int. Mater. Rev. 2012, 57, 133–164. [Google Scholar] [CrossRef]
  75. Mercelis, P.; Kruth, J.P. Residual Stresses in Selective Laser Sintering and Selective Laser Melting. Rapid Prototyp. J. 2006, 12, 254–265. [Google Scholar] [CrossRef]
  76. Harrison, N.J.; Todd, I.; Mumtaz, K. Reduction of Micro-Cracking in Nickel Superalloys Processed by Selective Laser Melting: A Fundamental Alloy Design Approach. Acta Mater. 2015, 94, 59–68. [Google Scholar] [CrossRef]
  77. Hyer, H.; Zhou, L.; Mehta, A.; Park, S.; Huynh, T.; Song, S.; Bai, Y.; Cho, K.; McWilliams, B.; Sohn, Y. Composition-Dependent Solidification Cracking of Aluminum-Silicon Alloys during Laser Powder Bed Fusion. Acta Mater. 2021, 208, 116698. [Google Scholar] [CrossRef]
  78. Deb, P.; Challenger, K.D.; Therrien, A.E. Structure-Property Correlation of Submerged-Arc and Gas-Metal-Arc Weldments in HY-100 Steel. Metall. Trans. A 1991, 18, 987–999. [Google Scholar] [CrossRef]
  79. Zhao, X.; Song, B.; Zhang, Y.; Zhu, X.; Wei, Q.; Shi, Y. Decarburization of Stainless Steel during Selective Laser Melting and Its Influence on Young’s Modulus, Hardness and Tensile Strength. Mater. Sci. Eng. A 2015, 647, 58–61. [Google Scholar] [CrossRef]
  80. Bajaj, P.; Hariharan, A.; Kini, A.; Kürnsteiner, P.; Raabe, D.; Jägle, E.A. Steels in Additive Manufacturing: A Review of Their Microstructure and Properties. Mater. Sci. Eng. A 2020, 772, 138633. [Google Scholar] [CrossRef]
  81. Li, Z.X.; Li, C.S.; Ren, J.Y.; Li, B.Z.; Zhang, J.; Ma, Y.Q. Effect of Cold Deformation on the Microstructure and Impact Toughness during the Austenitizing Process of 1.0C–1.5Cr Bearing Steel. Mater. Sci. Eng. A 2016, 674, 262–269. [Google Scholar] [CrossRef]
  82. Hu, F.; Hodgson, P.D.; Wu, K.M. Acceleration of the Super Bainite Transformation through a Coarse Austenite Grain Size. Mater. Lett. 2014, 122, 240–243. [Google Scholar] [CrossRef]
  83. Chakraborty, J.; Chattopadhyay, P.P.; Bhattacharjee, D.; Manna, I. Microstructural Refinement of Bainite and Martensite for Enhanced Strength and Toughness in High-Carbon Low-Alloy Steel. Metall. Mater. Trans. A Phys. Metall. Mater. Sci. 2010, 41, 2871–2879. [Google Scholar] [CrossRef]
  84. Garcia-Mateo, C.; Caballero, F.G. Understanding the Mechanical Properties of Nanostructured Bainite; Wiley: Hoboken, NJ, USA, 2015; Volume 1, ISBN 9783527674947. [Google Scholar]
  85. Langford, G.; Cohen, M. Strain Hardening of Iron by Severe Plastic Deformation. ASM Trans. Quart. 1969, 62, 623–638. [Google Scholar]
  86. Langford, G. A Study of the Deformation of Patented Steel Wire. Metall. Mater. Trans. B 1970, 1, 465–477. [Google Scholar] [CrossRef]
  87. Langford, G.; Cohen, M. Calculation of Cell-Size Strengthening of Wire-Drawn Iron. Metall. Mater. Trans. 1970, 1, 1478–1480. [Google Scholar] [CrossRef]
  88. Zhao, L.; Qian, L.; Meng, J.; Zhou, Q.; Zhang, F. Below-Ms Austempering to Obtain Refined Bainitic Structure and Enhanced Mechanical Properties in Low-C High-Si/Al Steels. Scr. Mater. 2016, 112, 96–100. [Google Scholar] [CrossRef]
  89. Hou, X.Y.; Xu, Y.B.; Zhao, Y.F.; Wu, D. Microstructure and Mechanical Properties of Hot Rolled Low Silicon TRIP Steel Containing Phosphorus and Vanadium. J. Iron Steel Res. Int. 2011, 18, 40–45. [Google Scholar] [CrossRef]
  90. Caballero, F.G.; Chao, J.; Cornide, J.; García-Mateo, C.; Santofimia, M.J.; Capdevila, C. Toughness Deterioration in Advanced High Strength Bainitic Steels. Mater. Sci. Eng. A 2009, 525, 87–95. [Google Scholar] [CrossRef]
  91. Keehan, E.; Karlsson, L.; Bhadeshia, H.K.D.H.; Thuvander, M. Electron Backscattering Diffraction Study of Coalesced Bainite in High Strength Steel Weld Metals. Mater. Sci. Technol. 2008, 24, 1183–1188. [Google Scholar] [CrossRef]
  92. Keehan, E.; Karlsson, L.; Andren, H.O.; Bhadeshia, H.K.D.H. Understanding Mechanical Properties of Novel High Strength Steel Weld Metals through High-Resolution Microstructural Investigation, Proceedings of the International Conference on Trends in Welding Research, Pine Mountain, GA, USA, 16–20 May 2005; ASM International: Atlanta, GA, USA, 2005; pp. 16–20. [Google Scholar]
  93. Bhadeshia, H.K.D.H.; Keehan, E.; Karlsson, L.; Andrén, H.O. Coalesced Bainite. Trans. Indian Inst. Met. 2006, 59, 689–694. [Google Scholar]
  94. Pak, J.; Suh, D.W.; Bhadeshia, H.K.D.H. Promoting the Coalescence of Bainite Platelets. Scr. Mater. 2012, 66, 951–953. [Google Scholar] [CrossRef]
  95. Pak, J.H.; Bhadeshia, H.K.D.H.; Karlsson, L.; Keehan, E. Coalesced Bainite by Isothermal Transformation of Reheated Weld Metal. Sci. Technol. Weld. Join. 2008, 13, 593–597. [Google Scholar] [CrossRef]
Figure 1. Phase diagram simulated by means of JMatPro v7.0 software.
Metals 14 00113 g001
Figure 2. (a,b) SEM micrograph showing the morphology of the powder; (c) SEM micrograph showing the powder microstructure; (d) schematic illustration of the scanning strategy.
Metals 14 00113 g002
Figure 3. Building platform with the completed (1 to 7) and failed specimens (X) during the L-PBF fabrication process. The red cross indicates the failed specimens.
Metals 14 00113 g003
Figure 4. (a) Crack in the cross-sectioned surface initiated near the supports; (b) crack in the center of the cross-sectioned surface.
Metals 14 00113 g004
Figure 5. OM micrograph depicting the melt pool boundaries: (a) group 1; (b) group 2; (c) group 3; (d) group 4; (e) group 5; (f) group 6; (g) group 7.
Metals 14 00113 g005
Figure 6. OM micrograph showing the high-porosity zone near the surface in specimens of (a) group one and (b) group two.
Metals 14 00113 g006
Figure 7. Pore density (%) as a function of the energy density (J/mm3).
Metals 14 00113 g007
Figure 8. Optical micrographs of the polished cross-sections of the as-built cubes displaying the porosity values measured using area analysis of the images: (a) group 1; (b) group 2; (c) group 3; (d) group 4; (e) group 5; (f) group 6; (g) group 7.
Metals 14 00113 g008
Figure 9. SEM micrograph of the (a) top layer; (b) magnified microstructure of the top layer; (c) vertical cross-section in as-built condition showing the layers; (d,e) detail of columnar grain (dashed line: sub-grain boundaries; continuous line: melt pool boundary).
Metals 14 00113 g009
Figure 10. SEM micrograph showing (a) the as-built microstructure, magnification of the (b) untempered zone and (c) tempered zone, and (d) hardness measurement of tempered and untempered zones.
Metals 14 00113 g010
Figure 11. (a) EBSD inverse pole figure; (b) phase distribution map (red: BCC; blue: FCC).
Metals 14 00113 g011
Figure 12. EDX map on the as-built sample showing uniform element distribution in the samples.
Metals 14 00113 g012
Figure 13. (a) Time vs. relative change in length (RCL) during isothermal treatments for both conventional and L-PBF; (b) time vs. differential relative change in length (DRCL).
Metals 14 00113 g013
Figure 14. SEM micrograph of the heat-treated samples. (a) Conventionally fabricated; (b) L-PBF-fabricated material (αb: bainitic ferrite; γf: filmy retained austenite; γb: blocky retained austenite).
Metals 14 00113 g014
Figure 15. TEM micrographs (bright field) of the heat-treated samples. (a) Conventional material; (b) L-PBF-fabricated material (αb: bainitic ferrite; γf: filmy retained austenite; γb: blocky retained austenite). The red arrow indicates the dislocation forests, while “*” and “**” indicate the locations where the the Selected Area Diffraction Patterns were acquired.
Metals 14 00113 g015
Figure 16. Bainite morphology at prior melt pool boundary (a). Low magnification (b) and (c) high magnification of the dashed square.
Metals 14 00113 g016
Figure 17. XRD patterns acquired after austempering heat treatment on both conventionally fabricated and L-PBF-fabricated materials.
Metals 14 00113 g017
Table 1. Chemical composition of gas atomized powder (wt.%).
FeCSiMnOAlMs (Adapted from Ref. [27])Melting Temperature (°C)
Bal.0.353.172.810.020.1245 °C1440
Table 2. Process parameters for L-PBF fabrication.
Parameter GroupLP (W)SS (m/s)HS (μm)LT (μm)Energy Density (J/mm3)
12200.51106066.7
21950.751106039.4
32200.751106044.4
41700.51106051.4
52700.751106054.5
62950.51106089.4
72450.51106074.2
81700.751106022.2
92450.751106049.5
102950.751106059.6
111950.51106059.1
122700.51106081.8
Table 3. Measured mean hardness values of the L-PBF specimens. * Bulk hardness refers to the quenched state.
GroupMean [HV0.3]
1539 ± 37
2501 ± 6
3485 ± 18
4503 ± 12
5485 ± 12
6465 ± 11
7478 ± 1
Bulk *670 ± 4
Table 4. Statistical analysis of pore surface area for L-PBF specimens. SD: standard deviation; Q1: first quartile; Q3: third quartile; Q1–Q3: interquartile.
GroupMean (μm2)SD (μm2)Median (μm2)Min (μm2)Max (μm2)Q1–Q3 (μm2)
SCSCSCSCSCSC
1148.7665.811435.87448.5513.4914.980.180.04137,421.0716,543.5141.3840.33
2555.63160.963831.041162.1823.0312.580.180.04207,901.3129,988.0290.4645.75
3409.92151.453022.701246.7026.6315.610.180.04189,714.9748,625.89111.3243.85
4662.0294.765833.39532.7124.737.800.180.04412,577.2919,110.32107.5730.77
5286.9234.442410.34167.4818.425.770.180.04225,042.277328.4973.5019.47
6985.8029.857418.40105.2740.5245.720.180.04285,760.283291.84222.5118.59
7682.2529.786216.99105.1732.4196.440.180.04303,005.763632.2597.0719.12
Table 5. Result of Rietveld X-ray diffraction pattern refinement.
SampleVγ (%)C γ (wt.%)Vαb (%)Cαb (wt.%)
Conventionally fabricated material25 ± 31.22 ± 0.0475 ± 30.17 ± 0.04
L-PBF-fabricated material21 ± 31.06 ± 0.0479 ± 30.16 ± 0.04
Disclaimer/Publisher’s Note: The statements, opinions and data contained in all publications are solely those of the individual author(s) and contributor(s) and not of MDPI and/or the editor(s). MDPI and/or the editor(s) disclaim responsibility for any injury to people or property resulting from any ideas, methods, instructions or products referred to in the content.

