Article

Study on Peeling Performance of T-Type Brazing Joints Based on Energy Method

Key Laboratory of Pressure System and Safety (MOE), School of Mechanical and Power Engineering, East China University of Science and Technology, Shanghai 200237, China
*
Author to whom correspondence should be addressed.
Metals 2024, 14(1), 115; https://doi.org/10.3390/met14010115
Submission received: 22 November 2023 / Revised: 4 January 2024 / Accepted: 10 January 2024 / Published: 18 January 2024

Abstract

:
Brazing technology is widely used in modern industrial systems as an important connection method. The brazing joints are the weakest zone in the whole structure and directly determine the working efficiency and life of the entire system. However, the research on the connection mechanism and fracture behavior of brazing joints is still unclear. In this study, the peeling force and displacement curves during the peeling process are tested by using T-type specimens. Based on the cohesive zone model, the peeling energy of each part during the whole peeling process is calculated and analyzed. The results show that the whole peeling process can be divided into three stages, including the initial stage, crack propagation stage, and stable peeling stage. The peeling energy of each stage can be calculated experimentally. The larger the peeling energy, the better the joint performance. Then, a simplified calculation method for peeling energy is developed for T-type joints and is verified as accurate using experimental data. It is also observed that the increase in the base material thickness can effectively improve the peeling performance of the joints. This provides a feasible and effective method for peel strength calculation and evaluation in brazing joints.

1. Introduction

In recent years, with the establishment of sustainable production, improving energy efficiency and reducing energy consumption have become key to building an energy-saving industrial production system. In the fields of nuclear power, aerospace, shipbuilding, petrochemicals, and other high-energy-consumption fields, some core equipment often works for a long time in harsh environments, such as under high temperature and high pressure. The service life of these pieces of equipment often directly determines the working efficiency and life of the entire system [1]. Generally, these pieces of equipment often fail at the joints, which constitute the weakest zone in the whole structure. So, it is very important to study the connection and packaging technology [2].
As a common connection technology, vacuum diffusion brazing has the advantages of low welding deformation, a compact structure, and low manufacturing cost [3,4,5]. It is often used in the packaging process of some precision equipment and complex sheet structures [6]. At present, the research on improving the performance of brazing joints is mainly aimed at improving the processing technology, to improve the welding quality. Vianco [7] studied the effect of the brazing and welding processes on the interface performance and concluded that different processes will influence the synergistic diffusion and reaction mechanisms between opposing interfaces. Wang et al. [8] prepared three different series of dissimilar joints to discuss the effects of the brazing temperature, Ag50Cu content, and Mn concentration in high-entropy alloys on atomic immigration during brazing. Park et al. [9,10] performed the Taguchi method to analyze the most effective processing parameter for the tensile strength of SUS304/MBF20/SUS304 brazed joints. However, because the microstructure of brazing joints is relatively complex, the research on the connection mechanism and fracture behavior of brazing joints is still unclear.
There are many methods of testing the properties of brazing joints, such as the butt tensile test and lap tensile test. But the stress form is different between brazing joints and practical applications. M. Salmaliyan [11] carried out shear strength and microhardness tests to investigate the mechanical properties of the joints and found that the presence of eutectic and dendritic solidification increased through Ti addition. Wu et al. [12] designed a small 304 stainless steel/T2 red copper T-type brazed-joint specimen to study the brazing interface strength. The results showed that with an increase in cyclic displacement, the crack initiation life decreased, and the crack growth rate increased; Kawashima et al. [13] proposed a novel specimen by taking a section of the overall plate-fin heat exchanger. Abdolvan [14] designed a new fixture for the shear test of SAF 2507 and AISI 304 dissimilar-material brazing joints. Otto JL et al. [15] used three different nickel-based brazing filler to brazing joints of AISI 304L under vacuum and then carried out tensile tests at low and high strain rates to evaluate the strain-rate-dependent tensile strength of the brazing joints. It was found that high strain rates increased the ultimate tensile strength of all variations and shifted the other mechanical properties in the high-speed tensile tests. However, in the practical application, the failure process of brazing joints was very similar to that of adhesive joints. The standard specimen cannot accurately describe the real stress distribution. Therefore, the T-type specimen used for the peel test was designed and is closer to the actual stress form of the joint under some working conditions [16].
Generally, the peel test is one of the most common tests to evaluate adhesive joints’ performance [17,18]. Heuser et al. used in situ peel tests to study the influence of the peel angle, the alignment angle, and the bulge in the packaging process in relation to the opening behavior of the sealing packages [19]. Weidmann reviewed the existing test methods for the determination of the Mode I dominant interfacial fracture toughness of sandwich structures and found that the mandrel peel test was the most promising test method for thermoplastic sandwich structures [20]. Zhang et al. [21] used T-type joints to obtain an analytical model for fracture mechanics. Jarzabek [22] studied the influence of a weak interface between the particles and matrix on the mechanical properties of the metal matrix using ceramic-reinforced composites and draw the conclusion that the influence of a weak interface and delamination should be taken into consideration for adhesive joints. In recent years, peel tests have become more popular for use in the adhesive industry, but few researchers have used the method to test the performance of brazing joints.
In this study, the peel test has been carried out using T-type brazing joints. The peeling force and displacement curves during the peeling process have been obtained. According to the curve, the whole peeling process is divided into three stages: the initial stage, the crack propagation stage, and the stable peeling stage. The deformation of different parts in three stages are analyzed, respectively. The energy of each stage can be obtained through experimental and theoretical calculation. The theoretical calculation formula for energy is derived. By comparing the energy of each stage, the peeling performance of joints can be directly judged. Meanwhile, the study provides a feasible and effective test method for testing the strength of brazing joints and provides some basis for the size design of joints during manufacturing.

2. Peeling Test

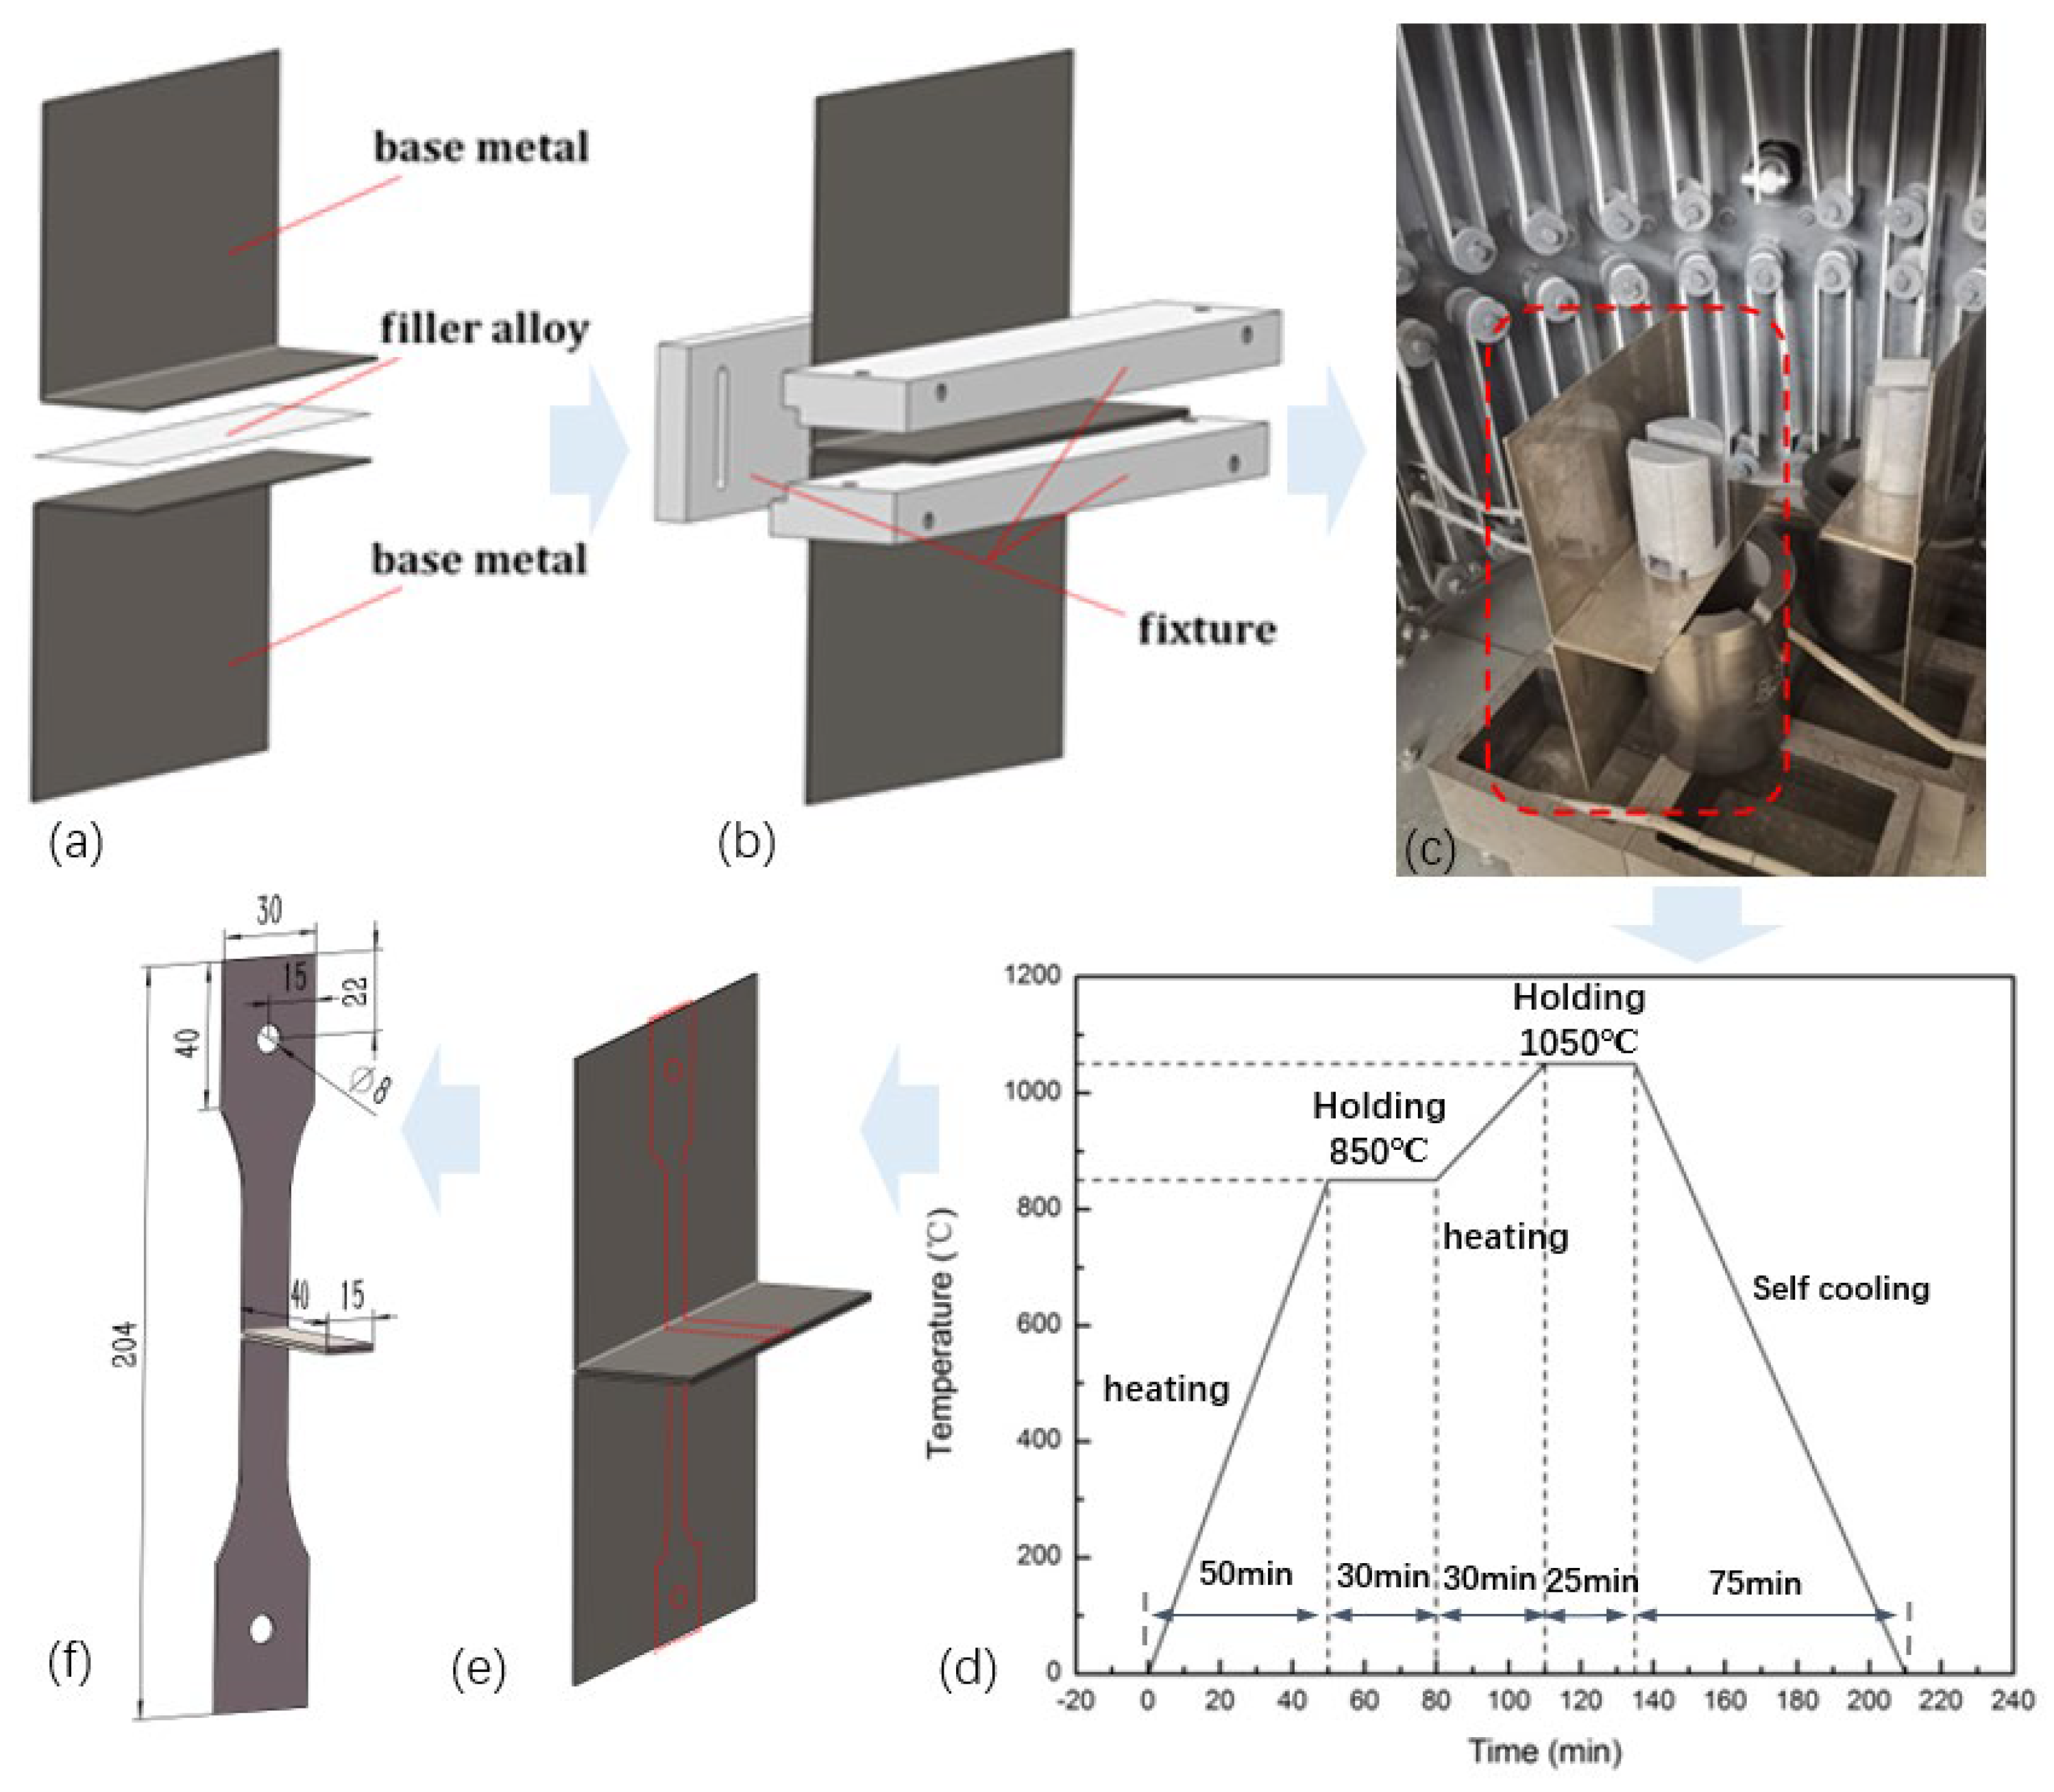
2.1. Specimen Preparation

In the previous study, according to the structural stress and failure mode of the plate-fin heat exchanger and referring to the bonding T-type peel test, the T-type brazing tensile specimen was designed [16]. The geometry dimensions of the specimen were designed according to the adhesive peel test standard ASTM D 3167-03a [23] and GB/T 2039-1997 [24], as shown in Figure 1. Considering the actual working conditions of the plate-fin structure joint, the thickness of the base metal was selected as being between 0.5 mm and 1.5 mm. For the plate-fin heat exchangers that often work under high temperature and high pressure, 316L stainless steel with high-temperature resistance was considered as the test material, and nickel-based BNi-2 solder was selected as the solder.
The T-type peeling specimen used in this study is prefabricated using the procedure shown in Figure 1. Two plates made of base metal are first bent into an L-shape (Figure 1a) and clamped along the short edge filled with brazing filler metal using a fixture (Figure 1b). According to the brazing process [25,26,27,28] shown in Figure 1d, the two plates are placed into a vacuum brazing furnace (Beijing Aerospace Jinxiang Equipment corporation, Beijing, China) (Figure 1c) and brazed together. Firstly, the brazing parts are heated to 850 °C in 50 min and kept at this temperature for about 30 min to make the temperature distribution of the whole specimen more uniform. Then, they are further heated to the brazing temperature of 1050 °C at a heating rate of 10 °C/min and kept for 25 min to complete the isothermal solidification. After the brazing process is completed, they are self-cooled in a furnace (Beijing Aerospace Jinxiang Equipment corporation, Beijing, China). Finally, the brazing parts (Figure 1e) are cut and prepared as T-type peeling specimens, as designed before (Figure 1f).

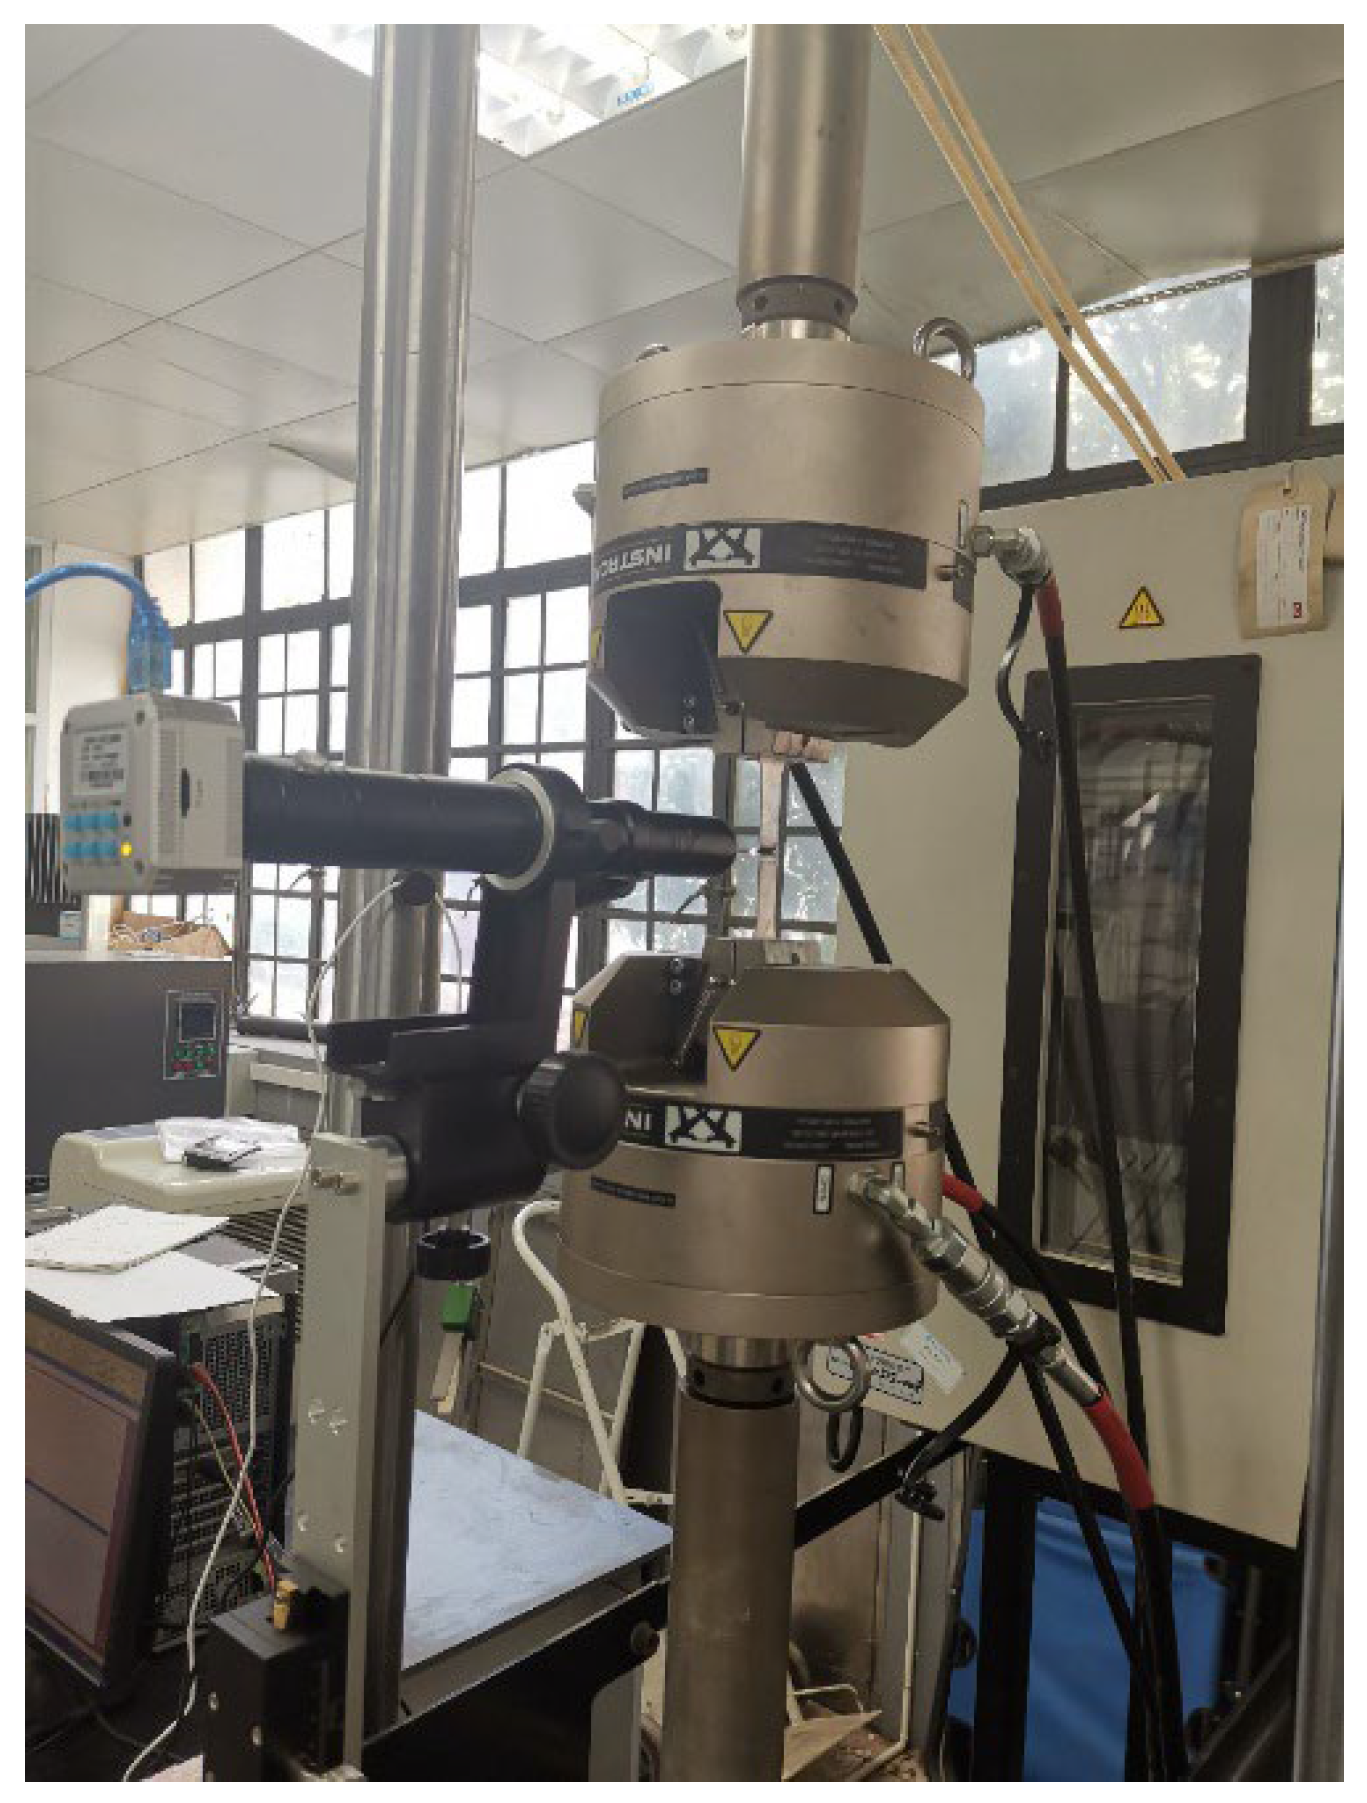
2.2. Peel Test of T-Type Brazing Joints

The test is carried out using a tensile testing machine (Instron, Norwood, MA, USA) at room temperature (Figure 2). The loading mode is rate loading at 1 mm/min. In the previous study [16], different conditions such as the thickness of the brazing seam, temperature, and loading rates were studied. The present study mainly focuses on the influence of the base metal thicknesses. The specimen geometry parameters and test conditions are shown in Table 1. To obtain accurate results, three repetitive experiments were performed under the same conditions.
When the specimen is stretched to the stable peeling stage (Figure 3), we output the peeling force and displacement curve. The results are shown in Figure 4 (The error band has been added in green).

2.3. Experimental Results

Each test was conducted three times under the same conditions to reduce the impact of randomness, and the results were basically consistent. The error band has been added in green. According to Figure 4, the curve can be divided into three parts. At the initial stage, the peeling force is linearly related to the displacement. The peeling force reaches the maximum force Pmax = 746 N when the displacement is about 0.5 mm. The damage to the brazing joints is initiated at this point. Then, the value of the force dropped rapidly, which is due to the force required for crack propagation being much smaller than that required for crack initiation. When the displacement reaches about 8.7 mm, the peeling force tends to be stable (P ≈ 351 N), which is defined as the average peeling force P. It can represent the performance for preventing crack propagation.

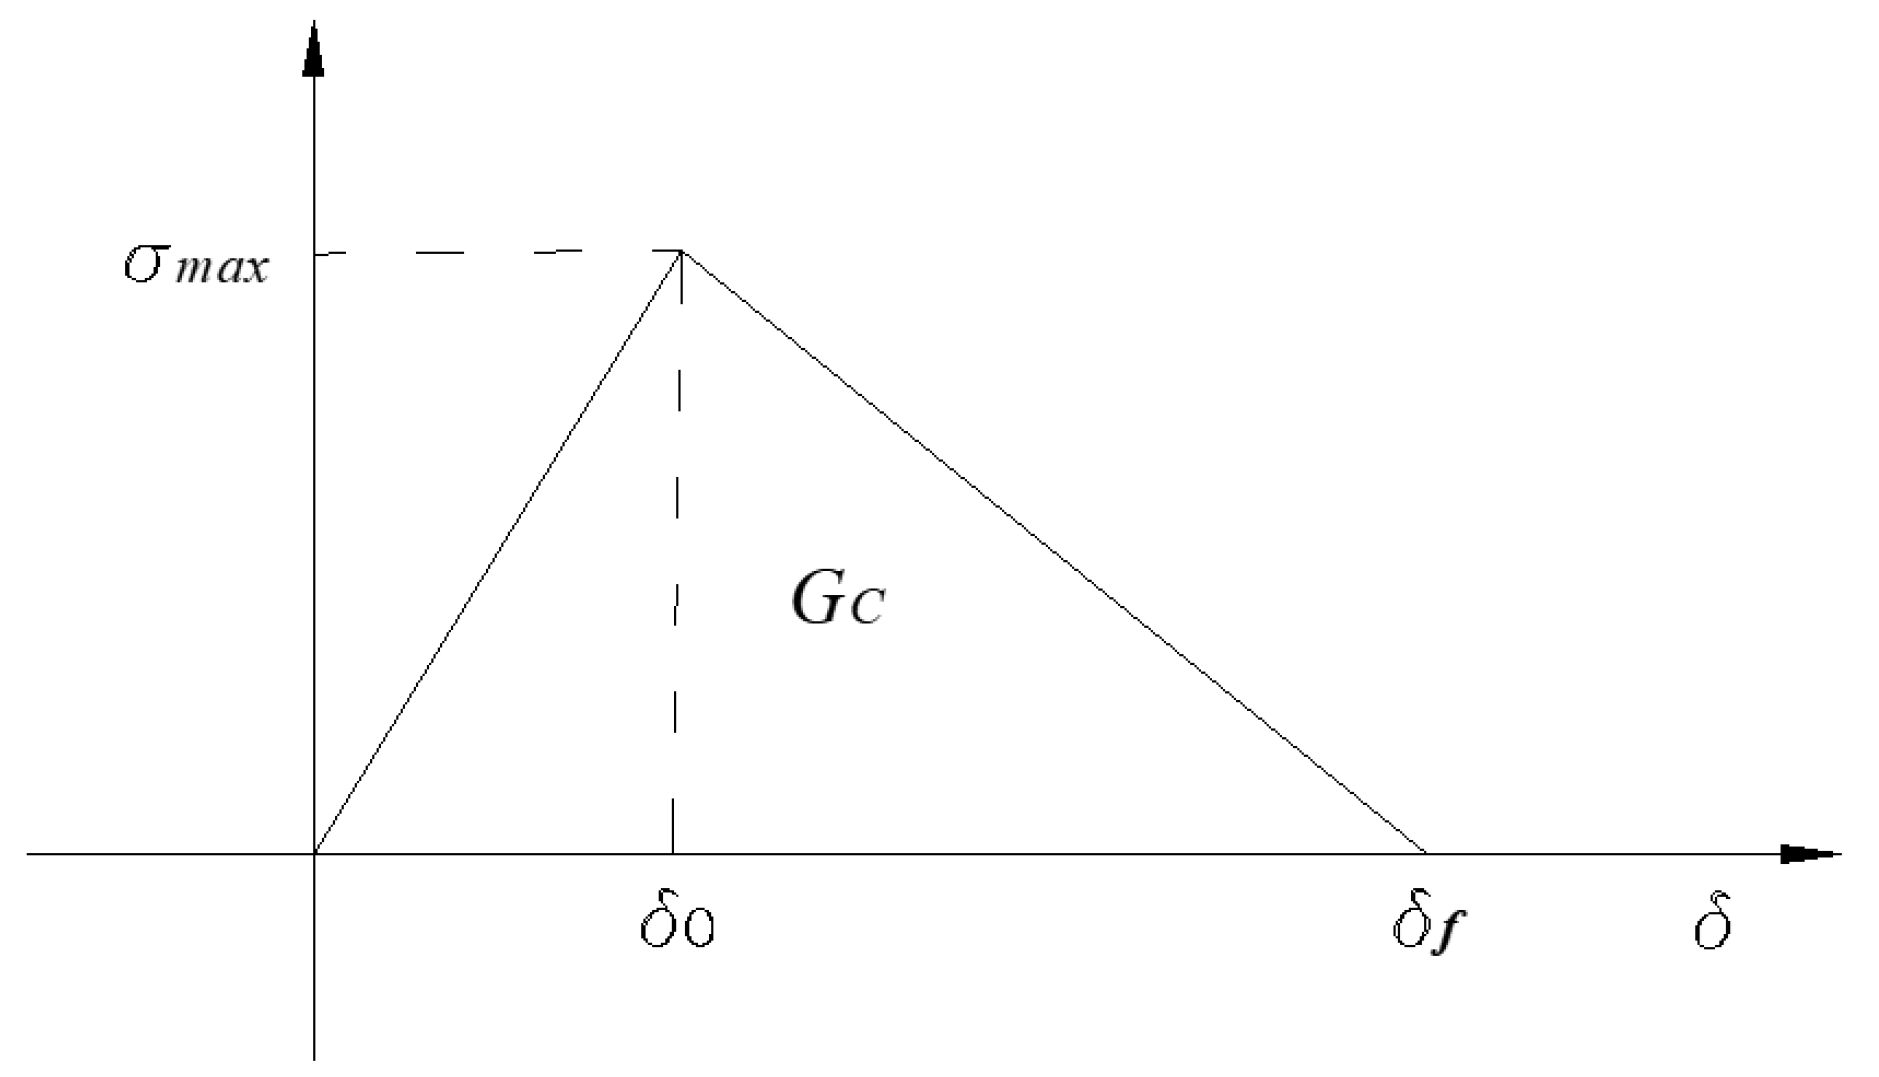
3. Critical Cohesive Energy Calculation Based on Cohesive Zone Model

To evaluate the peeling performance of brazing joints, in addition to the maximum peeling force Pmax and the average peeling force P mentioned above, there is also an important parameter, the critical cohesive energy Gc.
To calculate the critical cohesive energy Gc, we adopted the bilinear cohesion zone model for its simplicity and effectiveness [29,30,31]. The relationship between traction force and displacement is shown in Formula (1) (Figure 5).
F = σ m a x δ 0 δ               δ δ 0 σ m a x δ f δ δ f δ 0     δ > δ 0
In the model, the area surrounded by the traction–displacement curve is the cohesive energy. When the cohesive element is destroyed, the cohesive energy reaches its critical value Gc.
The total energy Gt consumed through crack propagation in the peel test can be calculated from the average peeling force (P) and the width of the base metal (b) and the peeling angle (θ):
G t = P b ( 1 c o s θ )
In the T-type peel test, θ = 180°. The total energy Gt is:
G t = 2 P b
The total energy Gt consists of the critical cohesive energy Gc and the dissipative energy Gd of the plastic bending deformation in the peeling process. The critical cohesive energy is the intrinsic parameter of the joint, which is independent of the thickness of the specimen (h) and the loading angle. When there is no plastic deformation in the peeling process, the total energy Gt is equal to the critical cohesive energy Gc. However, in most cases, the specimen will have a complex bending deformation process in the process of cracking. So, the total energy Gt includes the energy dissipated due to the plastic deformation of the specimen Gd.
It is very difficult to calculate the plastic dissipation energy because of the complex bending process of the specimen. At present, there is no standard method to obtain the plastic dissipation energy. Some scholars have tried to calculate the plastic dissipation energy with mathematical methods. Georgion and Kawashita [32,33,34] et al. obtained that the critical cohesive energy Gc can be estimated via Equation (4) under the assumption that the base metal is elastic–plastic material.
G c = h 2 G t 2 σ y h + σ y 2 h 2 E
where σy is the yield stress of the base metal, E the elastic modulus of the base metal, and Δ the length of the interface layer torn before the formation of a new crack (Figure 6).
The value of h is related to the structural size of the joint and the elastic modulus of the welding material, which can be calculated as (5):
h 4 = 1 6 1 + 2 h c h E E a
Ea is the elastic modulus of the welding material. When the thickness of the interface layer (hc) is negligible compared with the thickness of the base metal (h), Equation (5) can be simplified as:
h 4 = 1 6
Substituting Equation (6) into Equation (4), the equation to calculate the critical cohesive energy Gc can be simplified as:
G c = 1 6 4 2 G t 2 σ y h + σ y 2 h 2 E = 1 6 4 8 P 2 σ y h b 2 + σ y 2 h 2 E

4. Simplified Calculation Model of Peeling Energy

As shown in Figure 7, the peeling process can be divided into three stages. τ0τ1 is the crack initiation stage (CIS), which is relatively short. The peeling force increases rapidly with displacement until the maximum peeling force is reached, and the joint starts to crack. τ1τ2 is the crack growth stage (CGS), during which the peeling force gradually decreases with displacement. In this stage, the crack expands rapidly, and the joint produces large deformation at the corner. After τ2 is the stable peeling stage (SPS), in which the peeling force tends to be stable and no longer changes with displacement, and the crack extends stably.

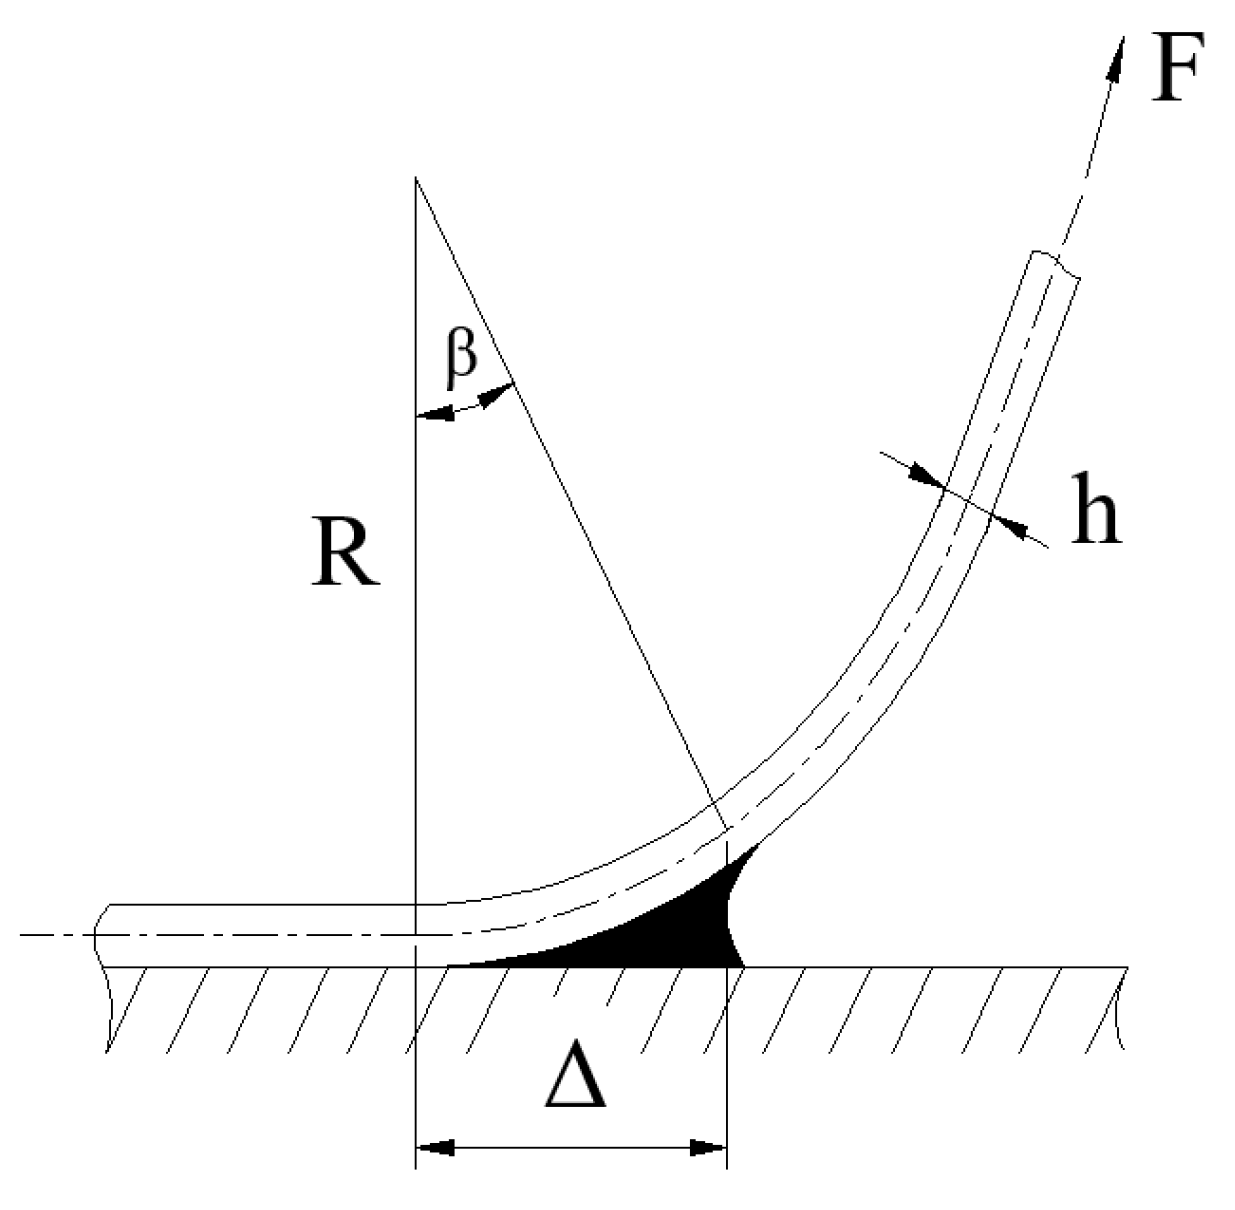
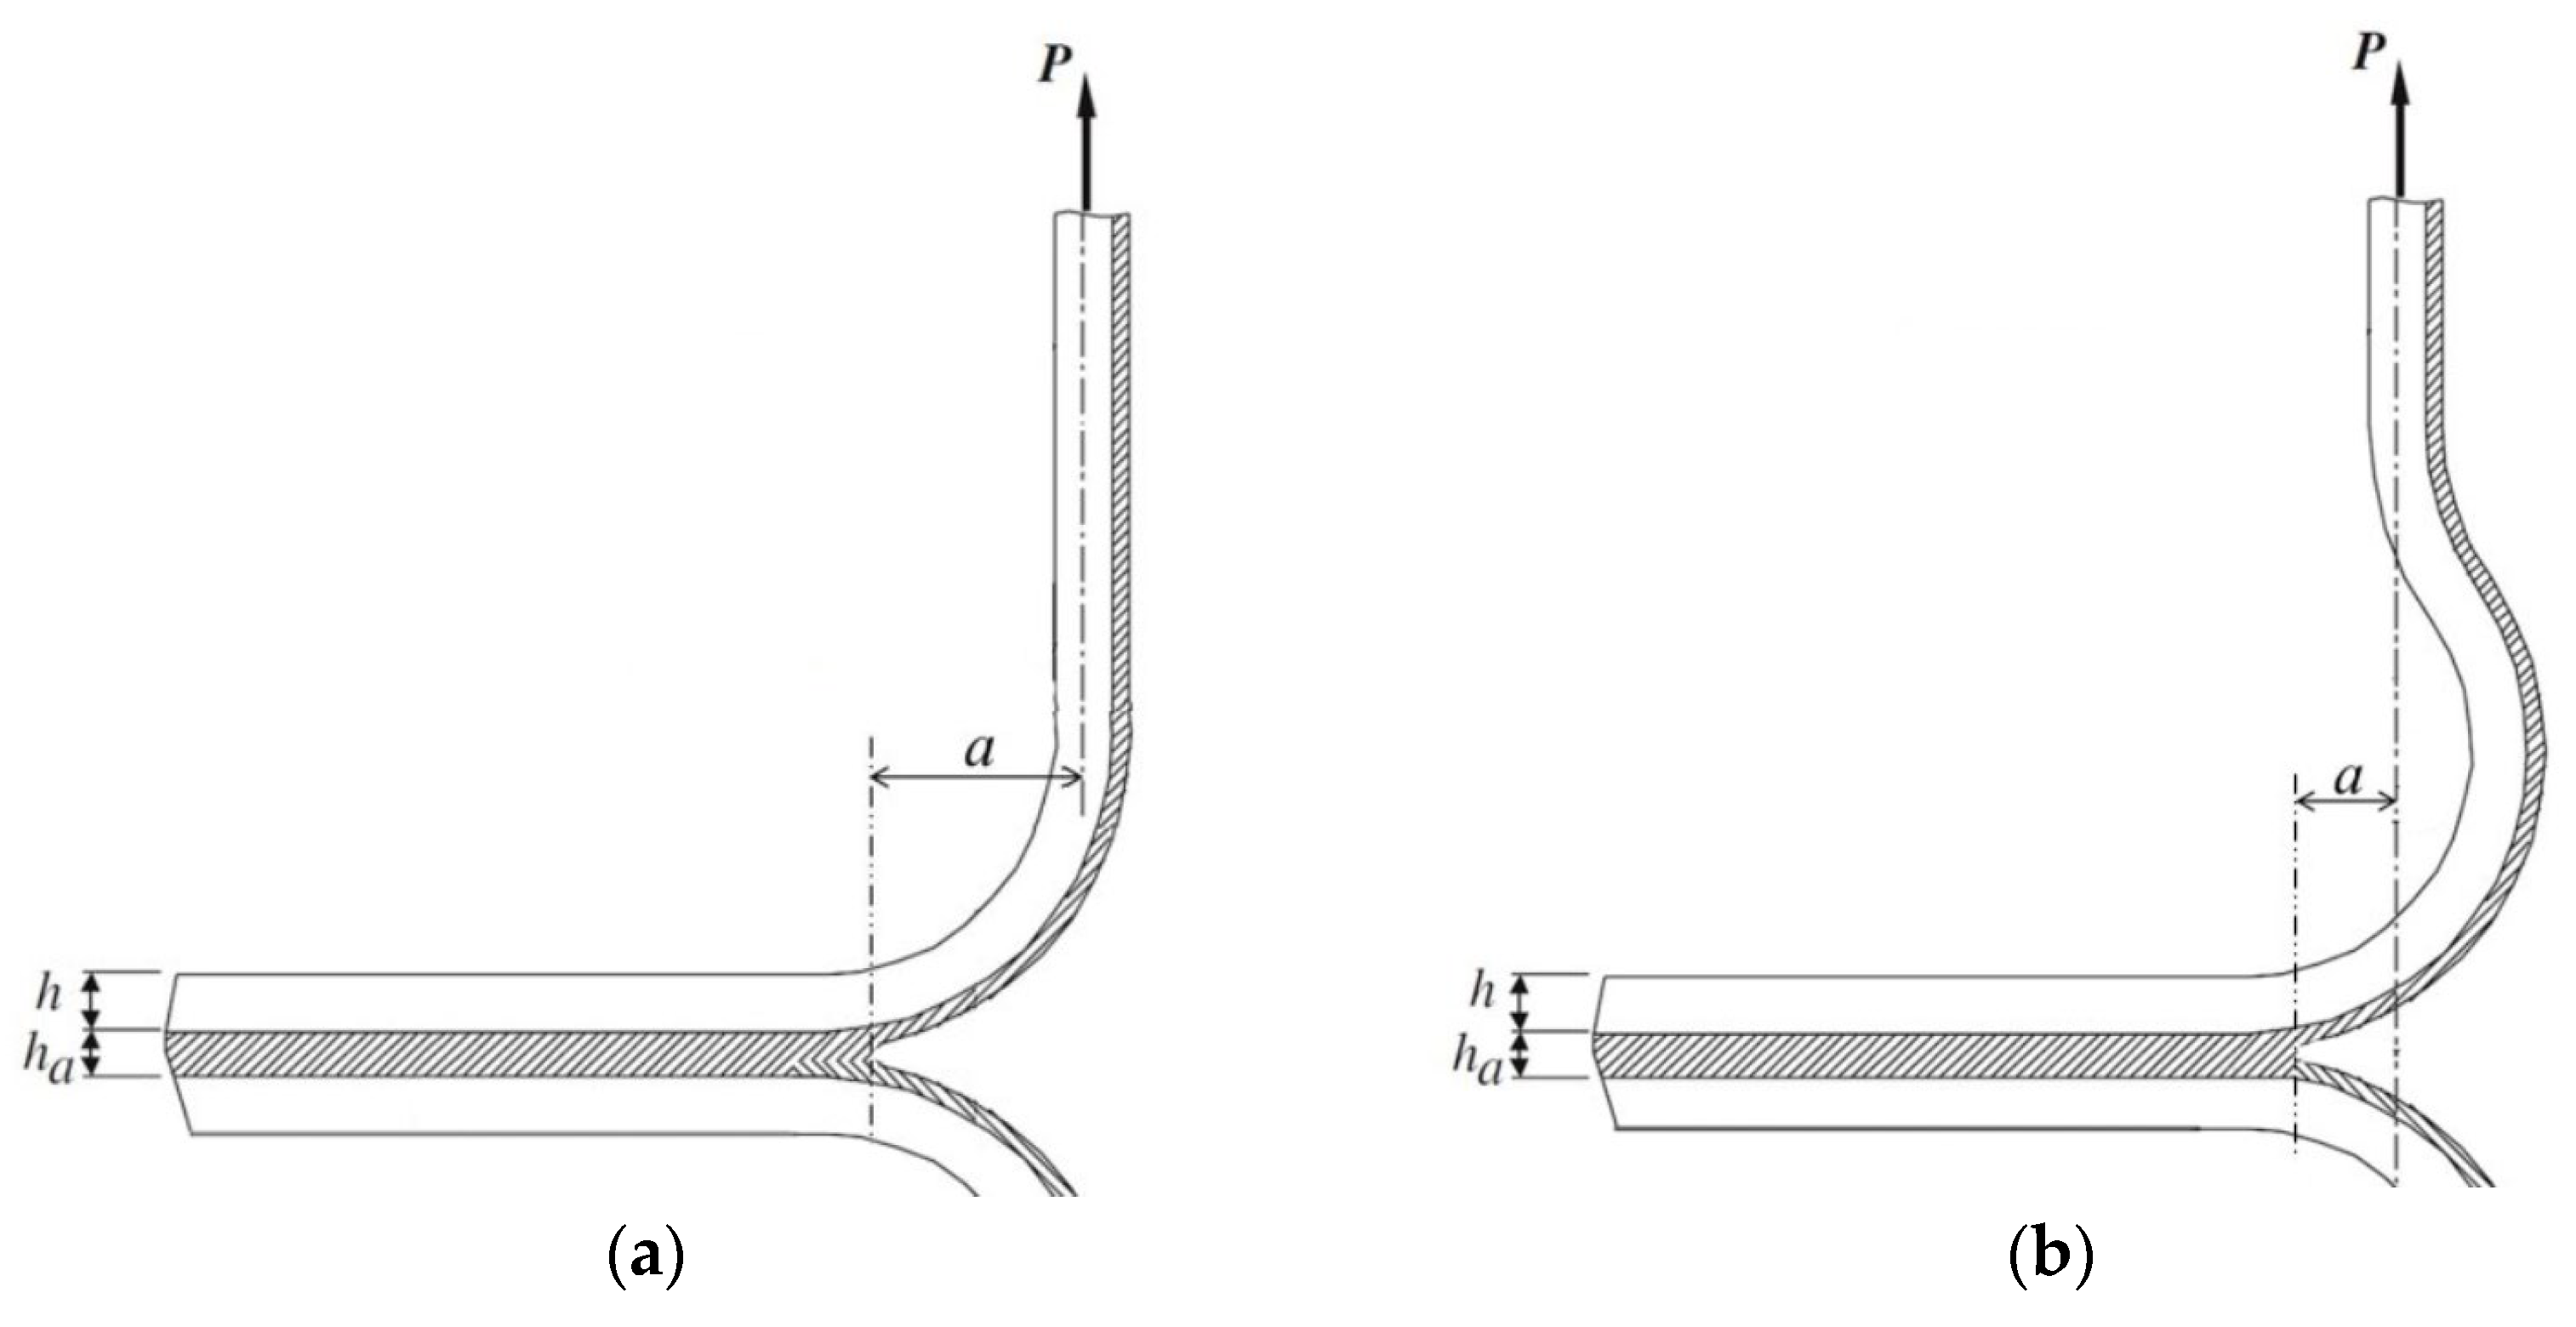
4.1. Deformation of Each Part during the Peel Test
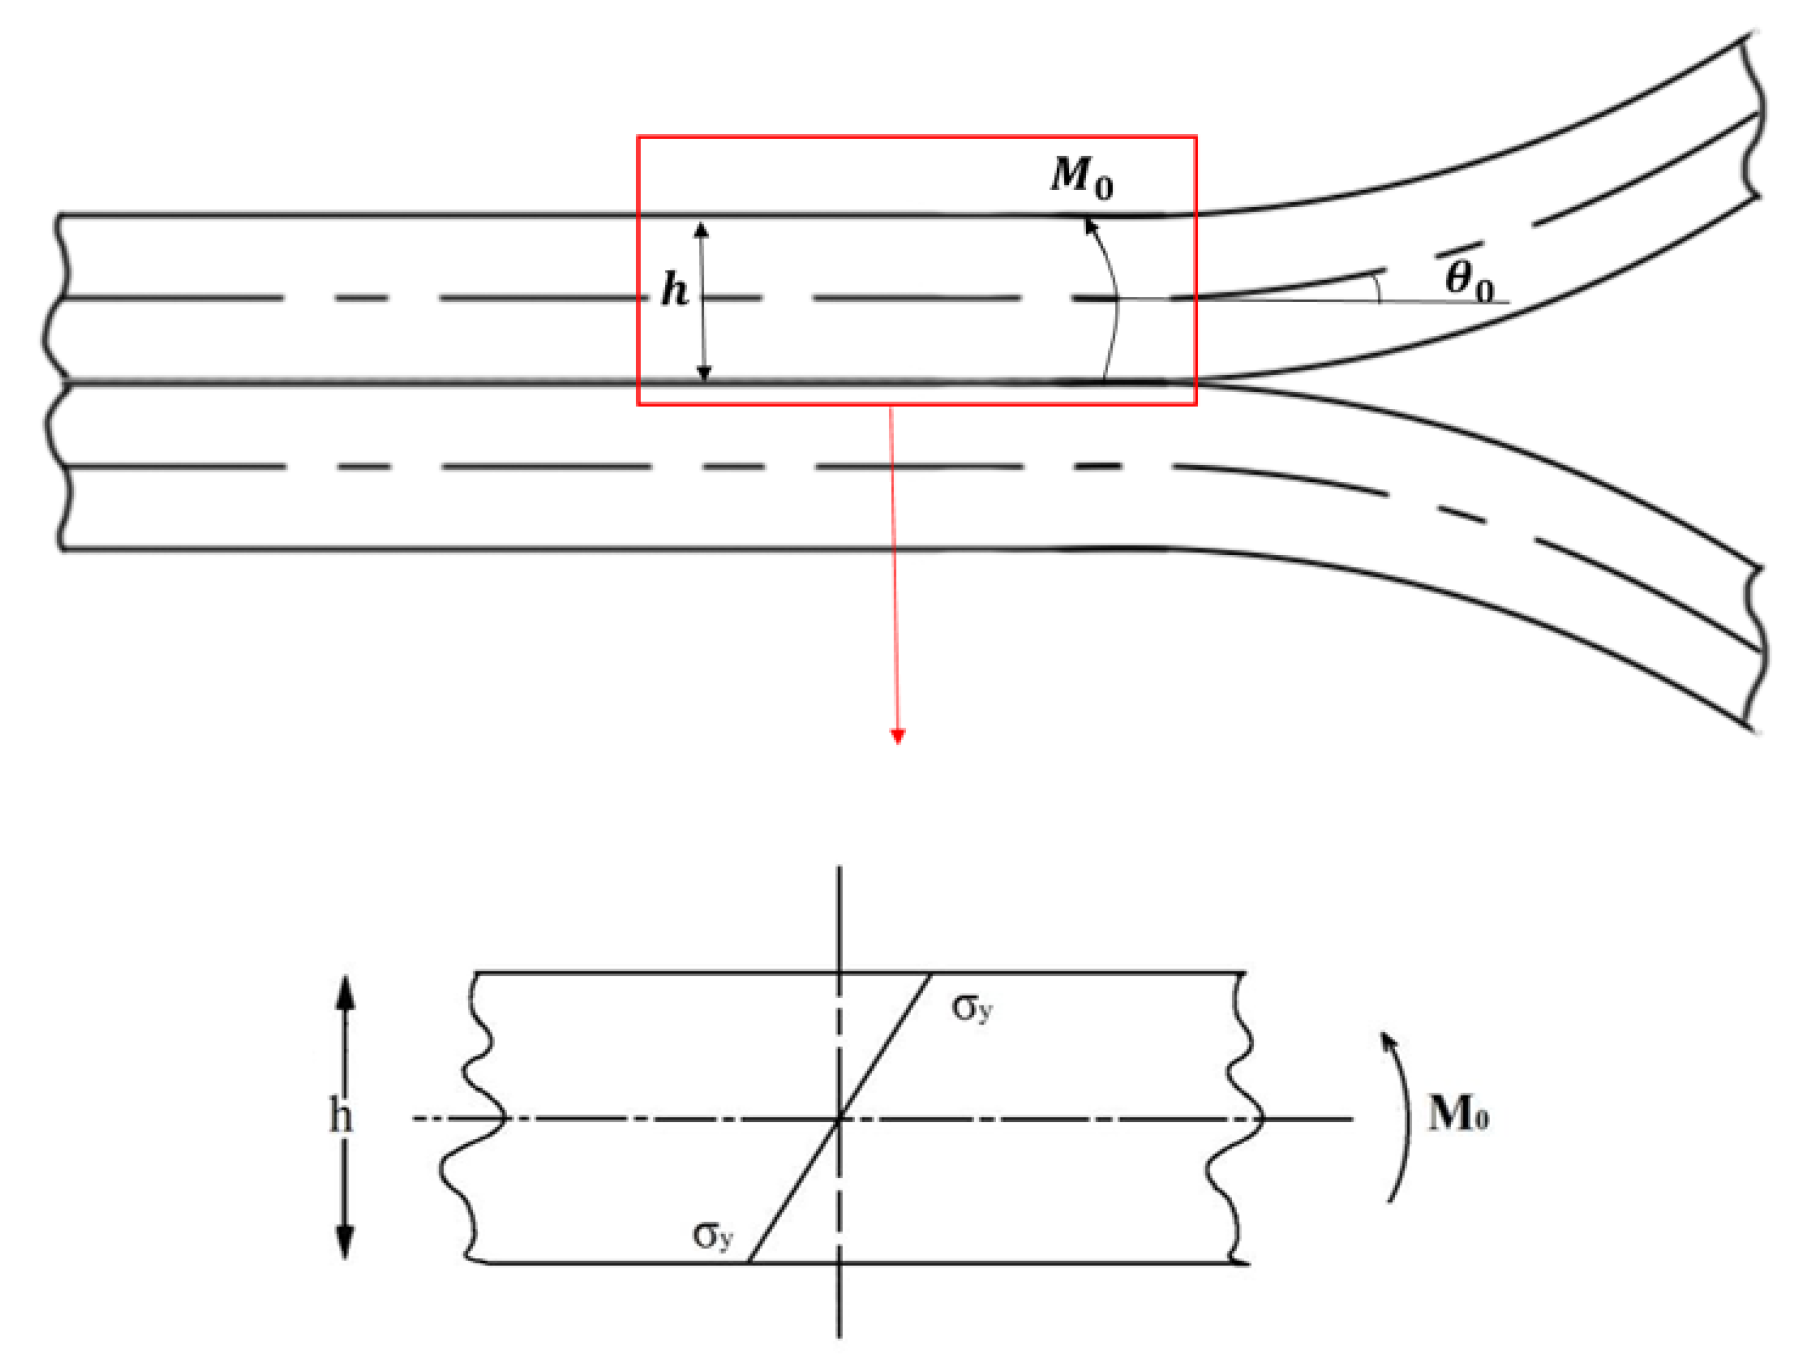
The joint before peeling is shown in Figure 8a. The length of the peeling arm is L0, and the vertical length at the corner is r0. The total displacement D = 0.
The joint at time τ1 is shown in Figure 8b. At this time, the peeling force reaches the maximum peeling force Pmax, and the vertical displacement is divided into L1, Dr1, and D1. The vertical displacement of the peeling arm is L1 = Pmax L/EA, which is the elastic deformation of the peeling arm at this time. The vertical displacement at the corner is Dr1, which is generated through the deformation of the corner itself, and D1 is the displacement generated by the joint crack lifting. The total displacement D = L1 + Dr1 + D1.
The joint at the τ2 moment is shown in Figure 8c. At this time, the joint reaches the stable peeling stage, and the average peeling force is P. The vertical displacement includes three parts. The displacement generated by the peeling arm is L2. The vertical displacement at the corner is Dr2. The displacement generated by the joint crack lifting is D2. The total displacement D = L2 + Dr2 + D2. At this time, L2 = PL/EA, which is the elastic deformation of the peeling arm. Dr2 can be approximately 1/4 arc length minus the corner radius. D2 can be approximated to the radius R0 of the root radius at this moment, and R0 can be obtained by measuring the specimen. So, the total displacement D is:
D = P L E A + 1 2 π r 0 r 0 + R 0

4.2. Root Radius R0

In addition to measuring the specimen, the root radius R0 can also be calculated using the following method.
Select the micro-region of the peeling tip for analysis. Simplify the model to a beam structure, as shown in Figure 9. According to beam theory, R0 can be calculated using the formula:
M 0 E I = 1 R 0
where M0 is the bending moment on the crack tip, and I is the moment of inertia of the peeling arm.
Ideally, as shown in Figure 10a, the bending moment M0 = P × a, where a is the distance from the load to the crack tip. Ideally, a = R0. M0 = P × R0. However, the actual situation is shown in Figure 10b. It can be seen that the distance a is less than R0. Assuming a = k × R0 and substituting it into Equation (9), it can be obtained:
R 0 2 = E I k P = E b h 3 12 k P
where k is a coefficient related to the size of the specimen.

4.3. Energy Analysis during the Peel Process

In the process from τ0 to τ2, the external force is only the peeling force, and its direction is fixed vertically upwards. The displacement in the vertical direction can be obtained in the curve. Therefore, the work performed by the external force in the whole process is the area enclosed by the curve and the coordinate axis.
The total energy G in the peeling process is divided into the following parts. The energy consumed via the elastic deformation of the peeling arm (G1), which is far lower than the total energy, so it is ignored. G2 is the energy consumed via the plastic deformation of 1/4 arc at the corner. When at the stable peeling stage, the deformation of the corner tends to be stable, and no energy is consumed. G3 is the energy required for the deformation of the base metal during the peeling process, which always exists in three stages. G4 is the energy required for crack growth during the peeling process (the total cohesive energy Gc), which always exists in three stages. The energy of each part is shown in Figure 11.
According to the value of G2, the degree of difficulty in the crack initiation stage of the joint can be judged. The larger G2 is, the more energy the joint needs in the crack initiation stage, and the more difficult the joint is to crack. The values of G3 and G4 can allow us to judge the difficulty of joint crack propagation. The larger the G3 and G4, the more energy the crack needs in the propagation stage, and the more difficult the joint failure is. G3 is the energy required for the deformation of part of the base metal after peeling and is mainly affected by the size of the specimen. G4 is the total cohesive energy and is mainly affected by the performance and size of the joint material. The larger the energy required during the process, the better the performance of the joints.
G2 is the energy consumed via the plastic deformation of 1/4 arc at the corner. From τ0 to τ2, the deformation of the corner can be approximately regarded as straightening a quarter arc (Dr2, mentioned above). So, G2 can be regarded as the work performed by the plastic limit in the vertical direction:
G 2     1 2 F × 1 2 π r 0 r 0 = 1 2 × σ y × b h × 1 2 π r 0 -   r 0
The energy G3 can be regarded as the work carried out by the peeling force in the vertical direction:
G 3 PR 0 = P × E b h 3 12 k P
G 4 =   G c   × D = ( 1 6 4 8 P 2 σ y h b 2 + σ y 2 h 2 E ) × D
Meanwhile, G2 and G3 + G4 can be obtained by directly integrating the curve. The results of the theoretical calculation and curve integration are shown in Table 2.
The calculated energy in different stages is consistent with the energy calculated by integrating the peel force and displacement curve; that is to say, the energy in each stage of the peeling process, G2, G3, and G4, can be easily calculated using the above Equations (11)–(13).

5. Verification and Discussion

To verify the energy calculation method mentioned above, the other groups of experimental data were processed in the same way, and the results are shown in Table 3.
From Table 3, it can be seen that the relative error of the calculation results is within 10%. This implies that the method proposed in this study is feasible and accurate.
The energy of specimens with different base metal thicknesses at different stages was further compared, as shown in Figure 12. It can be seen that the energy increases linearly with the thickness when the thickness of the base material is less than 1.2 mm. When the thickness is greater than 1.2 mm, the energy increases faster. This indicates that increasing the thickness of the base material can effectively improve the peeling performance of the joints.
The proportion of each part with different base metal thicknesses is shown in Figure 13. It can be seen that the proportion of G2 increases linearly with the increase in base metal thickness when the thickness of the base material is less than 1.2 mm, while the proportion of G3 decreases linearly with the increase in thickness. When the thickness is greater than 1.2 mm, the proportions of G2 and G3 reach a constant of 62% and 36%, respectively, while G4 only accounts for a small portion of the total energy, and the proportion decreases with the increase in base metal thickness. When the thickness is greater than 1.2 mm, the proportion of G4 drops to 2% and remains constant. This indicates that with the increase in base metal thickness, the influence of the energy consumed by the plastic deformation of the corner will become increasingly significant. So, during structural design, the thickness of the base material should be increased as much as possible while considering the influence of energy consumed via the plastic deformation of the corner.

6. Conclusions

Through the analysis of the peeling force and displacement curve, the following conclusions can be drawn from the study.
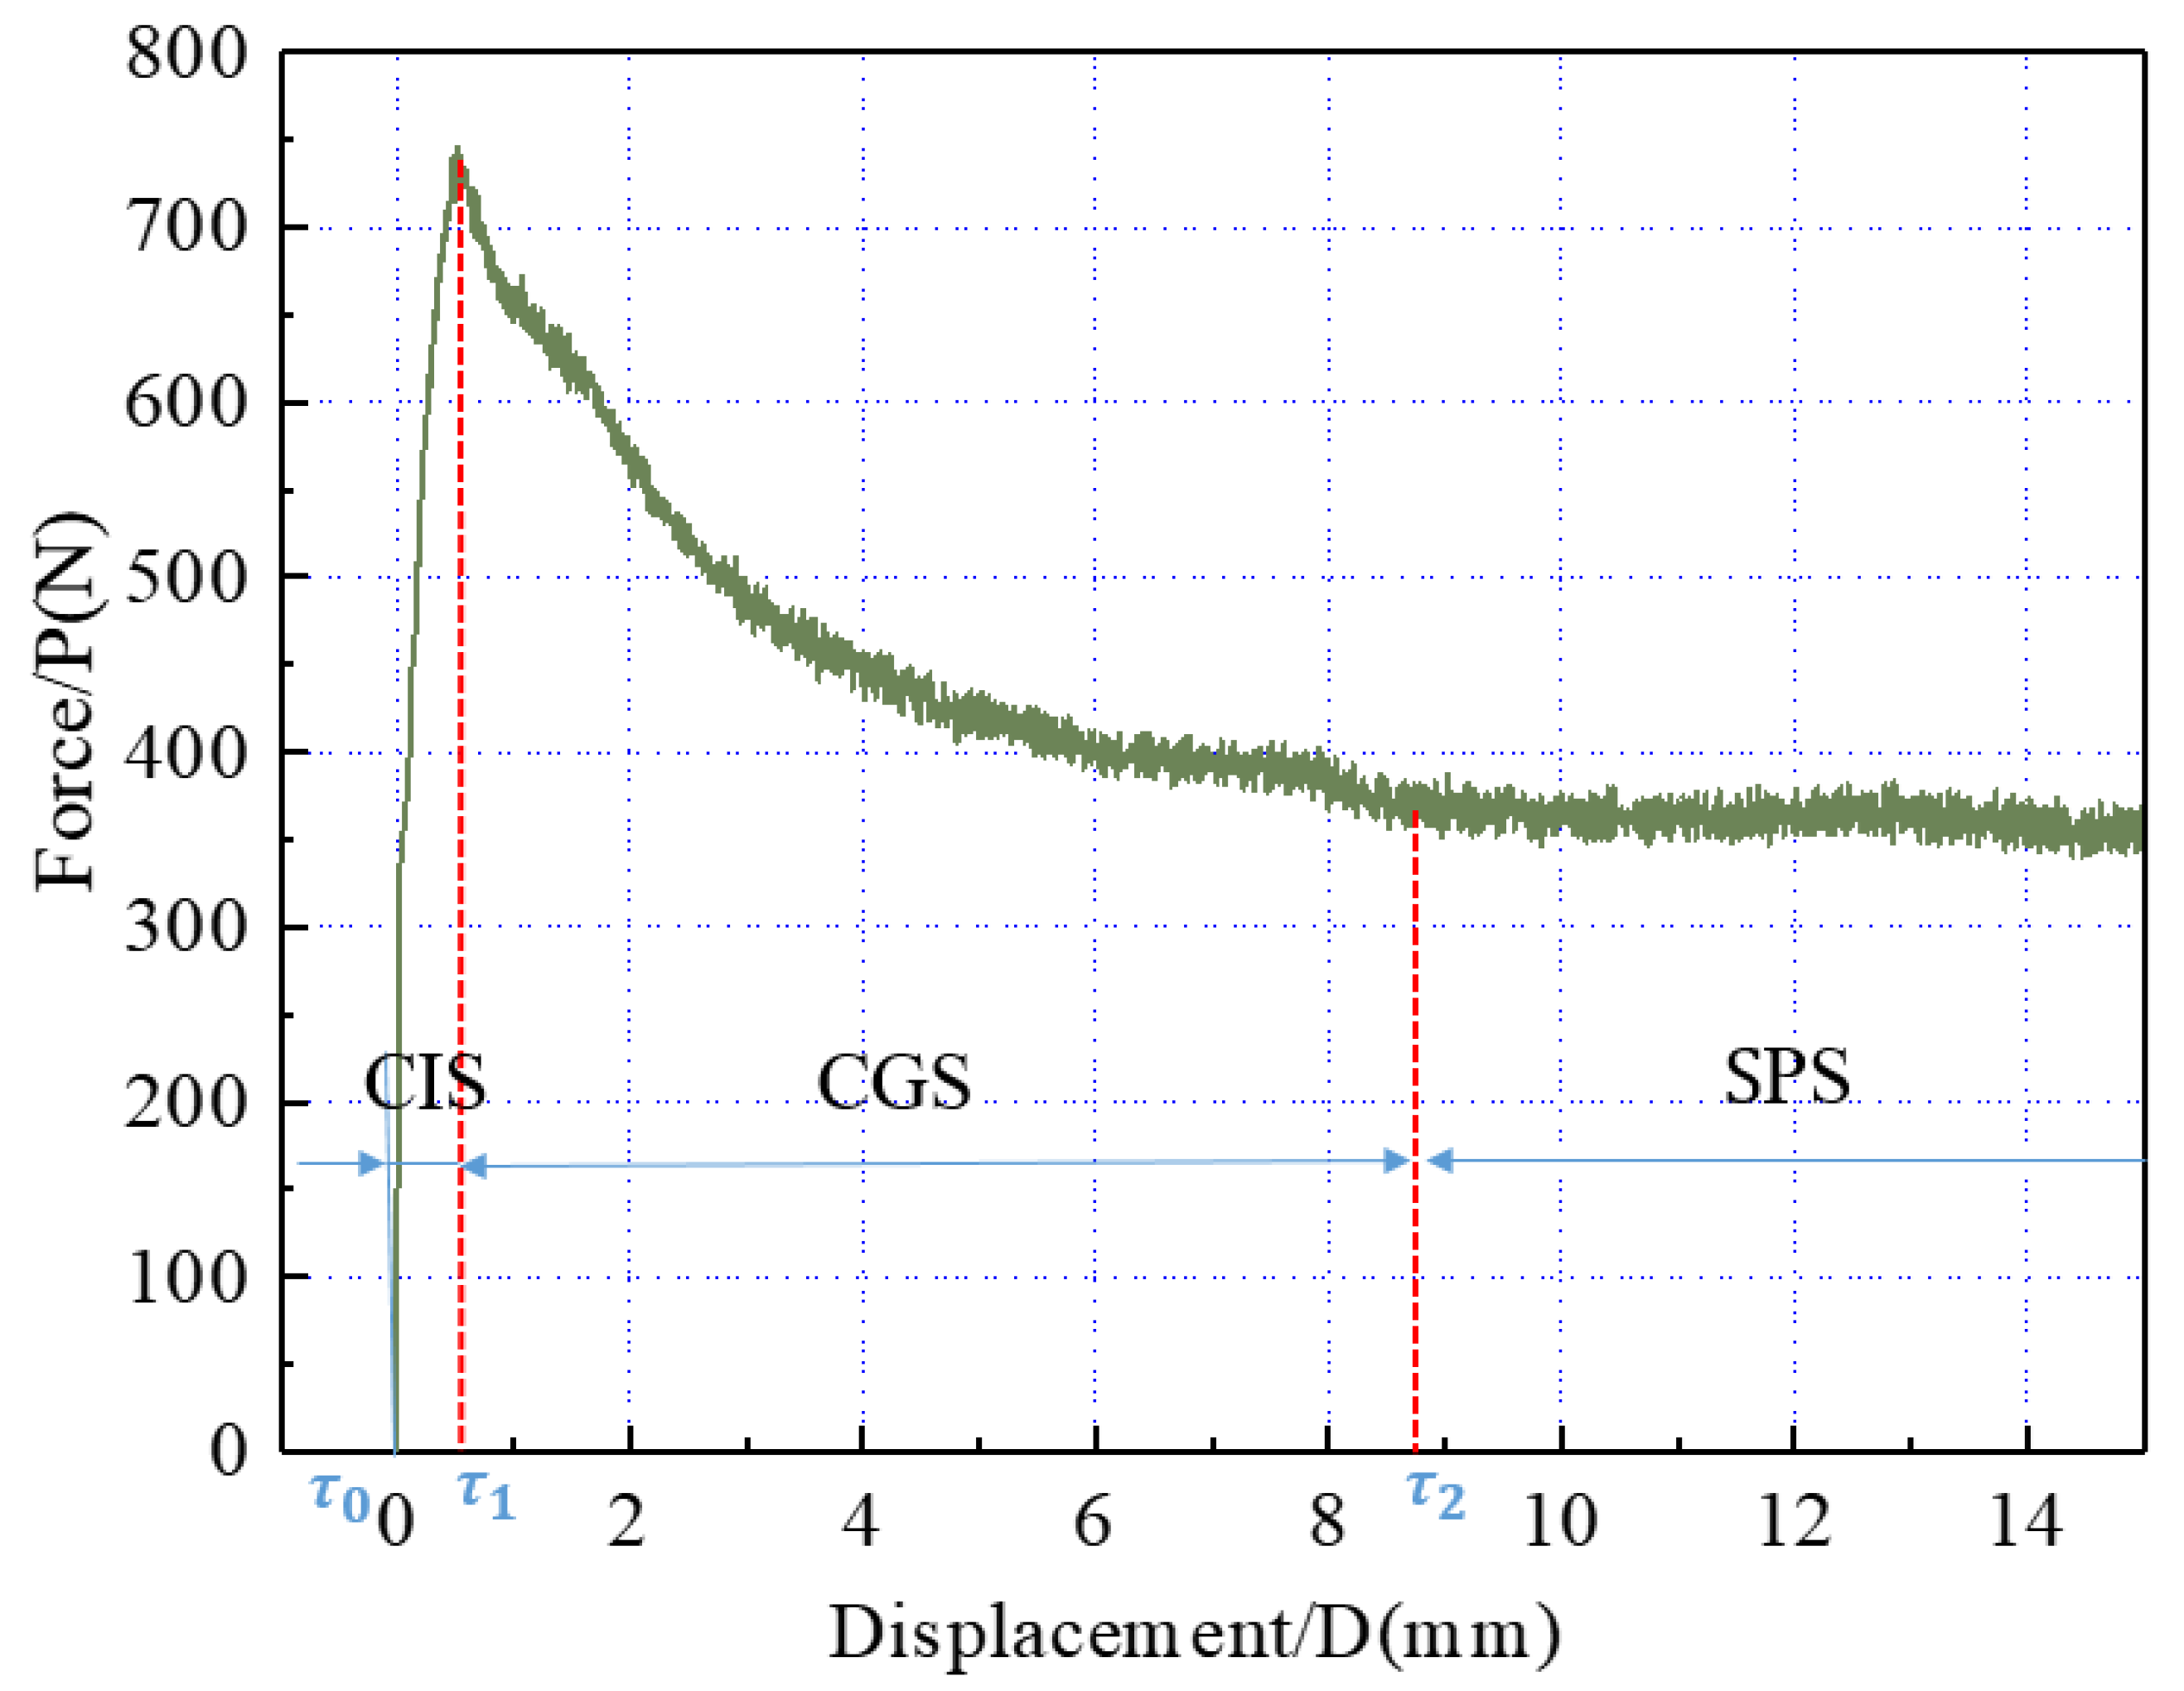
  • The whole peeling process can be divided into three stages, including the crack initiation stage (CIS), the crack growth stage (CGS), and the stable peeling stage (SPS).
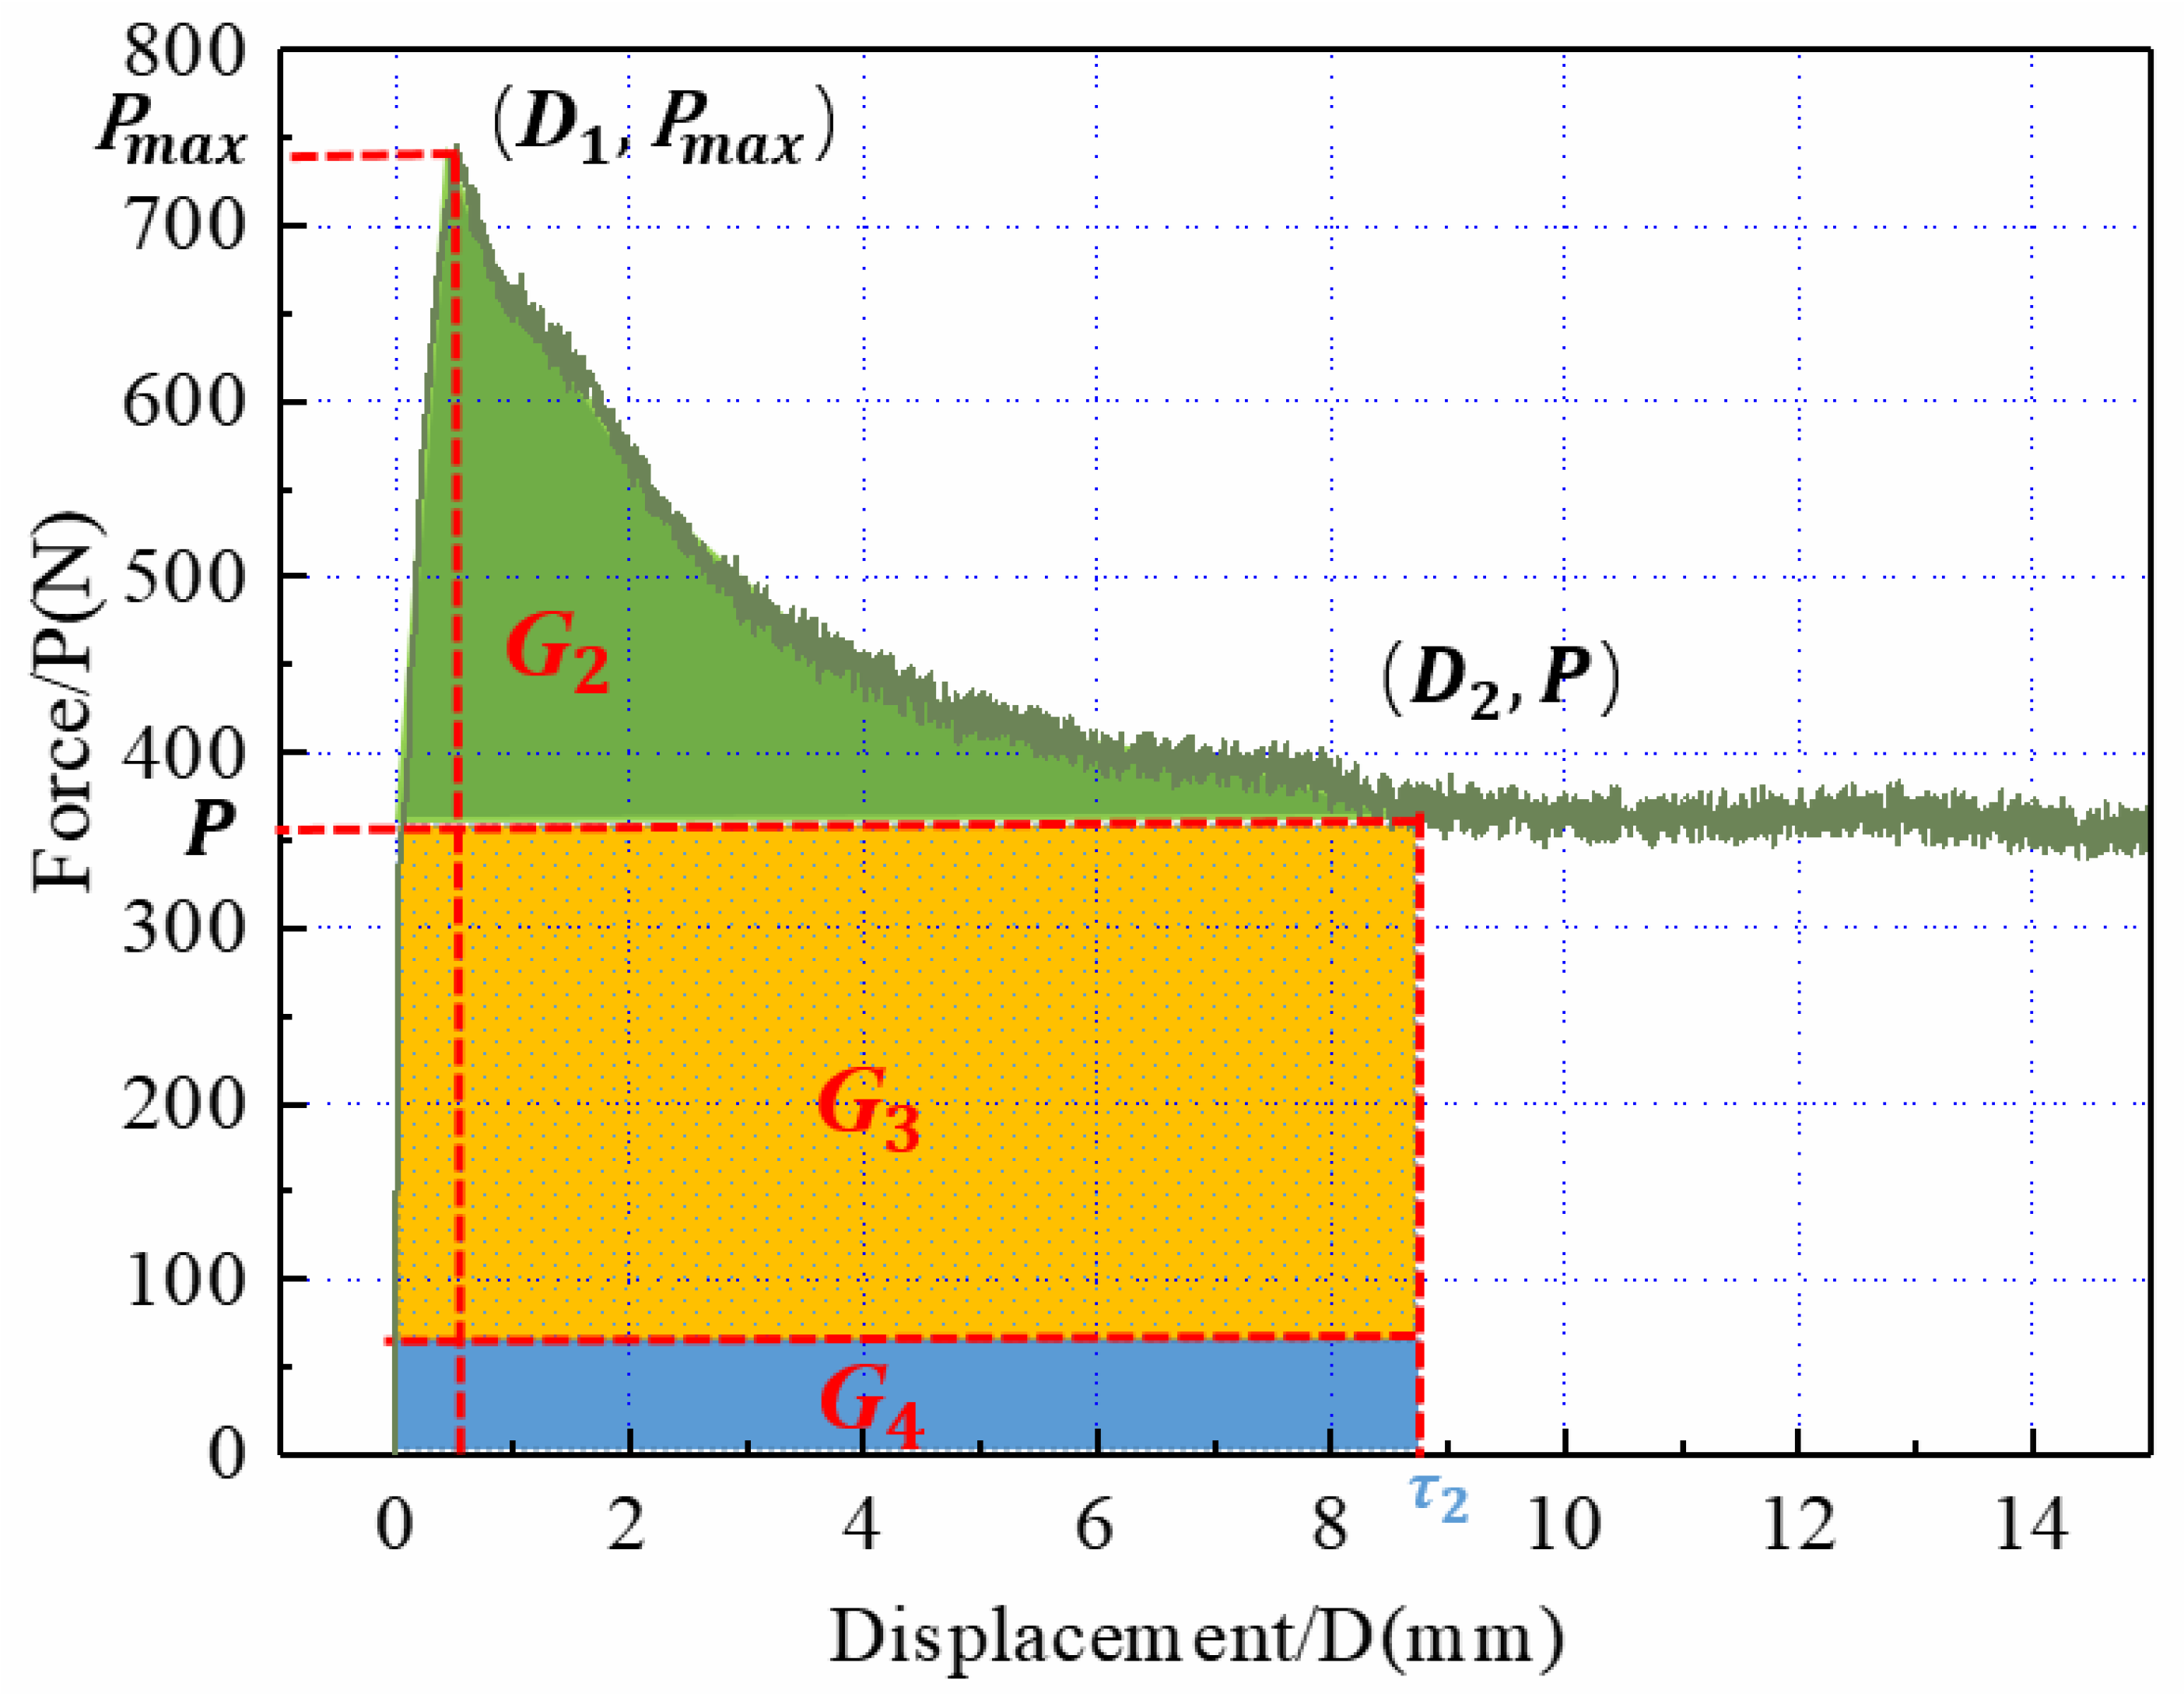
  • The energy of each stage can be experimentally calculated using the area surrounded by the peeling force and displacement curve. The larger the energy required during the process, the better the performance of the joints.
  • Based on the cohesive zone model, a calculation model for peeling energy is developed for T-type joints and is verified to be accurate using experimental data. Furthermore, increasing the thickness of the base material can effectively improve the energy of each stage, which can directly improve the peeling performance of the joints.
G 2 = 1 2 F × 1 2 π r 0 r 0 = 1 2 × σ y × b h × 1 2 π r 0 r 0 G 3 = P R 0 = P × E b h 3 12 k P G 4 =   G c × D = 1 6 4 8 P 2 σ y h b 2 + σ y 2 h 2 E × D
4.
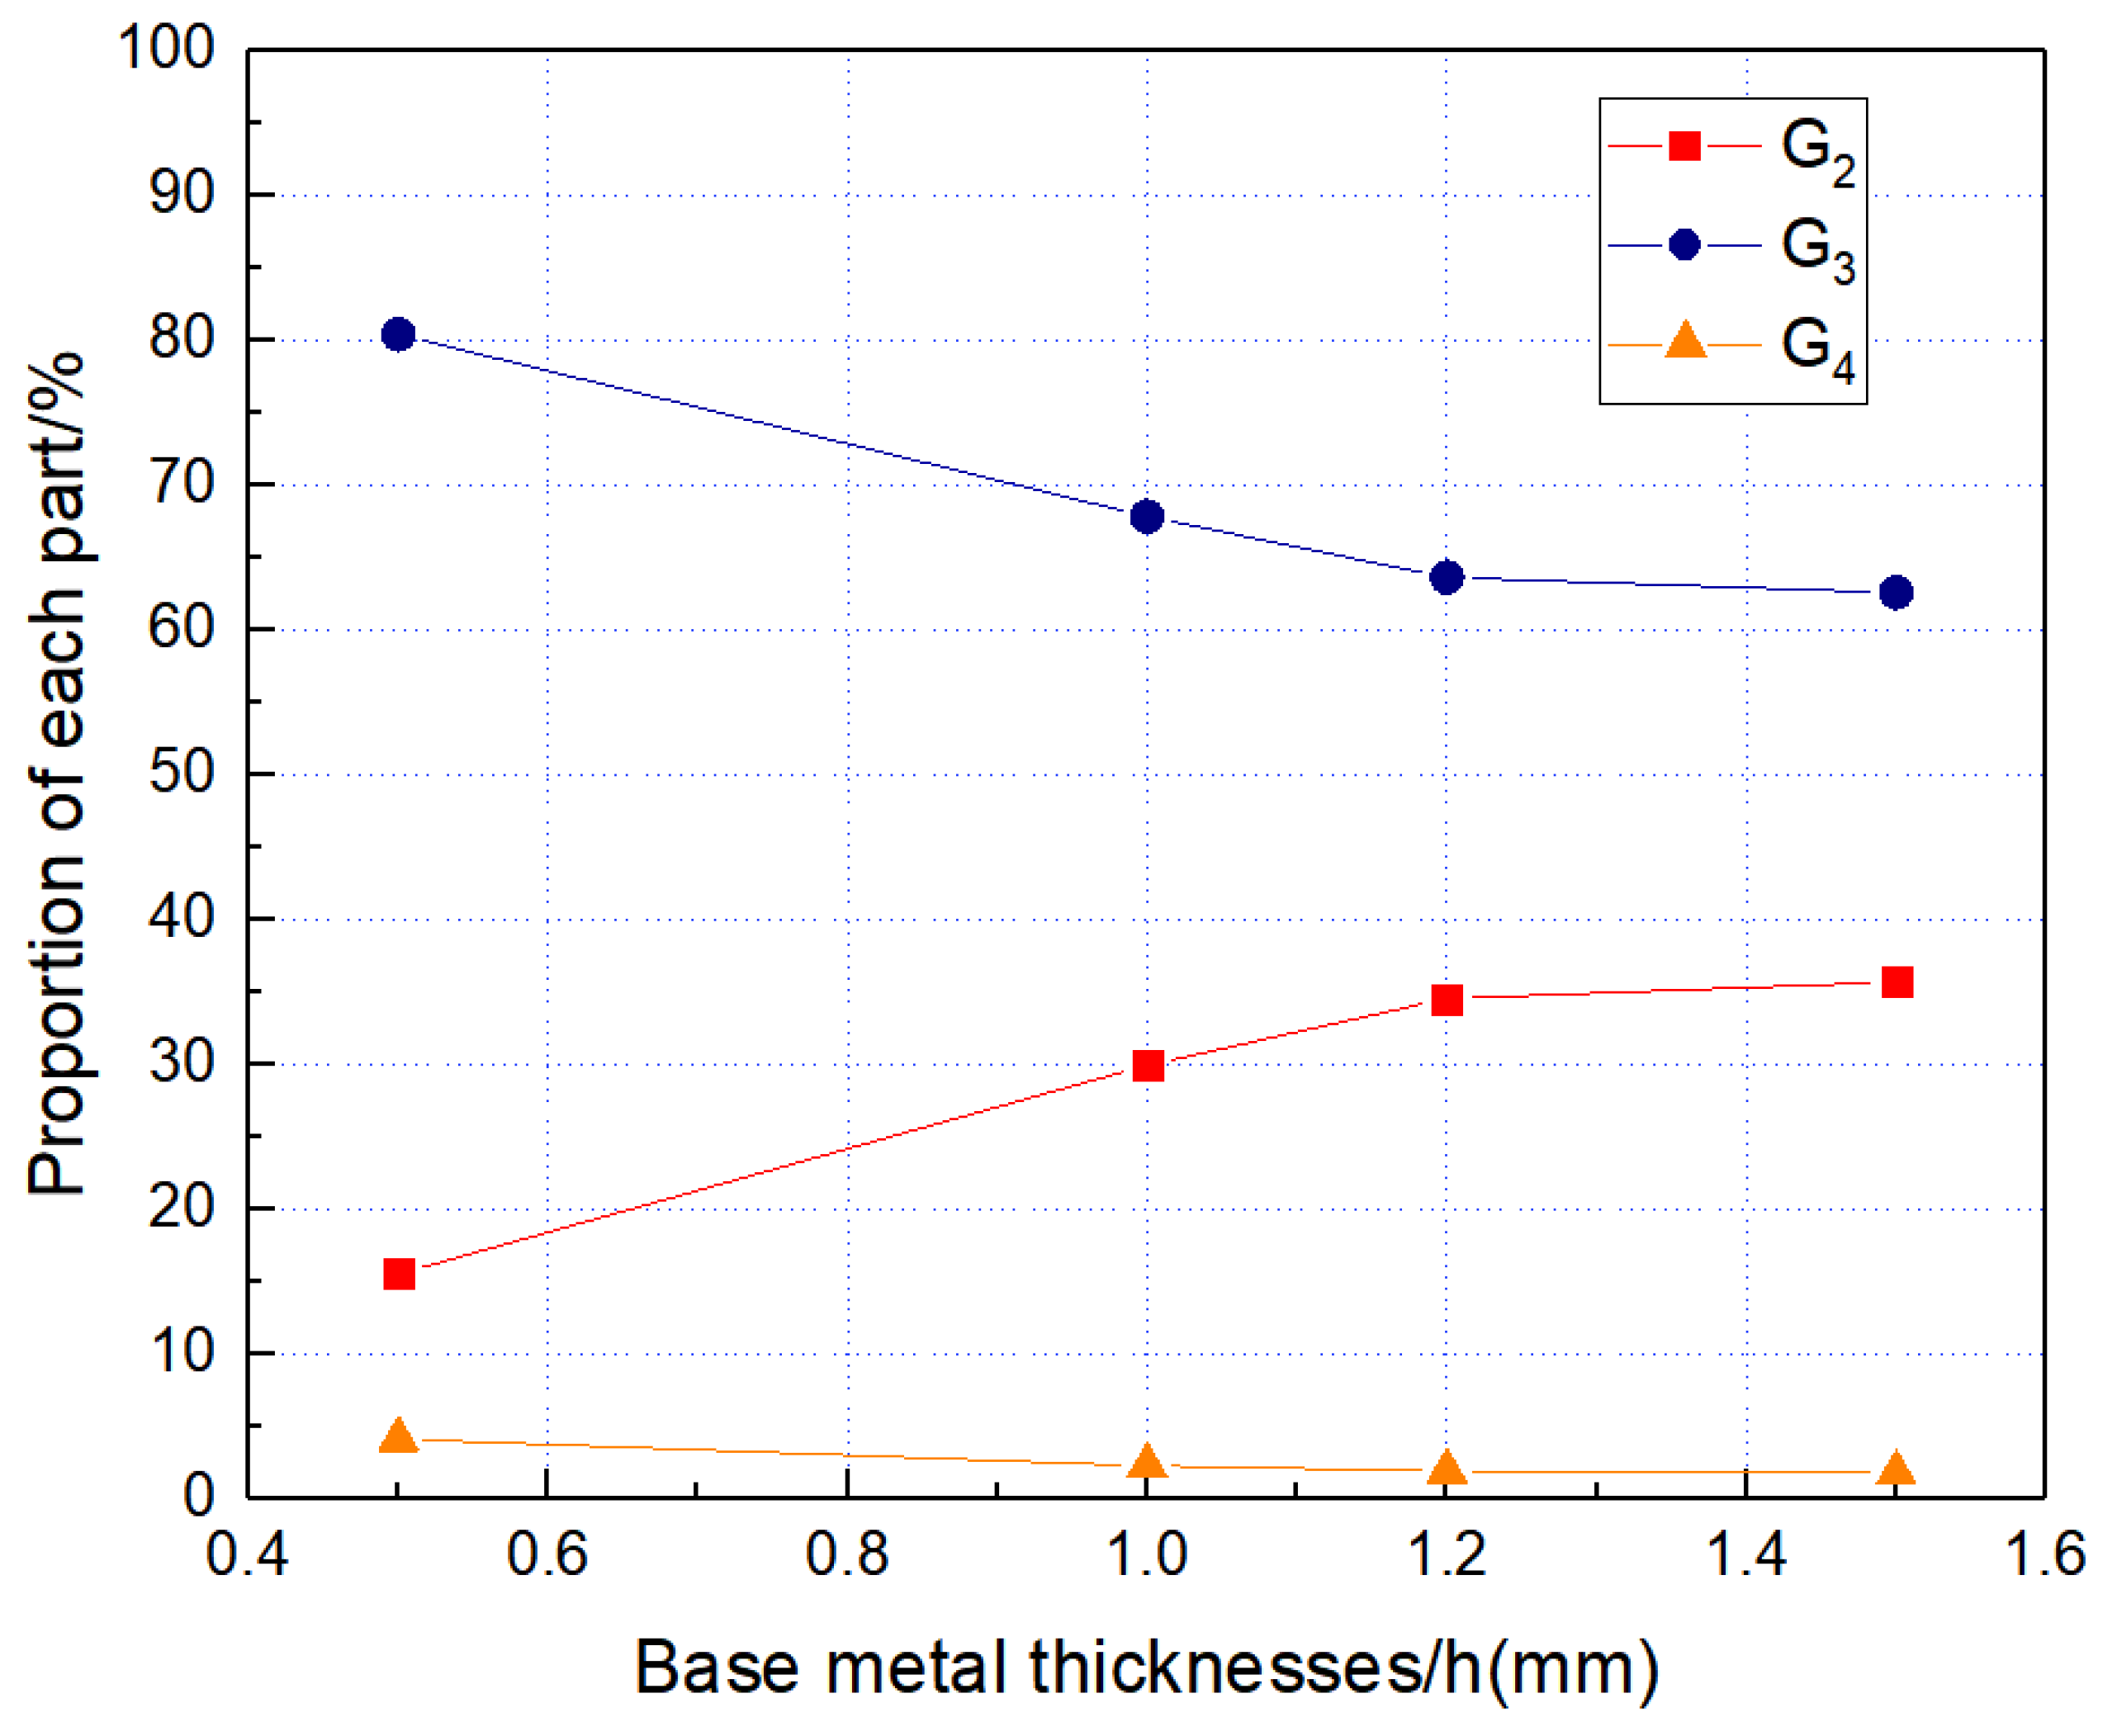
The influence of the energy consumed through the plastic deformation of the corner will become increasingly significant with the increase in base metal thickness. When the thickness is greater than critical value of 1.2 mm, the proportions of G2, G3, and G4 will reach a constant of 62%, 36%, and 2%, respectively.

Author Contributions

Conceptualization, G.-Y.Z., P.-Y.D. and S.-T.T.; Methodology, G.-Y.Z., P.-Y.D. and S.-T.T.; Formal analysis, P.-Y.D.; Data curation, P.-Y.D.; Writing—original draft, P.-Y.D.; Writing—review and editing, G.-Y.Z., P.-Y.D. and S.-T.T.; Project administration, S.-T.T.; Funding acquisition, S.-T.T. All authors have read and agreed to the published version of the manuscript.

Funding

The work was supported by National Natural Science Foundation of China (Grant No. 51675181 and No. 52130511) and Shanghai Gaofeng Project for University Academic Program Development.

Data Availability Statement

The data presented in this study are available on request from the corresponding author. The data are not publicly available due to privacy and ethical reasons.

Conflicts of Interest

The authors declare no conflict of interest.

Nomenclature

Across-sectional area/mm2bwidth of the base metal/mm
Dr1vertical displacement at the corner at τ1/mmDr2vertical displacement at the corner at τ2/mm
Eelastic modulus of the base metal/GPaEaelastic modulus of the welding material/GPa
G1energy consumed via the elastic deformation of the peeling arm/mJG2energy consumed through the plastic deformation of the corner/mJ
G3energy required for the deformation of the base metal/mJG4energy required for crack growth/mJ
Gccritical cohesive energy/mJGddissipative energy of the plastic-bending deformation/mJ
Gttotal energy consumed by crack propagation/mJhthickness of the base metal/mm
hcthickness of the interface layer/mmka coefficient related to the size of the specimen.
L0length of the peeling arm/mmL1vertical displacement of the peeling arm at τ1/mm
L2vertical displacement of the peeling arm at τ2/mmnthickness of the filler metal/layer
Paverage peeling force/NPmaxmaximum peeling force/N
r0radius of the corner/mmR0radius of the root/mm
Dtotal displacement/mmD1displacement generated by the joint crack lifting at τ1/mm
D2displacement generated by the joint crack lifting at τ2/mmτ0time at the beginning of the test
τ1time the force reaches its peakτ2time the force tends to be fixed
vloading rate/mm/minθthe peeling angle/°
σyyield stress of the base metal/MPaΔlength of the interface layer torn before the formation of new crack/mm

References

  1. Cengel, Y.A.; Turner, R.H.; Smith, R. Fundamentals of Thermal-Fluid sciences. Appl. Mech. Rev. 2001, 54, B110–B112. [Google Scholar] [CrossRef]
  2. Riggs, B.E. Multi-Scale Computational Modeling of Ni-Base Superalloy Brazed Joints for Gas Turbine Applications. Ph.D. Thesis, The Ohio State University, Columbus, OH, USA, 2017. [Google Scholar]
  3. Xia, Y.; Dong, H.; Zhang, R.; Wang, Y.; Hao, X.; Li, P.; Dong, C. Interfacial microstructure and shear strength of Ti6Al4V alloy/316 L stainless steel joint brazed with Ti33.3Zr16.7Cu50xNix amorphous filler metals Mater. Mater. Des. 2020, 187, 108380. [Google Scholar] [CrossRef]
  4. Sun, Z.; Zhang, L.; Zhang, B.; Chang, Q.; Song, Y. A strategy to fabricate strength-ductility enhanced braze filler reinforced by 3-dimensional graphene sponge for joining C/C composites. Mater. Des. 2020, 189, 108515. [Google Scholar] [CrossRef]
  5. Zhang, G.; Yang, X.; Zhu, D.; Zhang, L. Cladding thick Al plate onto strong steel substrate using a novel process of multilayer-friction stir brazing. Mater. Des. 2020, 185, 108232. [Google Scholar] [CrossRef]
  6. Min, J.K.; Jeong, J.H.; Ha, M.Y.; Kim, K.S. High temperature heat exchanger studies for applications to gas turbines. Heat Mass Transf. 2009, 46, 175–186. [Google Scholar] [CrossRef]
  7. Vianco, P.T. A Review of Interface Microstructures in Electronic Packaging Applications: Brazing and Welding Technologies. JOM 2022, 74, 3557–3577. [Google Scholar] [CrossRef]
  8. Wang, G.; Sheng, G.M.; Yu, Q.L.; Yuan, X.J.; Sun, J.C.; Jiao, Y.J.; Zhang, Y.T. Investigation of intergranular penetration behavior in CrMnFeCoNi HEA/304 SS dissimilar brazing joints. Intermetallics 2020, 126, 106940. [Google Scholar] [CrossRef]
  9. Park, D.Y.; Lee, S.K.; Kim, J.K.; Lee, S.N.; Park, S.J.; Oh, Y.J. Image processing-based analysis of interfacial phases in brazed stainless steel with Ni-based filler metal. Mater. Charact. 2017, 130, 278–284. [Google Scholar] [CrossRef]
  10. Park, D.Y.; Lee, S.K.; Oh, Y.J. Taguchi analysis of relation between tensile strength and interfacial phases quantified via image processing. Metall. Mater. Trans. A 2018, 49, 4684–4699. [Google Scholar] [CrossRef]
  11. Salmaliyan, M.; Shamanian, M. Effect of Ti Powders Addition on Mechanical and Metallurgical Properties of IN718/BNi-2/316L Diffusion Couple. Trans. Indian Inst. Met. 2020, 73, 1157–1169. [Google Scholar] [CrossRef]
  12. Wu, Y.W.; Xing, A.D.; Cheng, Q.Z.; Li, Q.S. Interface strength investigations of 304 stainless steel/T2 red copper T-type brazed joint based on cohesive zone model. Mater. Res. Express 2023, 10, 016517. [Google Scholar] [CrossRef]
  13. Kawashima, F.; Igari, T.; Miyoshi, Y.; Kamito, Y.; Tanihira, M. High temperature strength and inelastic behavior of plate-fin structures for HTGR. Nucl. Eng. Des. 2007, 237, 591–599. [Google Scholar] [CrossRef]
  14. Abdolvand, R.; Atapour, M.; Shamanian, M.; Allafchian, A. The effect of bonding time on the microstructure and mechanical properties of transient liquid phase bonding between SAF 2507 and AISI 304. J. Manuf. Process. 2017, 25, 172–180. [Google Scholar] [CrossRef]
  15. Otto, J.L.; Penyaz, M.; Möhring, K.; Gerdes, L.; Schaum, T.; Ivannikov, A.; Schmiedt-Kalenborn, A.; Kalin, B.; Walther, F. Microstructure, residual stresses, and strain-rate dependent deformation and fracture behavior of AISI 304L joints brazed with NiCrSiB filler metals. Metals 2021, 11, 593. [Google Scholar] [CrossRef]
  16. Duan, P.-Y.; Wang, D.-X.; Zhou, G.-Y.; Tu, S.-T. Experimental study on peeling performance of T-type brazing joints. Int. J. Press. Vessel. Pip. 2019, 172, 70–78. [Google Scholar] [CrossRef]
  17. Paiva, R.M.; Marques, E.A.; da Silva, L.F.; António, C.A.; Arán-Ais, F. Adhesives in the footwear industry. Proc. Inst. Mech. Eng. Part L J. Mater.-Des. Appl. 2016, 230, 357–374. [Google Scholar] [CrossRef]
  18. Yao, C.; Hu, Z.F.; Mo, F.; Wang, Y. Fabrication and fatigue behavior of aluminum foam sandwich panel via liquid diffusion welding method. Metals 2019, 9, 582. [Google Scholar] [CrossRef]
  19. Heuser, M.; Zankel, A.; Mayrhofer, C.; Reincke, K.; Langer, B.; Grellmann, W. Characterization of the opening behavior of multilayer films with cohesive failure mechanism by in situ peel tests in the ESEM. J. Plast. Film. Sheeting 2021, 38, 147–172. [Google Scholar] [CrossRef]
  20. Weidmann, F.; Ziegmann, G.; Wieser, J. A review of mode I dominant interfacial fracture toughness test methods of skin-core bonding for thermoplastic composite sandwich structures. J. Thermoplast. Compos. Mater. 2022, 36, 2643–2673. [Google Scholar] [CrossRef]
  21. Zhang, Y.N.; Dong, P.S.; Pei, X.J. Fracture Mechanics Modeling of Fatigue Behaviors of Adhesive-Bonded Aluminum Alloy Components. Metals 2022, 12, 1298. [Google Scholar] [CrossRef]
  22. Jarzabek, D.M. The impact of weak interfacial bonding strength on mechanical properties of metal matrix—Ceramic reinforced composites. Compos. Struct. 2018, 201, 352–362. [Google Scholar] [CrossRef]
  23. ASTM D 3167-03a; Standard Test Method for Floating Roller Peel Resistance of Adhesives. ASTM International: West Conshohocken, PA, USA, 2004.
  24. GB/T 2039-1997; Standard for Tensile Creep Test of Metal. Standards Press of China: Beijing, China, 1997.
  25. Vetrivendan, E.; Varghese, P.; Krishnan, R.; Mathews, T.; Ningshen, S. Vacuum brazing of copper and SS316L using Ni–P eutectic alloy filler for nuclear applications. Weld. World 2022, 66, 2041–2052. [Google Scholar] [CrossRef]
  26. Jiang, W.C.; Gong, J.M.; Tu, S.D.; Chen, H. Modelling of temperature field and residual stress of vacuum brazing for stainless steel plate-fin structure. J. Mater. Process. Technol. 2009, 209, 1105–1110. [Google Scholar] [CrossRef]
  27. Wei, Z.; Jiang, W.; Song, M.; Xiao, C.; Tu, S.T. Effects of element diffusion on microstructure evolution and residual stresses in a brazed joint: Experimental and numerical modeling. Materialia 2018, 4, 540–548. [Google Scholar] [CrossRef]
  28. Ma, H.Y.; Duan, P.Y.; Zhou, G.Y.; Tu, S.T. Fracture mechanism of 316L/BNi-2 brazed joints using experiment and microstructure-based model. J. Manuf. Process. 2023, 101, 1167–1175. [Google Scholar] [CrossRef]
  29. Geubelle, P.H.; Baylor, J. Impact-induced delamination of laminated composite: A 2D simulation. Compos. Part B Eng. 1998, 29, 589–602. [Google Scholar] [CrossRef]
  30. Chandra, N. Evaluation of interfacial fracture toughness using cohesive zone model. J. Compos. 2002, 33, 1433–1447. [Google Scholar] [CrossRef]
  31. Qiu, Y.; Crisfield, M.A.; Alfano, G. An interface element formulation for the simulation of delamination with bucking. Eng. Fract. Mech. 2001, 68, 1755–1776. [Google Scholar] [CrossRef]
  32. Georgiou, I.; Hadavinia, H.; Ivankovic, A.; Kinloch, A.J.; Tropsa, V.; Williams, J.G. Cohesive zone models and the plastically deforming peel test. J. Adhes. 2003, 79, 239–265. [Google Scholar] [CrossRef]
  33. Kawashita, L.F.; Moore, D.R.; Williams, J.G. Protocols for the measurement of adhesive Tracture toughness by peel tests. J. Adhes. 2006, 82, 973–995. [Google Scholar] [CrossRef]
  34. Zhou, F.; Jiang, W.; Tan, J.; Shi, J.; Yang, D. Crack Propagation of SS304/BNi-2 Brazed Joints: Experiments and Numerical Simulations. Metals 2019, 9, 1031. [Google Scholar] [CrossRef]
Figure 1. Prefabricated T-type peeling specimen. (a) L-shape base metal; (b) fixture; (c) vacuum brazing furnace; (d) brazing process; (e) the brazing parts; (f) T-type peeling specimen. Adapted with permission from ref. [16]. 2019 Elsevier Ltd.
Metals 14 00115 g001
Figure 2. Tensile testing machine.
Metals 14 00115 g002
Figure 3. The result of the test.
Metals 14 00115 g003
Figure 4. Peeling force and displacement curve (for Specimen 2, h = 1 mm).
Metals 14 00115 g004
Figure 5. Bilinear cohesive zone model.
Metals 14 00115 g005
Figure 6. The length of the interface layer torn before the formation of a new crack (Δ). Adapted with permission from ref. [16]. 2019 Elsevier Ltd.
Metals 14 00115 g006
Figure 7. The three stages of the curve (for Specimen 2, h = 1 mm).
Metals 14 00115 g007
Figure 8. Deformation of each part. (a) The initial state; (b) the maximum peeling force state; (c) the stable peeling state.
Metals 14 00115 g008
Figure 9. The schematic diagram of elastic deformation at the peel front.
Metals 14 00115 g009
Figure 10. Peeling test diagrams. (a) Ideal peeling test; (b) actual peeling test.
Metals 14 00115 g010
Figure 11. The energy of each part (for Specimen 2, h = 1 mm. Green area for G2, orange area for G3 and blue area for G4).
Metals 14 00115 g011
Figure 12. The energy of each part with different base metal thicknesses.
Metals 14 00115 g012
Figure 13. Proportion of each part with different base metal thicknesses.
Metals 14 00115 g013
Table 1. Specimen geometry parameters and test conditions.
Specimen Number1234
Base metal thickness (h/mm)0.511.21.5
Filler metal thickness (n/layer)2
Test temperature (T/°C)Room temperature
Loading rate (v/mm/min)1.0
Table 2. The energy of each part.
EnergyG2G3G4G3 + G4
Theoretical calculation/mJ1188.452695.6889.352785.03
Curve integrating/mJ1108.86--3053.70
Relative error/%7.2-8.8
Table 3. The energy of each part of the different specimens.
Base Metal ThicknessEnergy of Each PartTheoretical
Calculation
Curve
Integrating
Relative Error/%
h = 0.5 mmG2297.11 mJ275.37 mJ7.9
G31541.70 mJ
G478.10 mJ
G3 + G41619.80 mJ1755.01 mJ7.7
h = 1.2 mmG21711.37 mJ1577.54 mJ8.5
G33153.50 mJ
G492.26 mJ
G3 + G43245.77 mJ3561.60 mJ8.9
h = 1.5 mmG22674.01 mJ2516.89 mJ6.2
G34693.50 mJ
G4131.92 mJ
G3 + G44825.42 mJ5274.60 mJ8.5
Disclaimer/Publisher’s Note: The statements, opinions and data contained in all publications are solely those of the individual author(s) and contributor(s) and not of MDPI and/or the editor(s). MDPI and/or the editor(s) disclaim responsibility for any injury to people or property resulting from any ideas, methods, instructions or products referred to in the content.

