Article

Experiments on Oxidation and Combustion Behaviors of Cerium Metal Slice with Slow Heating under O2/Ar Atmospheric Conditions

1
Institute of Materials, China Academy of Engineering Physics, Mianyang 621907, China
2
College of Energy Engineering, Zhejiang University, Hangzhou 310027, China
3
China Academy of Engineering Physics, Mianyang 621900, China
*
Author to whom correspondence should be addressed.
Metals 2024, 14(1), 3; https://doi.org/10.3390/met14010003
Submission received: 28 October 2023 / Revised: 3 December 2023 / Accepted: 14 December 2023 / Published: 19 December 2023

Abstract

:
Cerium (Ce) metal is commonly involved in fires due to its high activity in terms of chemical properties, posing a critical threat to equipment and human health. The oxidization, combustion and oxidization-to-combustion transition of cerium are complicated processes, and a full understanding of detailed evolution behaviors is lacking. A series of experiments are executed to study the oxidation-to-combustion process of cerium metal slices (CMSs) in an O2/Ar atmosphere of 0.3 mg/mL O2. Macroscopic features and micro-transformation behaviors of the physicochemical process are characterized using high-speed imaging, spectroscopy, XRD, AFM, SEM-EDX, and TGA. Results show that the evolution behaviors of CMS present three critical transitions, namely, the oxidation stage (OS), ignition and combustion stage (ICS) of heterogeneous reaction, and extinction stage (ES). The evolutions of CMS structure, oxide layer thickness, surface morphology and micro-zone composition at several key moments during the OS elucidate the transformation mechanism. The surface of CMS is firstly oxidized to Ce2O3 and then to CeO2, and these oxides experience their formation, grow, and gradually aggregate to form dense oxide layers. Fissures have been observed in the micro-morphology of the dense oxide layers at the initial ICS, implying that oxygen could diffuse through the fissures of the oxide layers and fiercely react with molten Ce inside during the ICS. The reactivities of Ce in OS and ICS are quantitatively evaluated with thermodynamic data. The qualitative and quantitative mechanism of the oxidization-to-combustion transition of Ce greatly contributes to the optimal design and safe operation of active metal equipment.

Graphical Abstract

1. Introduction

Cerium has been extensively deployed in many fields, such as catalysts [1,2], energy [3,4], putty fabricated accession [5], metal alloys additives [6,7,8], and anti-corrosion [9]. Regarded as one of the outstanding additions that can improve alloys’ anti-oxidation and ignition resistance [10], comprehensive performance assessments of Ce require the evaluation of a wide range of common accident conditions and adverse impacts due to the activated chemical properties [11,12,13], particularly toxic suspended nanoparticles (diameter ≤ 100 nm) released in Ce-related activities. Nanoparticle emissions are mainly generated from the chemical reactions, e.g., oxidation, ignition and combustion, and nanoparticle size is determined by the evolutive behaviors of the source terms [14,15,16,17]. Concerning Ce metal, these processes couple with each other and can even transition from one to another. As such, the detailed behaviors involved in the transition from oxidation to combustion are complicated, yet a full understanding is lacking [18].
The existing literature has mainly focused on the oxidation behavior of alloys with the addition of Ce [19,20]. Results reveal that stable protective layers of CeO2 and Ce2O3 are formed with the implantation of Ce [21], and the results are compared to the ignition and combustion of Ce alloys [22]. This implies that stable protective layers with similar duplex structures are preferentially formed to retard the ignition kinetic of Ce alloys, thereby increasing their anti-ignition properties. The Ce alloy ignition point also increases as cerium content varies from 0.1 to 0.3 and then decreases at 0.3 [23]. This implies the existence of different and complex evolutive reactions and behaviors (oxidation, ignition, and combustion) between cerium and other alloys components. Consequently, it is crucial and essential to characterize the evolutive behaviors of pure Ce metal (oxidation, ignition, and combustion).
The initial oxidation of bulk Ce metal experiences a parabolic stage [24] and linear stage [25], and the breakaway of oxide layers can appear during the transition stage between the parabolic stage and linear stage. Various experiments have been conducted on the ignition and combustion of titanium (Ti) [26], aluminum (Al) [27,28], and magnesium (Mg) [29], and metal melting, surface heterogeneous combustion and even homogeneous combustion of metal vapor have been observed, while similar experiments on cerium metal are far fewer. At present, most studies focus on the applications of cerium and its nano-oxides, but rarely involve the oxidation and combustion of cerium metal [1,6,9,11]. Ce has a f-orbital electronic structure, indicating that its chemical reactivity is far different from that of Ti, Al, and Mg. The oxidation and combustion behaviors of actinide metal could provide references to the study of Ce metal because of their similarities in terms of electronic structures and chemical properties. The oxidation of actinide metal can form sandwich oxide layers, and its combustion mainly occurs on the surface [30,31]. Moreover, the detailed evolution behaviors and the features of oxide layers displayed during the shift of actinide metal and other active metals from oxidation to combustion are seldom mentioned.
In view of the fact that the oxidation-to-combustion transition of a cerium metal slice (CMS) is complicated, the detailed evolution behaviors and transition features still need further elucidation. This study focuses on characterizing the refined physical phenomena of CMSs and interpreting their evolution behaviors during the oxidation-to-combustion transition. First, materials and methods on CMS oxidation, ignition and combustion were introduced, and on-line measurements were carried out to characterize typical physio-chemical phenomena. To delve into evolutionary physical and chemical behaviors, detailed analyses were conducted on exploring the complex transformations of compositions and microscopic features of CMS during the oxidation stage. Moreover, final combustion products were surveyed to evaluate combustion behaviors. Subsequently, a dynamic behavior experiment was carried out to assess the reactivity of CMS in the whole oxidation-to-combustion process. Overall, a comprehensive understanding of the transition during CMS oxidation to combustion is obtained though this experiment.

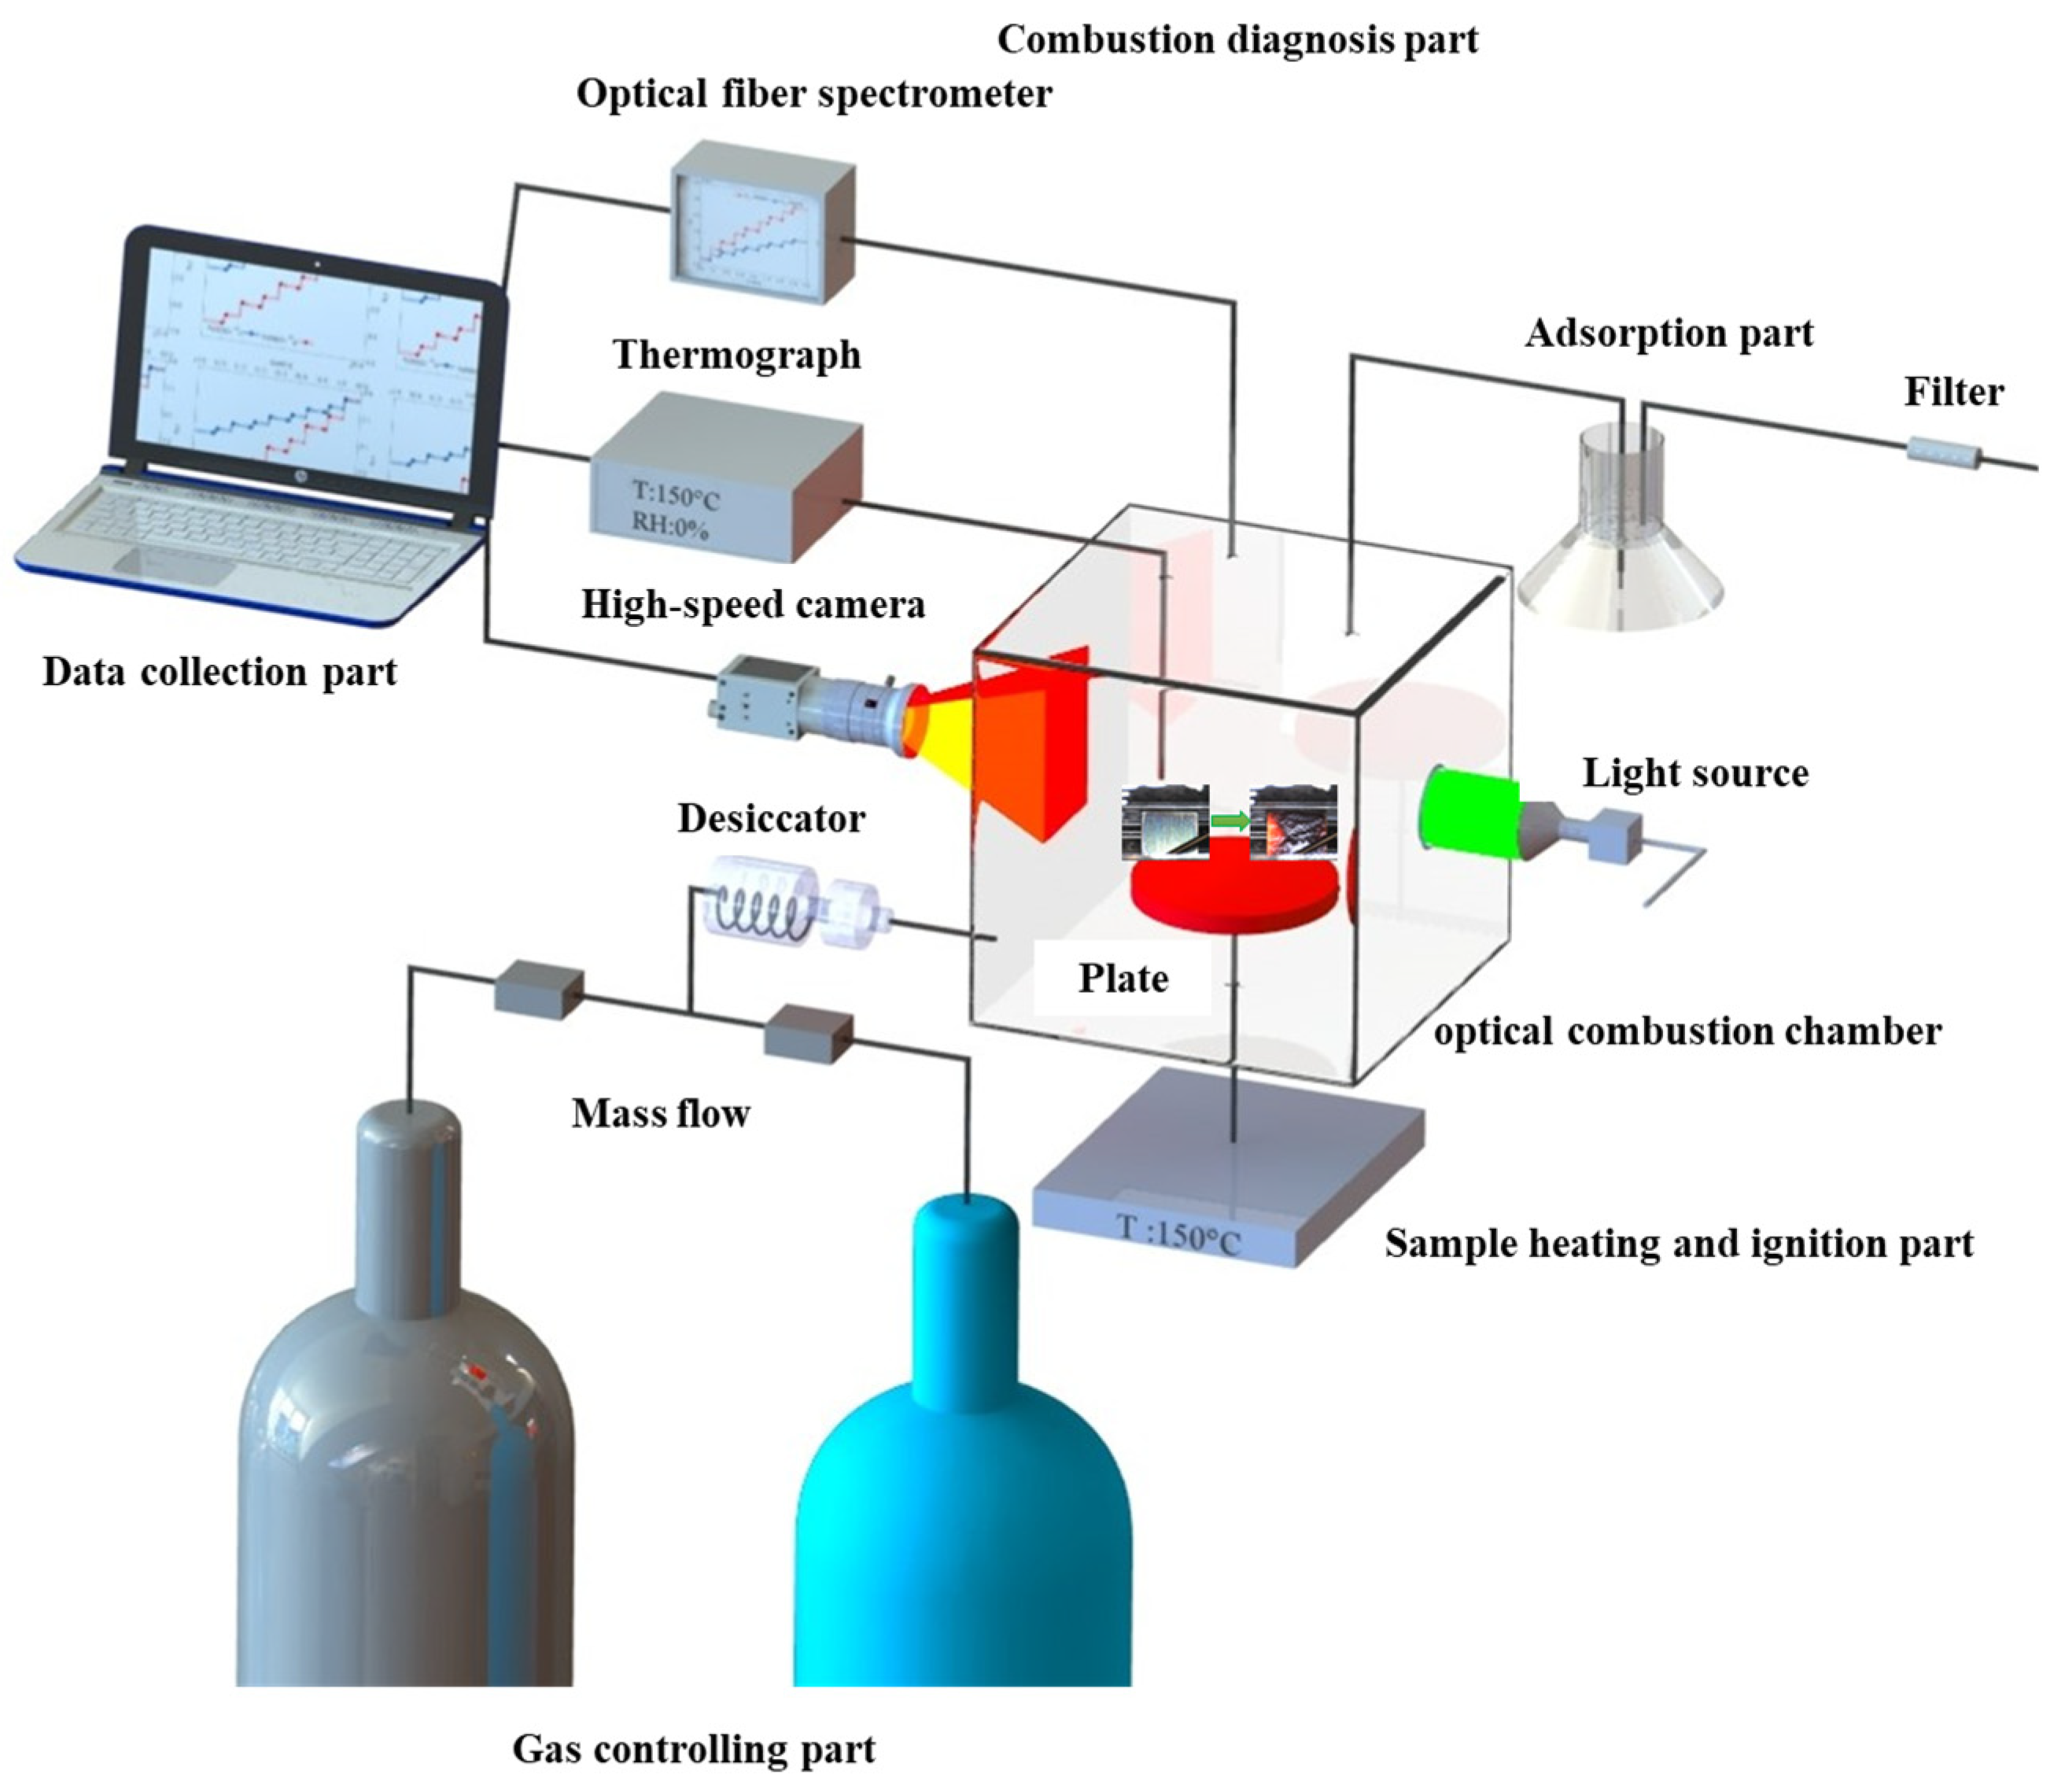
2. Materials and Methods

Figure 1 schematically shows the ignition and combustion experimental system (ICES) of CMS, and it mainly includes four parts, namely, a sample heating and ignition part, a combustion diagnosis part, a gas-controlling part and a data collection part. The sample heating and ignition part had an optical combustion chamber, and the outer wall of the chamber was made of quartz, with a quartz base plate properly positioned in the center of the bottom. There were three holes in the outer wall, including an air inlet, an air outlet and a thermocouple interface. These connected to the gas-controlling part, tail gas dealing system and data collection part, respectively. The CMS (length × width × thickness, 10 mm × 10 mm × 1 mm) used in tests was produced by Ling Chuang New Material Technology Co., Ltd., Suzhou, China, with the total impurity content below five ten-thousandths. The CMS was polished using sandpaper (500 mesh) and then cleaned with a mixed solvent of alcohol and nitric acid (volume ratio, 20:1). The fresh CMS was placed on the quartz base plate in each test. For the oxidization and ignition of the CMS, the plate was heated at a rate of 15 °C/min to a scheduled temperature (e.g., 500 °C in this work), and the CMS was oxidized or even ignited to burn, while the reaction gas with specific oxygen concentration flowed through the chamber continuously. The tail gas was conveyed into a particle dissolution, absorption and filtration device, and then discharged into the atmosphere after purification.
For the combustion diagnosis part, a high-speed color camera (MICROVIEW, Beijing, China) with image resolution of 1920 × 1080 pixels was applied to visualize and monitor the oxidization-to-combustion behaviors of CMS with a frame rate of 200 fps. The emission spectra along with the Ce-O reactions were measured using an optical fiber spectrometer (QEP 00567, Ocean Optics, Dunedin, FL, USA) with spectral range of 380–780 nm and sampling frequency of 200 Hz, and the spectral resolution was 0.3 nm. The surface temperature was measured using a S type thermocouple (PT-RH, WRPB-1, Chengdu, China) connected to a sample during the oxidation to combustion of CMS, and temperature precision was 1.5 °C. In all the experiments, the instruments of the combustion diagnosis part were turned on for measurement at the beginning of heating and stopped until CMS was completely burned.
In order to reveal the detailed surface reaction behaviors of CMS, the samples were quenched at several transition moments during oxidization, and then the quenched samples were analyzed. The reflection spectra, ranging from 200–1100 nm along with the Ce-O reactions, were measured using an optical fiber spectrometer (Brolight BIM-6002A-01, Chengdu, China) in order to measure the thickness of oxide layers. The surface roughness of the oxide layers was characterized with an atomic force microscope (AFM, SOLVER-P47-SMENA with a NSG11S silicon cantilever), and the AFM apparatus had a curvature radius of 10 nm, a tip height of 10–15 μm and a taper angle of ≤22° in tape recording mode. The surface micro-morphology and composition of the oxidized products were observed using a field-emission scanning electron microscopy (FE-SEM) combined with energy-dispersive X-ray spectroscopy (EDX, Hitachi SU-70, Tokyo, Japan). The crystal structure of the condensed oxidized and combustion products was identified via X-ray diffraction (XRD, XPert Powder, Almelo, The Netherlands) analysis performed using CuKα radiation with a graphite monochromator (the wavelength is 1.5406 Å), and the diffraction angle ranged from 5° to 90°. In addition to the surface characterization during oxidization, the surface of burnt cerium samples were also analyzed. The morphologies of combustion-condensed products were observed with a metallurgical microscope (Leica, Chengdu, China) with a magnification of two thousand times.
In addition, Ce reactivity during the oxidation-to-combustion transition was assessed using isothermal thermogravimetric analysis (TGA) with an SDT Q600 analyzer from TA Instruments. A thin slice with a thickness of 1 mm was used. A test using about 7 mg of Ce metal was performed inside a 70 µL aluminum crucible. The experimental protocol was divided into two stages. The first one, carried out under 100 mL/min high-purity argon flow, consisted in an initial period of 5 min at 30 °C, which was used to initialize the system. The second stage was a linear heating rate of 10 °C/min from 30 °C to 500 °C, carried out by switching argon to a mixture of argon and oxygen with the same flow rate. All the gas was purchased, and thad an impurity gas content of 0.1%.

3. Results and Discussion

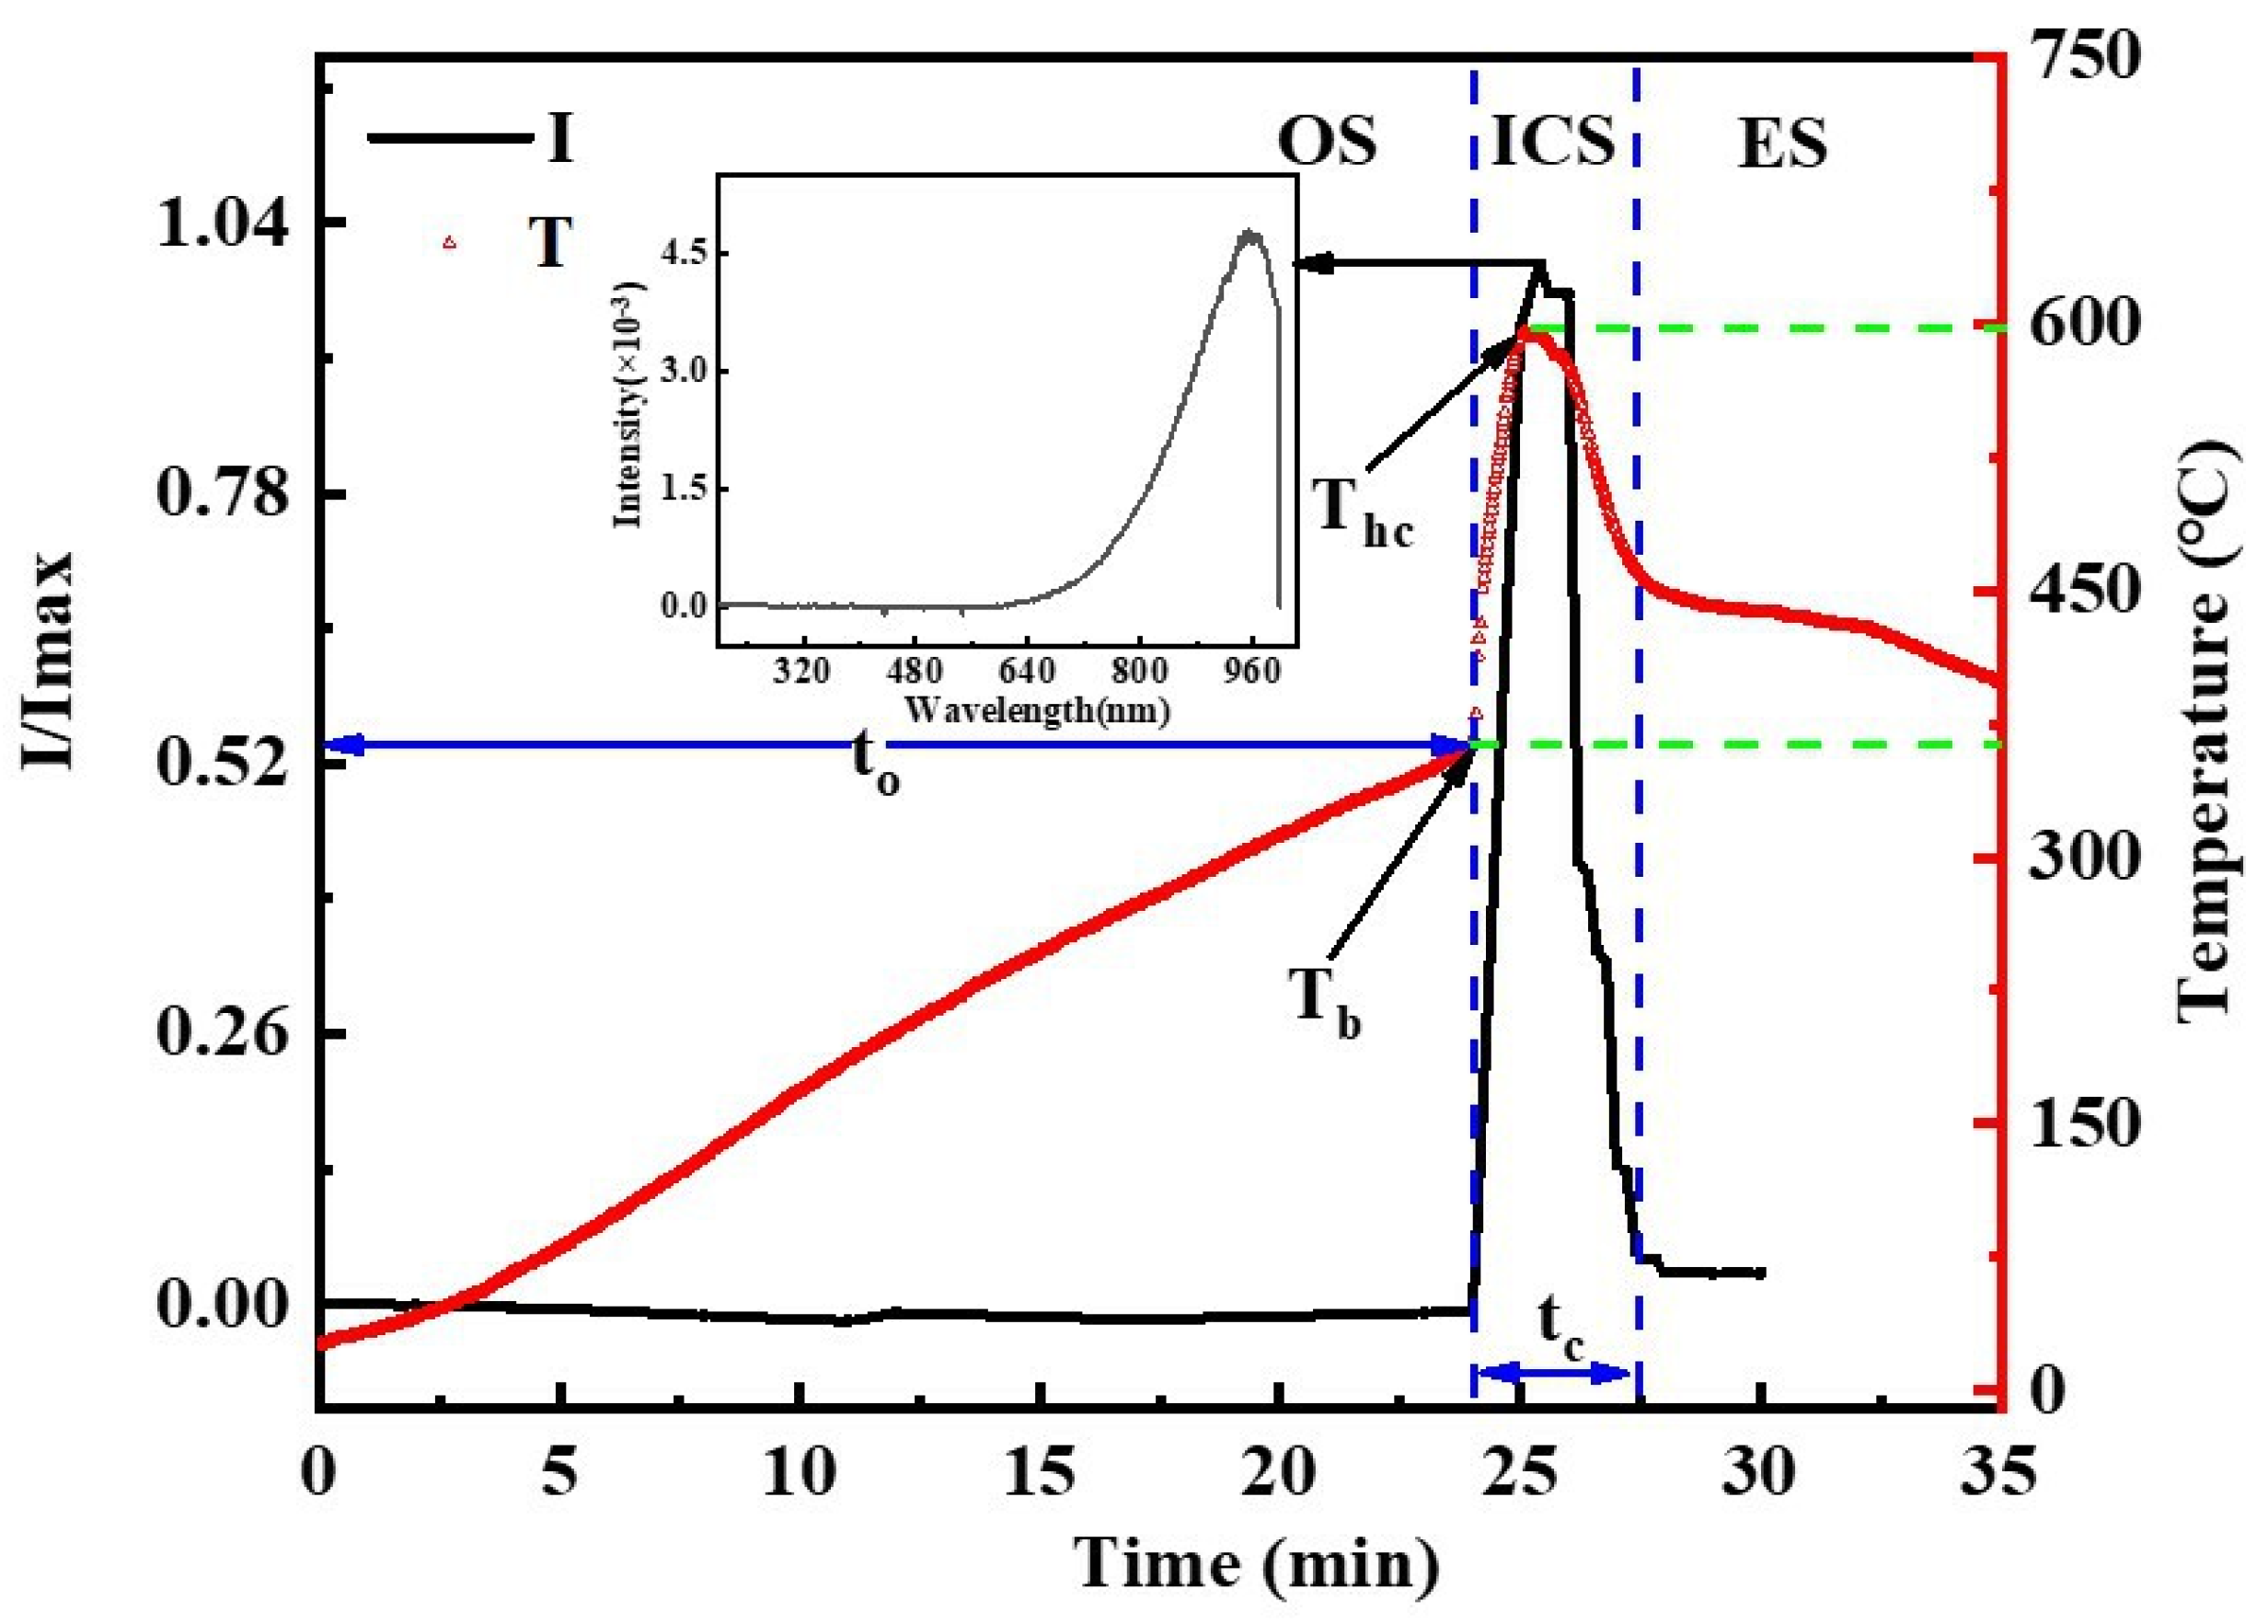
3.1. The Oxidation-to-Combustion Transition of CMS

Figure 2 depicts the typical evolution of oxidation-to-combustion transition of CMS in an atmosphere of 0.3 mg/mL O2. Overall, the CMS temporarily experienced the formation and growth of oxide layers (as shown in Figure 2a–c), blush and flash (Figure 2d). Then, shrinkage and self-expansion accompanied the melting of the sample and the final extinguishment (Figure 2e). The sample blush and flash are assertive evidence of the combustion of Ce. Therefore, the CMS oxidation-to-combustion process can be divided into an oxidation stage (OS), ignition and combustion stage, (ICS) and extinction stage (ES). These correspond, respectively, to heating times of 0–24.0 min, 24.0–27.5 min, and after 27.5 min for the case in Figure 2.
The surface temperature and thermal radiation intensity of the sample were obtained versus the Ce-O reaction time, with the start time of heating set as time t0, as illustrated in Figure 3. This shows that the surface temperature gently increases in the OS, where the sample color transfers from silvery white, brown, blue, and cyano-blue-brown to dark blue-gray. Then, the sample blushes at around 24 min and the surface temperature experiences a transition from a gentle increase to quick rise, resulting from the initial combustion of cerium. The instantaneous and significant enhancement of thermal radiation intensity at 24 min also indicates combustion. Shortly, the surface temperature drops quickly after the surface temperature reaches the maximum temperature Thc, and the thermal radiation intensity also experiences a precipitous decline. Both are caused by the steep consumption of Ce due to combustion. Soon afterwards, the sample color changes to gray and Ce combustion enters the ES. After completely burning, the sample turns into a grayish-brown turtle shell-like oxide and the morphology remained stable in 0.3 mg/mL O2.
It was observed that the luminescence and flash mainly originated from the inner sections of Ce sample, implying that most of the combustion reaction occurred inside the sample, and the primary mechanism of the combustion reaction was heterogeneous combustion under the condition of 0.3 mg/mL O2. The thermal radiation spectrum was acquired at the moment of the highest combustion temperature (Thc), as illustrated by the chart in Figure 3. According to the spectrum at the moment of the highest degree of intensity, rare emission spectral characteristic peaks appear in the range from 200 to 1000 nm, implying that gas phase combustion reaction rarely appeared at 0.3 mg/mL O2 in the test.
Four parameters, e.g., ignition delay time (to), burning point (Tb), Thc and combustion time (tc) are used to characterize CMS oxidation-to-combustion reactions. The time between the beginning of heating and combustion is defined as to, and the duration time between the start and end of combustion is designated as tc. The surface temperature at the moment of flash is defined as Tb, and the maximum surface temperature detected by the thermocouple is regarded as Thc. Specially, the combustion time could be further divided into the heating-sustained ignition time (tic) and the self-sustained combustion time (tsc), which are not mentioned in this article. The key parameter value of CMS combustion was obtained from the T-t curve in Figure 3. We observed that the values of the summit and breakpoint were around 594 °C (Thc) and 365 °C (Tb), respectively. The to and tc were separately around 24 min and 3.5 min.

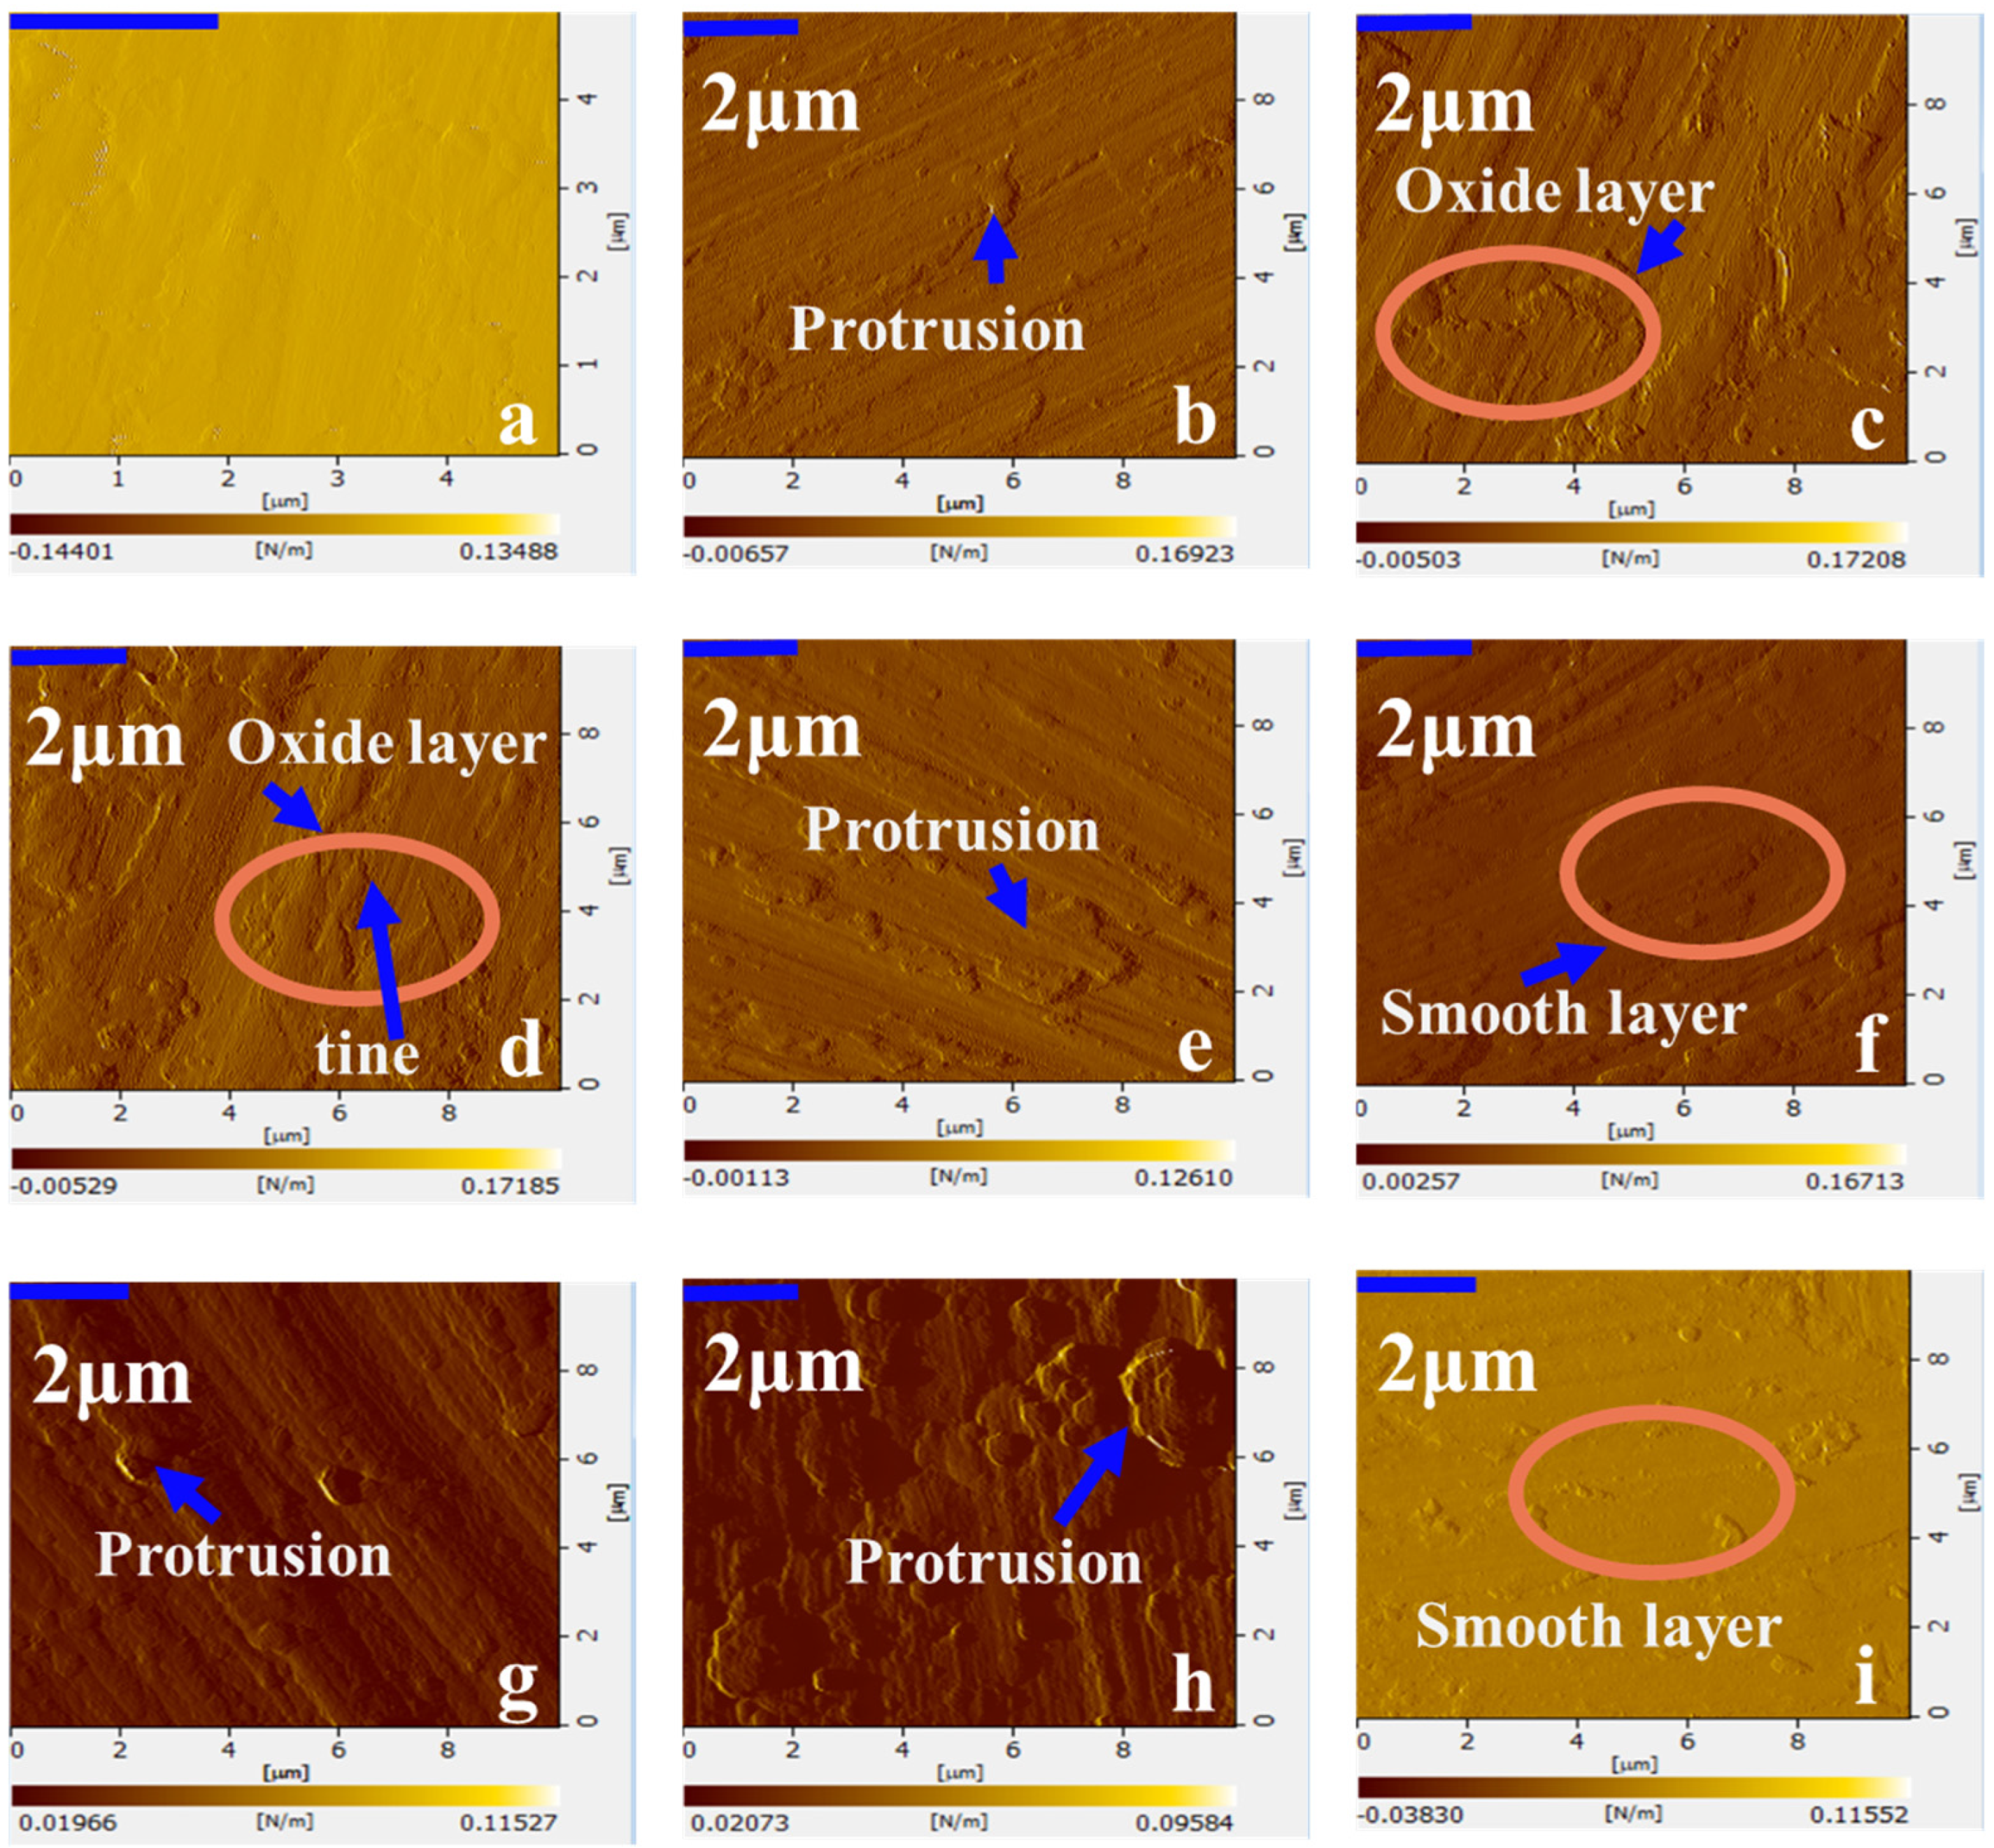
3.2. The Oxidation Reactions and Behaviors of CMS

The transformation of Ce-O composition indicates the oxidation reactions and behaviors. In order to explore the detailed oxidation reaction and behavior of CMS during the OS, the surface composition of Ce samples at key transition moments were analyzed. Figure 4 shows that XRD peaks of the sample shift with Ce-O oxidation time (e.g., peaks at the characteristic diffraction angle 2θ of 30.06°, 15.69° and 28.59° individually represent Ce, Ce2O3 and CeO2, which are provided in the diffraction databases ICCD/JCPDS PDF retrievals [LEVEL-1 PDF, sets 1-54], and the specific record numbers are 30.063° [PDF·08-0056], 14.598° [PDF·44-1086], and 28.554° [PDF·34-0394], respectively), indicating the gradual oxidation of CMS in the OS. We observed that Ce is firstly oxidized to Ce2O3, and the structure and components of the sample surface remained unchanged within 8 min, implying that color deepening during over time is mainly induced by the formation and growth of Ce2O3 without it being further oxidized. Then, the sample color transferred from brown to blue within 8 min to 14 min, as shown in the right of Figure 4. Meanwhile, Ce2O3 was further oxidized to CeO2, resulting in the coexistence of CeO2, Ce and Ce2O3 at that moment. As Ce2O3 was gradually consumed, the components of the sample surface became merely a mixture of CeO2 and Ce within 14 min to 17 min, accompanying the color of the surface oxide layer changing from blue to cyano-blue-brown. Afterwards, most of the Ce disappeared during 17 min to 21 min, indicating that Ce on the sample surface was almost oxidized to CeO2. The surface color gradually darkened after 21 min, and the main component of the sample surface was CeO2, meaning that 21 min was sufficient to form a ceria oxide layer on the sample surface. Besides, the average grain size of the surface oxide layers was calculated though D = Kλ/βcosθ using the XRD data, where D refers to crystallite size (nm), K is 0.9 (Scherrer constant), λ is 0.15406 nm (the wavelength of the X-ray sources), β is FWHM (radians), and θ is peak position (radians). As shown in Figure 4, the average grain size increased from 0 min to 12 min and 14 min to 16 min, and decreased with the formation of CeO2 at 14 min. After cerium was further oxidized around 16 min, the average grain size gradually decreased until burning, meaning that primary grains were persistently formed and the formation rates were quicker than those of grain growth.
The oxide layer’s thickness of Ce intermediate oxide can be measured using the reflection spectrum. This is used to calculate the growth rate and even reaction rate of Ce and O during OS. As shown in Figure 5, the oxide layer thickness of Ce samples gradually increases to around 300 nm within 21 min, with surface color changing from silvery to dark blue-gray. The overall thickness growth rate of the oxide layers is 12.6 nm/min. Moreover, the oxide layers grow slowly from 4 min to 8 min and 19 min to 21 min, and thickens rapidly from 8 min to 19 min. The relation between the oxide layers thickness and oxidation reaction time shows that the growth of Ce oxide layers can be divided into three stages, as illustrated in Figure 5. At stage 1 and stage 3, the average growth rate of the oxide layers thickness is slower than that of stage 2. At the initial moment of stage 1, the growth rate of oxide layers thickness increases rapidly and then reduces, which conforms with a non-linear law. At stage 2, the growth rate of the oxide layers thickness is approximately 28.4 nm/min, and the growth of Ce oxide layers conforms with a linear law, implying that the breaking of oxide layers could persistently occur in the oxidation transition process of CMS. Furthermore, as mentioned in Figure 4, Ce is oxidized to Ce2O3 from 4 min to 8 min and Ce2O3 is oxidized to CeO2 from 8 min to 14 min, implying that the oxidation reaction rate of Ce is slower than that of Ce2O3 during the OS. It should be noted that the thickness of oxide layers increases slowly, implying that stable oxide layers beyond 300 nm could form after 21 min, and then the oxidation stage of CMS would transfer to the ignition and combustion stage with further Ce oxidization.
The surface micrographs of CMS samples at the critical oxidation moment were obtained via SEM in order to depict the formation and growth of the oxide layers. The surface of fresh CMS shown in Figure 6a is almost smooth, with only visible pits and scattered flecks. With the increase in heating time, it has been observed that a mass of aggregated grains appears on the surface, yielding an irregular Ce sample surface, as shown in Figure 6c. With the increasing oxidation of the sample, the aggregated grains vanish in Figure 6d, implying that the scattered oxides gradually grow to be a film on the crude surface. Fissures on the surface, developing as a result of the breakup of the film due to thermal expansion, appear in Figure 6d. In the OS, the oxidation rate is determined by the diffusion flux of oxygen anion and cerium cation in the adhesive oxide layers, which is inversely proportional to oxide layer thickness according to the ionic diffusion oxidation model. Therefore, the bulges and notches on the surface, as shown in Figure 6e, are speculated to be mainly caused by the rupture of oxide layers. This leads to the diffusion of Ce from the inside the sample outwards through the fissures, inducing the formation of significant amounts of Ce oxides from 12 min to 14 min, and therefore the uneven surface is displayed afresh at 14 min. In this stage, the enhancement of oxidation results in the quick increase in oxide layer thickness, as evidenced in Figure 5. Then, the nonuniform surface gradually fades away from 14 min (Figure 6e) to 17 min (Figure 6g). Subsequently, the sample experiences the formation of fresh oxide layers at 19 min (Figure 6h) and oxide layer thickening immediately afterwards (Figure 6f). More details of the samples can be found from the enlarged surface morphologies of zone 1 and zone 2. These, respectively, represents two kinds of intermediate reaction products formed with different reaction rates, as the charts illustrated in Figure 6. This implies that active sites persistently exist on the surface of CMS during the oxidation, and the initial oxidation reaction rate is substantially faster than that at other sites. With the strengthening of the Ce-O oxidation reaction, the reaction rates at the active site and the other sites approach one another due to the formation of stable oxide layers, and thus the surface morphologies of zone 1 and zone 2 tend to be similar (Figure 6i).
The surface roughness of the CMS samples at the critical oxidation moment was analyzed via AFM, as shown in Figure 7. The surface of the fresh CMS is smooth (Figure 7a) and dotted oxide protrusions tend to appear first (Figure 7b). Then, the oxide protrusions aggregate to form sheet oxides (Figure 7c), which is an early sign of oxide layer formation. In addition to the further oxidation of the sample, more sheet oxides are formed on the concave and convex surface (Figure 7d). Subsequently, the protrusions obviously reappear and grow to be smooth oxide layers with the existence of rare dotted oxide bumps (Figure 7e–i). As the oxidation rate gradually increases with the CMS surface temperature, the oxidation rates of the CMS sample become faster than the spilling of oxide layer fragments, inducing an increase in the contact force between the probe of AFM and the sample surface. This indicates that the CMS sample expands and thickens during the oxidation. However, it is observed that the interfere force decreases from 8 min to 12 min, verifying the breakage and spillage of Ce oxides during OS.
Table 1 shows that the Ce-O ratios in the micro-zone of CMS sample surfaces experience undulate transformations with oxidation time. The rise and fall of Ce-O ratios are considered to be induced by the combination of the oxide layers crack, Ce and O diffusion, and Ce-O redox reactions. The content of Ce in zone 2 is lower than that in zone 1 after about 4 min oxidation, demonstrating a faster oxidation rate in zone 2 than that in zone 1, which occurs due to the existence of obvious surface defects in zone 2. The content of Ce increases in zone 2 at 8 min, while it decreases in zone 1, implying the appearance of fresh Ce on the surface. As the formation of dense oxide layer leads to the fading of surface defects and thus a reduction in the heat released from the inner Ce-O reaction, the internal thermal stress can accumulate and provide impetus to the disruption of the oxide layers. Therefore, the increase in Ce content in zone 2 originates from the crack of the oxide layers because of the limited diffusion of Ce inside at the initial oxidation stage. Then, the Ce content increases in zone 1 and decreases in zone 2 at 12 min, also implying the breakage and spilling of the oxide layers. Subsequently, Ce content in both zone 1 and zone 2 decreases from 12 min to 16 min, meaning that the cerium on the CMS sample surface is continuously oxidized. Moreover, the Ce content of zone 1 is lower than that of zone 2, confirming that the reaction rate of Ce in zone 2 is faster than that in zone 1. At 17 min, the Ce content in zone 1 equals that in zone 2, and both of these are higher than the content at 16 min, implying that a different route induced the increase in Ce content. Since the rise of the sample temperature, the diffusion of fresh Ce from the inner of CMS sample is gradually accelerated, and thus the increases in Ce content in zone 1 and zone 2 mainly originate from the diffusion of the inner fresh Ce. The fresh Ce in zone 2 and zone 1 can be quickly oxidized, causing Ce content to decrease before the ignition of the CMS sample. Besides, the Ce-O ratios of zone 2 and zone 1 gradually approach 0.3, indicating that the composition of oxide layers achieves stability accompanying the disappearance of zone 1 and zone 2, as shown in Figure 6i and Figure 7i.
With a joint observation of the micro-morphologies, compositions, and structure of the final condensed oxidation sample of the CMS, it can be found that the surface is approaching smoothness and stability with few fissures and protrusions. This implies that the stable oxide layers continuously thicken after 21 min. Consequently, the dense oxide layers without significant defects restrict the cerium oxidation reaction by decreasing the diffusion rates of Ce and O. Moreover, this leads to the accumulation of reaction heat and intermediate active oxides inside the sample. With the continuous rise in heating temperature, the Ce oxide layers crack to a large extent due to the thermal expansion stress, as shown in Figure 2. Since the oxide layers acting as a diffusion barrier can be weakened by surface defects and fissures, surface defects and fissures provide a new short-circuit diffusion route, and thus oxygen can fluently diffuse though the oxide layers and rapidly react with the intermediate activate oxides and the fresh Ce inside. Therefore, the breakage behavior of oxide layers contributes to accelerating the Ce oxidation kinetics, inducing Ce ignition, and then the transition from the oxidation stage to the combustion stage.

3.3. The Combustion Behaviors of CMS

At the initial combustion of the CMS sample, the oxide layers envelop the unreacted Ce and the reaction rate mainly depends on the diffusion of oxygen. Therefore, the cracking of the oxide layers, caused by the melting and expansion of the inner Ce at ICS greatly contributes, to impelling the process of the combustion reaction. In order to investigate the combustion behaviors of CMS, the micro-morphologies of the combustion products were obtained with a magnification of 2000 times, as shown in Figure 8. It is observed that the surface of condensed combustion product at the initial of ICS is covered with fine granules and fissures (Figure 8b), which implies a significant spilling or diffusion of Ce during the ICS. Soon afterward, Ce starts to burn intensively, releasing large amounts of heat, and then sinters the fine granules. Thus, the surface morphology of the final Ce condensed combustion product is smooth, with oxide granules and bumps rarely observed on the product surface. In the atmosphere of 0.3 mg/mL, the Ce inside the CMS is melted and burns fiercely. As such, it is concluded that significant amounts of oxygen can diffuse into the inner of the sample and react with the molten Ce during the combustion of CMS. Moreover, Ce gas emitted from the inner of the sample could be depleted by oxygen in fissures, resulting in the homogeneous combustion of local Ce vapor, which rarely occurs in the surrounding gas. In addition, the micro-morphology of the internal condensed product was collected during the CMS combustion (Figure 8d), confirming that Ce inside was melted and internal combustion existed based the evidence of smooth surface and oxide grains inside.

3.4. The Oxidation and Combustion Reactivity of Cerium

Detailed kinetic behavioral assessments are conducted and mechanisms of Ce oxidation and combustion are explored via TGA. The product weight percentage shift with Ce-O reaction time is shown in Figure 9. It is observed that the weight percentage of the final product is around 123% of the initial sample. The data suggest that the overall chemical reaction of Ce can be expressed as the following Equation (1).
Ce + O2 → CeO2
The overall reaction is confirmed by the component and structure of the final condensed combustion product. The chart in Figure 9 shows that the strongest characteristic peak (2θ = 28°) is the crystalline CeO2 with an Fm3m structure, while the characteristic peaks of the crystalline Ce2O3 (2θ = 16°) and Ce (2θ = 30°) are absent. Both the TGA analysis and XRD indicate that the primary component of the final combustion-condensed products is CeO2.
The reactivity of CMS during the oxidation-to-combustion process can be inferred from the chemical reaction rate, which is calculated by the change of the sample weight at a certain time. The average reaction rate (wa) of Ce can be calculated using the Equation (2), where m0 and mf are, respectively, the masses of the initial sample and final oxidation products, and t0 and tf are the time of the starting and end of oxidation.
w a ( C e ) = ( m f m 0 ) / ( t f t 0 )
Moreover, the instantaneous reaction rate (wi) of cerium can be calculated using Equation (3), which is obtained through differentiating the mass variation of the sample with Ce-O reaction time. The mi is the sample mass at the moment of ti during the oxidation-to-combustion reaction of cerium.
w i ( Ce ) = dm i / dt i
Therefore, the wa is around 0.036 mg/min, and the max wi is 0.25 mg/min, and both can be applied to assessing the reaction degree and kinetics of Ce during the CMS oxidation-to-combustion shift.
The variation in Ce-O reaction heat flux (Q) and its differentiation (QD) are illustrated in Figure 9. It shows that Q equals zero at 5 min (t1), meaning the heat released from the Ce-O reaction equals the heat consumed. After t1, the Q moderately increases, firstly with the further oxidation of cerium, and begins rising sharply at t2. At t2, the surface temperature of the Ce sample is above 365 °C, leading to Ce is ignited accompanying with the occurrence of glowed. After t2, Ce starts burning. At t3, QD reaches QDmax and then gradually slowing down, meaning the reaction marks continuous enhancement from the time of t2 to t4. As the release heat reaches Qmax, its differentiation (QD) is zero at t4, and the corresponding reaction rate is wmax. Then, Q quickly reduces, implying the subsequent combustion rate of Ce slows down because of the consumption of Ce. After t5, the combustion of CMS enters the ES, and the mass of the cerium metal becomes zero, resulting in the Ce-O reaction stopping.
The activation energy of the chemical reaction represents the energy required for the beginning of the Ce-O reaction, and is used to evaluate the ease of reaction and its mechanism. The relationship between the activation energy (Ea) and the reaction heat flux (Q) is formulated as Equation (4),
Q = q w = q k 0 exp ( E a R T ) C ( O 2 ) ,
where C(O2) refers to the oxygen concentration and is a constant value in this work, q is reaction heat, k0 is pre-exponential factor, w is reaction rate, R is the gas constant, and Ea is activation energy [32]. Equation (4) indicates that lnw is proportional to −1/RT with a given Ce-O reaction mechanism. As shown in Figure 10, the Ea of Ce-O reaction varies with the reaction time and temperature, suggesting the existence of more than one combustion mechanism exist in the oxidation and combustion process of CMS. Moreover, the Ea of cerium combustion is approximately equals that of the oxidation reaction during the linear oxidation stage, and both are around 30.124 kJ/mol. The result implies that the reaction mechanism of Ce at linear oxidation stage is the same as that at combustion stage, and Ce is directly oxidized into CeO2 without intermediate reaction occurring during the combustion process of CMS.

4. Conclusions

The oxidation-to-combustion of CMS under a 0.3 mg/mL oxygen concentration has been experimentally investigated, with findings on the characteristics and evolution behaviors obtained as below.
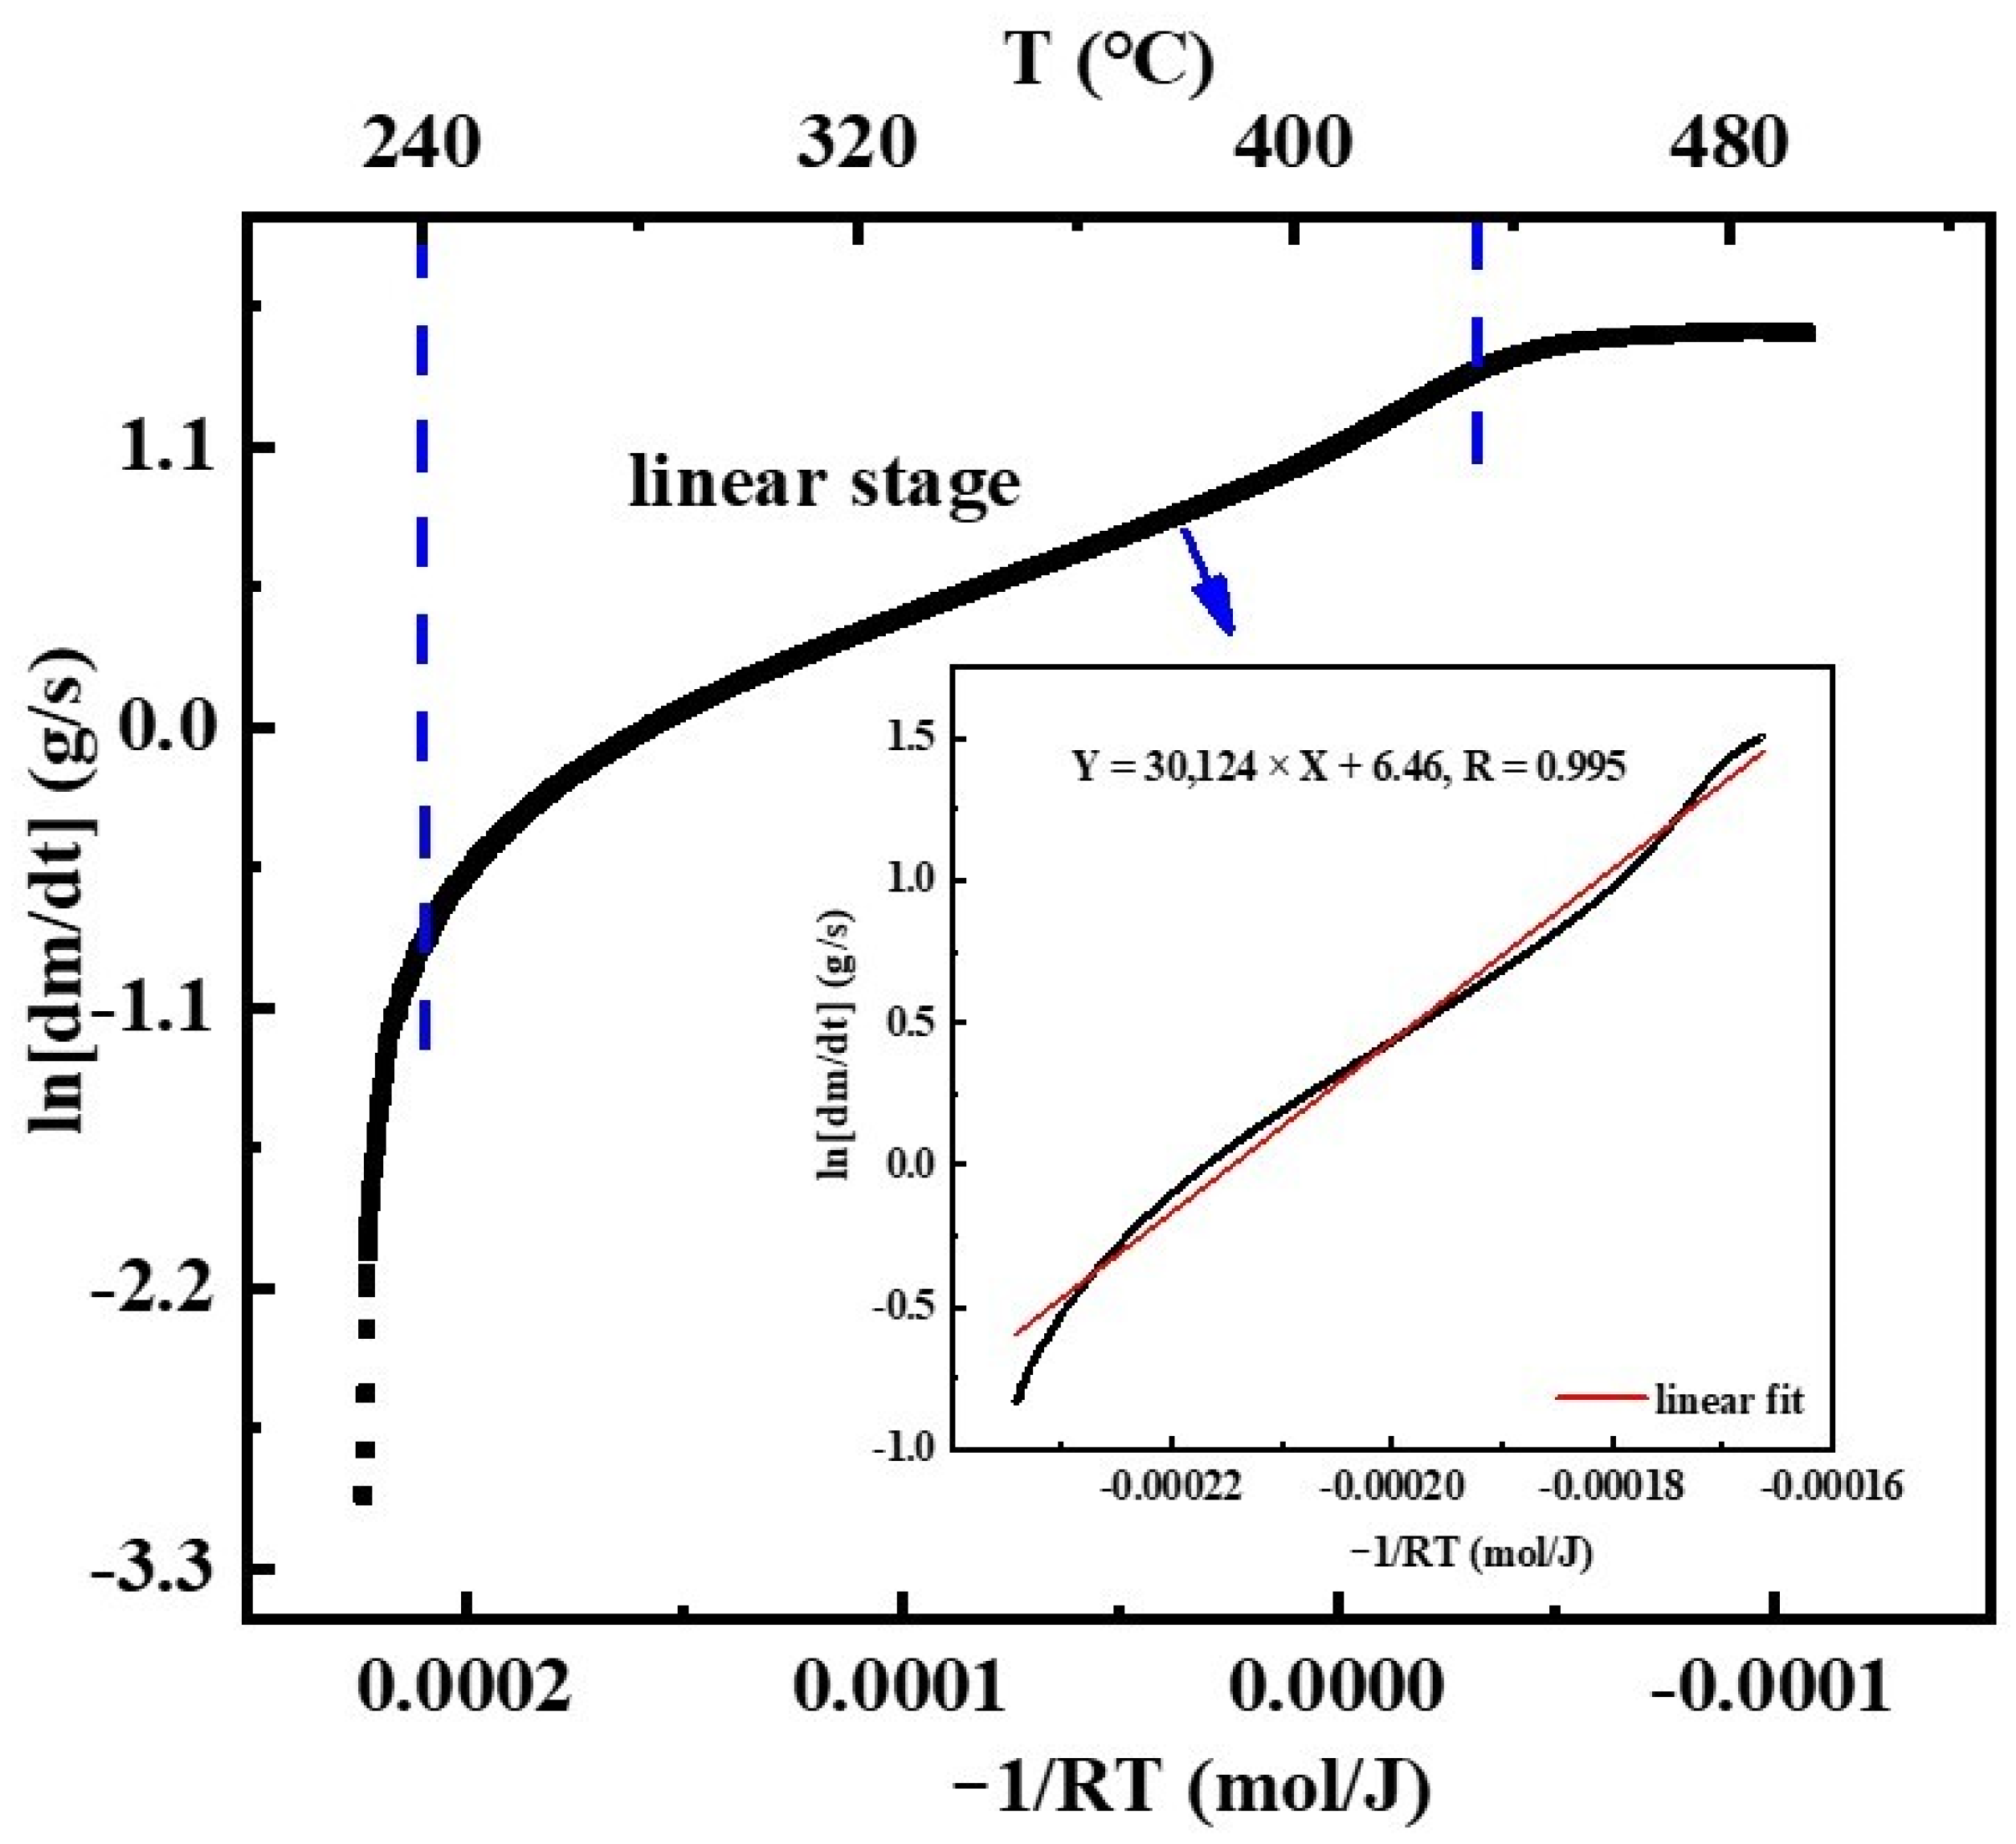
  • According to the evolutions of surface morphology, surface temperature and emission spectrum, the oxidation-to-combustion process of CMS can be divided into the oxidation stage (OS), ignition and combustion stage (ICS) and extinction stage (ES).
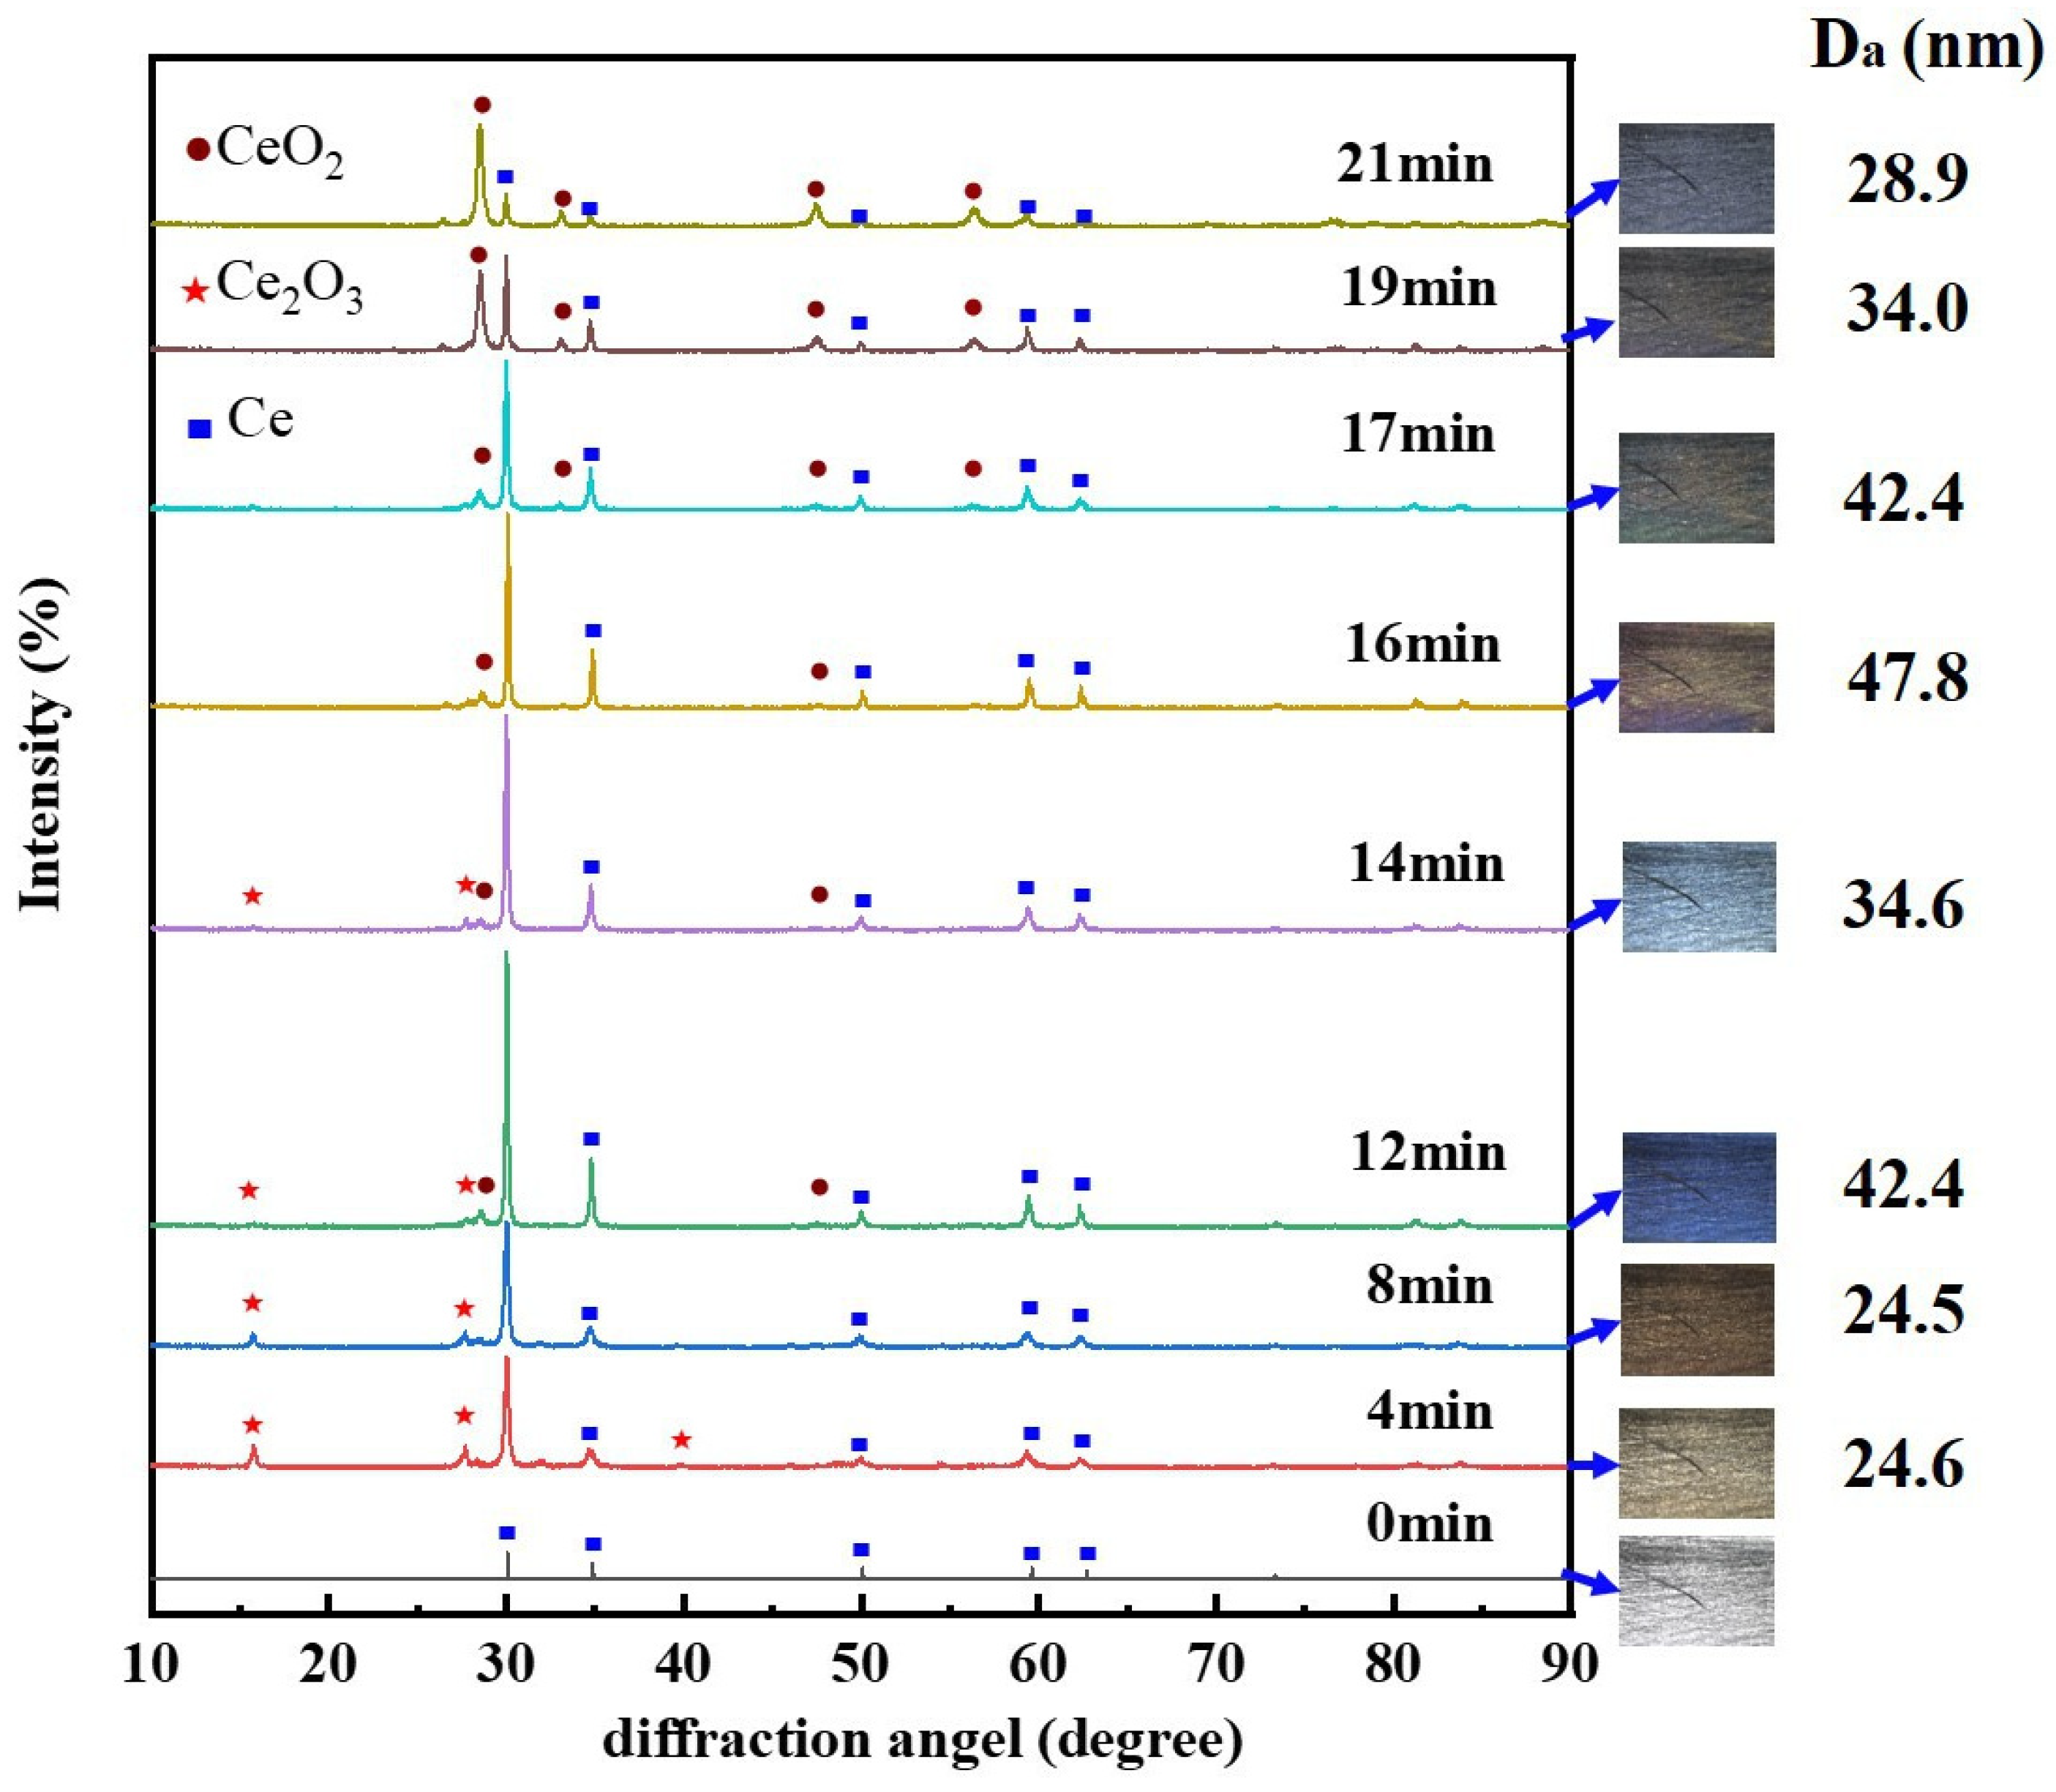
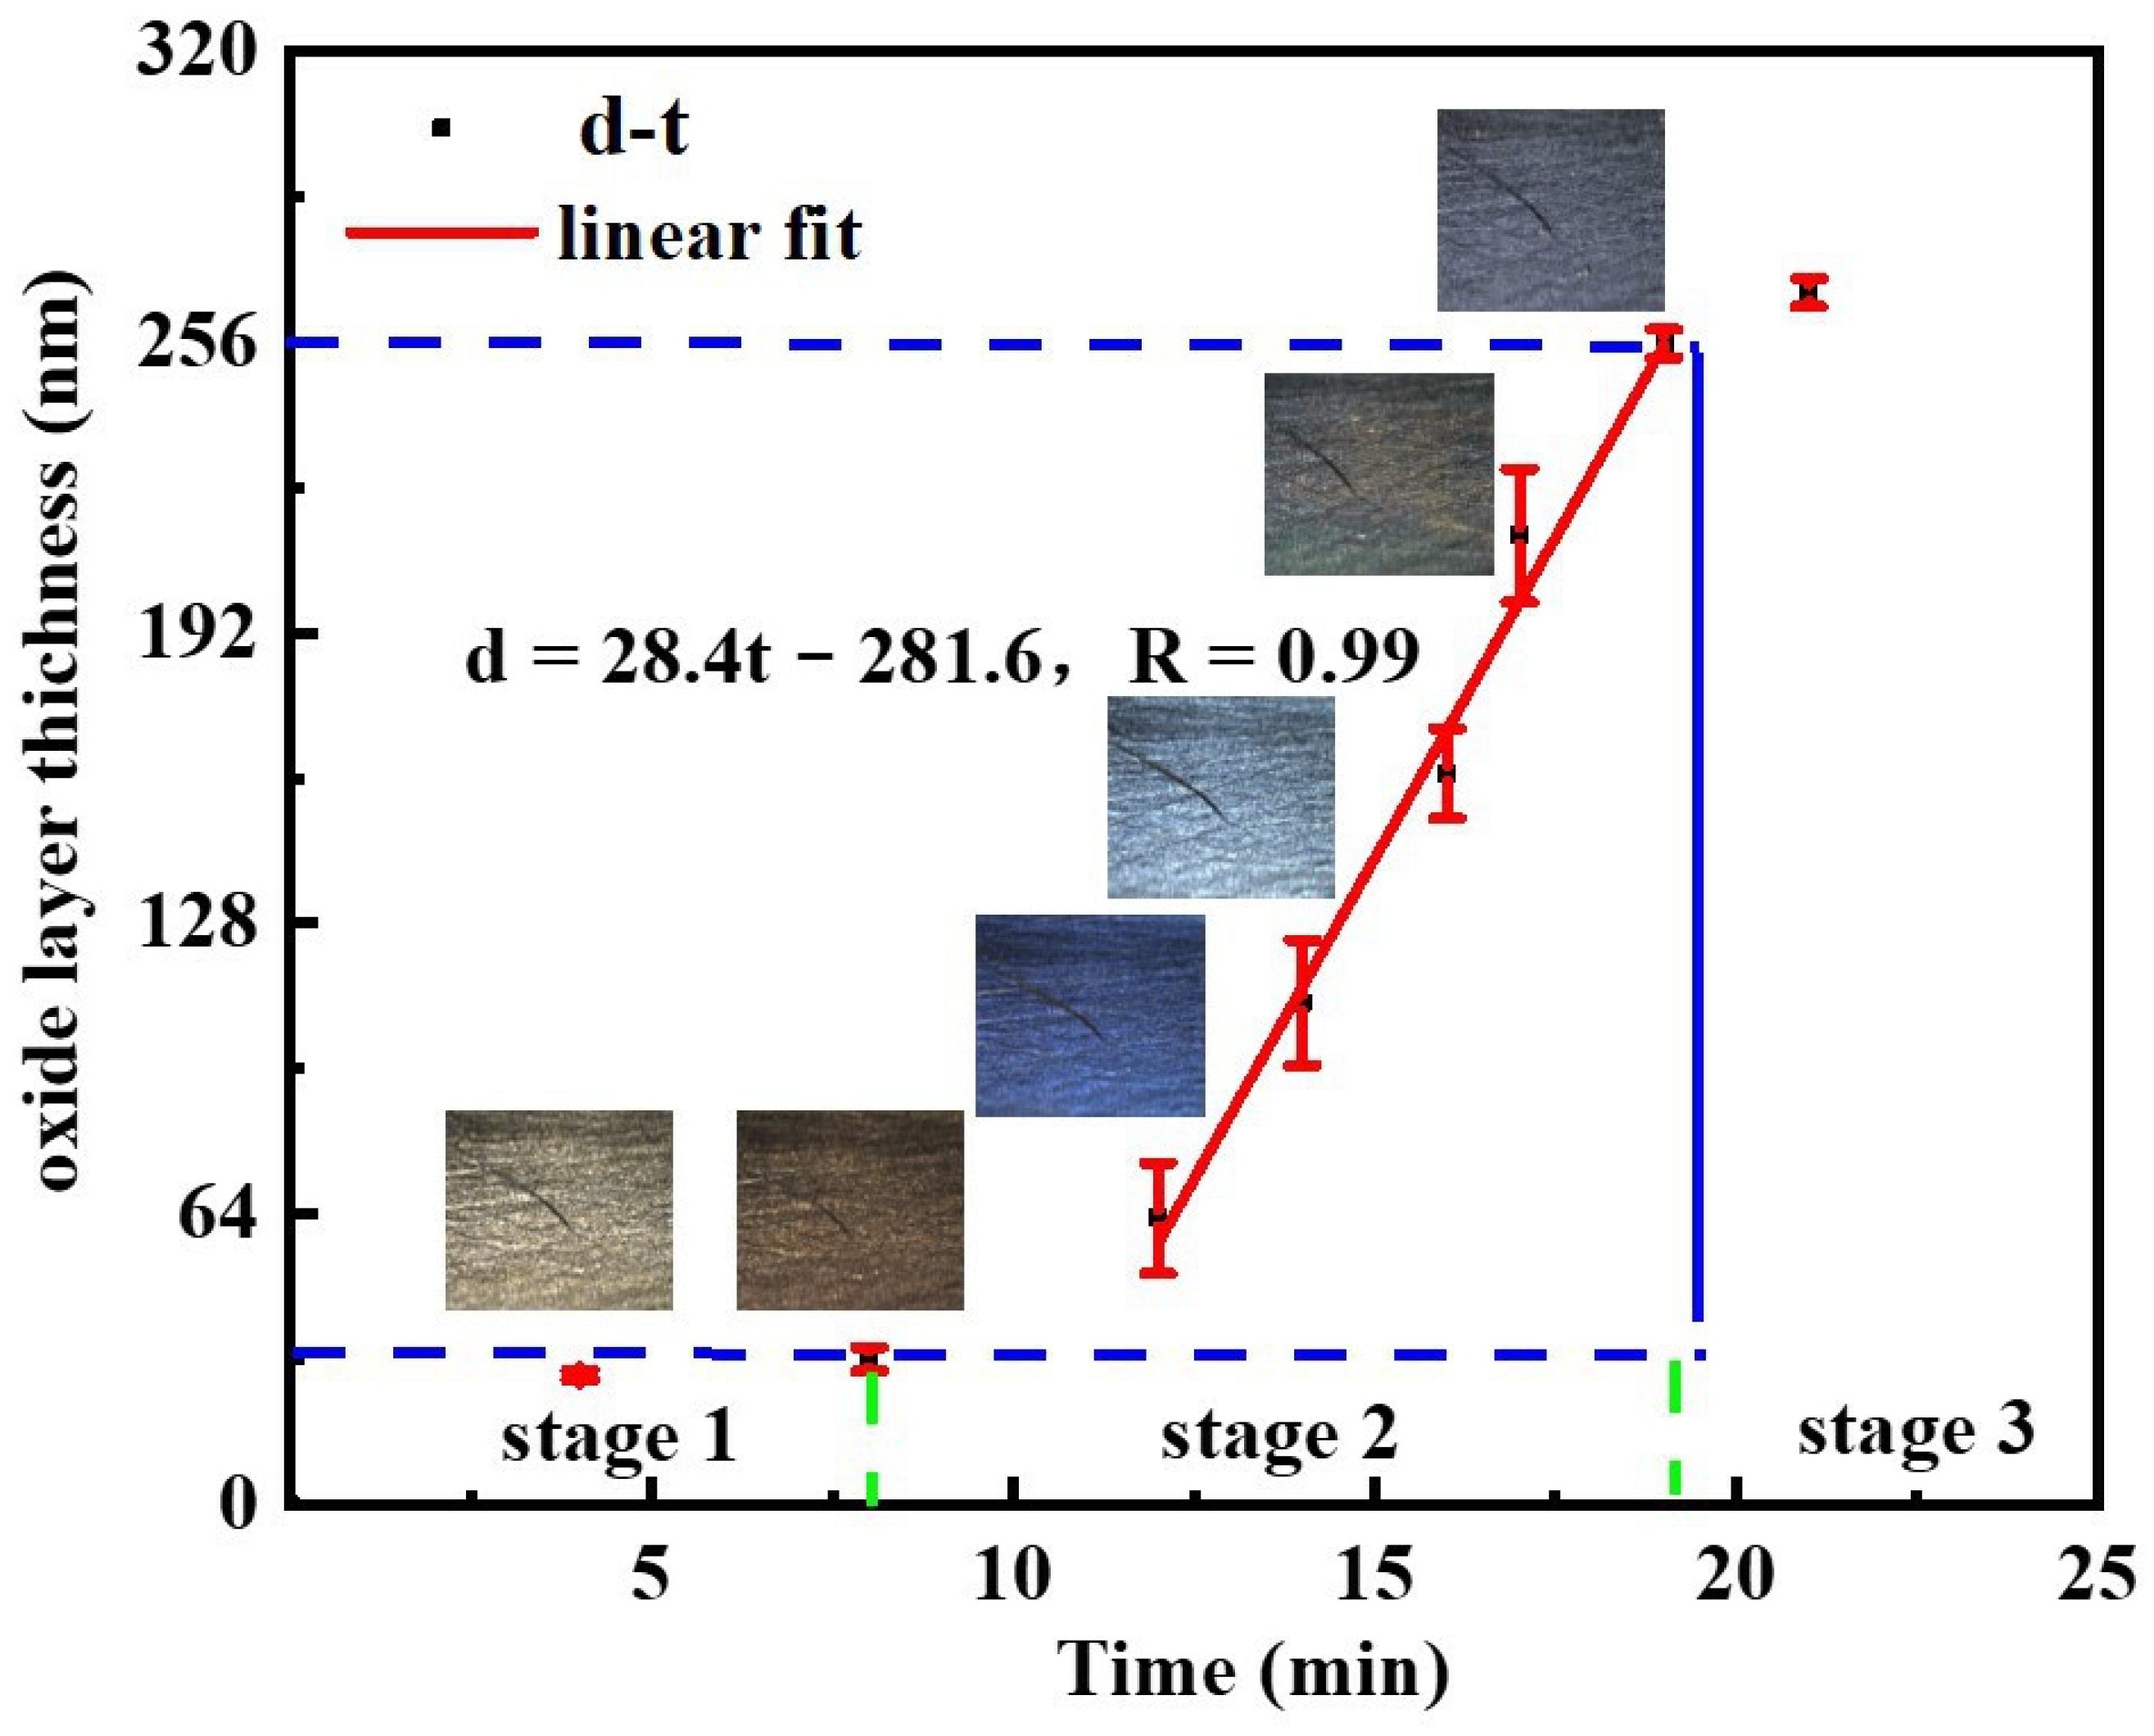
  • At the OS, fresh cerium is first oxidized to cerium oxide. Then, the oxides aggregate and grow to form a dense oxide layer. The overall growth rate of cerium oxide layer is generally consistent with the linear stage, yet the growth rate varies with the Ce-O reaction. The growth rate of oxide layer thickness is slow in the time of 0 min to 4 min, when cerium is oxidized to Ce2O3. Soon afterwards, both Ce2O3 and Ce are oxidized to CeO2, leading to a faster growth rate of oxide layer thickness in the time of 4 min to 12 min. After 12 min, Ce is directly oxidized to be CeO2 without the intermediate oxidization of Ce2O3, resulting in a reduction in the growth rate of oxide layer thickness.
  • With cerium oxide layer growing thicker and denser, along with the accumulation of heat release from Ce-O reaction, Ce is ignited to burn once the temperature rises to the ignition point and emits luminescent radiation with a sharp rise in sample temperature. Moreover, the morphology of final cerium oxide product indicates that cerium inside is melted, and thus oxide layer cracks during ICS, resulting in a fierce heterogeneous combustion.
The TGA data demonstrate that cerium is finally oxidized to ceria. The reactivity of cerium is weak initially and then strengthened with the proceeding of Ce-O reaction according to the increase in wi, Qi and Ea. The oxidation and combustion reaction stops until the burnout of the cerium sample. Generally, the specific oxidation-to-combustion behaviors of CMS under 0.3 mg/mL O2 is explored. The findings help to evaluate CMS ignition properties and environment safety, and provide references for the optimal design and safe operation of active metal equipment.

Author Contributions

Conceptualization, Y.W. (Yongpeng Wang); Methodology, S.P.; writing—original draft preparation, S.L.; investigation, X.Z., Q.Q. and Z.S.; review and editing, Y.W. (Yingchun Wu); Conceptualization, supervision and project administration, X.W. All authors have read and agreed to the published version of the manuscript.

Funding

This research was supported by National Safety Academic Fund (NSAF, Grant No. U2330204).

Data Availability Statement

The data generated and analyzed during the current study are not publicly available for legal/ethical reasons but are available from the corresponding author on reasonable request.

Conflicts of Interest

The authors declare that the research was conducted in the absence of any commercial or financial relation-ships that could be construed as a potential conflict of interest.

References

  1. Rinaudo, M.G.; Cadús, L.E.; Morales, M.R. Mechanochemical Activation of CeO2 in Order to Boost Physicochemical Properties for Catalytic Applications. Eng. Proc. 2023, 56, 49–53. [Google Scholar]
  2. Ahmad, I.; Akhtar, M.S.; Manzoor, M.F.; Wajid, M.; Noman, M.; Ahmed, E.; Ahmad, M.; Khan, W.Q.; Rana, A.M. Synthesis of yttrium and cerium doped ZnO nanoparticles as highly inexpensive and stable photocatalysts for hydrogen evolution. J. Rare Earths 2021, 39, 440–445. [Google Scholar] [CrossRef]
  3. Kim, S.; Choi, M.; Park, J. Cerium-Doped Oxide-Based Materials for Energy and Environmental Applications. Crystals 2023, 13, 1631. [Google Scholar] [CrossRef]
  4. Chatzichristodoulou, C.; Blennow, P.T.; Søgaard, M.; Hendriksen, P.V.; Mogensen, M.B. Ceria and its use in solid oxide cells and oxygen membranes. Catal. Sci. Ser. 2013, 12, 623–782. [Google Scholar]
  5. Taye, M.B.; Ningsih, H.S.; Shih, S.-J. Antibacterial and In Vitro Bioactivity Studies of Silver-Doped, Cerium-Doped, and Silver–Cerium Co-Doped 80S Mesoporous Bioactive Glass Particles via Spray Pyrolysis. Appl. Sci. 2023, 13, 12637. [Google Scholar] [CrossRef]
  6. Aljarrah, M.; Alnahas, J.; Alhartomi, M. Thermodynamic Modeling and Mechanical Properties of Mg-Zn-{Y, Ce} Alloys: Review. Crystals 2021, 11, 1592. [Google Scholar] [CrossRef]
  7. Zhang, Z.; Chen, H.H.; Cao, S.J.; Peng, J.H.; Guo, P.; Long, C.; Wang, S.; Chen, C.; Wu, Y.; Huang, J.A.; et al. Effect of cerium alloying on microstructure, texture and mechanical properties of magnesium during cold-rolling process. J. Rare Earths 2023, in press. [Google Scholar] [CrossRef]
  8. Han, S.; Geng, R.; Lei, S.; Li, Y.; Wang, C. Effect of Cerium on Inclusion Modification in a Secondary-Hardening Steel. Materials 2023, 16, 3972. [Google Scholar] [CrossRef]
  9. Luginin, N.; Eroshenko, A.; Khimich, M.; Prosolov, K.; Kashin, A.; Uvarkin, P.; Tolmachev, A.; Glukhov, I.; Panfilov, A.; Sharkeev, Y. Severe Plastic Deformation of Mg–Zn–Zr–Ce Alloys: Advancing Corrosion Resistance and Mechanical Strength for Medical Applications. Metals 2023, 13, 1847. [Google Scholar] [CrossRef]
  10. Fan, J.F.; Yang, C.L.; Han, G.; Fang, S.; Yang, W.D.; Xu, B.S. Oxidation behavior of ignition-proof magnesium alloys with rare earth addition. J Alloy Compd. 2011, 509, 2137–2142. [Google Scholar] [CrossRef]
  11. Zhang, Y.Y.; Wang, Y.X.; Liu, Y.; Xu, H.; Ying, Q.J.; Wu, Z.B. Insight into the Role of Cerium in the Enhanced Performances during Catalytic Combustion of Acetonitrile over Core–Shell-like Cu–Ce/ZSM-5 Catalysts. ACS ES&T Eng. 2022, 2, 1709–1721. [Google Scholar]
  12. Zheng, J.; Wang, Z.; Chen, Z.; Zuo, S.F. Mechanism of CeO2 synthesized by thermal decomposition of Ce-MOF and its performance of benzene catalytic combustion. J. Rare Earths 2021, 37, 790–796. [Google Scholar] [CrossRef]
  13. Zhou, N.; Zhang, Z.Y.; Dong, J.; Jin, L.; Ding, W.J. Selective oxidation behavior of an ignition-proof Mg-Y-Ca-Ce alloy. J. Rare Earths 2013, 31, 1003–1008. [Google Scholar] [CrossRef]
  14. Kang, W.; Ozgur, D.O.; Varma, A. Solution combustion synthesis of high surface area CeO2 nanopowders for catalytic applications: Reaction mechanism and properties. ACS Appl. Nano Mater. 2018, 1, 675–685. [Google Scholar] [CrossRef]
  15. Trojanowski, R.; Fthenakis, V. Nanoparticle emissions from residential wood combustion: A critical literature review, characterization, and recommendations. Renew. Sust. Energ. Rev. 2019, 103, 515–528. [Google Scholar] [CrossRef]
  16. Gantt, B.; Hoque, S.; Willis, R.D.; Fahey, K.M.; Delgado-Saborit, J.M.; Harrison, R.M.; Erdakos, G.B.; Bhave, P.V.; Zhang, K.M.; Kovalcik, K.; et al. Near-Road modeling and measurement of cerium-containing particles generated by nanoparticle diesel fuel additive use. Environ. Sci. Technol. 2014, 48, 10607–10613. [Google Scholar] [CrossRef]
  17. Zhu, Y.; Liu, X.Y.; Shi, W.; Li, J.; Ye, C.B.; Fang, R.M.; Zhu, H.F.; Chen, S.H.; Lan, L. Effect of yttrium and manganese addition on catalytic soot combustion activity and anti-high-temperature stability of CeO2 catalyst. J. Rare Earths. 2023, in press. [Google Scholar] [CrossRef]
  18. Andreescu, D.; Bulbul, G.; Özel, R.E.; Hayat, A.; Sardesai, N.; Andreescu, S. Applications and implications of nanoceria reactivity: Measurement tools and environmental impact. Environ. Sci. Nano 2014, 1, 445–458. [Google Scholar] [CrossRef]
  19. Muhammad, R.; Ali, U. Optimized cerium addition for microstructure and mechanical properties of SAC305. Solder. Surf. Mt. Technol. 2020, 33, 197. [Google Scholar] [CrossRef]
  20. Hoang, A.T. Combustion behavior, performance and emission characteristics of diesel engine fueled with biodiesel containing cerium oxide nanoparticles: A review. Fuel Process. Technol. 2021, 218, 106840. [Google Scholar] [CrossRef]
  21. Fan, J.F.; Yang, G.C.; Cheng, S.L.; Xie, H.; Hao, W.X.; Wang, M.; Yang, G.C.; Zhou, Y.H. Surface oxidation behavior of Mg-Y-Ce alloys at high temperature. Metall. Mater. Trans. A 2005, 36, 235–239. [Google Scholar] [CrossRef]
  22. Lin, P.Y.; Zhou, H.; Li, W.; Li, W.P.; Sun, N.; Yang, R. Interactive effect of cerium and aluminum on the ignition point and the oxidation resistance of magnesium alloy. Corros. Sci. 2008, 50, 2669–2675. [Google Scholar] [CrossRef]
  23. Zhou, H.; Wang, M.X.; Li, W.; Wang, L.; Zhao, Y. Effect of Ce addition on ignition point of AM50 alloy powder. Mater. Lett. 2006, 60, 3238–3240. [Google Scholar]
  24. Cubicciotti, D. The Reaction of Cerium with Oxygen. J. Am. Chem. Soc. 1952, 74, 1200–1201. [Google Scholar] [CrossRef]
  25. Wheeler, D.W. Kinetics and mechanism of the oxidation of cerium in air at ambient temperature. Corros. Sci. 2016, 111, 52–60. [Google Scholar] [CrossRef]
  26. Karasev, V.V.; Onishchuk, A.A.; Khromova, S.A.; Glotov, O.G.; Zarko, V.E.; Pilyugina, E.A.; Tsai, C.T. Formation of metal oxide nanoparticles in combustion of titanium and aluminum droplets. Combust. Explos. Shock Waves 2006, 42, 649–662. [Google Scholar] [CrossRef]
  27. Smovzh, D.V.; Kalyuzhnyĭ, N.A.; Zaikovsky, A.V.; Novopashin, S.A. Synthesis of hollow nanoparticles γ-Al2O3. J. Nanopart. Res. 2013, 2, 120–124. [Google Scholar]
  28. Zarko, V.; Glazunov, A. Review of experimental methods for measuring the ignition and combustion characteristics of metal nanoparticles. Nanomaterials 2020, 10, 2008. [Google Scholar] [CrossRef]
  29. Shih, T.S.; Wang, J.H.; Chong, K.Z. Combustion of magnesium alloys in air. Mater. Chem. Phys. 2004, 85, 302–309. [Google Scholar] [CrossRef]
  30. Haschke, J.M.; Allen, T.H.; Morales, L.A. Surface and corrosion chemistry of plutonium. Los Alamos Sci. 2000, 26, 252–273. [Google Scholar]
  31. Joseph, C.M.; John, M.H.; Jerry, L. A mechanism for plutonium pyrophoricity. J. Nucl. Mater. 1994, 210, 130–142. [Google Scholar]
  32. Han, D.; Zhang, J.; Huang, J.F.; Lian, Y.; He, G.Y. A review on ignition mechanisms and characteristics of magnesium alloys. J. Magnes. Alloy 2020, 8, 329–344. [Google Scholar] [CrossRef]
Figure 1. Schematic diagram of the CMS-ICES.
Metals 14 00003 g001
Figure 2. The surface morphologies of CMS at different reaction time during the oxidation-to-combustion evolution process (ae) respectively refers the appearance state of CMS during the oxidation stage, ignition and combustion stage, and extinction stage, the digits in the bottom-right corner represent the reaction time in minutes.
Metals 14 00003 g002
Figure 3. The sample surface temperature (T) and spectrum intensity (I) shifts with Ce-O reaction time during the oxidation to combustion; the chart refers to the spectrum at the moment of Thc.
Metals 14 00003 g003
Figure 4. XRD (2θ) of the oxides with different surface color were obtained at 0 min, 4 min, 8 min, 12 min, 14 min, 16 min, 17 min, 19 min, and 21 min during the CMS oxidation.
Metals 14 00003 g004
Figure 5. The oxide layer thickness of the intermediate oxides was obtained at 0 min, 4 min, 8 min, 12 min, 14 min, 16 min, and 21 min during the oxidation of CMS.
Metals 14 00003 g005
Figure 6. The surface micro-morphologies of intermediate samples were obtained during the oxidation of CMS (ai) respectively refer the micro-morphologies at 0 min, 4 min, 8 min, 12 min, 14 min, 16 min, 17 min, 19 min, and 21 min, number 1 and 2 respectively refer the non-active area and active area on the CMS surface).
Metals 14 00003 g006
Figure 7. The surface roughness of intermediate oxides was obtained at different times during the oxidation of CMS (ai) respectively refer the surface roughness at 0 min, 4 min, 8 min, 12 min, 14 min, 16 min, 17 min, 19 min, and 21 min.
Metals 14 00003 g007
Figure 8. Surface morphologies of CMS condensed combustion products ((a) refers to the fresh Ce, (b,c) refer to the combustion-condensed products collected at the initial and final moment of CMS combustion, and (d) refers to the interior of combustion-condensed product collected at the intense combustion stage, respectively).
Metals 14 00003 g008
Figure 9. The accumulated weight percentage variation (Δm), the instantaneous reaction rate (wi), the general reaction heat (Q) and reaction heat differentiation (dQ/dt) were obtained during the oxidation-to-combustion shift of CMS (the chart is the XRD of the final condensed combustion product).
Metals 14 00003 g009
Figure 10. The Ea of Ce-O reaction was obtained during the oxidation-to-combustion of CMS.
Metals 14 00003 g010
Table 1. Element composition analysis of the surface composition on the oxidation condensed products before Ce ignition (1–9 refers to the samples obtained at 0 min, 4 min, 8 min, 12 min, 14 min, 16 min, 17 min, 19 min, and 21 min during the oxidation of CMS, respectively).
TimeZone 1Zone 2
Ce Content (%)O Content (%)Ce Content (%)O Content (%)
010001000
467.532.548.651.4
828.171.954.545.5
1256.343.743.356.7
1439.560.526.473.6
1632.367.723.776.3
1745.654.444.155.9
1931.368.930.769.3
2128.171.937.063.0
Disclaimer/Publisher’s Note: The statements, opinions and data contained in all publications are solely those of the individual author(s) and contributor(s) and not of MDPI and/or the editor(s). MDPI and/or the editor(s) disclaim responsibility for any injury to people or property resulting from any ideas, methods, instructions or products referred to in the content.

