

Effect of Mg Addition on Molten Chloride Salt Corrosion Resistance of 310S Stainless Steel with Aluminum


Abstract
:1. Introduction
2. Materials and Methods
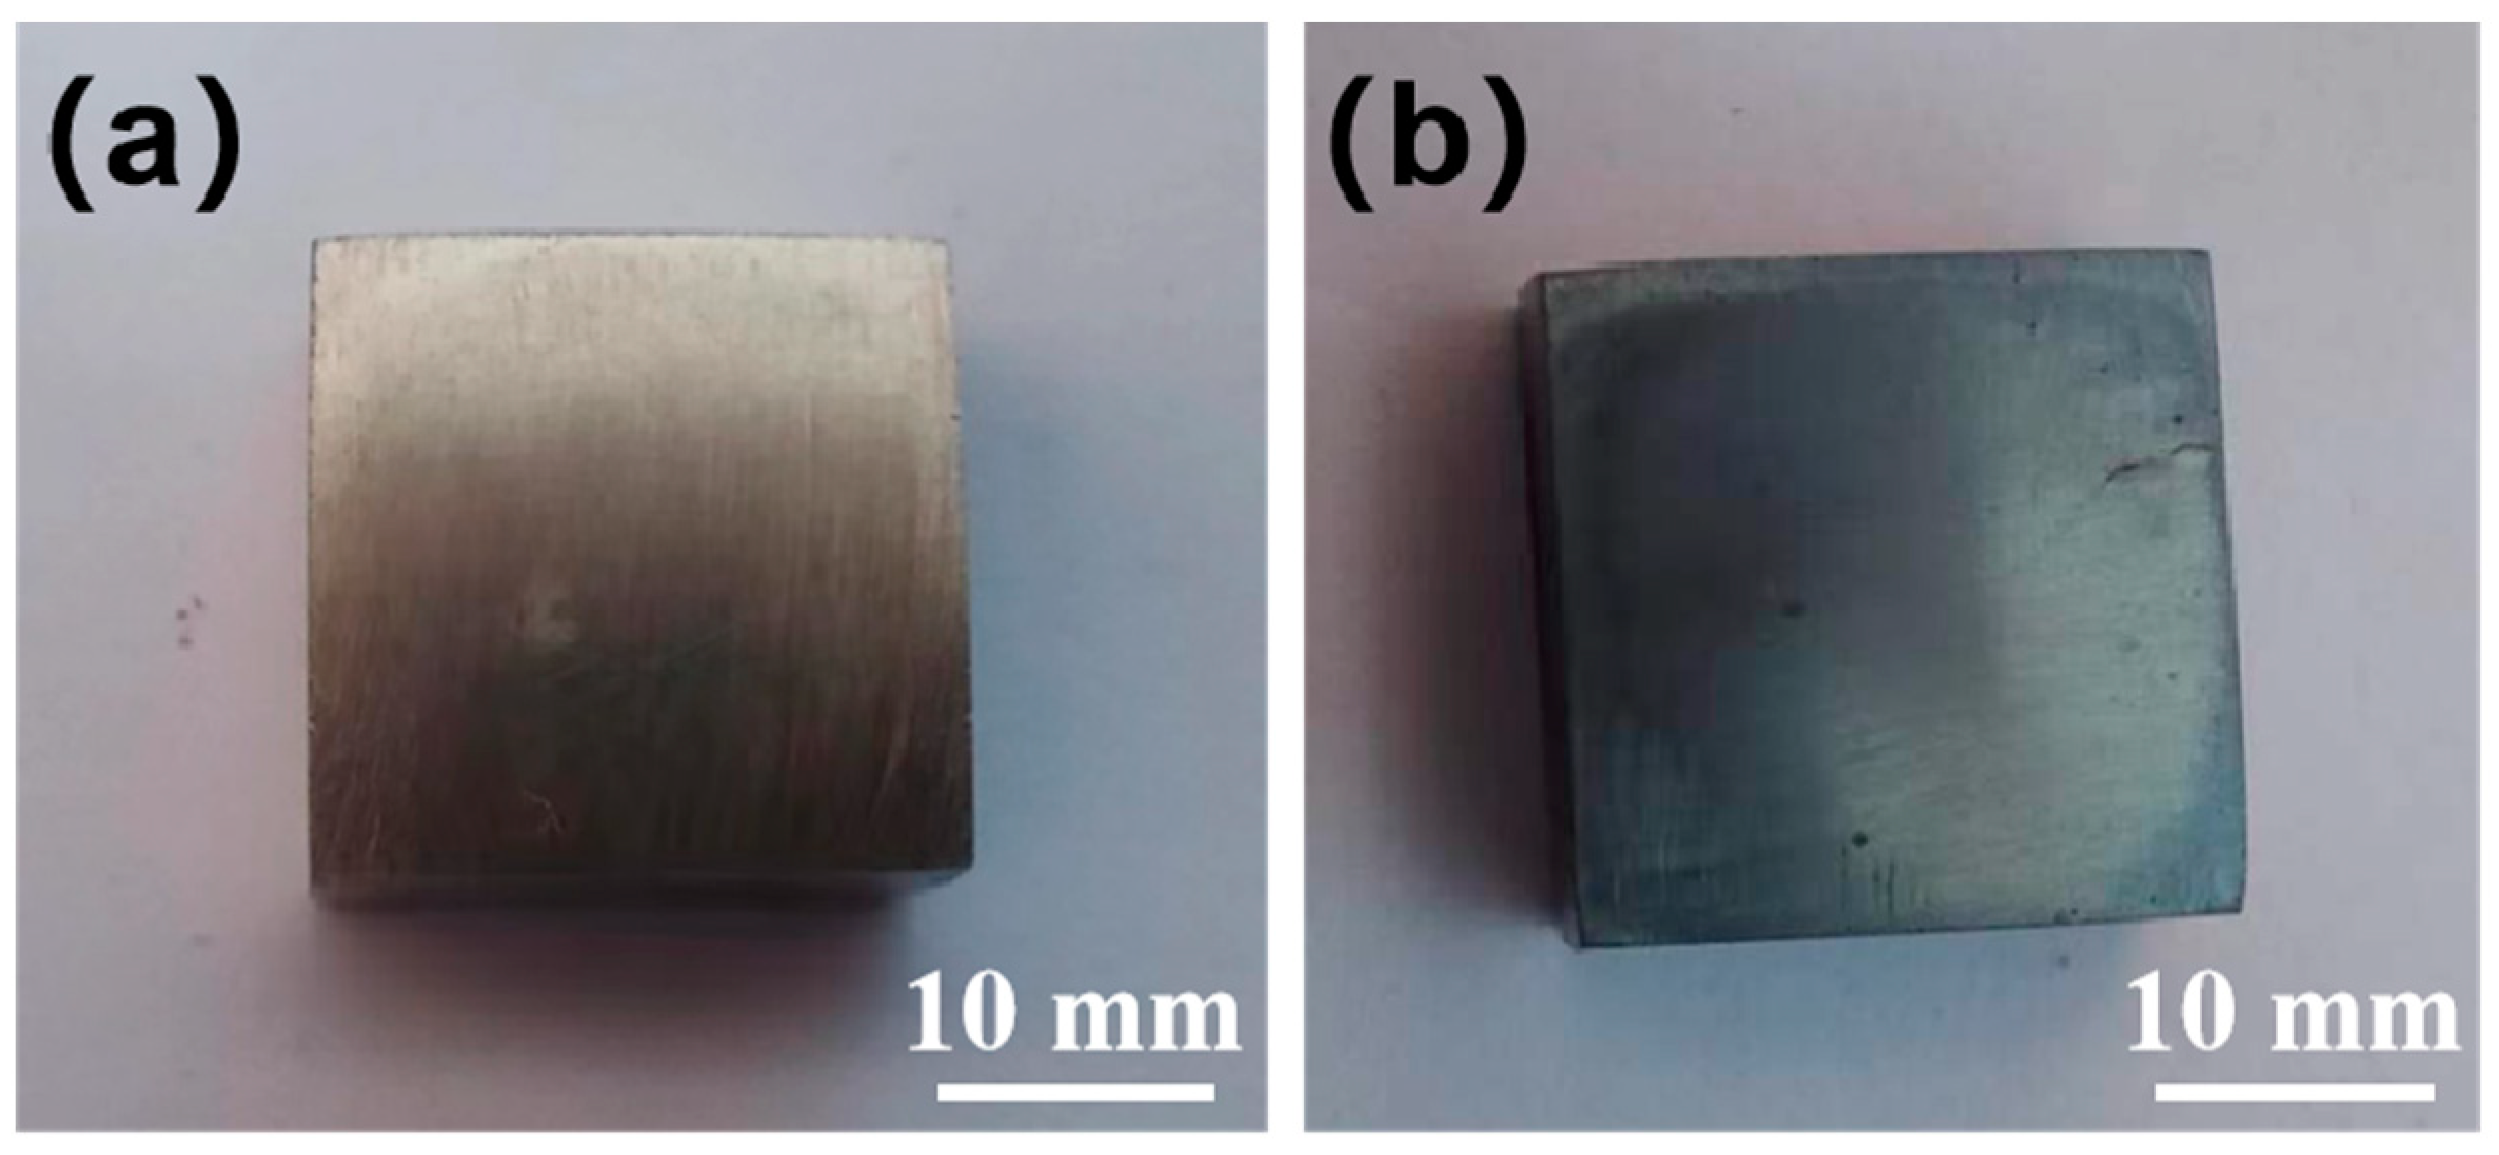
2.1. Corrosion Sample and Salt Mixture Preparation
2.2. Molten Salt Corrosion Resistance Test
2.3. Organizational Characterization
3. Results
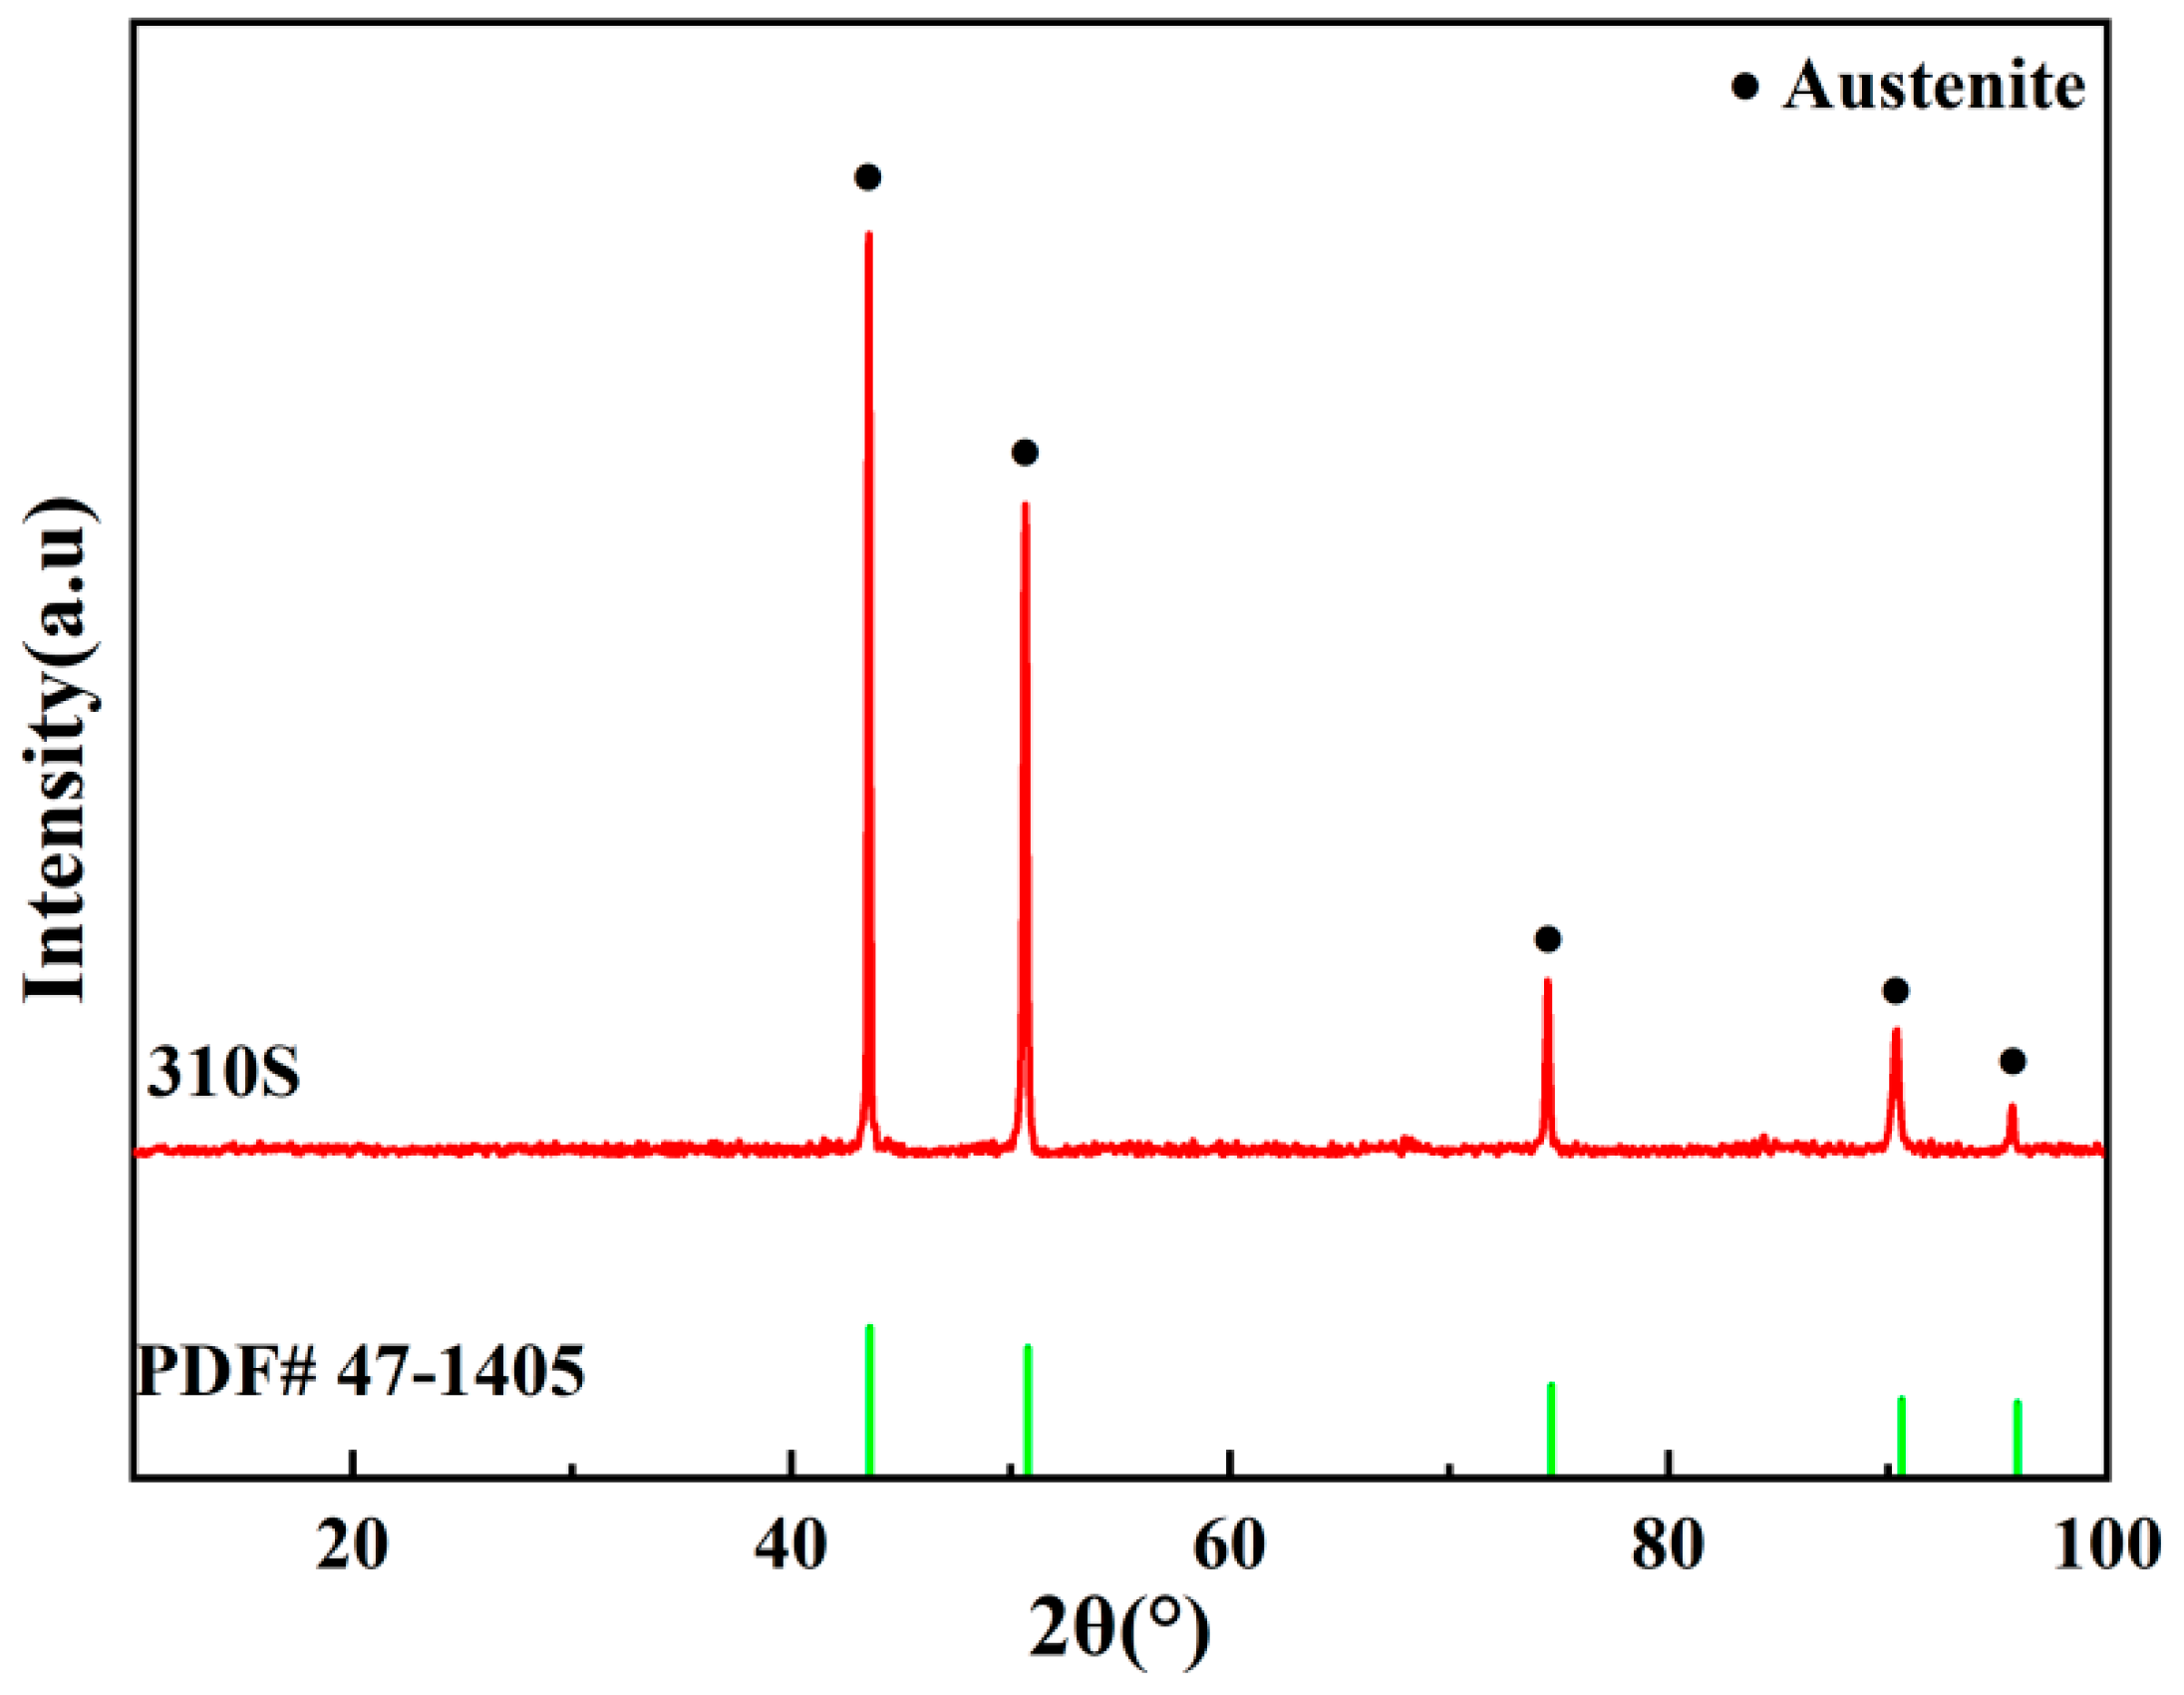
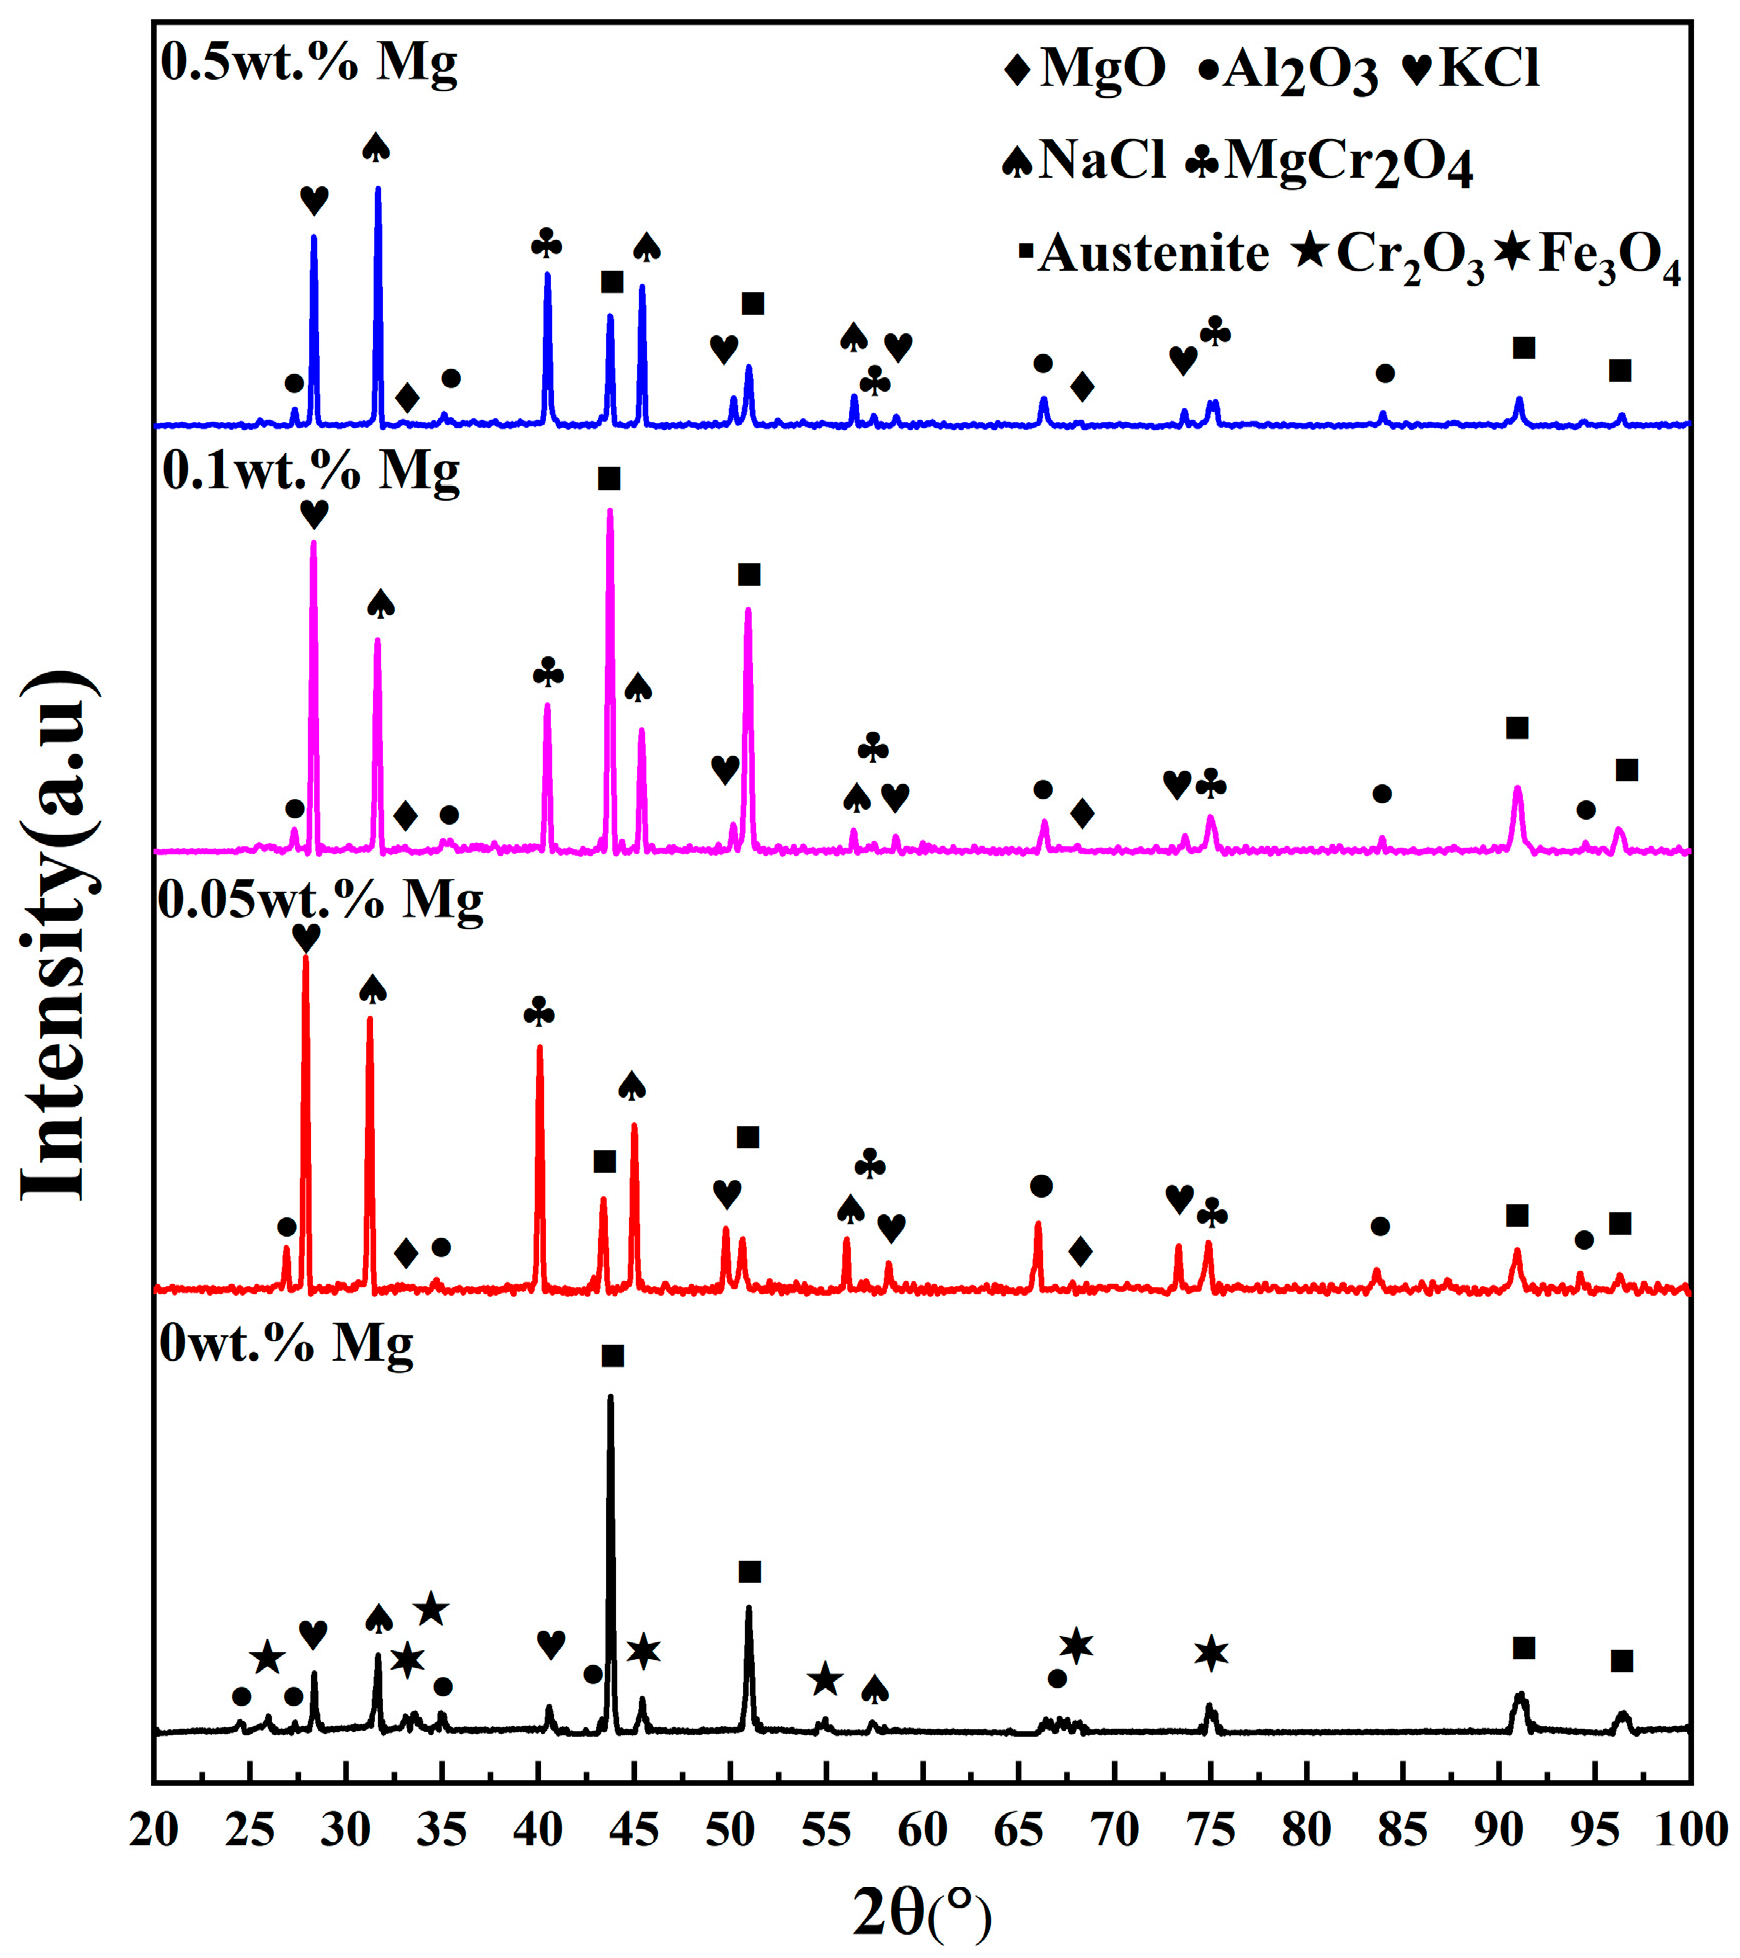
3.1. XRD Analysis
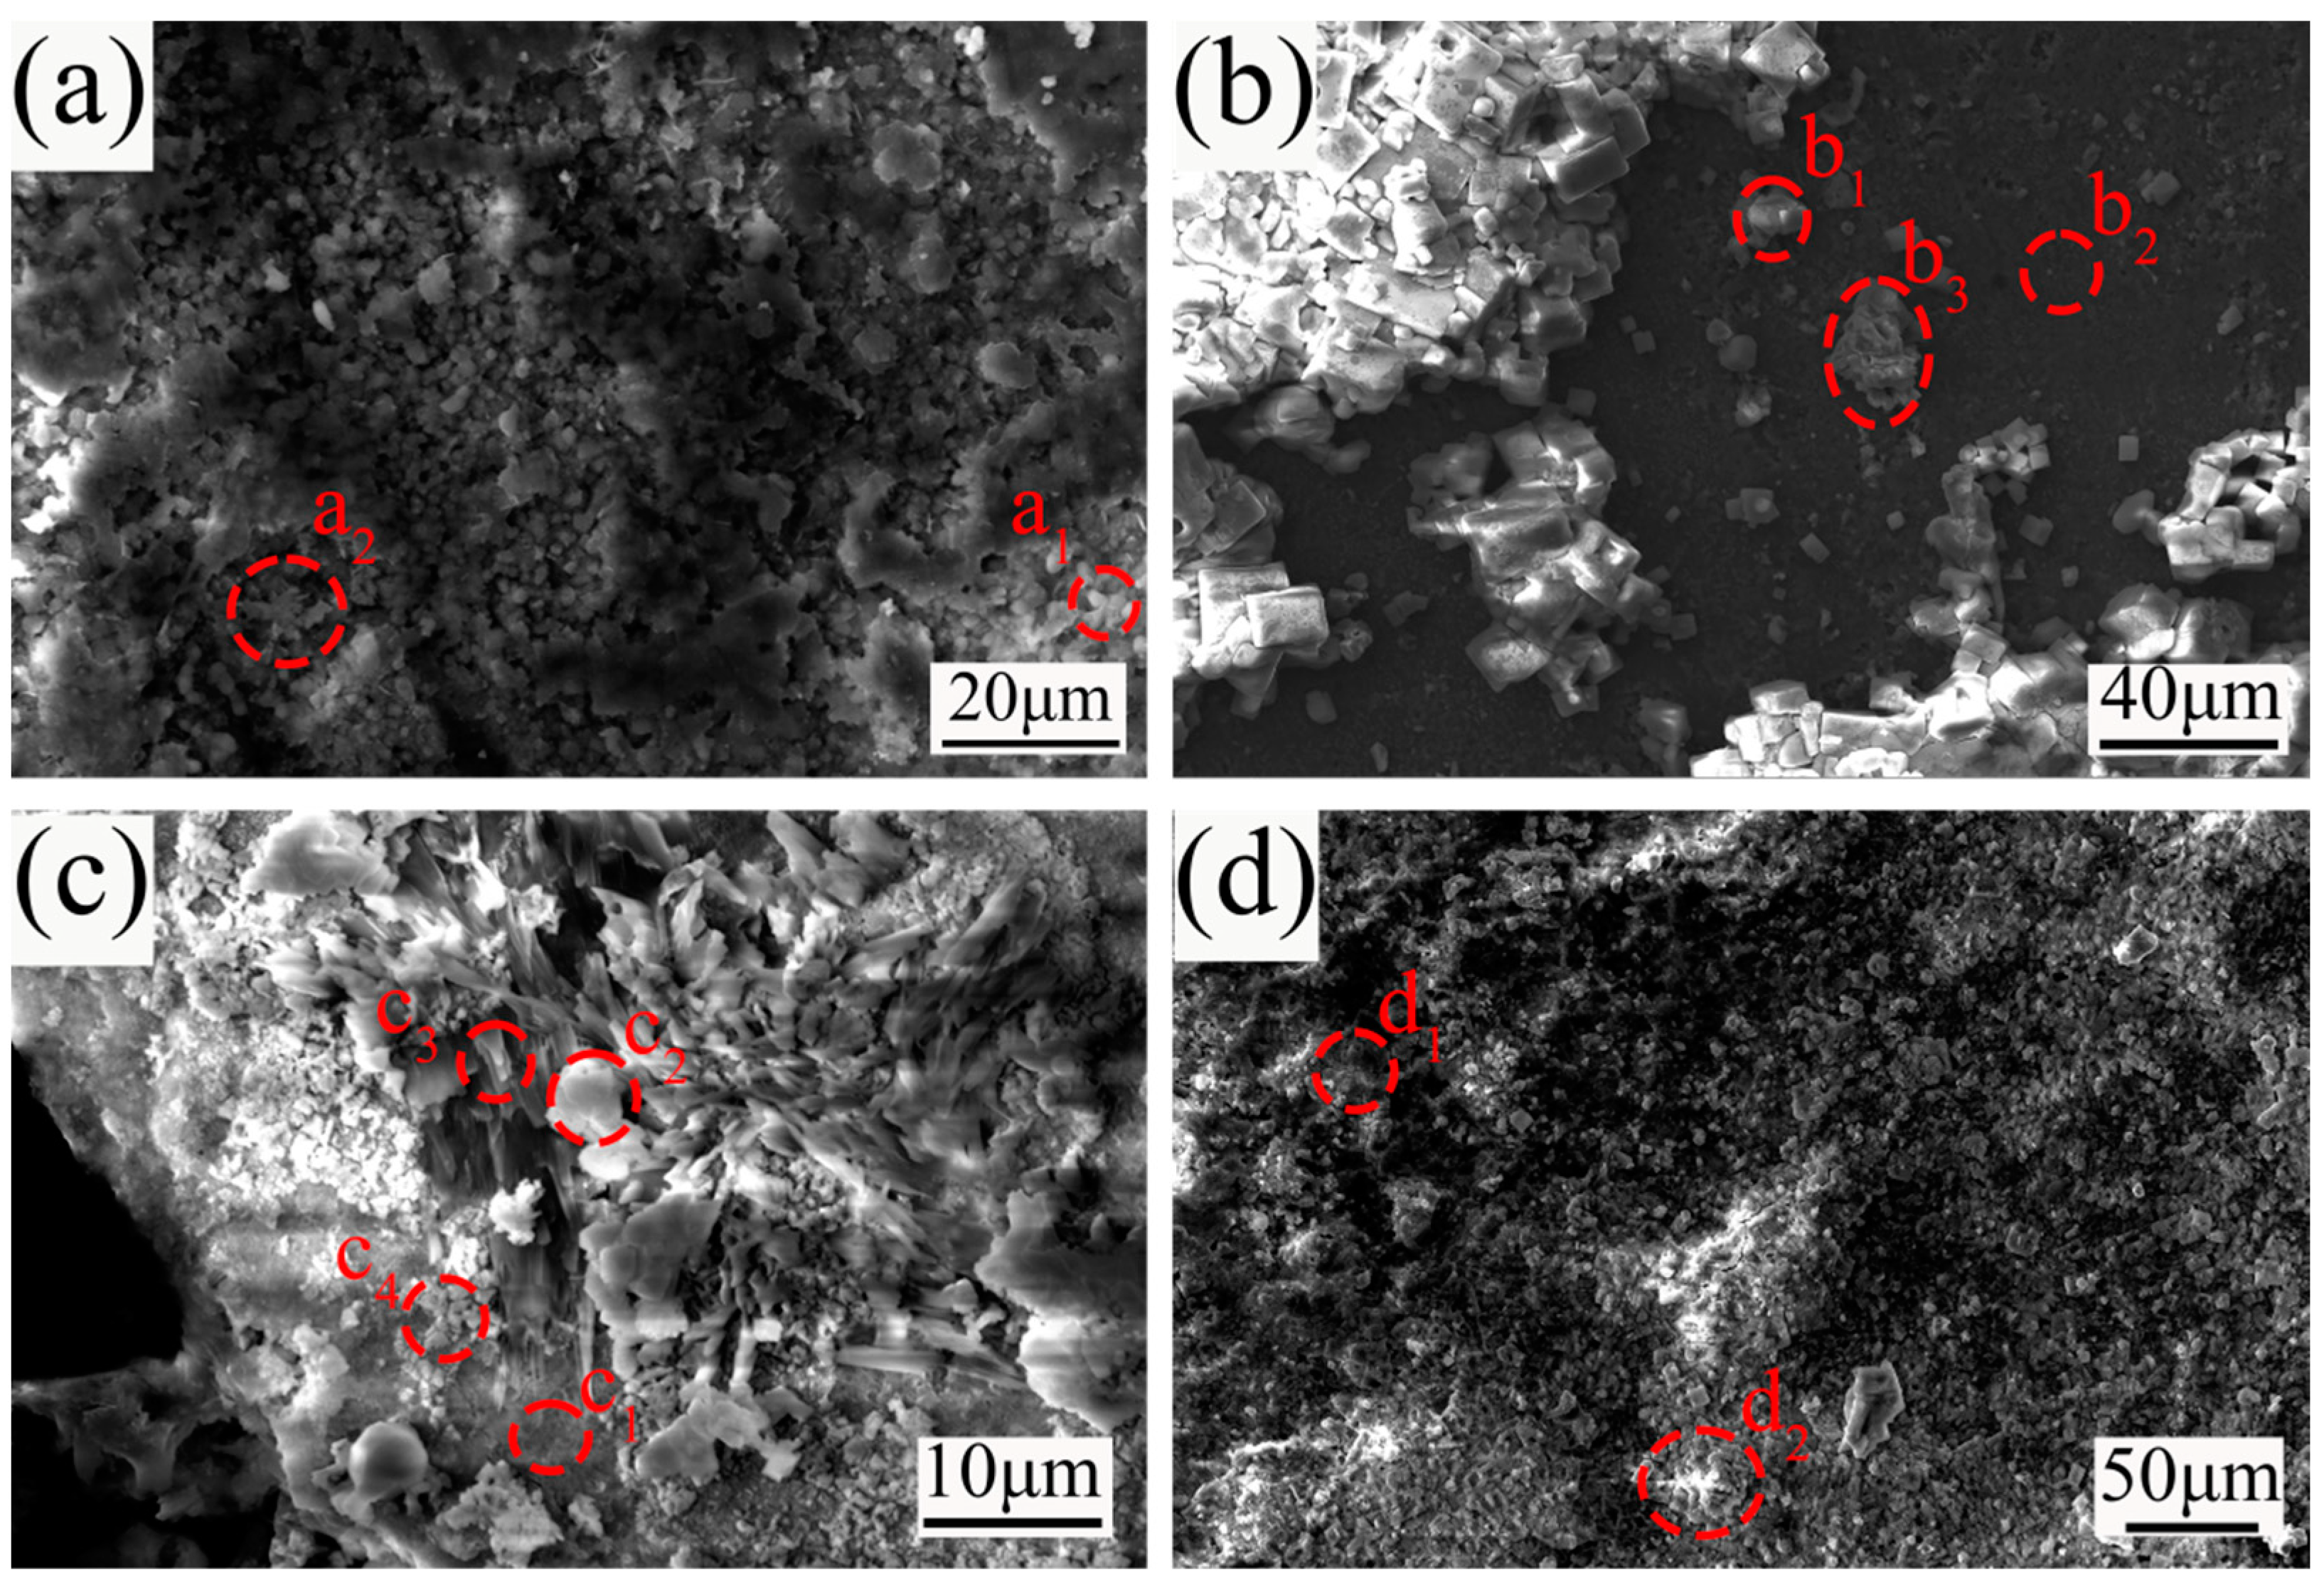
3.2. Surface Characterization
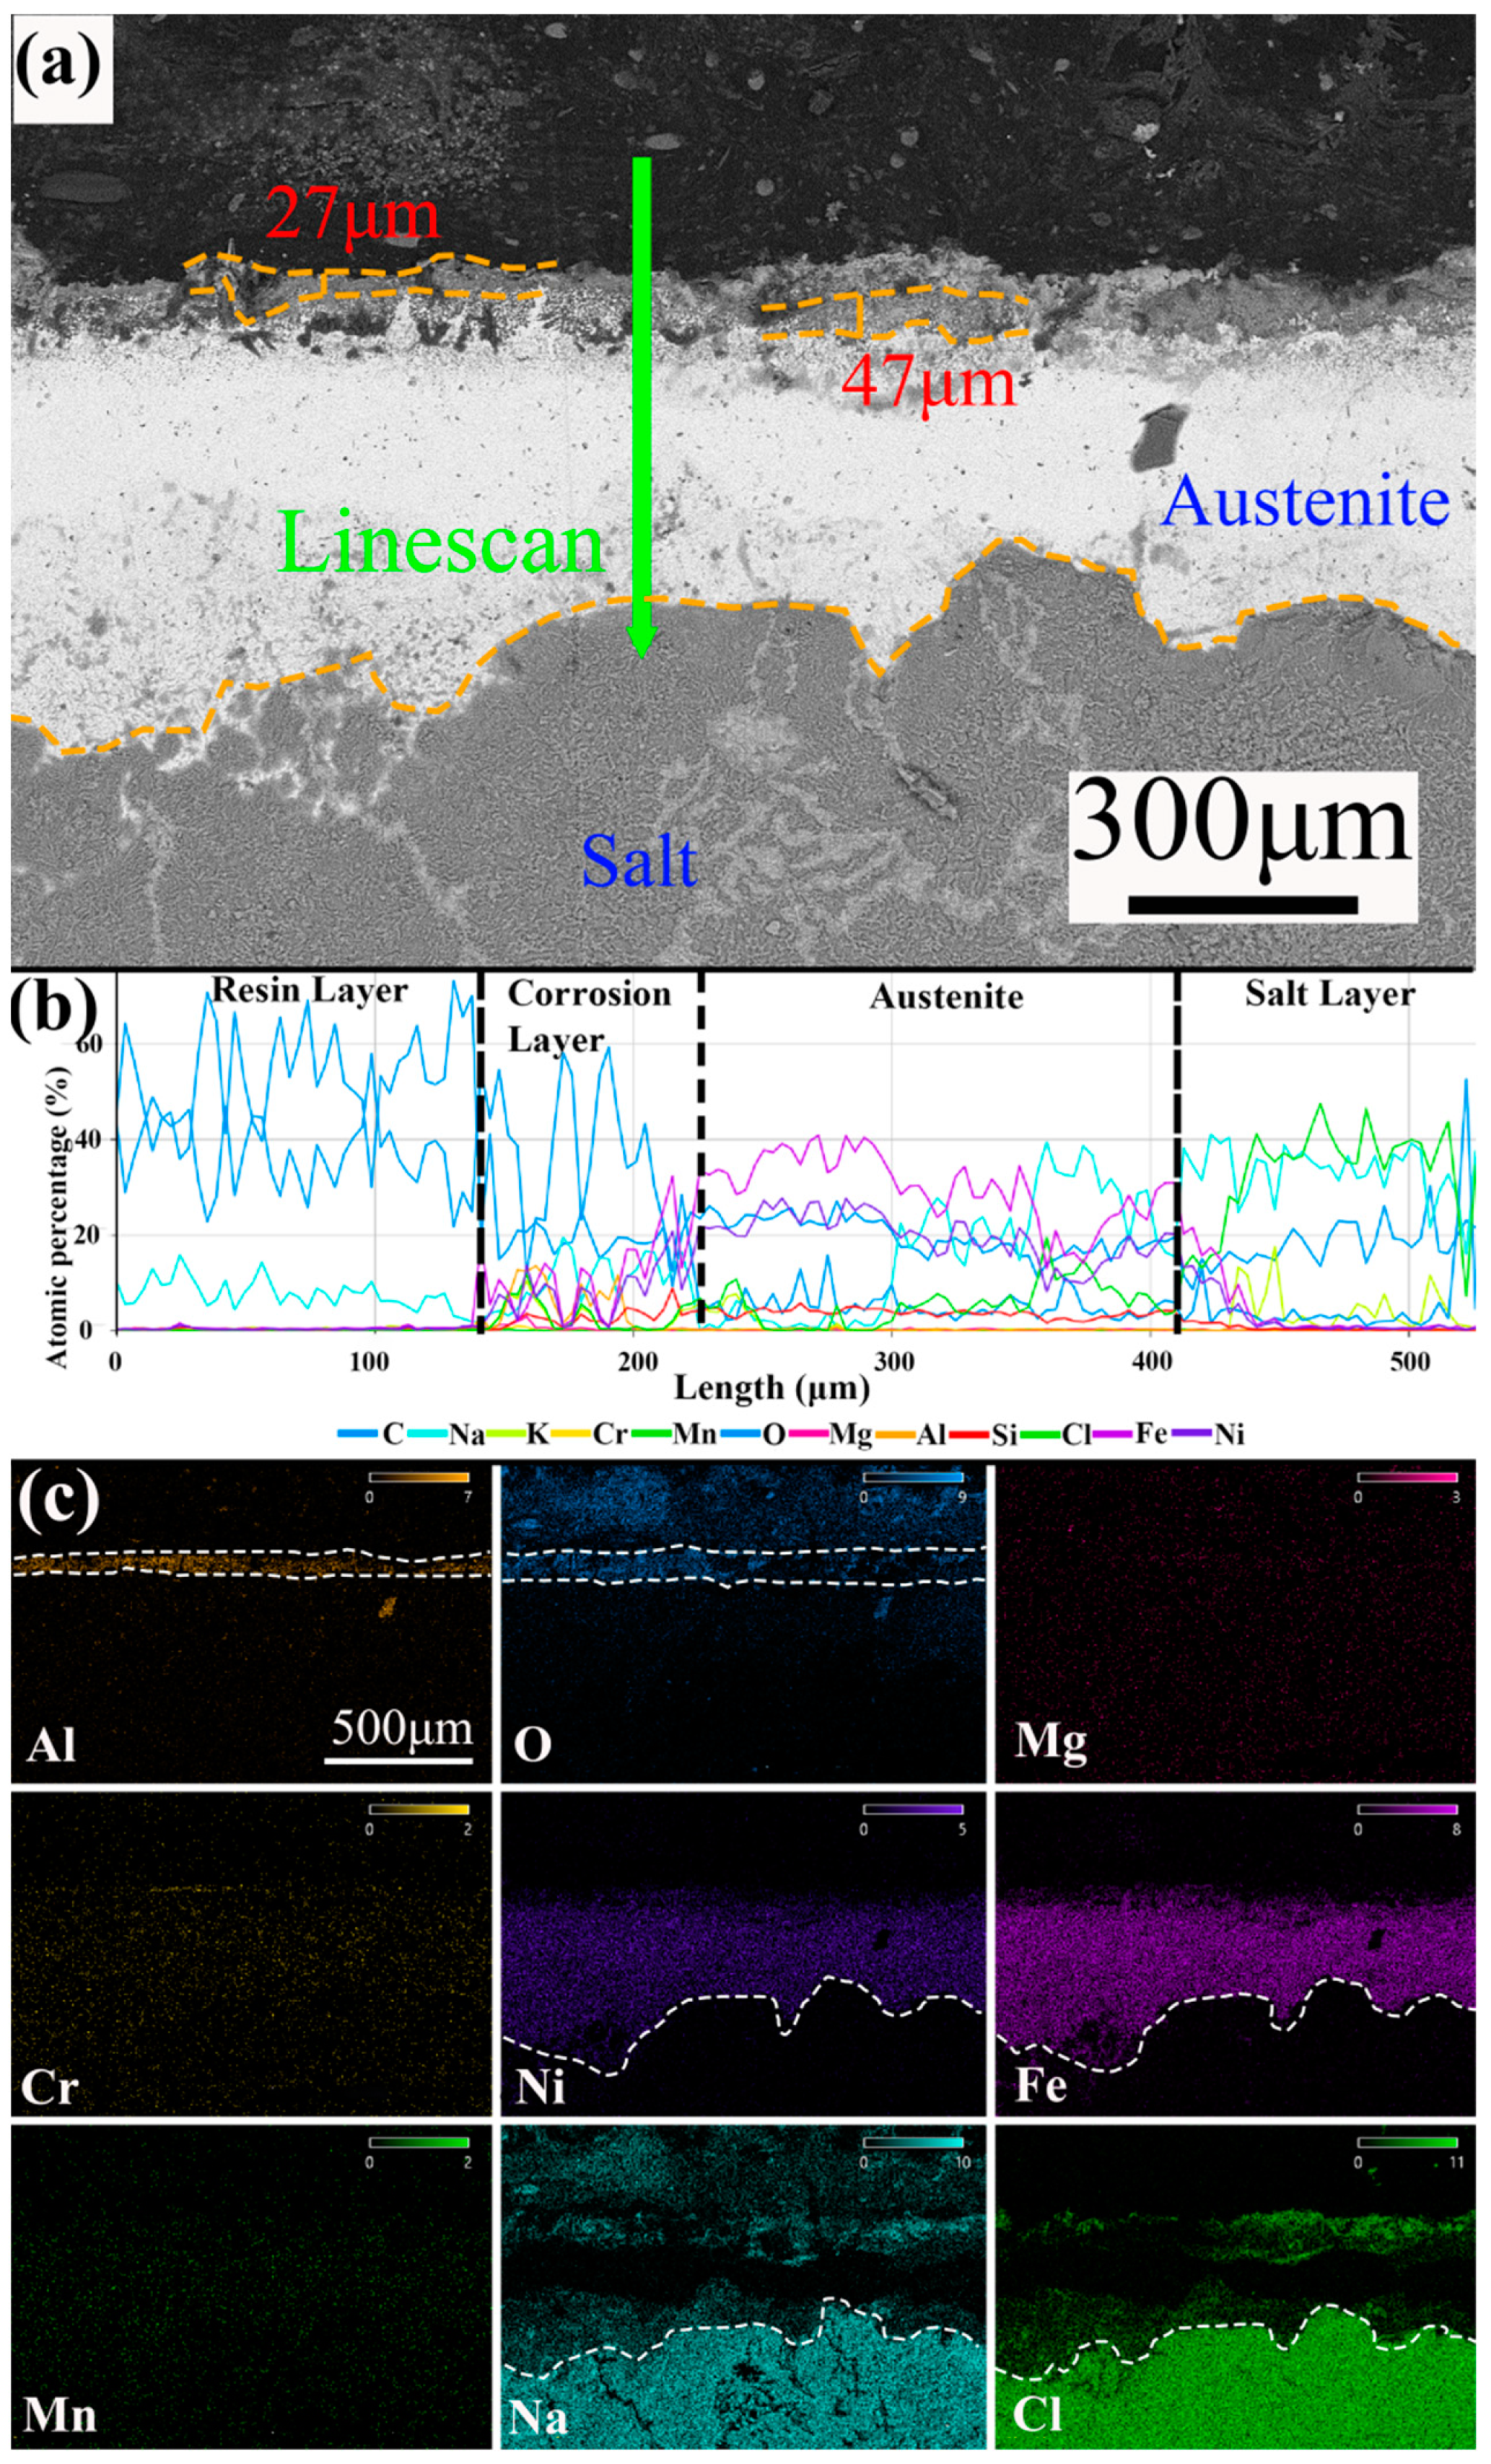
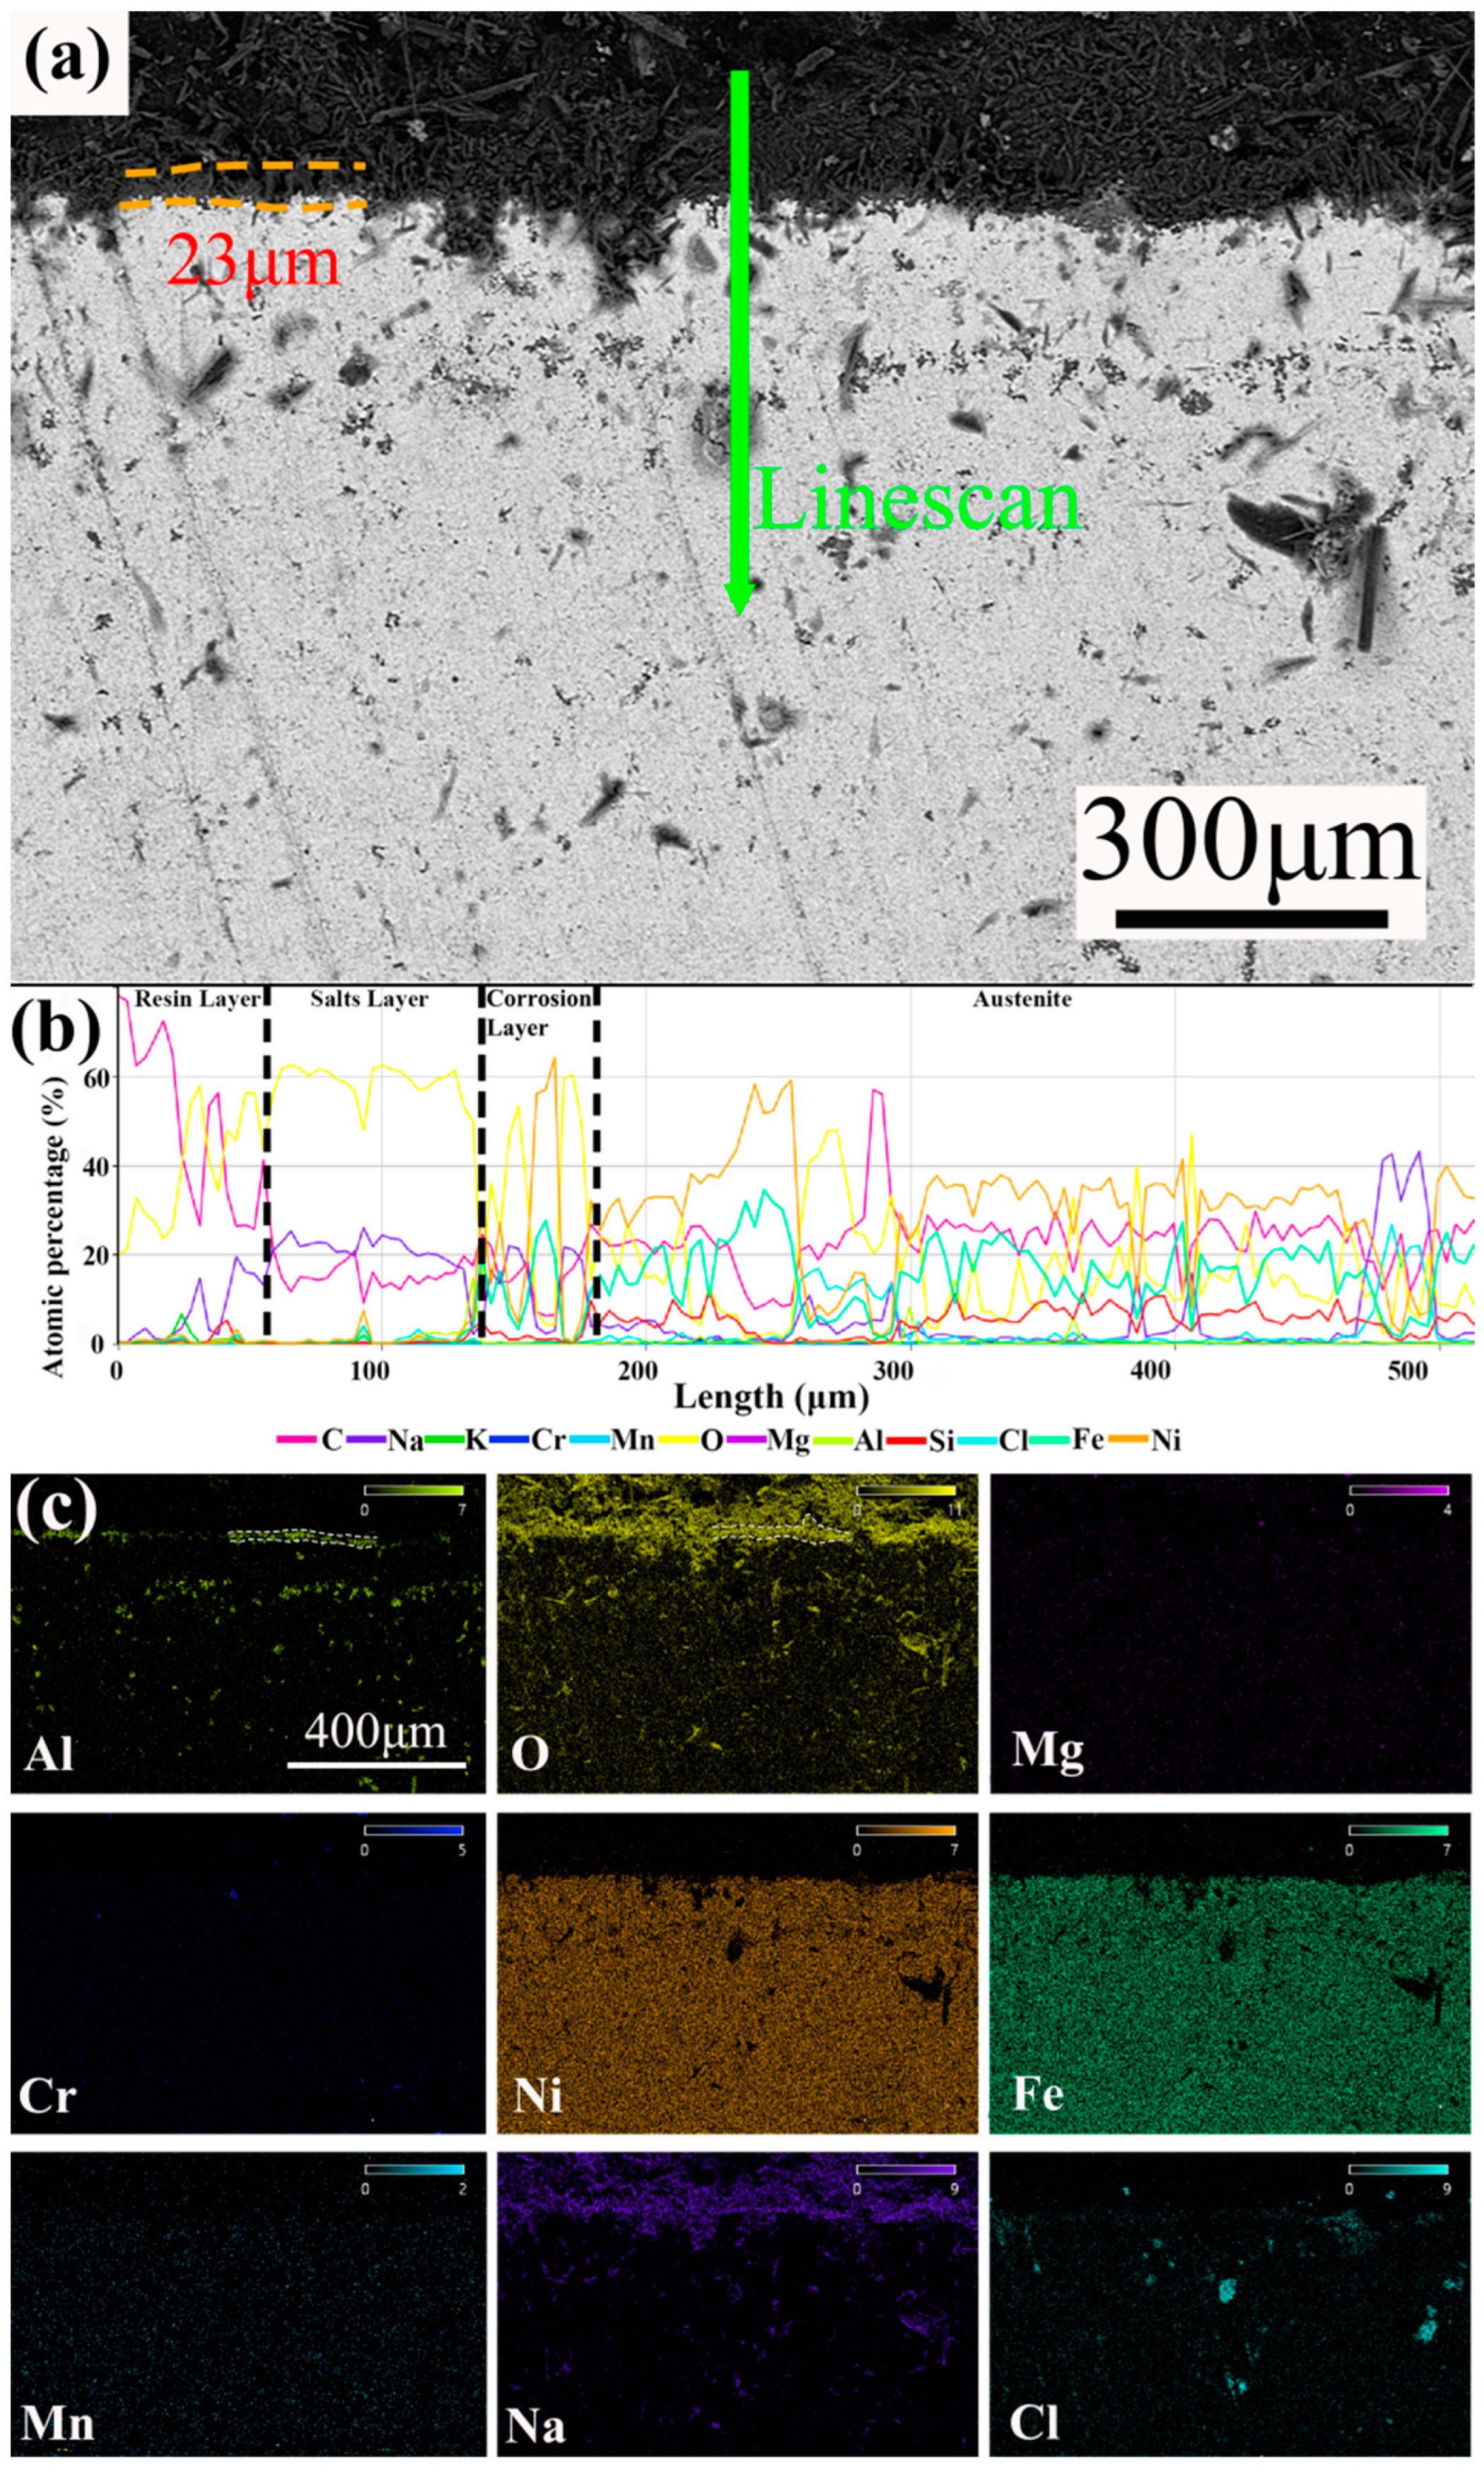
3.3. Cross-Section Analysis
4. Discussion
4.1. Comparison of Experimental Corrosion Rates with and without Mg Addition
4.2. Effect of Added Mg and Corrosion Mechanism
5. Conclusions
- (1)
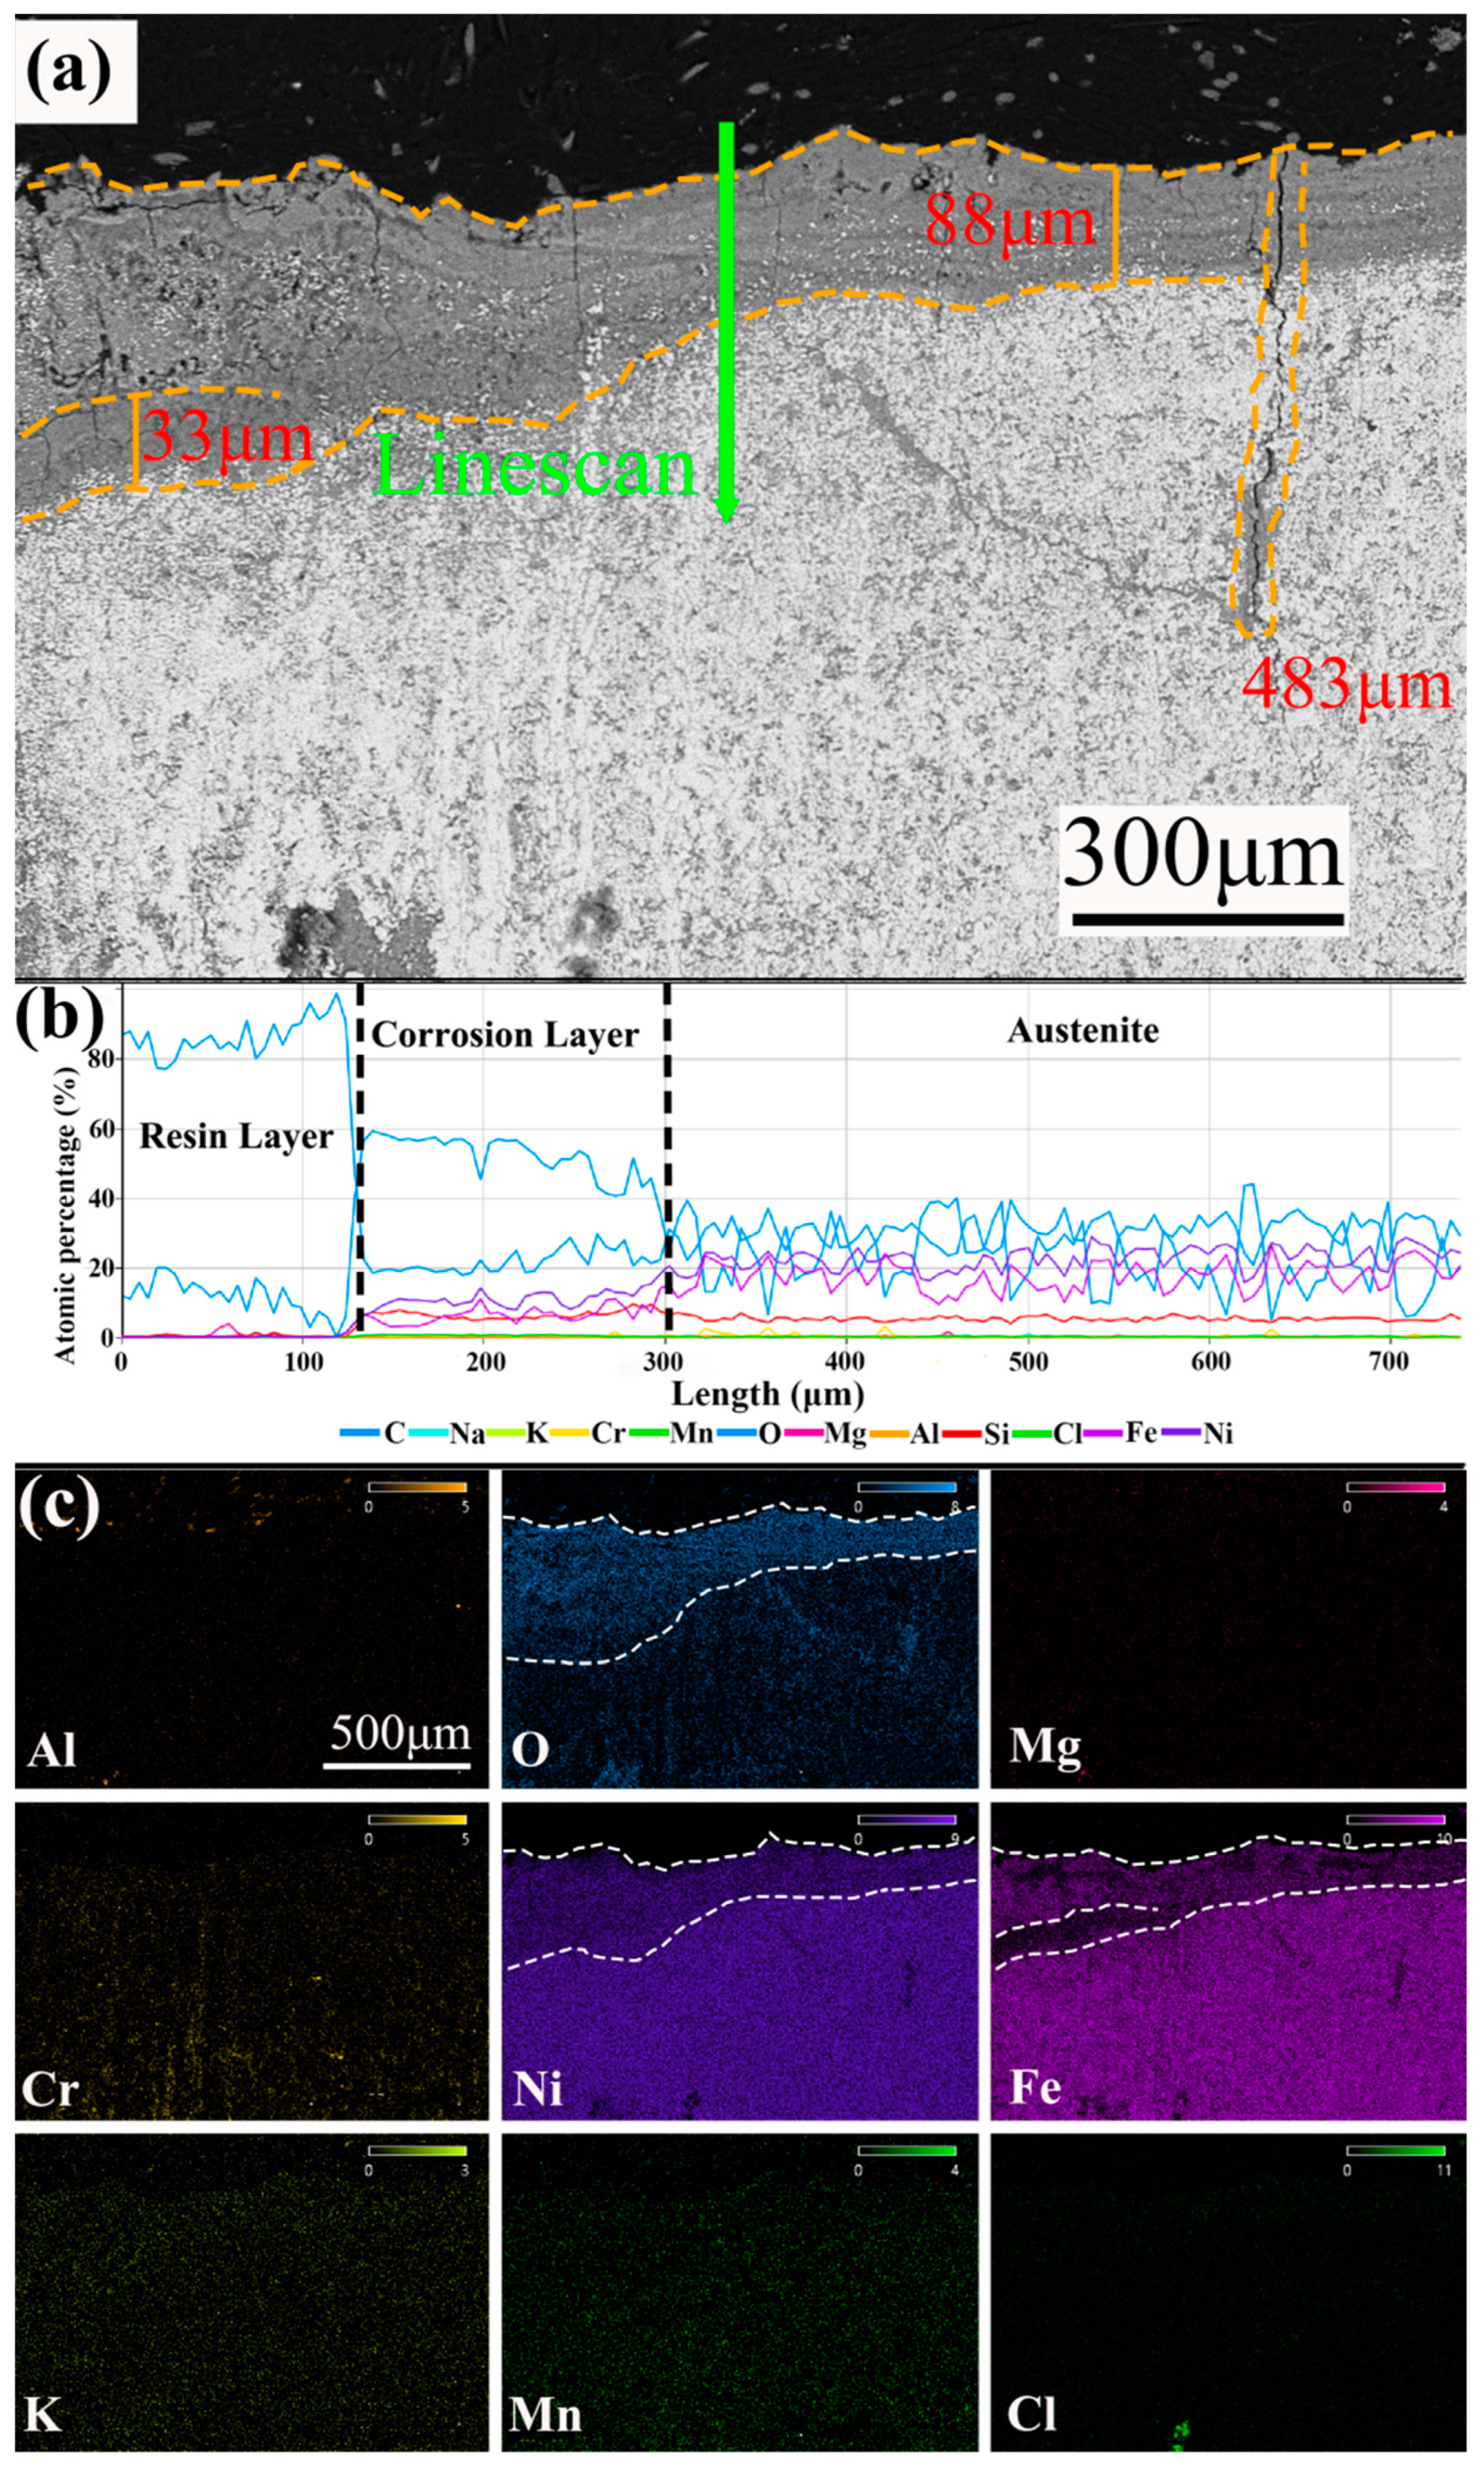
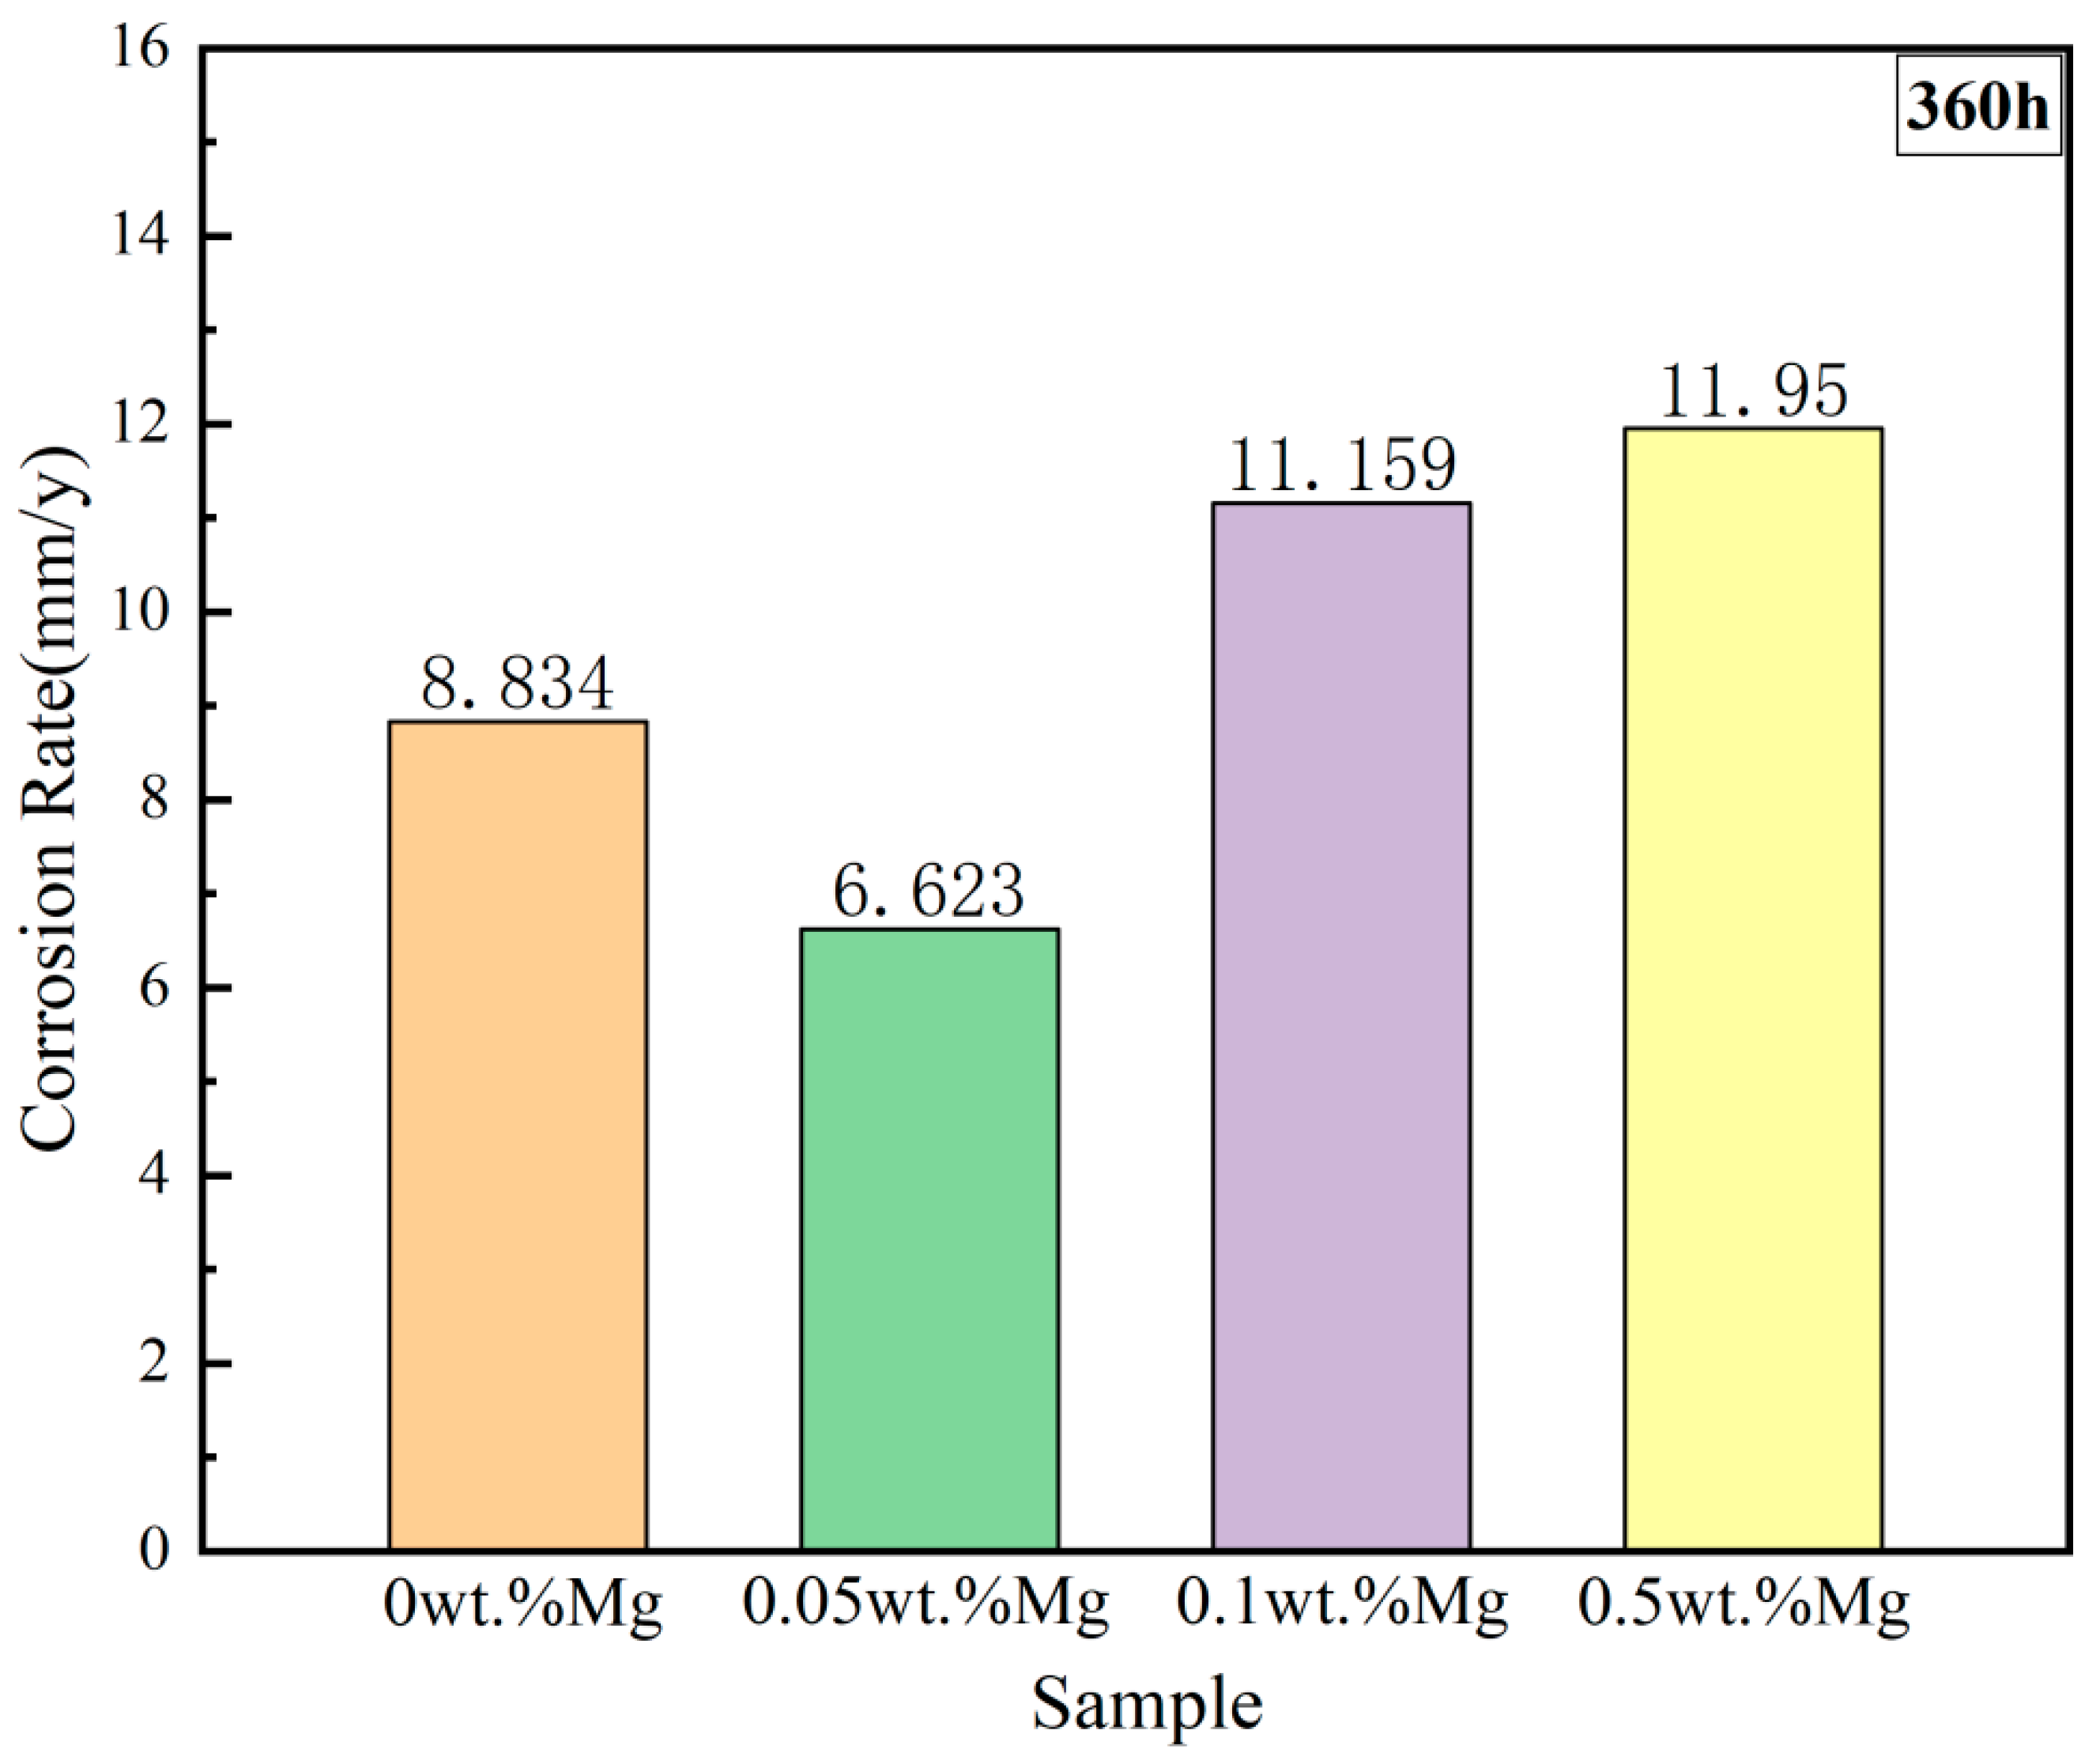
- The corrosion rates of the test alloys were, in order, 0.05 wt.% Mg < 0 wt.% Mg < 0.1 wt.% Mg < 0.5 wt.% Mg. The specimen with 0.05 wt.% Mg added had a corrosion layer thickness of 33 μm and had the lowest corrosion rate of 6.623 mm/y. For 310S stainless steel with aluminum, the best corrosion inhibition was achieved by adding 0.05 wt.% Mg in chloride salt.
- (2)
- The presence of Mg can actively engage in the corrosion process by reacting with corrosive impurities to form MgO. While the addition of Mg influences the formation of corrosion products, the quantity of Mg added does not impact the alteration of these products.
- (3)
- An excessive amount of Mg contributes to an increased corrosion rate of the specimen. Elevated magnesium content results in the production of more Mg oxide and MgCr2O4. As the reaction time increases, the protective layer sheds, leading to a greater weight loss. Moreover, excess Mg can cause Cr precipitation on the surface of the corrosion layer, facilitating the penetration of chloride molten salts into the substrate and worsening corrosion.
Author Contributions
Funding
Data Availability Statement
Conflicts of Interest
References
- Kuravi, S.; Trahan, J.; Goswami, D.Y.; Rahman, M.M.; Stefanakos, E.K. Thermal energy storage technologies and systems for concentrating solar power plants. Prog. Energy Combust. Sci. 2013, 39, 285–319. [Google Scholar] [CrossRef]
- Mehos, M.; Turchi, C.; Vidal, J.; Wagner, M.; Ma, Z.; Ho, C.; Kolb, W.; Andraka, C.; Kruizenga, A. Concentrating Solar Power Gen3 Demonstration Roadmap; National Renewable Energy Lab. (NREL): Golden, CO, USA, 2017. [Google Scholar]
- Sun, H.; Liu, J. Hot corrosion of Fe-Cr-Ni multi-principal element alloys in Na2SO4+ 25% NaCl mixture salts at 700–900 °C. Intermetallics 2024, 166, 108203. [Google Scholar] [CrossRef]
- Liu, B.; Wei, X.; Peng, Q.; Ding, J.; Yang, J. Preparation of pentachloride molten salt and its heat transfer and storage properties. J. Sol. Energy 2018, 39, 1815–1821. [Google Scholar]
- Liu, S.; Wang, R.; Wang, L.; Ge, F.; Gao, M.; Si, Y.; Li, B. Corrosion behavior of iron-based and Ni-based alloys melted in NaCl–MgCl2–KCl mixed molten salt under vacuum atmosphere. J. Mater. Res. Technol. 2024, 28, 1915–1923. [Google Scholar] [CrossRef]
- Xu, S.; Zheng, Y.; Zhan, F.; La, P. Effect of Al content on in-situ formation of Al2O3 protective layer on Ni-Al coatings in high-temperature chloride molten salt. Mater. Lett. 2024, 364, 136300. [Google Scholar] [CrossRef]
- Wei, Y.; La, P.; Jin, J.; Du, M.; Zheng, Y.; Zhan, F.; Sheng, J.; Yu, H.; Zhu, M. Corrosion Behavior of Aluminum-Forming Alloy 310S for Application in Molten Chloride Salt CSP Thermal Storage Tank. Front. Mater. 2022, 9, 886285. [Google Scholar] [CrossRef]
- Ding, W.; Shi, H.; Xiu, Y.; Bonk, A.; Weisenburger, A.; Jianu, A.; Bauer, T. Hot corrosion behavior of commercial alloys in thermal energy storage material of molten MgCl2/KCl/NaCl under inert atmosphere. Sol. Energy Mater. Sol. Cells 2018, 184, 22–30. [Google Scholar] [CrossRef]
- Smith, D.M.; Neu, M.P.; Garcia, E.; Morales, L.A. Hydration of plutonium oxide and process salts, NaCl, KCl, CaCl2, MgCl2: Effect of calcination on residual water and rehydration. Waste Manag. 2000, 20, 479–490. [Google Scholar] [CrossRef]
- Trahan, J.; Kuravi, S.; Goswami, D.Y.; Rahman, M.; Stefanakos, E. Thermal Characterization of High Temperature Inorganic Phase Change Materials for Thermal Energy Storage Applications. Energy Sustain. 2012, 44816, 623–630. [Google Scholar]
- Shoval, S.; Yariv, S.; Kirsh, Y.; Peled, H. The effect of alkali halides on the thermal hydrolysis of magnesium chloride and magnesium bromide. Thermochim. Acta 1986, 109, 207–226. [Google Scholar] [CrossRef]
- Friedrich, H.E.; Mordike, B.L. Magnesium Technology; Springer: Berlin/Heidelberg, Germany, 2006. [Google Scholar]
- Fife, K.W.; Bowersox, D.F.; Christensen, D.C.; Williams, J.D. Preparation of Fused Chloride Salts for Use in Pyrochemical Plutonium Recovery Operations at Los Alamos; Los Alamos National Lab. (LANL): Los Alamos, NM, USA, 1986. [Google Scholar]
- Ding, W.; Shi, H.; Jianu, A.; Xiu, Y.; Bonk, A.; Weisenburger, A.; Bauer, T. Molten chloride salts for next generation concentrated solar power plants: Mitigation strategies against corrosion of structural materials. Sol. Energy Mater. Sol. Cells 2019, 193, 298–313. [Google Scholar] [CrossRef]
- Dariva, C.G.; Galio, A.F. Corrosion inhibitors–principles, mechanisms and applications. Dev. Corros. Prot. 2014, 16, 365–378. [Google Scholar]
- Sridharan, K.; Allen, T. Corrosion in Molten Salts, Molten Salts Chemistry; Elsevier: Amsterdam, The Netherlands, 2013; pp. 241–267. [Google Scholar]
- ASTM G1-03 (2017) e1; Standard Practice for Preparing, Cleaning, and Evaluating Corrosion Test Specimens. ASTM International: West Conshohocken, PA, USA, 2017.
- Bai, Z. Mechanical Properties and Corrosion Behavior of High-Alumina 310S Heat-Resistant Steel with Carbonate Molten Salt; Lanzhou University of Science and Technology: Lanzhou, China, 2023; pp. 29–31. [Google Scholar]
- Fernández, G.A.; Cabeza, F.L. Corrosion evaluation of eutectic chloride molten salt for new generation of CSP plants. Part 2: Materials screening performance. J. Energy Storage 2020, 29, 101381. [Google Scholar] [CrossRef]
- Wang, P.-M.; Xu, Q.-W. Material Research Methods; Science Publishing House: New York, NY, USA, 2017; p. 71. [Google Scholar]
- Mortazavi, A.; Zhao, Y.; Esmaily, M.; Allanore, A.; Vidal, J.; Birbilis, N. High-temperature corrosion of a nickel-based alloy in a molten chloride environment–The effect of thermal and chemical purifications. Sol. Energy Mater. Sol. Cells 2022, 236, 111542. [Google Scholar] [CrossRef]
- Yu, R.; Gong, Q.; Shi, H.; Chai, Y.; Bonk, A.; Weisenburger, A.; Wang, D.; Müller, G.; Bauer, T.; Ding, W. Corrosion behavior of Fe-Cr-Ni based alloys exposed to molten MgCl2-KCl-NaCl salt with over-added Mg corrosion inhibitor. Front. Chem. Sci. Eng. 2023, 17, 1608–1619. [Google Scholar] [CrossRef]
- Ozeryanaya, I. Corrosion of metals by molten salts in heat-treatment processes. Met. Sci. Heat Treat. (Engl. Transl.) 1985, 27, 184–188. [Google Scholar] [CrossRef]
- Garcia-Diaz, B.L.; Olson, L.; Martinez-Rodriguez, M.; Fuentes, R.; Colon-Mercado, H.; Gray, J. High temperature electrochemical engineering and clean energy systems. J. South Carol. Acad. Sci. 2016, 14, 4. [Google Scholar]
- Anderson, M.; Sridhara, K.; Allen, T.; Peterson, P. Liquid Salt Heat Exchanger Technology for VHTR Based Applications; University of Wisconsin: Madison, WI, USA; University of California: Los Angeles, CA, USA, 2012. [Google Scholar]
- Fernández, A.G.; Cabeza, L.F. Corrosion evaluation of eutectic chloride molten salt for new generation of CSP plants. Part 1: Thermal treatment assessment. J. Energy Storage 2020, 27, 101125. [Google Scholar] [CrossRef]
- Ding, W.; Bonk, A.; Gussone, J.; Bauer, T. Electrochemical measurement of corrosive impurities in molten chlorides for thermal energy storage. J. Energy Storage 2018, 15, 408–414. [Google Scholar] [CrossRef]
- Shi, H.; Wu, T.; Gong, Q.; Ding, W.; Chai, Y.; Weisenburger, A.; Chang, L.; Zhang, Z.; Wang, K.; Richter, J.; et al. Hot corrosion behavior of additively manufactured stainless steel 316L and Inconel 718 in MgCl2/KCl/NaCl chloride salts at 700 °C. Corros. Sci. 2022, 207, 110561. [Google Scholar] [CrossRef]
- Grégoire, B.; Oskay, C.; Meißner, T.; Galetz, M. Corrosion mechanisms of ferritic-martensitic P91 steel and Inconel 600 nickel-based alloy in molten chlorides. Part I: NaCl–KCl binary system. Sol. Energy Mater. Sol. Cells 2020, 215, 110659. [Google Scholar] [CrossRef]
- Grégoire, B.; Oskay, C.; Meißner, T.; Galetz, M. Corrosion mechanisms of ferritic-martensitic P91 steel and Inconel 600 nickel-based alloy in molten chlorides. Part II: NaCl-KCl-MgCl2 ternary system. Sol. Energy Mater. Sol. Cells 2020, 216, 110675. [Google Scholar] [CrossRef]
- Liu, Q.; Xu, H.; Yin, H.; Li, N.; Wang, W.; Li, L.; Tang, Z.; Qian, Y. Corrosion behaviour of 316 stainless steel in NaCl-KCl-MgCl2 salt vapour at 700 °C. Corros. Sci. 2022, 194, 109921. [Google Scholar] [CrossRef]
- Xu, Z.; Guan, B.; Wei, X.; Lu, J.; Ding, J.; Wang, W. High-temperature corrosion behavior of Inconel 625 alloy in a ternary molten salt of NaCl-CaCl2-MgCl2 in air and N2. Sol. Energy 2022, 238, 216–225. [Google Scholar] [CrossRef]


| C | Si | Mn | Cr | Ni | Al | Fe |
|---|---|---|---|---|---|---|
| 0.075 | 1.97 | 2.08 | 10.22 | 19.29 | 3.03 | Bal. |
| Experimental Condition | 0 wt.% Mg | 0.05 wt.% Mg | 0.1 wt.% Mg | 0.5 wt.% Mg |
|---|---|---|---|---|
| Sample No. | 1 | 2 | 3 | 4 |
| Element | O | Si | C | Ni | Al | Cl | Fe | Mg | Cr | Na | K |
|---|---|---|---|---|---|---|---|---|---|---|---|
| a1 | 45.2 | 6.2 | 13.3 | 8.1 | 11.5 | 6.3 | 0.8 | 0.2 | 0.1 | 5.4 | 2.8 |
| a2 | 53.5 | 5.1 | 14.5 | 7.1 | 6.4 | 4.7 | 1.0 | 0.5 | 0.1 | 4.7 | 2.4 |
| b1 | 49.3 | 0.1 | 9.6 | 0.7 | 0.2 | 1.7 | 11.8 | 10.3 | 13.3 | 2.7 | 0.3 |
| b2 | 55.3 | 2.1 | 10.2 | 3.6 | 26.7 | 0.7 | 1.0 | 0.1 | 0.0 | 0.1 | 0.2 |
| b3 | 40.1 | 0.3 | 12.1 | 0.8 | 3.3 | 7.8 | 3.5 | 0.3 | 21.6 | 7.3 | 2.9 |
| c1 | 59.0 | 2.5 | 8.1 | 0.2 | 26.5 | 0.8 | 0.3 | 0.5 | 0.7 | 0.9 | 0.5 |
| c2 | 59.1 | 0.1 | 11.8 | 0.2 | 15.0 | 0.5 | 0.3 | 2.2 | 4.6 | 6.0 | 0.2 |
| c3 | 55.5 | 1.0 | 13.3 | 0.2 | 15.2 | 0.7 | 0.3 | 0.4 | 2.0 | 10.6 | 0.8 |
| c4 | 60.9 | 0.9 | 8.0 | 0.2 | 21.7 | 0.6 | 0.3 | 1.9 | 4.3 | 0.7 | 0.5 |
| d1 | 62.7 | 0.2 | 11.3 | 3.0 | 0.8 | 2.0 | 15.4 | 0.3 | 0.3 | 2.6 | 1.4 |
| d2 | 22.3 | 0.1 | 15.7 | 0.5 | 2.1 | 44.5 | 1.1 | 0.3 | 0.8 | 10.8 | 1.8 |
| Sample | Mg Addition | Time | ||||
|---|---|---|---|---|---|---|
| 120 h | 240 h | 360 h | 480 h | 600 h | ||
| 1 | 0 wt.%Mg | 45.115 | 25.186 | 8.834 | 8.831 | 7.650 |
| 2 | 0.05 wt.%Mg | 42.458 | 19.080 | 6.623 | 7.112 | 4.556 |
| 3 | 0.1 wt.%Mg | 32.023 | 21.300 | 11.159 | 11.053 | 16.884 |
| 4 | 0.5 wt.%Mg | 37.468 | 25.348 | 11.950 | 9.324 | 16.009 |
Disclaimer/Publisher’s Note: The statements, opinions and data contained in all publications are solely those of the individual author(s) and contributor(s) and not of MDPI and/or the editor(s). MDPI and/or the editor(s) disclaim responsibility for any injury to people or property resulting from any ideas, methods, instructions or products referred to in the content. |
© 2024 by the authors. Licensee MDPI, Basel, Switzerland. This article is an open access article distributed under the terms and conditions of the Creative Commons Attribution (CC BY) license (https://creativecommons.org/licenses/by/4.0/).
Share and Cite
Wei, Y.; Cao, J.; Yu, H.; Sheng, J.; La, P. Effect of Mg Addition on Molten Chloride Salt Corrosion Resistance of 310S Stainless Steel with Aluminum. Metals 2024, 14, 1109. https://doi.org/10.3390/met14101109
Wei Y, Cao J, Yu H, Sheng J, La P. Effect of Mg Addition on Molten Chloride Salt Corrosion Resistance of 310S Stainless Steel with Aluminum. Metals. 2024; 14(10):1109. https://doi.org/10.3390/met14101109
Chicago/Turabian StyleWei, Ying, Junjia Cao, Haicun Yu, Jie Sheng, and Peiqing La. 2024. "Effect of Mg Addition on Molten Chloride Salt Corrosion Resistance of 310S Stainless Steel with Aluminum" Metals 14, no. 10: 1109. https://doi.org/10.3390/met14101109