Article

Comparative Analysis of Mechanical Properties and Microstructure of 7B52 Aluminum Alloy Laser-MIG Hybrid Welding and MIG Welding Joints

1
The Ningbo Branch of Ordnance Science Institute of China, Ningbo 315000, China
2
School of Materials Science and Engineering, Harbin Institute of Technology, Harbin 150000, China
3
Ningbo Institute of Materials Technology & Engineering, Chinese Academy of Sciences, Ningbo 315201, China
*
Author to whom correspondence should be addressed.
Metals 2024, 14(10), 1110; https://doi.org/10.3390/met14101110
Submission received: 2 July 2024 / Revised: 9 August 2024 / Accepted: 16 August 2024 / Published: 27 September 2024
(This article belongs to the Section Welding and Joining)

Abstract

:
Laser-MIG hybrid welding and MIG welding were carried out on 7B52 aluminum alloy, and the microstructure and mechanical properties of the joints were compared and analyzed. The results show that the average grain sizes of laser-MIG hybrid welding, MIG welding, and the laser weld zone are 18.38 μm, 24.16 μm, and 15.96 μm, respectively. The width of the HAZ of the laser zone is lower than that of the laser-MIG hybrid welding zone and MIG welding zone. The hardness is higher than that of the hybrid welding zone and MIG welding zone. The tensile strength of each laser-MIG hybrid welding joint zone is better than that of the MIG welding zone. The tensile strength of the laser zone is the worst. When stress ratio R = 0.1 and fatigue cycle Nf = 106, the fatigue strength of the laminated zone of the laser-MIG hybrid welding joint is better than that of the MIG welding joint, and the welding defect is the leading cause of fatigue cracks.

1. Introduction

The 7B52 aluminum alloy is a new generation of ultra-high-strength aluminum alloy made of 7A52, 7A62, and 7A01 plates by hybrid rolling, which has the advantages of low density, excellent welding performance, high specific strength, and exceptional corrosion resistance. Therefore, it is applied in aerospace manufacturing, automotive manufacturing, etc. [1,2,3,4]. Although the static load bearing capacity of welded joints is generally comparable to that of the parent material, their ability to withstand fatigue loads is much lower than that of the parent material, so it restricts the depth of application of the welding process in some critical structural components. The welding process is a direct factor in the fatigue performance of welded joints; when the welded joints in service are subjected to cyclic loading, fatigue damage becomes the main form of damage to welded structural components. The quality of welded joints obtained by different welding processes is different [5,6,7,8]. Conventional aluminum alloy welding generally uses MIG welding, which has a considerable depth of fusion but high heat input. Laser-MIG hybrid welding is an advanced welding method with the advantages of high welding efficiency and good weld shaping, which is based on the principle that the laser and the MIG arc are used as a hybrid heat source, acting together on the metal surface. The characteristics of solid laser penetration are utilized to increase the depth of fusion, then MIG welding is used to fill the wire to achieve the welding purpose [9,10,11,12,13,14,15]. Yin Zhang [16] conducted an in situ observation study on the fatigue life of 7075-T6 laser-arc hybrid welded joints. It was found that the ratio of fatigue crack initiation life to failure life of the base material (BM) was 64.5%; the ratio of fatigue crack initiation life to failure life of the joint was 20.2%. A scanning electron microscope (SEM) found many challenging nests in the fracture region of the BM and many pores in the fracture region of the weld. Chenfeng Duan [17] investigated the MIG welding forming and fatigue behavior of the 6005A-T6 aluminum alloy. It was found that the weld is an equiaxial crystal organization, and the grain size in the heat-affected zone is more significant than that of the BM; the tensile strength of the welded joint is 191 MPa, which is 67% of that of the BM; there is a reinforced phase in the fatigue fracture of the BM, and the mode of fracture is toughness fracture; there is a river pattern in the fatigue fracture of the welded joint, and the mode of fracture is disintegration fracture. Hong Hao [18] investigated the effects of fatigue behavior on MIG-welded 6005A-T6 aluminum alloys with stress ratios of −1, −0.06, and 0.06, on low cycle fatigue properties, and with the deformation organization of the 2124-T851 aluminum alloy. It was found that the material exhibits cyclic softening, which increases with increasing strain amplitude and decreasing stress ratio. The larger the stress ratio, the lower the flexibility and fatigue life of the material. For a certain strain amplitude, the slip band density, length, and volume fraction of coarse tissue increases with increasing stress ratio, thus decreasing the fatigue life and flexibility of the material. A.R. Cisko [19] investigated the microstructure and fatigue properties of AA2099 plates through testing and modeling. The results revealed that the suitable phases, T1 and δ’ phases, were found within the plates after rolling, which improved the material strength [20,21,22]; the fatigue source was Cu-rich particles with an average particle size of 12 μm, and these Cu-rich interlayer compounds affected the fatigue properties of the material.
At present, research on the fatigue of 7xxx series aluminum alloys are primarily aimed at the BM or other welding methods, and there are few studies on the fatigue properties of laser-MIG hybrid welding and MIG-welded joints. 7B52 aluminum alloy welded joints are mainly used in weapons and aerospace structural components; its service process is bound to be under fatigue loads, and the welded joints’ service reliability will directly impact the service life of structural elements and even personnel safety. Fatigue testing of welded joints will help assess the structural components’ service reliability. Considering the influence of laser joining on the weld organization based on MIG arc and the complexity of 7B52 aluminum alloy as a laminated material, it becomes necessary to make a comparative study on the microstructure and fatigue properties of laser-MIG hybrid welding, and MIG-welded joints of 7B52 aluminum alloy. In this paper, laser-MIG hybrid welding and MIG welding were selected to weld 7B52 aluminum alloy. The welded joints’ microstructure and mechanical properties were compared and analyzed.

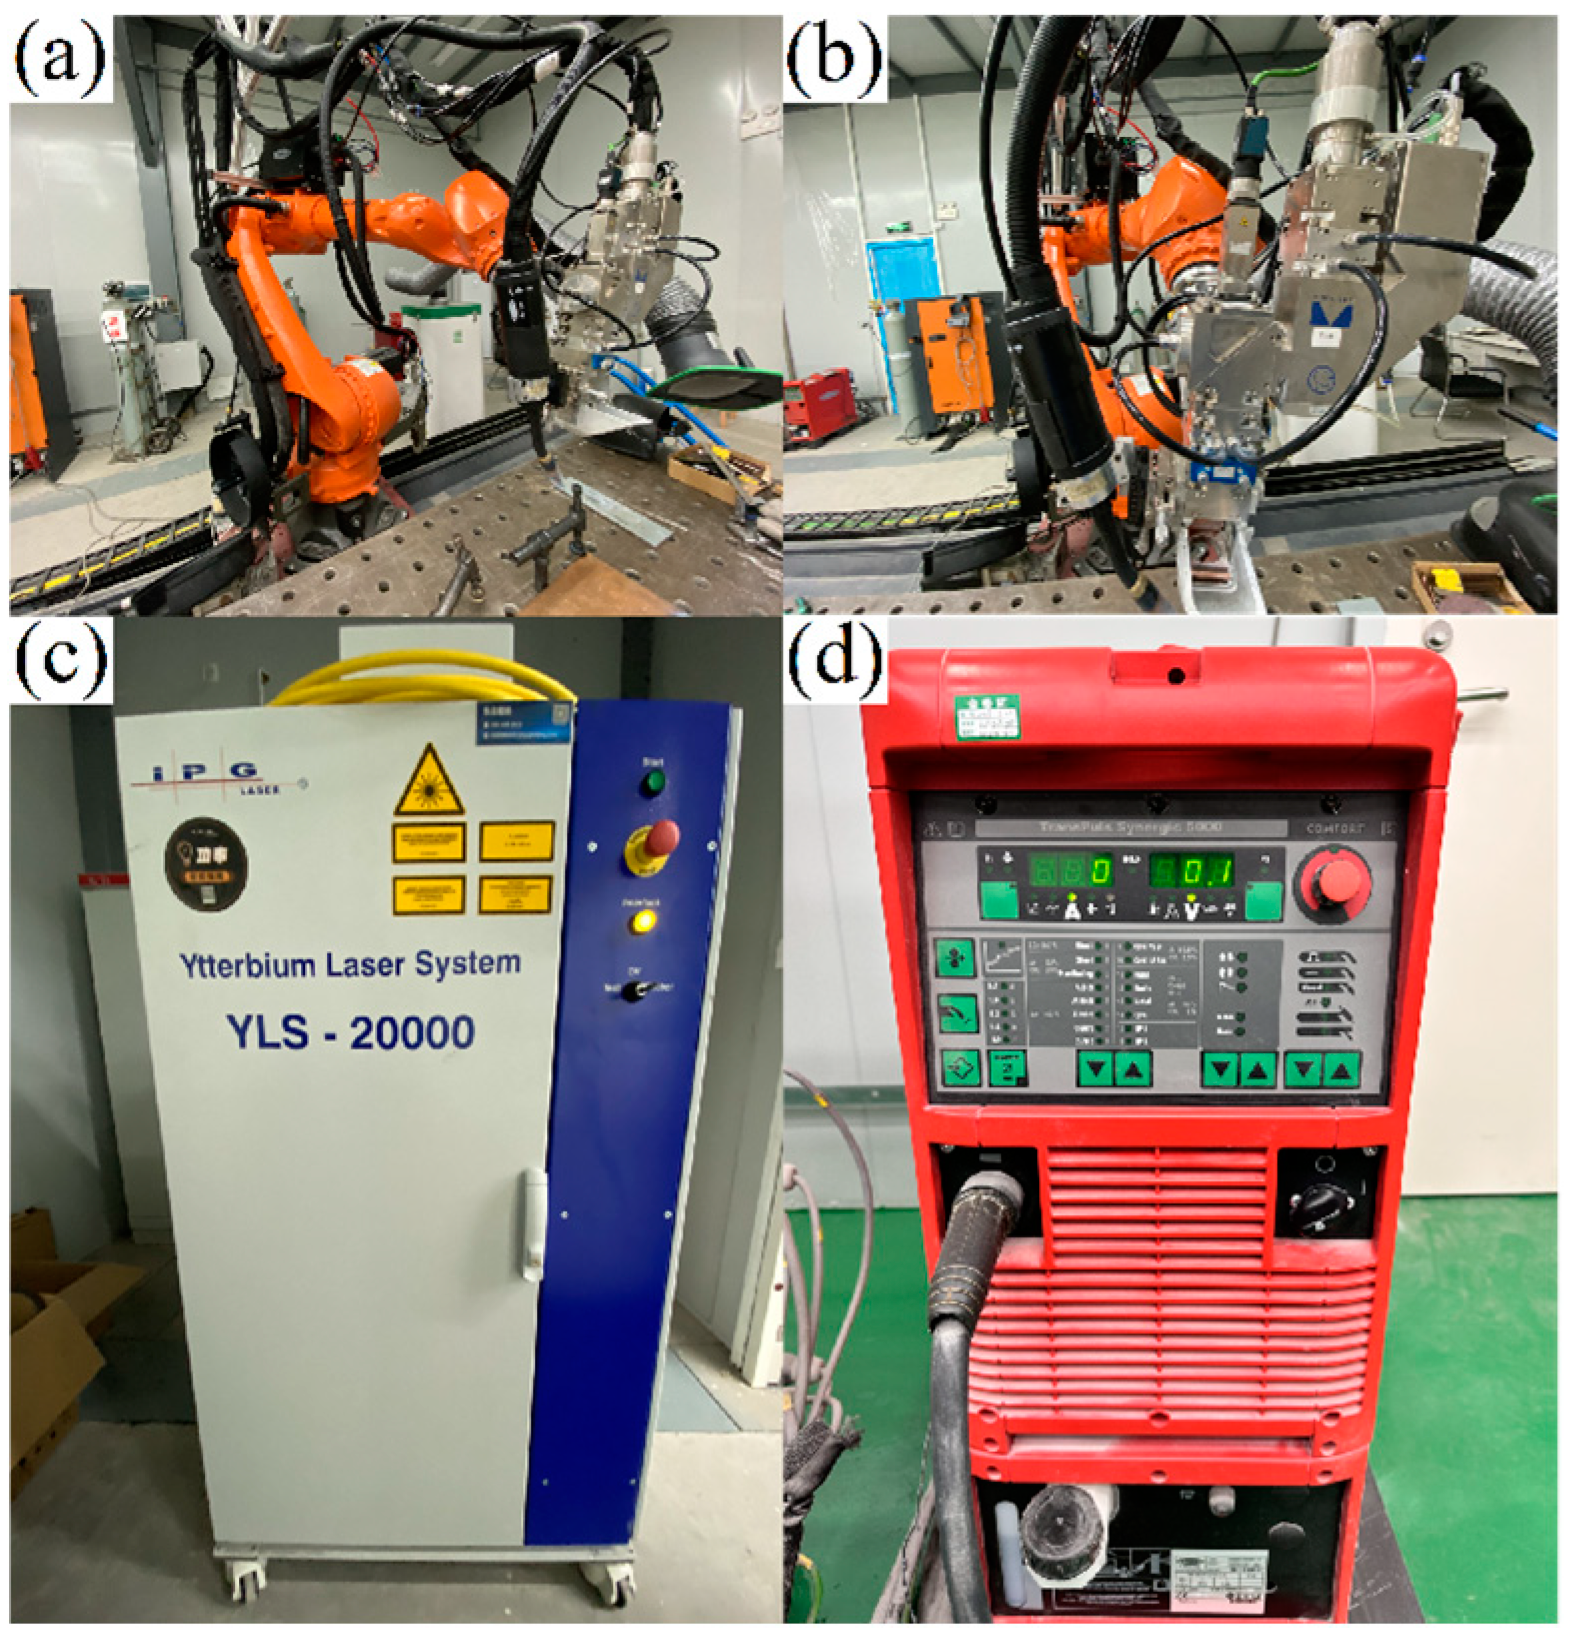
2. Materials and Experiments

2.1. Materials

The size of the test panel is 500 × 150 × 20 mm, with an 80° groove and a 5 mm blunt edge. The welded joint adopts a butt joint form. The 1.6 mm diameter ER5356 aluminum alloy welding wire produced by SAF company (Paris, French). The welding process parameters are shown in Table 1. The alloying elements of the welding wire and plate layers are shown in Table 2. The laser MIG hybrid welding test plate adopts single laser welding as the bottom and laser-MIG hybrid welding as the filling and covering. The welding sequence of the hybrid welding test plate is first laser welding (priming welding), then filler welding (laser-MIG hybrid welding), and finally cover welding (laser-MIG hybrid welding).
The equipment used for the welding test is shown in Figure 1: Figure 1a shows the KUKA welding robot (KUKA Schweissanlagen + Roboter GmbH, Bavaria, Germany); Figure 1b shows the YW SCAN52 (IPG Photonics Corporation, Massachusetts, American) laser head; Figure 1c shows the YLS-20000 laser from IPG company (IPG Photonics Corporation, Massachusetts, American); and Figure 1d shows Fronius’ TPS5000 MIG welding machine (Fronius International Welding Technology Co., Ltd., Pettenbach, Austria).

2.2. Microstructure Observation

The metallographic organization analysis was carried out after welding. The metallographic experiment was conducted using a ZEISS Axio observer(Carl Zeiss AG, Oberkochen, Germany) optical microscope from Germany, as shown in Figure 2a. The samples were first polished with 240~1500 mesh sandpaper, then polished with 0.5 μm polishing paste, and finally corrupted with an aluminum alloy metallographic corrosive. Finally, microstructure observation was carried out using a metallographic microscope.

2.3. Microhardness Test

A 402MVASD Vickers microhardness tester from AXON (Axon Enterprise, Scottsdale, AZ, USA) in China was used, as shown in Figure 2b.
The laser-MIG hybrid welding process is different from the MIG welding process, so the microhardness is different; in hybrid welding, the bottoming welding is single-laser welding, and the filling and capping are laser-MIG hybrid welding, so the microhardness is also different. Thus, the microhardness test is carried out on the laser-MIG hybrid welding zone, the laser zone and the MIG welding zone.

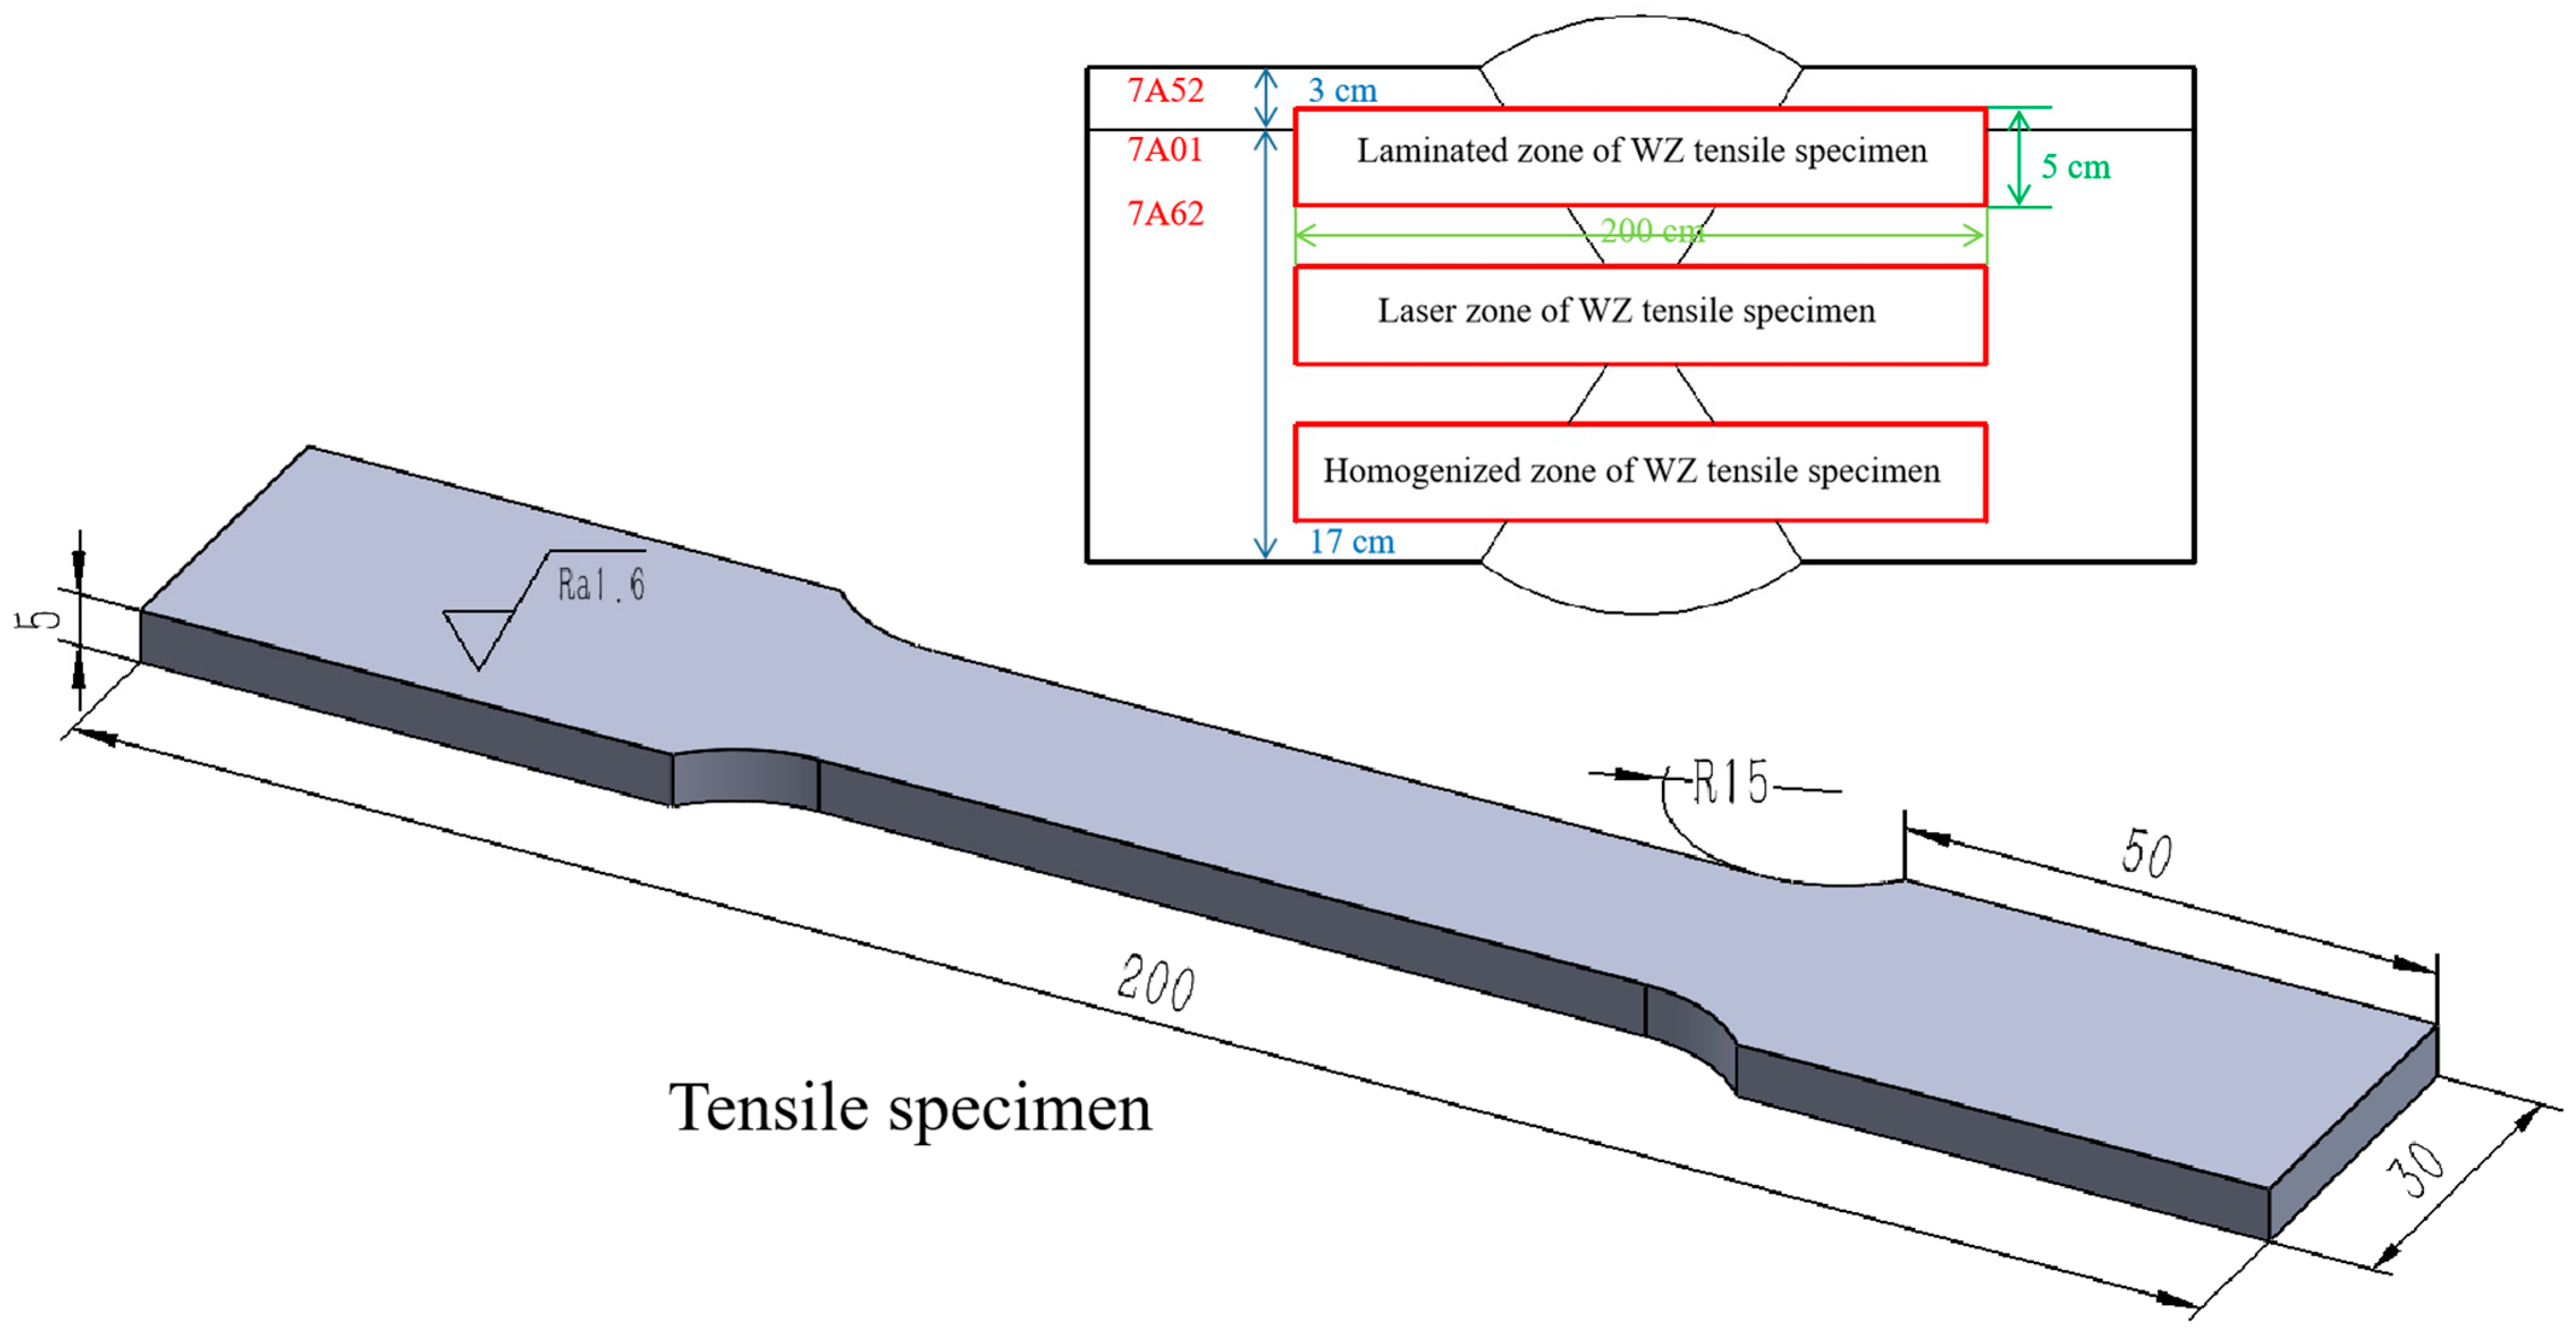
2.4. Tensile Strength Test

The 20 mm thick 7B52 aluminum alloy used for the test was rolled from 7A52, 7A01 and 7A62 plates in order from top to bottom. 7A52 layers were about 3 mm thick, 7A01 layers were about 1 mm thick, and 7A62 layers were about 16 mm thick. Passive edges 5 mm thick were left on the test panels (in the 7A62 layer). A single laser weld was used as a primer on the blunt edge of the hybrid weld test plate, with a depth of fusion of about 5 mm, which just penetrated the blunt edge. The laser-MIG hybrid weld was filled and capped. The length of the tensile specimen was 200 mm, and the thickness was 5 mm; a schematic diagram is shown in Figure 3. To ensure the integrity of the tensile test results, the laser-MIG hybrid weld head sampling locations were hybrid welded in the stacked zone (7A52, 7A62, and 7A01), hybrid welded in the homogeneous zone (7A62), and hybrid welded in the single laser zone (7A62), respectively. The MIG welding head of the priming, filler and cover welding is a MIG welding process, so the sampling is only divided into the MIG welding layer area (7A52, 7A62 and 7A01) and MIG welding homogeneous area (7A62).
The original dimensions of the plate tensile specimen were 200 × 30 × 5 mm, of which the length of the parallel end was 50 mm and the clamped end was 100 mm. The American company INSTRON’s E45.105 microcomputer-controlled electronic universal material testing machine (Instron company, Norwood, MA, USA) adopted the tensile testing equipment. The tensile test is conducted at room temperature with a 1 mm/min tensile rate. The equipment is shown in Figure 2c.

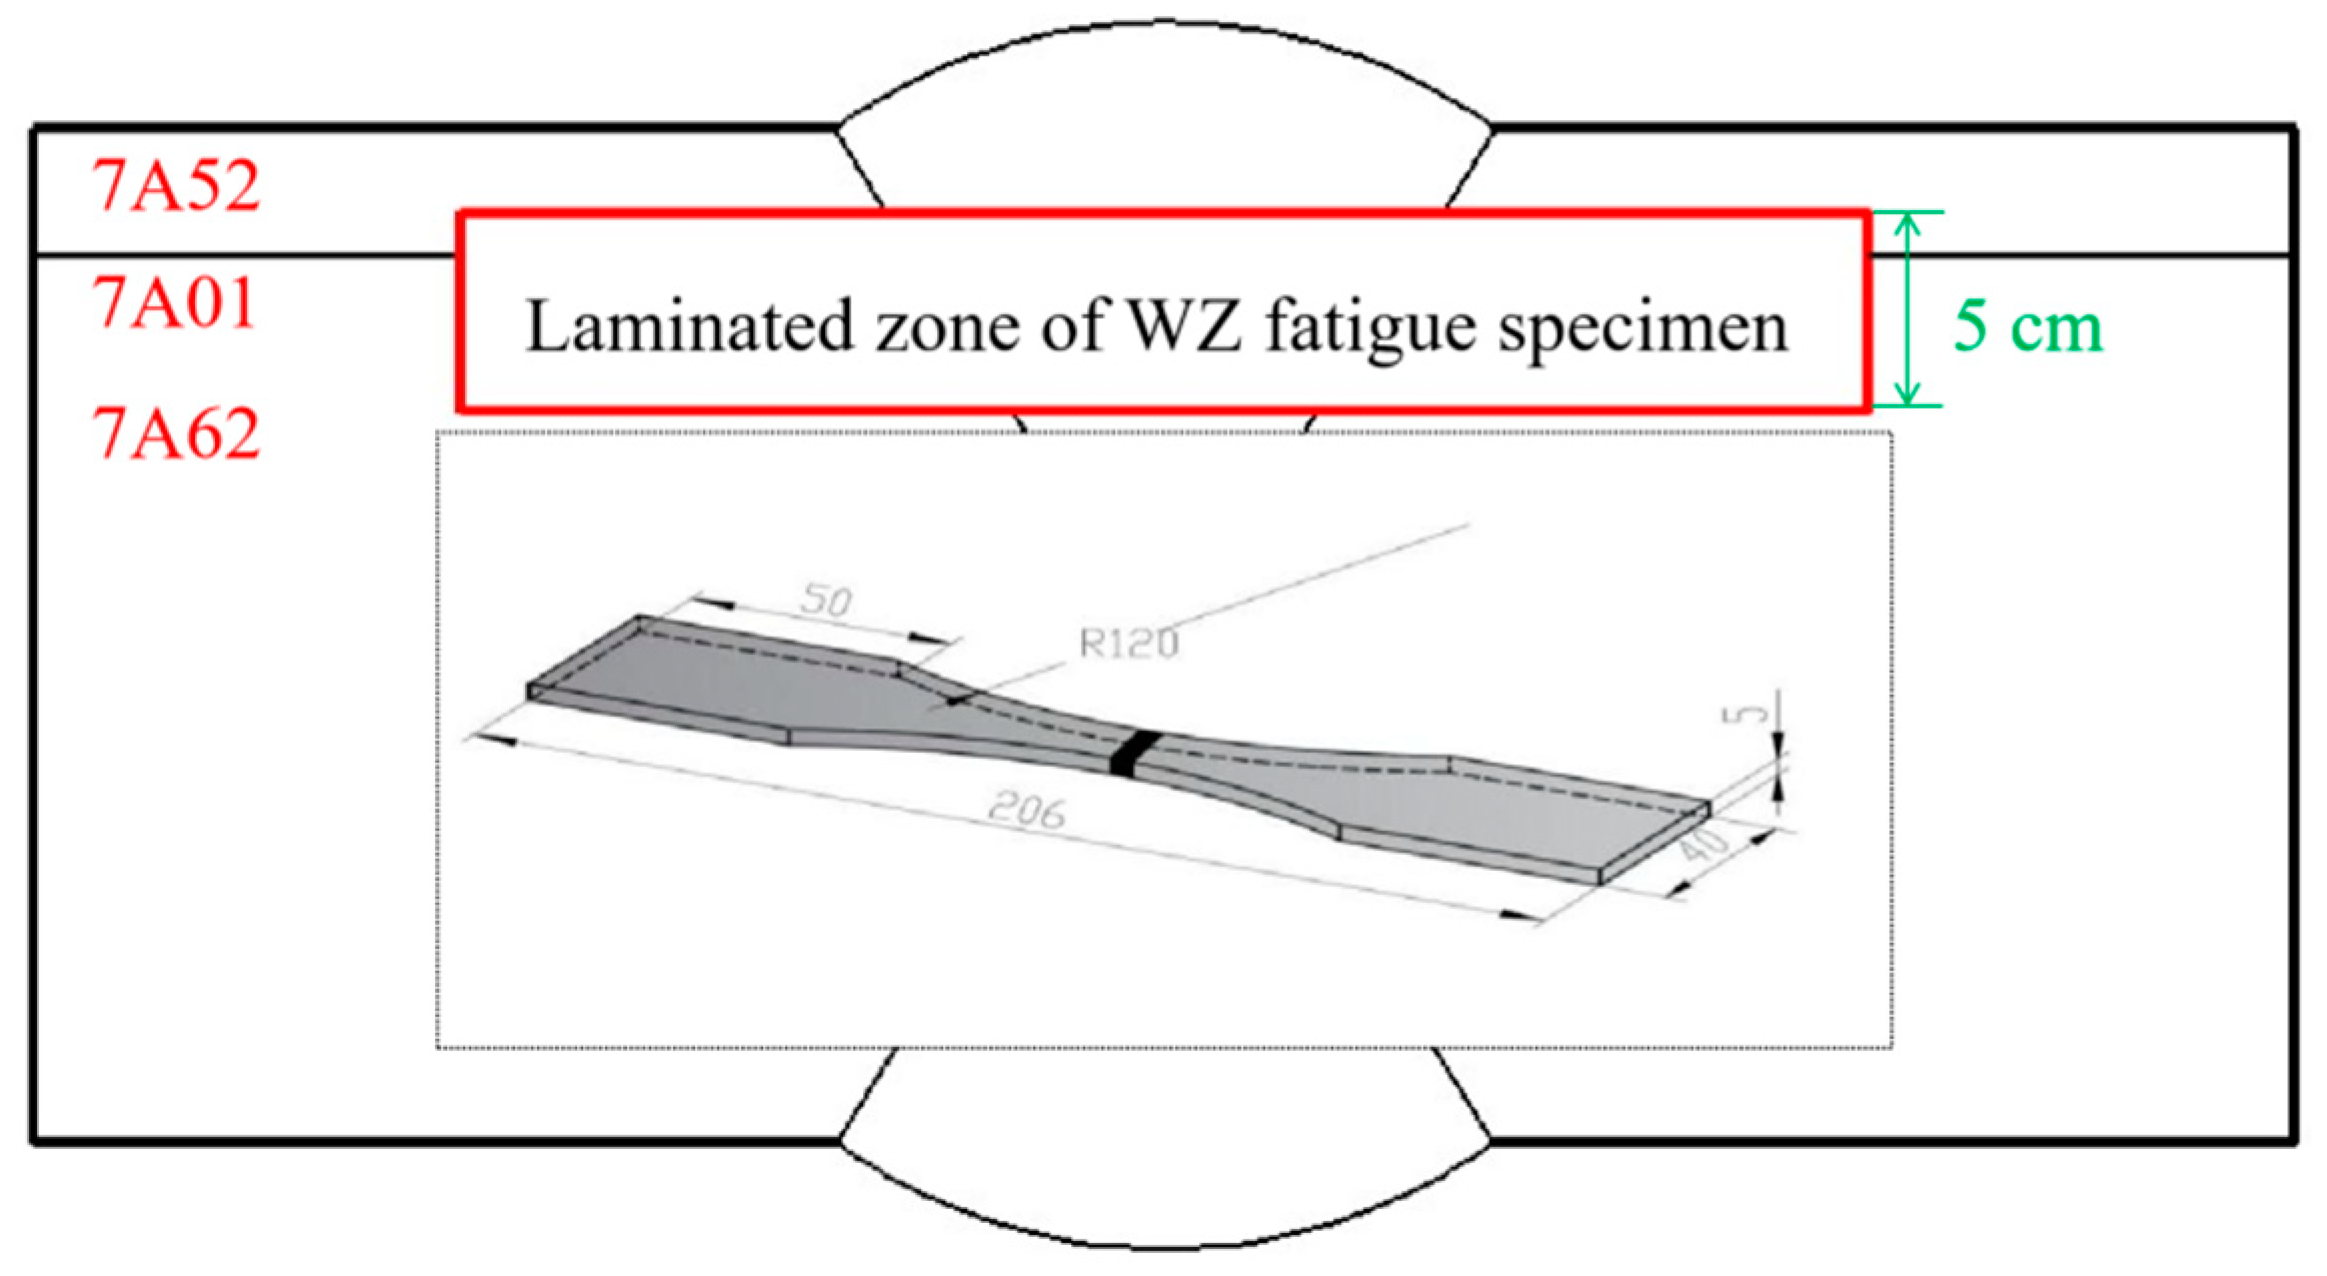
2.5. High-Cycle Fatigue Test

The smooth axial fatigue limit was tested under stress ratio R = 0.1, loading frequency 80 Hz, and Nf = 3 × 10⁶ cycles, and the S-N curve was plotted. The fatigue specimen size is 206 mm × 40 mm × 5 mm, the machining dimensions are shown in Figure 4, and the sampling location is located in the weld-laminated zone. After processing is completed, the surface burrs are first polished with coarse sandpaper, and then fine sandpaper is used to remove scratches on the surface of the specimen. Finally, simple mechanical polishing is carried out until the surface of the specimen is smooth and bright.
The size of the fatigue specimen is 206 × 40 × 5 mm, with a clamping end length of 50 mm and a parallel end length of 10 mm. The fatigue testing machine used is the United States INSTRON’s 8802 electrohydraulic servo fatigue testing machine (Instron company, Norwood, MA, USA); the test equipment is shown in Figure 2d.

2.6. Fracture Surfaces

The fracture location of fatigue specimens is generally categorized into the fatigue source, crack extension zone, and instantaneous fracture zone. The tensile and fatigue fracture morphology was observed using a scanning electron microscope under vacuum <10−3 Torr.
When observing the fracture, the FEI QUANTA 250 scanning electron microscope (Thermo Fisher Scientific, Hillsboro, MA, USA) produced in the United States was used, and the equipment is shown in Figure 2e.

3. Results

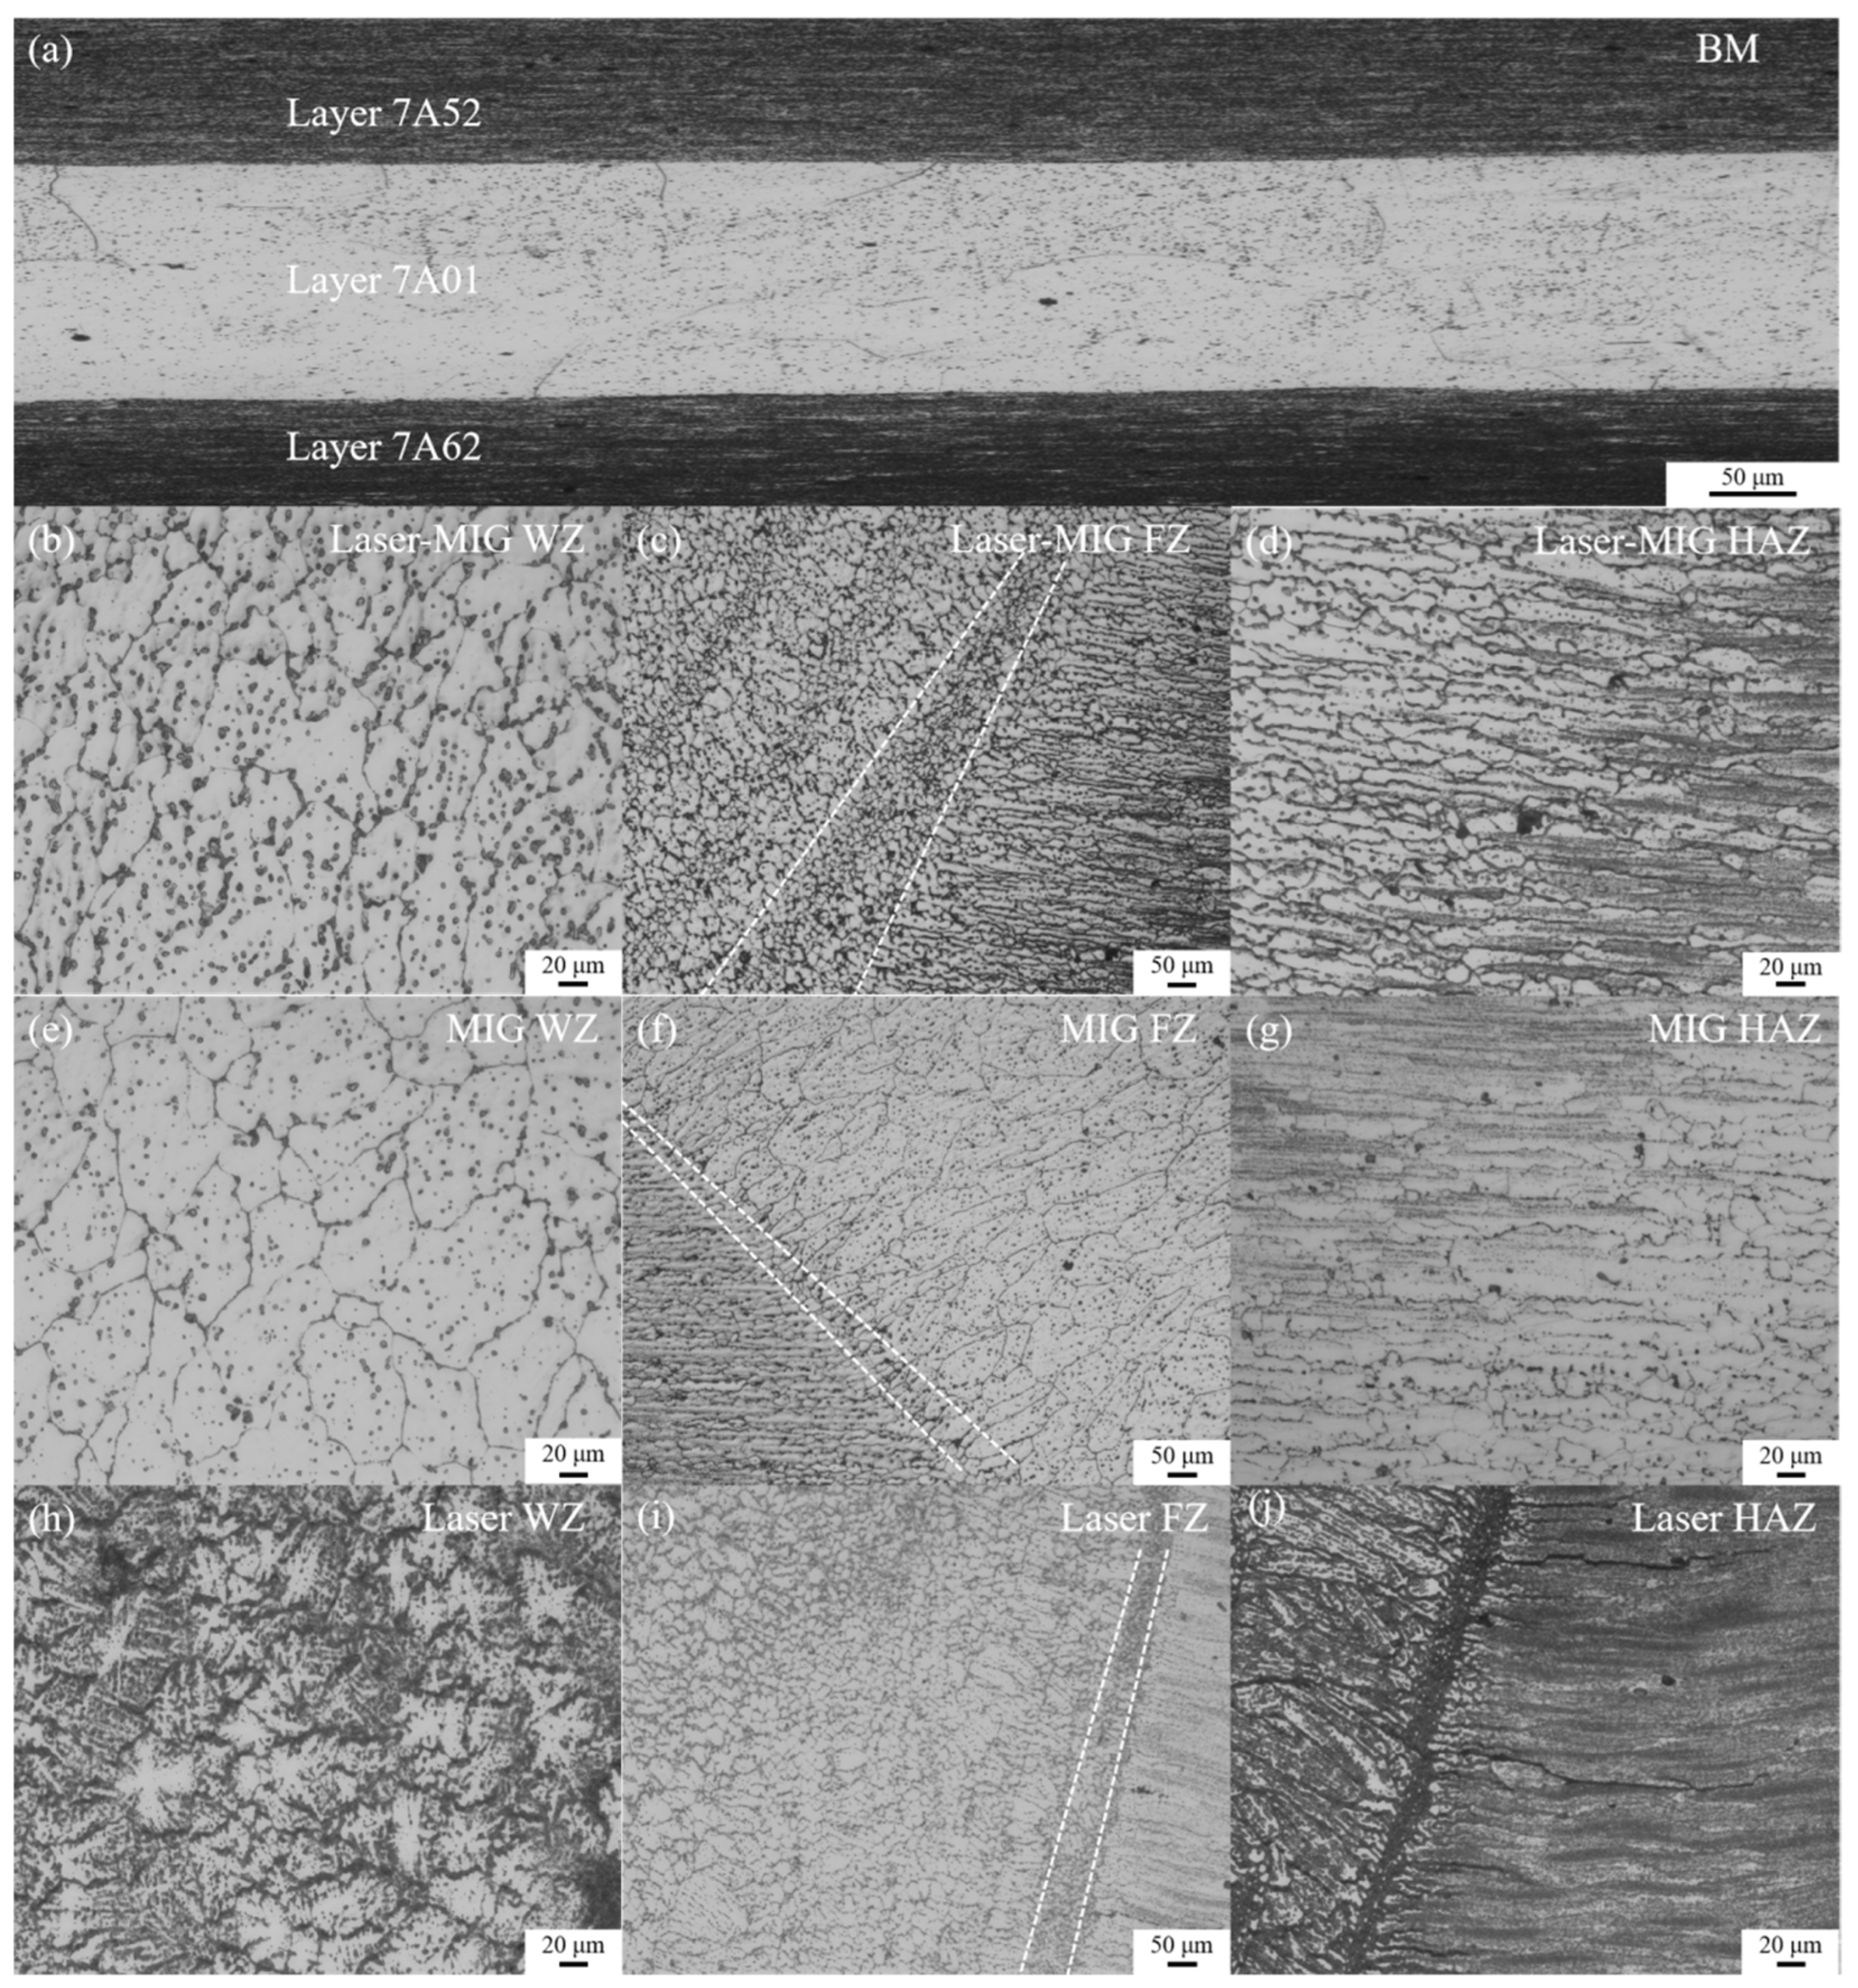
3.1. Microstructure Analysis

Figure 5 shows the macroscopic metallographs of the welded joints obtained by the two welding methods. Figure 5a is the macroscopic morphology of the laser-MIG hybrid welding joint. Figure 5b is the macroscopic morphology of MIG welding head.
Figure 6 shows the BM and welded joints’ metallographic microstructure. Figure 6a is the BM, from the top to bottom of the 7A52 layer, 7A01 layer, and 7A62 layer. Among them, the 7A52 layer and 7A62 layer are rolled organization, and the 7A01 layer is sandwiched in the middle of the other two layers because the role of rolling is not sufficient, so the organization of coarse grains.
Figure 6b,e,h are the laser-MIG hybrid weld, the MIG weld zone (WZ), and the interior of the laser zone. The grain morphology of hybrid welding and MIG is equiaxed; the inside of the laser zone is cellular dendrites. The temperature gradient in the center of the weld is slight, the heat dissipation is slow, and the heat dissipation of the nucleus in all directions is the same; i.e., the nucleus can grow freely and form isometric crystals of the same size.
Figure 6c,f,i are the FZ of laser-MIG hybrid welding, MIG welding, and laser welding, respectively. Fine equiaxed crystals exist on both sides of the FZ. Due to the numerous plasmas near the FZ, the molten and semi-molten metal adheres to the fusion surface for nonspontaneous nucleation. At the same time, due to the fast cooling rate, the nuclei do not have time to grow up, forming fine equiaxed crystals. Near the base metal side, the temperature gradient is large, so the grain size is larger than the WZ.
Comparison of Figure 6d,g,j can be seen in the laser-MIG hybrid heat-affected zone (HAZ) of the welding arc zone and MIG-welding HAZ grains have different degrees of obvious grain coarsening. The laser zone HAZ grains almost did not encounter coarsening, and its tissue morphology with the BM is still the same as the rolling organization. Because the hybrid welding laser zone is welded only by the laser alone, the laser zone near the BM is relatively small because of the heat input. The hybrid welding arc zone is not welded only by the arc welding, but also by the laser effect welding. The arc zone near the BM by the heat input is more significant, and the HAZ grain coarsens. MIG welding is evident due to the lower welding speed, a considerable single arc heat input, and the HAZ grain coarsening.
Figure 6h,i,j are the laser zone, the laser FZ, and the laser HAZ. The grains in the laser zone are all equiaxed dendrites with obvious dendrite backbones, and secondary dendrite arms can be seen simultaneously. During the molten pool’s solidification process, the laser zone’s temperature gradient near the BM is higher than that near the weld, so the grain size of the FZ near the weld is more significant than that near the BM. Compared with the laser-MIG hybrid welding and MIG welding, the grain coarsening in the HAZ of the laser zone was not obvious, and the OM observed that the grains in this zone were smaller than those in the hybrid and MIG WZ at the same magnification.
Using ImageJ software (version 1.54g), the average grain sizes of laser-MIG hybrid welding, MIG welding, and the laser zone WZ were calculated as 18.38 μm, 24.16 μm, and 15.96 μm, respectively. Compared with MIG welding, the heat input of laser-MIG hybrid welding is lower, so the grain size of the WZ is smaller. The weld is subjected to the action of the laser only in the case of single laser bottoming. The welding speed is faster, up to 10 m/min; at the same time, the aluminum alloy’s thermal conductivity is high, so the grain is subject to low heat input, causing the size to be smaller. The above phenomenon indicates that the overall heat input of laser-MIG hybrid welding is less than that of MIG welding.

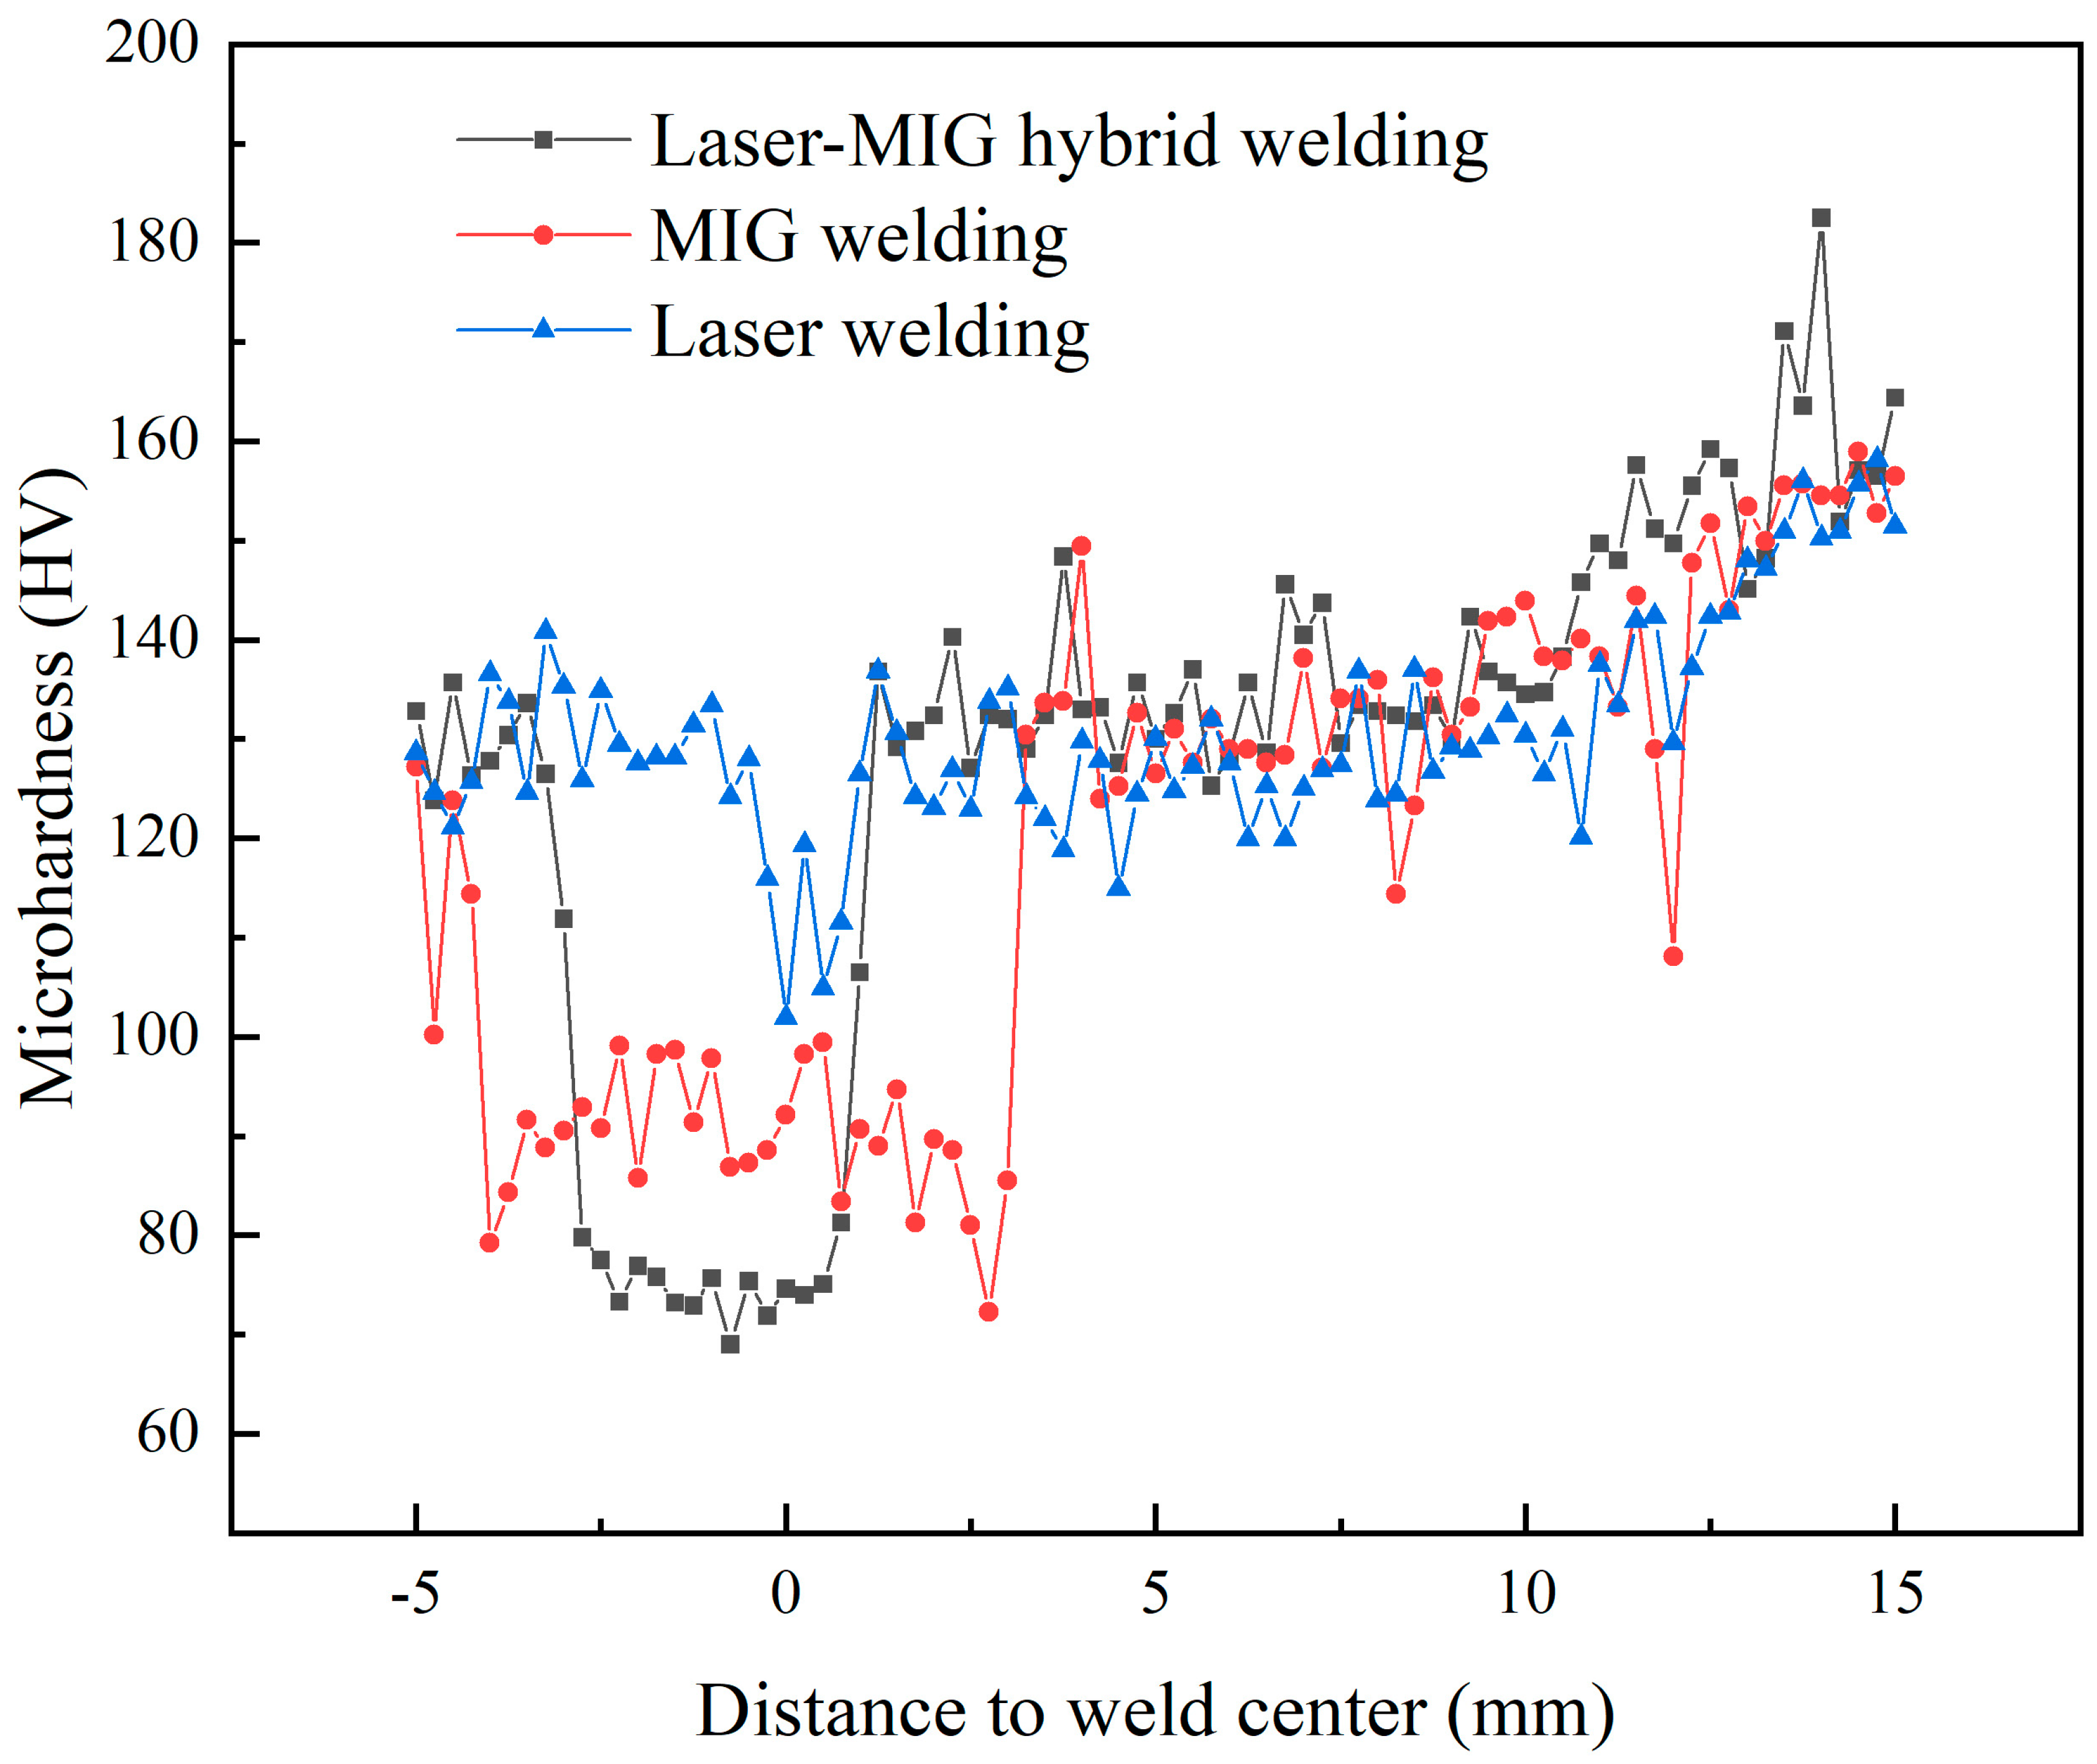
3.2. Microhardness Analysis

Figure 7 show the microhardness of 7B52 aluminum alloy laser-MIG hybrid welding, MIG welding, and the laser zone at different positions from the center of the weld, respectively. The average hardness of the laser-MIG hybrid weld, MIG weld, and laser zone weld is 89.6 HV, 79.2 HV, and 94.7 HV. The heat input in the laser zone is small, and there is no overgrowth of grains; the size of the equiaxial crystal grain is smaller than that in the hybrid WZ, so the hardness is the highest. The average hardness of the HAZ of laser-MIG hybrid welding, MIG welding, and the laser zone is 136.5 HV, 128.7 HV, and 132.7 HV. The average hardness of the BM is about 177.6 HV. The hardness of the three kinds of WZ is significantly lower than that of the BM because most of the WZ are in the casting state of the organization, which is poorer than that of the BM rolled organization. The strength of the alloying elements such as Zn, Mg, and other components is burned during the welding process, reducing the WZ hardness. Aspects of the welding process, such as Zn, Mg, and other strengthening elements, when burned, will also reduce the hardness of the weld. Laser-MIG hybrid welding, MIG welding, and laser zone HAZ widths are 10.2 mm, 10.4 mm, and 9.8 mm. The heat source in the unit length of the weld stays for a shorter time than the hybrid heat source, and the arc heat input is small, so the HAZ is narrow.

3.3. Tensile Properties Analysis

We took 3 samples for each stretching group and calculated the average value. The results of the tensile test are shown in Table 3, and the comparison of the tensile properties of each zone is shown in Figure 8.
The tensile strength of the laser-MIG hybrid welding head laminated zone and homogenized zone is 294.3 MPa and 323.3 MPa, respectively; and the tensile strength of the laser zone is 268 MPa. The tensile strength of the MIG welding head laminated zone and homogenized zone is 278.3 MPa and 288 MPa, respectively. The tensile strengths of the same zone of the laser-MIG hybrid welding head are better than that of the MIG welding head, and the tensile strength of the laser zone is the worst. The stress strain in the tensile process was shown in Figure 9. Although the laser-MIG hybrid welding head did not appear to have a yielding platform, the MIG welding head’s relative yielding stage is prominent, and the laser zone stress strain seems steep; it indicates that the MIG welding head plasticity is better than laser-MIG hybrid welding.
The microscopic morphology of the tensile fracture under SEM is shown in Figure 10. Figure 10a shows the hybrid welded homogenized zone, and Figure 10b–d show the hybrid welded 7A52, 7A01 and 7A62 layers, respectively; Figure 10e shows the MIG-welded homogenized zone, and Figure 10f–h show the MIG-welded 7A52, 7A01 and 7A62 layers, respectively. Figure 10i–l show the fracture microscopic morphology in the laser zone. In hybrid welded fracture zones, there are a large number of equiaxial challenging nests and a small number of pores. In the MIG-welded fracture zones, there are a large number of large size pores, the diameter of some pores is more than 100 μm. Therefore, MIG-welded joints have a lower tensile strength than hybrid welds. As shown in Figure 10i, the fracture in the laser zone is flat, and the river and tongue patterns can be seen in Figure 10i,k, which are typical features of deconvoluted fractures. The cracks extend along the grain boundaries in Figure 10l, which coincides with the previous stress strain curve, and the laser zone has poor plasticity.

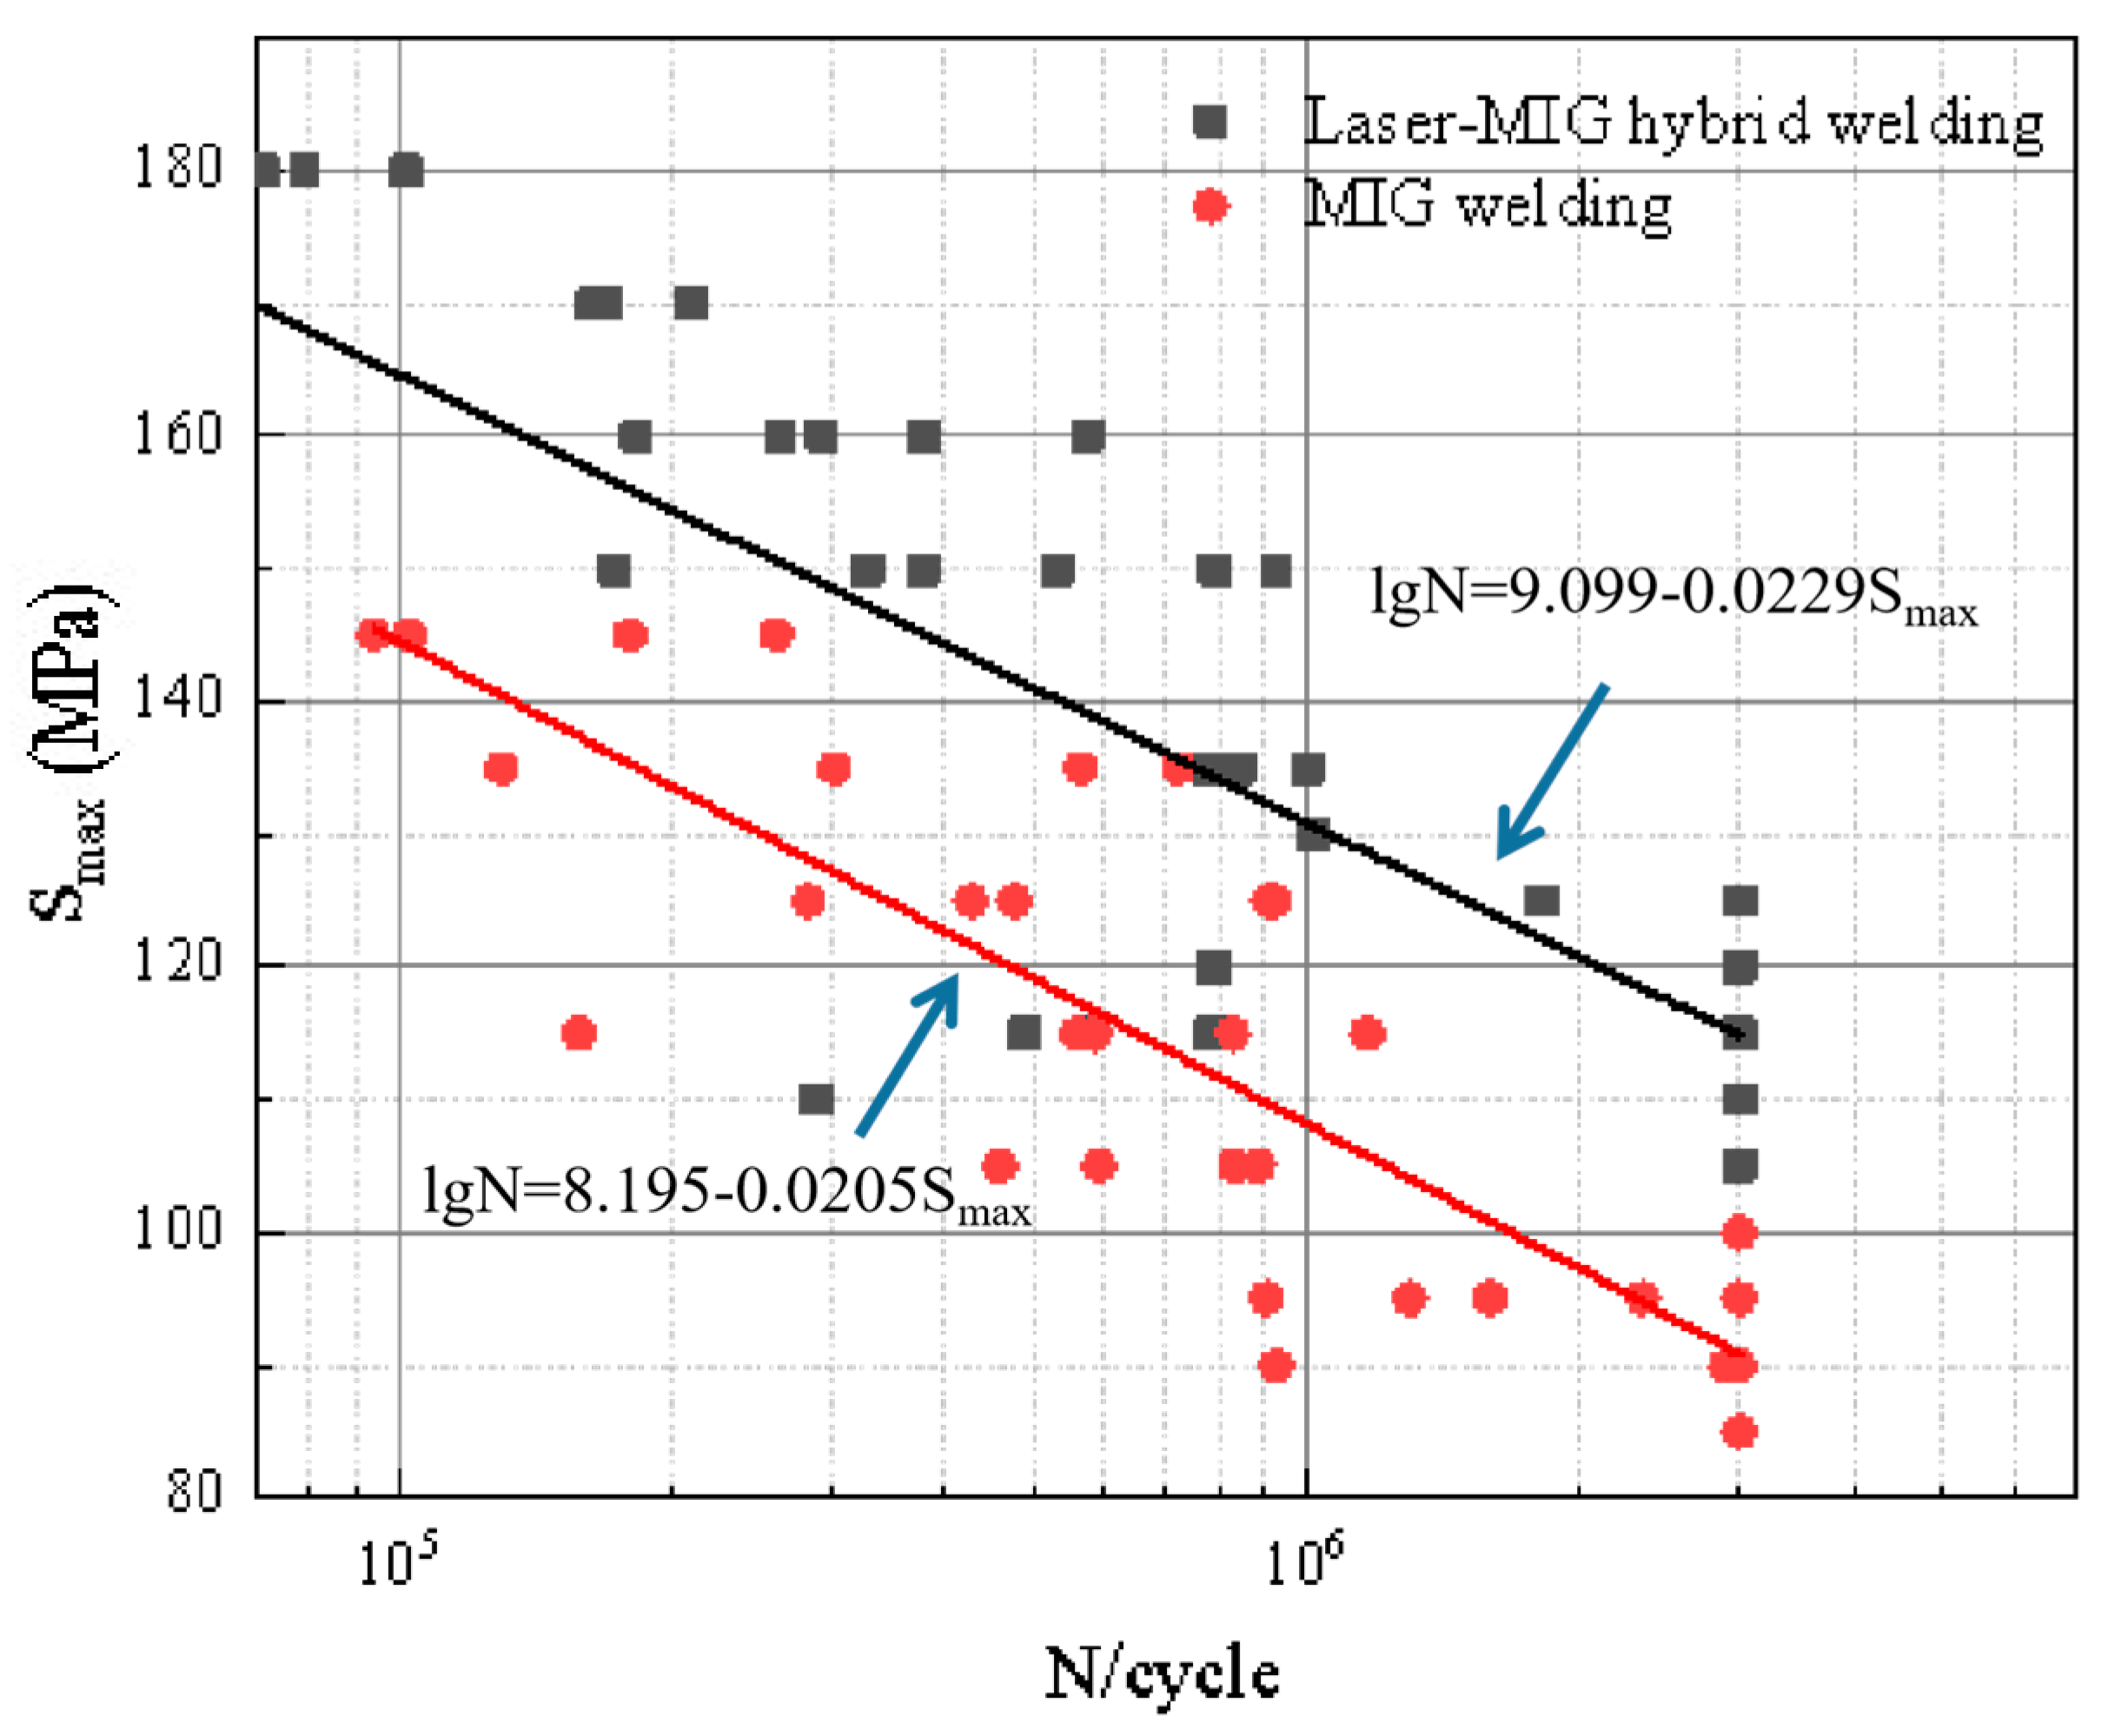
3.4. Fatigue Performance Analysis

When the maximum stress of laser-MIG hybrid welding is more than 170 MPa, the maximum stress of MIG welding is more than 145 MPa, as shown in Figure 11a,d. Cracks first sprout from the FZ in the center of the weld and expand until fracture; when the maximum stress of laser-MIG hybrid welding is 150 MPa, MIG-welding maximum stress is more significant than 125 MPa, as shown in Figure 11b,e. Cracks sprout from the BM and the weld between the FZ near the FZ, by the role of the load gradually transferring from the FZ to the WZ when the maximum stress of laser-MIG hybrid welding reaches 130 MPa; MIG welding maximum stress is greater than 105 MPa, as shown in Figure 11c,f. The crack still sprouts from the vicinity of the FZ, but eventually extends to fracture on the side of the HAZ near the BM. It is because the zones of the weld experienced different degrees of weld thermal cycling, and a large number of unhomogenized slip zones existed within the weld or second phase inclusions were generated, so there were differences in the combined mechanical properties of the weld laminated zones at various locations. At high stress levels, these slip bands will cause stress concentration cracks during the second phase, or cause the grain boundaries and subgrain boundaries to crack so that the fatigue properties of the weld laminated zone are reduced.
Laser-MIG hybrid welding in various zones. Table 4 and Table 5 show the fatigue test results of laser-MIG hybrid welding and MIG welding using the group and lifting methods, respectively, and the overlay zone for both welding methods.
The MIG weld shows more discrete data for the same stress ratio R and worse fatigue performance than the laser-MIG hybrid weld. It is because the heat input of laser-MIG hybrid welding is smaller than that of MIG welding, and the grains undergo welding thermal cycling to a low degree without overgrowth; at the same time, the lower heat input makes the reinforcement elements, such as Zn and Mg, burn less, so the fatigue performance of laser-MIG hybrid welded joints is better than that of MIG-welded joints. After the number of fatigue cycles exceeded 105, the difference between the two S-N curves became larger and larger. According to the Zheng Hirt formula, Equations (1) and (2) [23] fit the high cycle fatigue test data of the joint laminated zone:
logNf = 9.099 − 0.0229Smax
logNf = 8.195 − 0.0205Smax
Nf is the number of fatigue cycles, and Smax is the loading stress. The coefficient of variation in Equation (1) is 0.0563, and the coefficient of variation in Equation (2) is 0.0376, both of which satisfy the confidence level of 95%. According to the test data, the fatigue limits of the laminated zone of the laser-MIG hybrid weld and MIG weld head are 115.6 MPa and 91.8 MPa, respectively. The fatigue test S-N curve is shown in Figure 12.

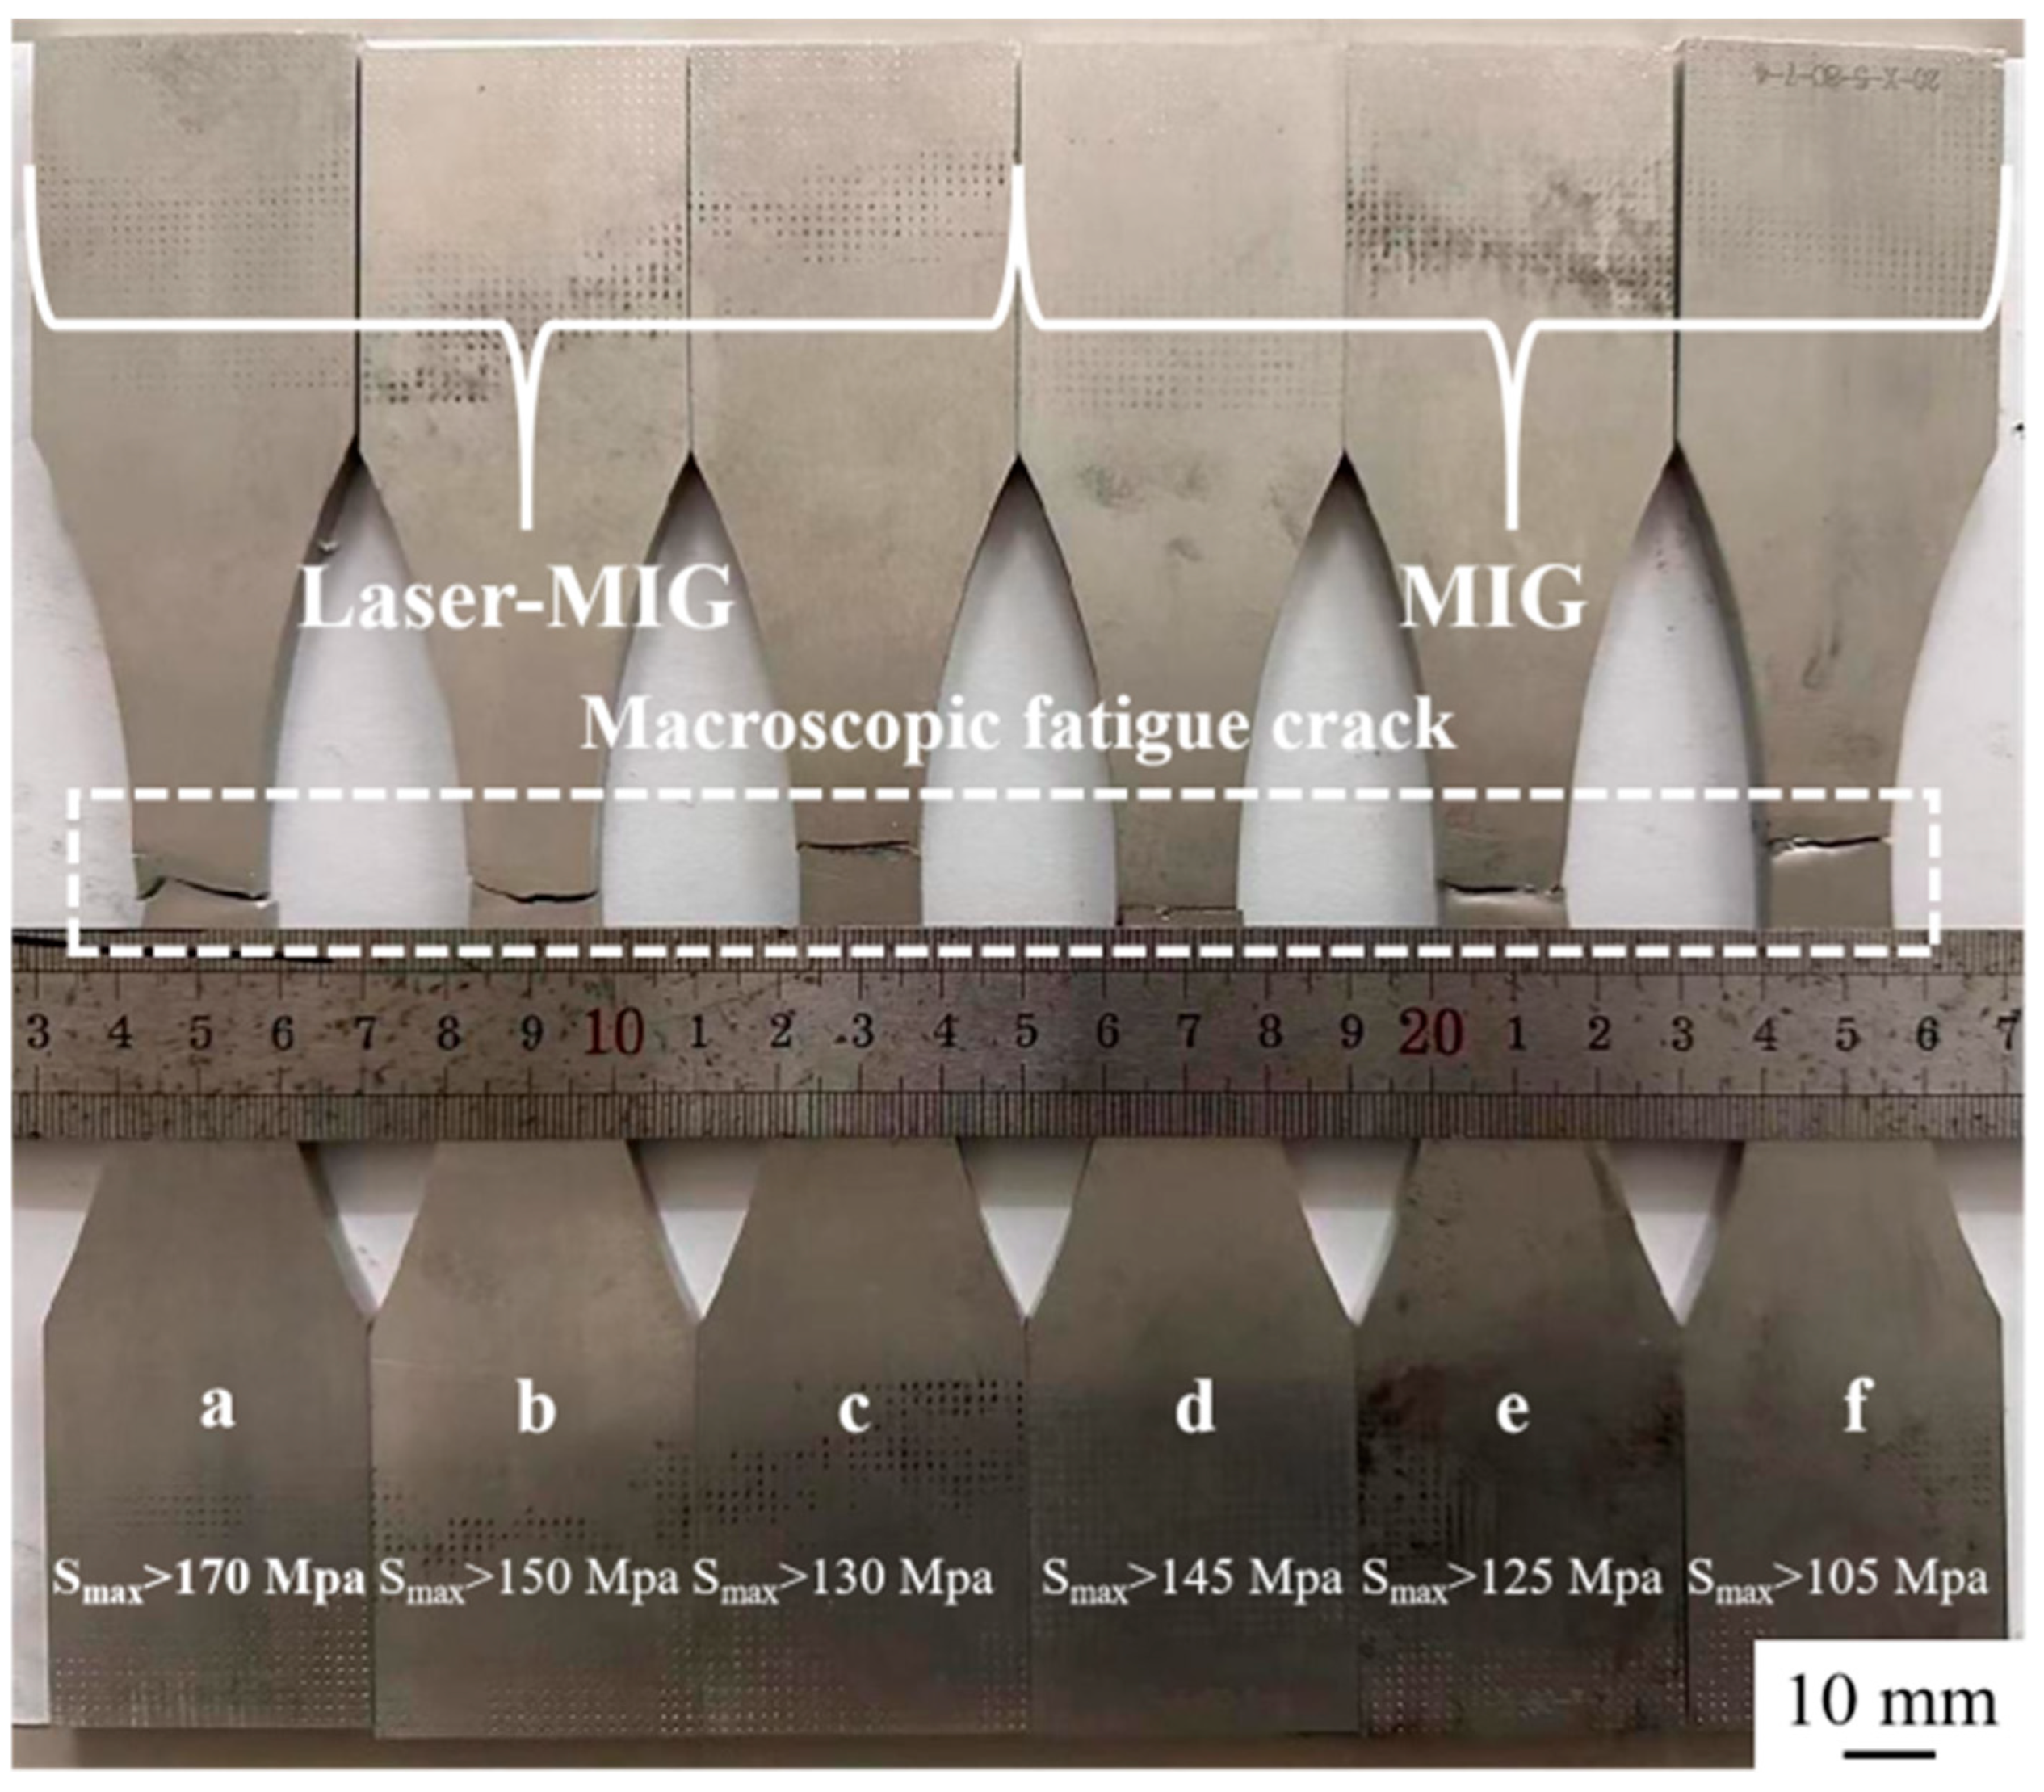
3.5. Fatigue Fracture Analysis

Fatigue cracks are continuously formed on the highest stress and weakest part. Figure 13a–d, Figure 13e–h, and Figure 13i–l show the fatigue fracture morphology of laser-MIG hybrid welded laminations at Nf = 1,820,000, Nf = 1,020,000, and Nf = 380,000, respectively. The fatigue source is elliptical slag entrapment at Nf = 1,820,000; the fatigue source is intra-weld porosity at Nf = 1,020,000; and the fatigue source is multiple source fatigue fracture at Nf = 380,000, which is a specimen surface defect, as shown in Figure 13a, Figure 13e, Figure 13f, Figure 13g, Figure 13h and Figure 13i–l, respectively. Nf = 1,020,000 when the fatigue source is porosity in the weld; and Nf = 380,000 when it is multi source fatigue fracture, and the fatigue source is defects on the surface of the specimen, as shown in Figure 13a,e,i. After the fatigue source is formed, the crack will expand near the source, and the crack passivates to create a fatigue striation after the loading cycle, as shown in Figure 13b,f,j. The measured striation width of the initial zone of the crack is 21.69 μm, the width of a single fatigue striation is 0.22 μm at Nf = 1,820,000, and that of the initial zone of the crack is 26.65 μm. The width of a single fatigue striation is 0.22 μm at Nf = 1,020,000. The width of the single fatigue striation is 0.24 μm at Nf = 380,000, the width of the initial crack zone is 4.38 μm, and the width of a single fatigue striation is 0.53 μm. With fatigue load cycling, the fatigue striation starts to advance in all directions, and the striation expansion zone is formed, as shown in Figure 13c,g,k. The width of the crack expansion zone is 46.69 μm at Nf = 180,000, the width of the single fatigue striation is 0.22 μm, and the width of the single fatigue striation is 0.22 μm. The width of the crack extension zone is 29.94 μm, and the width of the single fatigue striation is 0.71 μm at Nf = 1,020,000. A typical fatigue step can be observed at Nf = 380,000, with the width of the crack extension zone being 61.11 μm and the width of the single fatigue striation being 2.91 μm. The crack extension zone is relatively flat, and small flat surfaces can be observed. The specimens were formed by mutual contact and extrusion at the interface during the loading and unloading process. The higher the number of fatigue cycles, the denser the overall fatigue expansion zone and the finer the single fatigue grain. Figure 13d,h,l show the morphology of the transient fracture zone, which mainly consists of equiaxed and elongated fossa with no prominent radial zone.
Figure 14a–d, Figure 14e–h, and Figure 14i–l show the fatigue fracture morphology of the MIG welding overlay zone at Nf = 1,299,100, Nf = 1,169,000, and Nf = 560,000, respectively. As shown in Figure 14a,e,i, the fatigue source at Nf = 1,299,100 is the subcutaneous porosity of the WZ. When Nf = 1,169,000, the fatigue source is slag inclusion; When Nf = 560,000, it is a multi-source fatigue fracture, and the fatigue sources are surface defects and slag inclusions in the specimen. As shown in Figure 14b,f,j, the measured width of the initial crack zone at Nf = 1,299,100 is 14.84 μm. The width of a single fatigue striation pattern is 0.24 μm. When Nf = 1,169,000, the measured width of the initial crack zone is 2.62 μm. When the width of a single striation is 0.49 μm and Nf = 560,000, the measured striation width in the initial crack zone is 29.23 μm. The width of a single fatigue striation pattern is 0.61 μm as shown in Figure 14c,g,k, and the width of the crack propagation zone is 7.62 μm when Nf = 1,291,000. The width of the crack propagation zone is 2.86 μm when the width of a single striation is 0.89 μm and Nf = 1,169,000. The width of the crack propagation zone is 29.23 μm when the width of a single striation is 0.36 μm and Nf = 560,000. The width of a single fatigue striation pattern is 0.61 μm. The morphology of the m instantaneous fracture zone is shown in Figure 14d,h,l, mainly consisting of smooth cross sections and ductile dimples.
According to Forman crack extension rate, the following Equation is obtained (3) [24,25]:
da/dn = CK)m/(1 − R)KIC − ΔK
where ΔK is the stress intensity factor range, KIC is the stress intensity factor critical value, a is the crack half length, C are the material-related coefficients, n is the number of specimens, and R is the stress ratio.
For the same welding method, R and KIC values are specific. ΔK mainly determines the crack extension rate. The higher the applied average stress, the faster the crack extension rate. It can also be reflected from the single fatigue striation width: the fatigue striation spacing becomes more comprehensive with an accelerated crack extension rate.
Under the same test conditions, laser-MIG hybrid welding has better fatigue performance in the same region of the welded joints than MIG welding, with more cycles experienced, denser fatigue striation in the extended zone, and finer single fatigue striations. Moreover, the fatigue transient fracture zone of MIG welding is flatter, the crack mainly extends along the grain boundary, and the number of challenging nests is fewer. The laser-MIG hybrid welding transient fracture zone occurs along the grain fracture and through the grain fracture. It indicates that the MIG-welded joints are weaker under high circumferential fatigue.
Due to the low heat input of laser-MIG hybrid welding, the grain size is finer, and the weld has more reinforcing phases. Grain boundaries, sub granular boundaries, and second relative dislocation slip motion act as pinning [26,27], so the laser-MIG hybrid weld has more robust fatigue properties than MIG-welded joints. Welding defects are the source of stress concentrations in welded joints. The single fatigue source of both joints is slag or porosity, and the multi-fatigue source is specimen surface defects. Comparing the above test data, it is evident that specimen surface defects are more unfavorable for the fatigue performance of the joints.
The fatigue strength of the material is mainly affected by the notch effect, the size effect, and the processing method of the material surface. Specimens are in the process of using the same processing method, so we ignored the size effect and processing method on fatigue performance. However, the surface of the specimen, after processing, inevitably has scratches, microscopic notches, and other defects; in these defects, there is bound to be a concentration of stress, which reduces the fatigue properties of the material. The effect of notch effects on the fatigue performance of the material can be expressed by Equations (4)–(6) [28,29,30]:
Kf = σ−1/σ−1K
Kf = 1 + q(Kt − 1)
q = Kf − 1/Kt − 1
where σ−1 is the fatigue limit of the smooth specimen, σ−1K is the net section size and processing method of the same notched specimen fatigue limit, Kf is the influential stress concentration factor, Kt is the theoretical stress concentration factor, and q is the fatigue notch sensitivity.
As the defect triggered stress concentration, raising the local stress at the same time also makes the maximum stress at the stress gradient increase. The crack sprouting location is limited to a smaller range near the maximum stress point, so the general influential stress concentration factor is less than the theoretical stress concentration factor. The fatigue notch sensitivity q is a measure of the material’s sensitivity to stress concentrations under cyclic loading, which is mainly affected by the nature of the material; the more significant the material’s tensile strength, the higher the sensitivity to fatigue notching [31,32,33]. Combined with the 3.3 tensile test results, the tensile strength of the laminated zone of laser-MIG hybrid welding is higher than that of MIG welding, so the fatigue notch sensitivity of the laminated zone of hybrid welding is higher than that of MIG welding. Thus, the fatigue performance is also better than that of MIG welding.

4. Conclusions

(1)
The average grain sizes of laser-MIG hybrid welding, MIG welding, and laser zone WZ were 18.38 μm, 24.16 μm, and 15.96 μm, respectively. MIG welding had the highest heat input and the largest grain size. The hardness of the laser zone is better than that of the laser-MIG hybrid WZ and that of the MIG WZ.
(2)
The heat input of a single laser is lower than that of the arc and laser-arc, and the width of the HAZ of the laser zone is smaller than that of the laser-MIG hybrid welding zone and MIG welding zone. The microhardness of the laser weld zone is higher than that of the laser-MIG hybrid welding zone and MIG welding zone.
(3)
Compared with laser-MIG hybrid welding, MIG welding produces more pores, which affects its tensile strength. Therefore, the tensile strength of each laser-MIG hybrid welding joint zone is higher than that of MIG welding. The cracks in the laser zone propagate along the grain boundary, so the tensile strength of the laser zone is the lowest.
(4)
The fatigue performance of the laser-MIG hybrid welded head laminated zone is better than MIG welding under the same conditions, and the defects in the welded joint are the leading cause of fatigue fracture.

Author Contributions

Conceptualization, Y.L. and H.Z.; Methodology, Y.L. and H.Z.; Validation, D.W.; Formal analysis, L.C. and L.M.; Investigation, L.C. and L.M.; Resources, Y.L. and D.W.; Data curation, H.Z.; Writing—original draft, Y.L. and H.Z.; Writing—review and editing, Y.L. and H.Z. All authors have read and agreed to the published version of the manuscript.

Funding

This work was supported by the Ningbo Natural Science Foundation (2023J313), Natural Science Foundation of Inner Mongolia (2023MS05040).

Data Availability Statement

The raw/processed data required to reproduce these findings cannot be shared at this time due to technical or time limitations, and data will be available on request.

Conflicts of Interest

There are no conflicts to declare.

Abbreviations

Parameter Summary
ParameterPhysical meaning
Rstress ratio
Nfcycle
Smaxloading stress
ΔKstress intensity factor range
KICstress intensity factor critical value
acrack half length
Cmaterial-related coefficients
nthe number of specimens
σ−1fatigue limit of the smooth specimen
σ−1Knet section size and processing method of the same notched specimen fatigue limit
Kfinfluential stress concentration factor
Kttheoretical stress concentration factor
qfatigue notch sensitivity
AbbreviationFull Name
BMbase mental
WZweld zone
HAZheat-affected zone
FZfusion zone
MIGmelt inert gas

References

  1. Zhou, G.X.; Lang, Y.J.; Hao, J.; Liu, W.; Wang, S.; Qiao, L.; Chen, M. Interface analysis of 7B52 Al alloy laminated hybrid fabricated by hot roll bonding. Trans. Nonferrous Met. Soc. China 2016, 26, 1269–1275. [Google Scholar] [CrossRef]
  2. Chao, C.; Chen, F.; Zhang, H. Surface Nanocrystallization of 7A52 Aluminum Alloy Welded Joint by Aging and Ultrasonic Impact Compound Treatment. Rare Met. Mater. Eng. 2018, 47, 2637–2641. [Google Scholar] [CrossRef]
  3. Zeng, H.; Wang, Z.; Chen, D.; Ding, H.; Yang, W.; Ma, L.; Lu, Y. Effect of Sc on the Wettability of ER5356 Welding Wires and the Porosity of Deposited Metal. ACS Omega 2024, 9, 14255–14261. [Google Scholar] [CrossRef]
  4. Zhu, G.C.; Huang, S.H.; Li, X.W.; Li, Z.H.; Tong, Y.Z.; Zhang, Y.G.; Xiong, B.Q. Macro-micro dynamic behaviors and fracture modes of roll bonded 7A52/7A01/7B52 aluminum laminates in high velocity deformation. Prog. Nat. Sci. Mater. Int. 2018, 4, 510–519. [Google Scholar] [CrossRef]
  5. Liu, X.; Jia, R.; Cheng, W.; Zhang, H.; Tian, J.; Zhai, X. Influence of the second phase on relative fracture behavior of friction stir welded 7A52 aluminum alloy. Mater. Today Commun. 2022, 33, 104215. [Google Scholar] [CrossRef]
  6. Hu, Y.; Wu, S.; Shen, Z.; Cao, H.; Zhong, X.; Withers, P.J. Fine equiaxed zone induced softening and failure behavior of 7050 aluminum alloy hybrid laser welds. Mater. Sci. Eng. A 2021, 821, 141597. [Google Scholar] [CrossRef]
  7. Li, X.C.; Fu, Z.Q.; Ji, B.H.; Sun, G.Y. Fatigue performance of deck-rib double-side welded joints considering asymmetric stress cycling. J. Constr. Steel Res. 2024, 221, 108913. [Google Scholar] [CrossRef]
  8. Madavi, K.; Jogi, B.; Lohar, G. Investigational study and microstructural comparison of MIG welding process for with and without activated flux. Mater. Today Proc. 2022, 51, 212–216. [Google Scholar] [CrossRef]
  9. Cai, C.; He, S.; Chen, H.; Zhang, W. The influences of Ar-He shielding gas mixture on welding characteristics of fiber laser-MIG hybrid welding of aluminum alloy. Opt. Laser Technol. 2019, 113, 37–45. [Google Scholar] [CrossRef]
  10. Ghosal, S.; Chaki, S. Estimation and optimization of depth of penetration in hybrid CO2 LASER-MIG welding using ANN-optimization hybrid model. Int. J. Adv. Manuf. Technol. 2010, 47, 1149–1157. [Google Scholar] [CrossRef]
  11. Jia, Y.; Wen, T.; Huang, N.; Zhang, J.; Xiao, J.; Chen, S.; Huang, W. Research on aluminum alloy welding process based on high frequency and low power pulsed Laser-MIG hybrid welding. Opt. Laser Technol. 2022, 150, 107899. [Google Scholar] [CrossRef]
  12. Aqeel, M.; Gautam, J.P.; Shariff, S.M. Influence of heat input on bead profile and microstructure characteristics in laser and laser-hybrid welding of Inconel 617 alloy. Weld. Int. 2022, 36, 256–270. [Google Scholar] [CrossRef]
  13. Wang, L.; Liu, Y.; Yang, C.; Gao, M. Study of porosity suppression in oscillating laser-MIG hybrid welding of AA6082 aluminum alloy. J. Mech. Work. Technol. 2021, 292, 117053. [Google Scholar] [CrossRef]
  14. Yang, X.; Chen, H.; Li, M.V.; Bu, H.; Zhu, Z.; Cai, C. Porosity suppressing and grain refining of narrow-gap rotating laser-MIG hybrid welding of 5A06 aluminum alloy. J. Manuf. Process 2021, 68, 1100–1113. [Google Scholar] [CrossRef]
  15. Chen, X.; Yu, G.; He, X.; Li, S.; Miao, H. Effect of droplet impact on molten pool dynamics in hybrid laser-MIG welding of aluminum alloy. Int. J. Adv. Manuf. Technol. 2018, 96, 209–222. [Google Scholar] [CrossRef]
  16. Zhang, Y.; Song, X.P.; Chang, L.Y.; Wu, S.C. Fatigue Lifetime of Laser-MIG Hybrid Welded Joint of 7075-T6 Aluminum Alloy by in-situ Observation. Rare Met. Mater. Eng. 2017, 46, 2411–2416. [Google Scholar]
  17. Duan, C.; Yang, S.; Liu, H.; Gu, J.; Xiong, Q.; Wang, Y. Formation and fatigue property of MIG welded high-speed train 6005A-T6 aluminum alloy. Mater. Res. Express 2019, 6, 056532. [Google Scholar] [CrossRef]
  18. Hao, H.; Ye, D.; Chen, C. Strain ratio effects on low-cycle fatigue behavior and deformation microstructure of 2124-T851 aluminum alloy. Mater. Sci. Eng. A 2014, 605, 151–159. [Google Scholar] [CrossRef]
  19. Cisko, A.; Jordon, J.; Avery, D.; McClelland, Z.; Liu, T.; Rushing, T.; Brewer, L.; Allison, P.; Garcia, L. Characterization of fatigue behavior of Al-Li alloy 2099. Mater. Charact. 2019, 151, 496–505. [Google Scholar] [CrossRef]
  20. Ma, Y.L.; Huang, Y.C.; Zhang, X.Y. Precipitation thermodynamics and kinetics of the second phase of Al–Zn–Mg–Cu–Sc–Zr–Ti aluminum alloy. J. Mater. Res. Technol. 2021, 10, 445–452. [Google Scholar] [CrossRef]
  21. Lin, Y.; Zheng, Z.Q. Microstructural evolution of 2099 AlLi alloy during friction stir welding process. Mater. Charact. 2017, 123, 307–314. [Google Scholar] [CrossRef]
  22. Odeshi, A.; Adesola, A.; Badmos, A. Failure of AA 6061 and 2099 aluminum alloys under dynamic shock loading. Eng. Fail. Anal. 2013, 35, 302–314. [Google Scholar] [CrossRef]
  23. Yuen, B.K.C.; Taheri, F. Proposed Modification to the Zheng and Hirt Fatigue Model. J. Mater. Eng. Perform. 2004, 13, 226–231. [Google Scholar] [CrossRef]
  24. Zheng, X.L.; Manfred, A.H. Fatigue crack propagation in steels. Eng. Fract. Mech. 1983, 18, 965–973. [Google Scholar]
  25. Liu, Y.; Pan, Q.; Liu, B.; Yu, Q.; Li, G.; Pan, D. Effect of aging treatments on fatigue properties of 6005A aluminum alloy containing Sc. Int. J. Fatigue 2022, 163, 107103. [Google Scholar] [CrossRef]
  26. Najafi, S.; Eivani, A.; Samaee, M.; Jafarian, H.; Zhou, J. A comprehensive investigation of the strengthening effects of dislocations, texture and low and high angle grain boundaries in ultrafine grained AA6063 aluminum alloy. Mater. Charact. 2018, 136, 60–68. [Google Scholar] [CrossRef]
  27. Ding, X.; Liu, W.; Jiang, B.; Qiang, H.; Huang, H.; Xiao, M.; Chen, Y.; Song, Y. Effect of large pre-deformation on microstructure and mechanical properties of 7B52 laminated aluminum alloy. J. Alloys Compd. 2023, 967, 171749. [Google Scholar] [CrossRef]
  28. Nakrani, J.; Yan, W.; Shrivastava, A. Effect of notch location on fatigue crack growth behavior for inhomogeneous material domains in friction stir welded magnesium alloy. Int. J. Fatigue 2023, 177, 107956. [Google Scholar] [CrossRef]
  29. Li, X.-K.; Zhu, S.-P.; Liao, D.; Correia, J.A.; Berto, F.; Wang, Q. Probabilistic fatigue modelling of metallic materials under notch and size effect using the weakest link theory. Int. J. Fatigue 2022, 159, 106788. [Google Scholar] [CrossRef]
  30. Wang, Z.; Kong, X.; Xie, L.; Wu, N.; Zhen, C.; Gu, J. An enhanced stress field intensity approach for fatigue life assessment combining notch and size effect. Int. J. Fatigue 2024, 183, 108239. [Google Scholar] [CrossRef]
  31. Wang, C.; Zhu, T.; Yang, B.; Xiao, S.; Yang, G. Fatigue crack evaluation of butt weld joints in full-scale aluminum alloy joints: Experimental and numerical study of traction structural stress. Int. J. Fatigue 2024, 187, 108478. [Google Scholar] [CrossRef]
  32. Jin, J.; Lu, W.; Fu, Z.; Zhu, Z.; Chen, W.; Gou, G. Corrosion fatigue crack growth in A7N01S−T5 aluminum alloy MIG welded joints. J. Mater. Res. Technol. 2023, 23, 2202–2218. [Google Scholar] [CrossRef]
  33. Pan, D.; Pan, Q.; Yu, Q.; Li, G.; Liu, B.; Deng, Y.; Liu, H. Microstructure and fatigue behavior of MIG-welded joints of 6005A aluminum alloy with trace amounts of scandium. Mater. Charact. 2022, 194, 112482. [Google Scholar] [CrossRef]
Figure 1. Welding equipment: (a) KUKA welding robot; (b) YW SCAN52 laser head; (c) YLS-20000 laser; (d) TPS5000 MIG welding machine.
Metals 14 01110 g001
Figure 2. Characterization and test equipment: (a) ZEISS Axio observer optical microscope; (b) 402MVASD Vickers microhardness tester(Jinan Hensgrand Instrument Co. Ltd., Jinan, China); (c) E45.105 Microcomputer control electronic universal material testing machine (Instron company, Norwood, MA, USA); (d) 8802 electro-hydraulic servo fatigue testing machine (Instron company, Norwood, MA, USA); (e) FEI QUANTA 250 scanning electron microscope (Thermo Fisher Scientific, Hillsboro, MA, USA).
Metals 14 01110 g002
Figure 3. Schematic drawing of tensile specimen.
Metals 14 01110 g003
Figure 4. Fatigue sample processing schematic diagram.
Metals 14 01110 g004
Figure 5. Macromorphology of the welded joint: (a) Laser-MIG hybrid welding; (b) MIG welding.
Metals 14 01110 g005
Figure 6. Microstructure of the BM and WZ in each zone: (a) BM; (bd) Various zones of laser-MIG hybrid welding joints; (eg) Various zones of MIG welding joints; (hj) Various zones of laser welding joints.
Metals 14 01110 g006
Figure 7. Microhardness of welded joints.
Metals 14 01110 g007
Figure 8. Comparison of average tensile strength in different zones of welded joints.
Metals 14 01110 g008
Figure 9. Tensile strength of each zone of welded joint.
Metals 14 01110 g009
Figure 10. Microscopic morphology of the tensile fracture surface of welded joints. (ad) Laser-MIG hybrid welding joints; (eh) MIG welding joints; (il) laser welding joints.
Metals 14 01110 g010
Figure 11. Macro fatigue specimens under different loads: (ac) laser-MIG hybrid welding specimen; (df): MIG welding specimen.
Metals 14 01110 g011
Figure 12. The curves of the relationship between strain amplitude and the number of cycles (hereinafter referred to as S-N curves) of the welding joints.
Metals 14 01110 g012
Figure 13. Fatigue fracture morphology of laser-MIG hybrid welding joints under different cycle times: (ad) Cycle times Nf = 1,822,000; (eh) Cycle times Nf = 1,020,000; (il) Cycle times Nf = 380,000.
Metals 14 01110 g013
Figure 14. Fatigue fracture morphology of MIG welding joints under different cycle times: (ad) Cycle times Nf = 1,299,100; (eh) Cycle times Nf = 1,169,000; (il) Cycle times Nf = 564,000.
Metals 14 01110 g014
Table 1. Processing parameters.
Laser-MIG HybridMIGRemark
Welding current/A270~280250~270
Welding speed m/min13 (single laser)0.6~0.7Bottoming welding
0.80.5~0.7Filling welding
Laser power/kW10-Bottoming welding
1.5-Filling welding
Laser-arc distance/mm3-
Defocus amount/mm0-
Shielding gas flow rate L/min10~1510~15
Heat input kJ/m310~510330~550
Table 2. Chemical composition of each layer of welding wire and plate (%).
ElementsMgZnMnTiCrAl
Materials
ER53564.50~5.50<0.100.100.180.15Bal.
7A522.00~2.804.00~4.800.250.070.17Bal.
7A622.80~3.207.00~7.400.350.060.12Bal.
7A01-0.90~1.30-0.050.25Bal.
Table 3. Tensile test results of samples in each district.
Specimen AreaTensile Strength
MPa
Yield Strength
MPa
Elongation
%
Intercepted Area at Distance
mm2
Laser-MIG hybrid welding
laminated zone
289
298
296
131
142
149
9.5
7.5
8.0
4.99 × 19.78
4.7 × 19.86
4.98 × 19.88
Laser-MIG hybrid welding
homogenized zone
315
320
332
186
142
120
7.5
5.5
8.0
4.98 × 19.78
5 × 19.86
4.99 × 19.89
Laser zone263
270
271
-
-
-
1.5
1.5
1.0
5.44 × 19.82
4.95 × 19.82
5 × 19.86
MIG welding
laminated zone
275
280
280
124
118
115
6.5
6.5
6.0
4.84 × 19.8
4.87 × 19.71
4.7 × 19.75
MIG welding
homogenized zone
288
287
289
143
153
159
4.0
4.0
4.0
5.11 × 19.8
4.99 × 19.72
5.08 × 19.76
Table 4. Fatigue test results of laser-MIG hybrid welding joints.
High-Cycle FatigueSerial NumberMaximum StressNumber of Fatigue LifeLogarithmic LifeThe Median Value of Logarithmic LifeMedian Fatigue Life
Group methodLevel 18-318079,0004.89764.919283,016
8-9180102,0005.0086
8-618071,0004.8513
Level 27-1170169,0005.22795.2550179,880
7-217016,4005.2148
3-7170210,0005.3222
Level 33-4160263,0005.42005.4976314,481
8-4160183,0005.2625
3-2160380,0005.5798
9-5160574,0005.7589
9-2160293,0005.4669
Level 42-10150379,0005.57865.6540450,804
8-8150173,0005.2380
8-7150531,0005.7251
7-4150328,0005.5159
7-7150928,0005.9675
2-2150792,0005.8987
Level 56-31351,004,0006.00175.9397870,361
7-6135779,0005.8915
2-3135843,0005.9258
Lifting and lowering method2-9110289,000Coefficient of variation: 0.0563
2-51053,000,000
2-41103,000,000
2-611563,000
2-81103,000,000
6-81153,000,000
6-61203,000,000
6-51253,000,000
6-71301,020,000
6-11251,822,000
8-2120790,000
8-1115578,000
2-11103,000,000
7-5115785,000
3-11103,000,000
8-5115490,000
Table 5. Fatigue test results of MIG welding joints.
High-Cycle FatigueSerial NumberMaximum StressNumber of Fatigue LifeLogarithmic LifeThe Median Value of Logarithmic LifeMedian Fatigue Life
Group methodLeve 17-414594,0004.97315.1645146,039
6-4145180,0005.2553
5-6145103,0005.0128
5-4145261,0005.4166
Level 27-5135302,0005.48005.5510355,633
7-6135130,0005.1139
1-1135564,0005.7513
2-1135722,4005.8588
Level 35-3125283,0005.45185.7370545,731
4-6125427,9005.6313
5-5125922,0005.9647
6-2125477,0005.6785
2-2125908,9005.9585
Level 41-3115558,2005.74685.7399549,393
6-1115158,0005.1987
6-5115829,0005.9186
7-31151,169,0006.0678
2-3115585,6005.7676
Level 51-6105884,7005.94685.8253668,862
6-3105833,0005.9206
4-2105591,3005.7718
4-5105459,3005.6621
Lifting and lowering method3-4903,000,000Coefficient of variation: 0.0376
2-5952,344,000
3-6903,000,000
2-495903,000
2-6902,889,400
3-2853,000,000
4-190927,200
3-3853,000,000
5-1903,000,000
3-5951,299,100
7-1903,000,000
7-2953,000,000
1-41003,000,000
1-5951,592,400
Disclaimer/Publisher’s Note: The statements, opinions and data contained in all publications are solely those of the individual author(s) and contributor(s) and not of MDPI and/or the editor(s). MDPI and/or the editor(s) disclaim responsibility for any injury to people or property resulting from any ideas, methods, instructions or products referred to in the content.

