
Effects of Solidification Thermal Variables on the Microstructure and Hardness of the Silicon Aluminum Bronze Alloy CuAl6Si2

 ,
,  , , , ,
  , and
, and
Abstract
:1. Introduction
- (i)
- (ii)
- (iii)
- (iv)
- Mold type and design: The type and design of the mold used for casting can also impact the microstructure and properties of Cu-Al-Si alloys. Factors such as mold temperature, mold material, and mold design can all influence the cooling rate and resulting microstructure [15].
2. Materials and Methods
Samples Preparation
3. Results
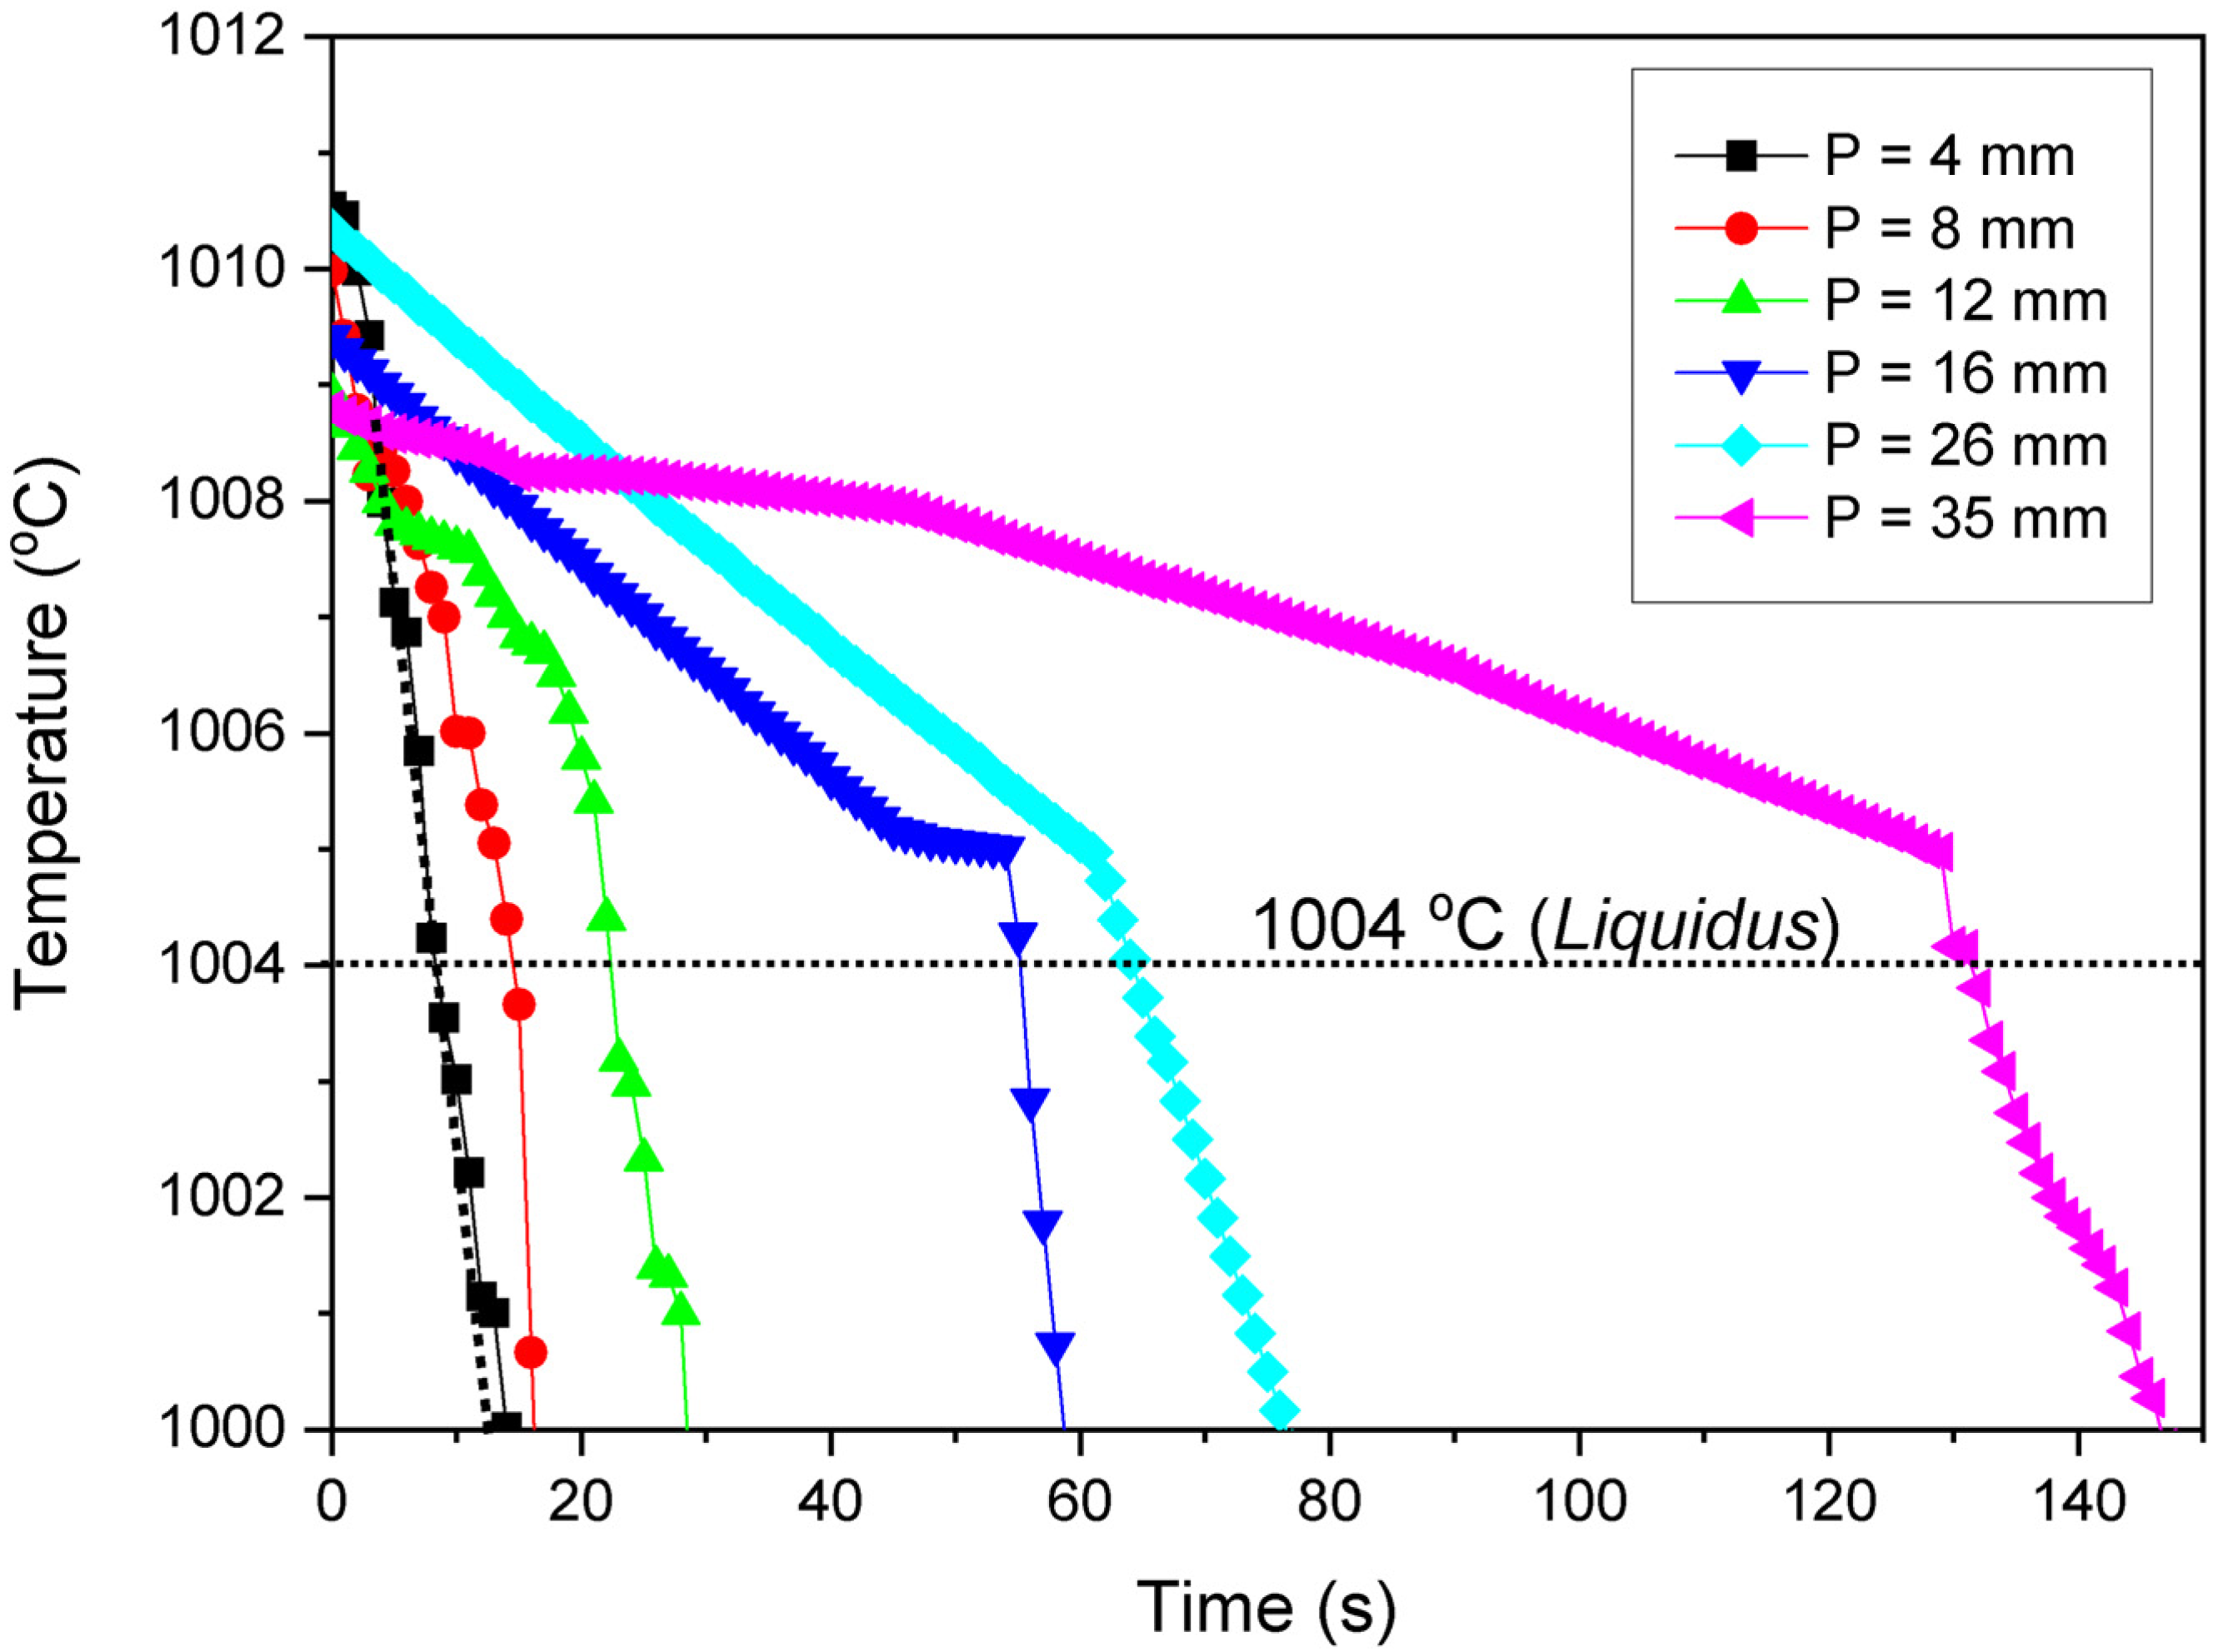
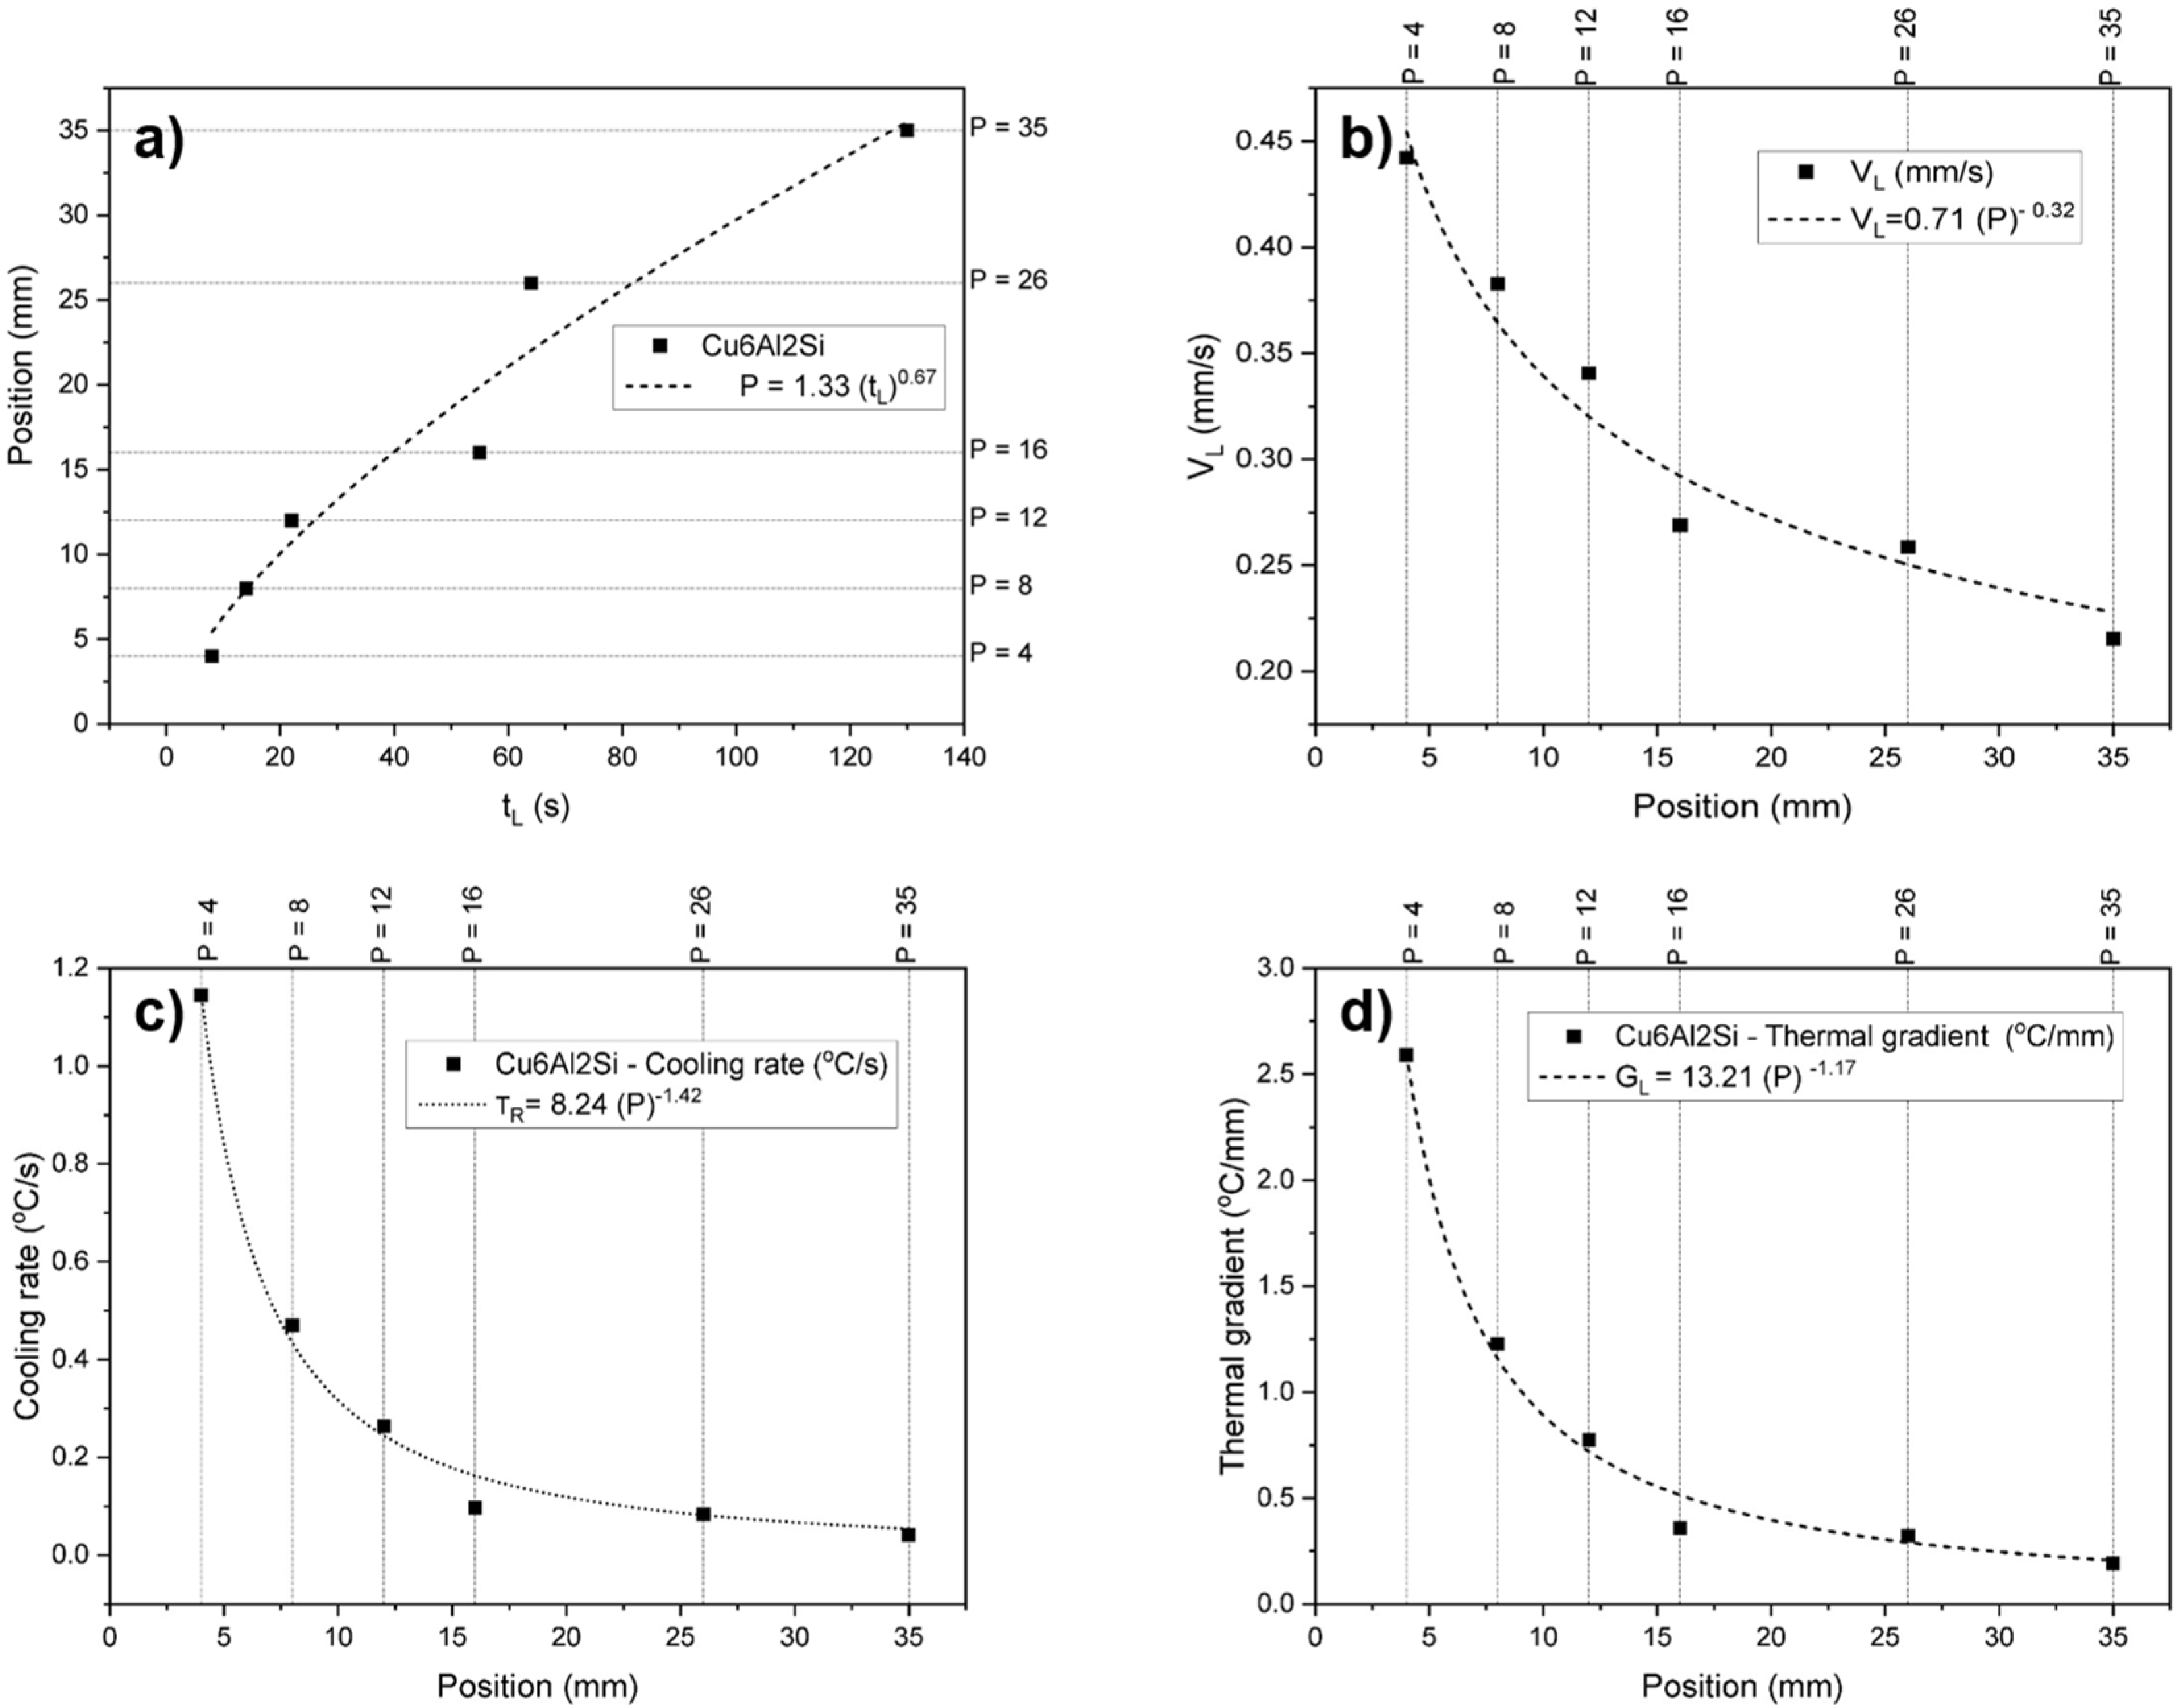
Solidification Thermal Variables
4. Conclusions
Author Contributions
Funding
Data Availability Statement
Acknowledgments
Conflicts of Interest
References
- Nascimento, M.S.; Franco, A.T.R.; Frajuca, C.; Nakamoto, F.Y.; Santos, G.A.; Couto, A.A. An Experimental Study of the Solidification Thermal Parameters Influence upon Microstructure and Mechanical Properties of Al-Si-Cu Alloys. Mater. Res. 2018, 21, e20170864. [Google Scholar] [CrossRef]
- DEF STAN 02-834; Defence Standard 02-834 (NES 834). Ministry of Defence: Glasgow, UK, 2000.
- Harab, M.A.; Kareem, A.H. Investigation Ni and Si Nano-addition effect on the microstructure and hardness of aluminum bronze. Mater. Today Proc. 2021, 45, 5005–5009. [Google Scholar] [CrossRef]
- Nascimento, M.S.; Santos, G.A.; Teram, R.; Santos, V.T.; Silva, M.R.; Couto, A.A. Effects of Thermal Variables of Solidification on the Microstructure, Hardness, and Microhardness of Cu-Al-Ni-Fe Alloys. Materials 2019, 12, 1267. [Google Scholar] [CrossRef] [PubMed]
- Brezina, P. Heat treatment of complex aluminum bronzes. Int. Met. Rev. 1982, 27, 77–120. [Google Scholar] [CrossRef]
- Cruz, R.A.; Santos, G.A.; Nascimento, M.S.; Frajuca, C.; Nakamoto, F.Y.; Silva, M.R.; Santos, V.T.; Batalha, G.F.; Couto, A.A. Microstructural Characterization and Mathematical Modeling for Determination of Volume Fraction of Eutectoid Mixture of the Cu-8.5wt% Sn Alloy Obtained by Unidirectional Upward Solidification. Mater. Sci. Forum 2020, 1012, 302–307. [Google Scholar] [CrossRef]
- Faria, J.; Paula, A.; Silva, C.; Kakitani, R.; Barros, A.; Garcia, A.; Brito, C.; Cheung, N. Fe-Containing Al-Based Alloys: Relationship between Microstructural Evolution and Hardness in an Al-Ni-Fe Alloy. Metals 2023, 13, 1980. [Google Scholar] [CrossRef]
- Cenoz, I. Metallography of aluminium bronze alloy as cast in permanent iron die. Metall. Mater. Eng. 2010, 16, 115–122. [Google Scholar]
- Vaidyanath, L.R. The Manufacture of Aluminium-Bronze Casting; Indian Copper Information Center: Kolkata, India, 1968; Volume 13A. [Google Scholar]
- Copper Development Association. Aluminum Bronze Alloys for Industry; CDA: Hemel Hempstead, UK, 1986. [Google Scholar]
- Caveagna, L.H. Abcobre. Copper Applications Gain Space in the Aerospace Industry. 2021. Available online: https://abcobre.org.br/aplicacoes-de-cobre-ganham-espaco-na-industria-aeroespacial (accessed on 19 April 2024).
- Meigh, H.J. Cast and Wrought Aluminum Bronzes Properties, Processes and Structure, 1st ed.; CRC Press: Hants, UK, 2000; ISBN 978-1861250629. [Google Scholar]
- Santos, G.A.; Alves, T.L.; Teram, R.; Cruz, R.A.; Nascimento, M.S.; Santos, V.T.; Silva, M.R.; Couto, A.A.; Machado, I.F. Effects of directional solidification on hardness and microstructure in Al–3wt.%Cu–1wt.%Li alloy. In IOP Conference Series: Materials Science and Engineering; IOP Publishing: Bristol, UK, 2022. [Google Scholar] [CrossRef]
- Dias, A.N.O.; Silva, A.; Rodrigues, C.A.; Melo, M.L.N.M.; Rodrigues, G.; Silva, G. Effect of High Energy Milling Time of the Aluminum Bronze Alloy Obtained by Powder Metallurgy with Niobium Carbide Addition. Mater. Res. 2017, 20, 747–754. [Google Scholar] [CrossRef]
- Alfaia, M.A.O.; Oliveira, R.; Lima, T.S.; Mariani, F.E.; Casteletti, L.C.; Cheung, N.; Garcia, A. Effects of cooling rate and microstructure scale on wear resistance of unidirectionally solidified Al-3.2wt.%Bi-(1; 3) wt.%Pb alloys. Mater. Today Commun. 2020, 25, 101659. [Google Scholar] [CrossRef]
- Kakitani, R.; Cruz, C.B.; Lima, T.S.; Brito, C.; Garcia, A.; Cheung, N. Transient Directional Solidification of a Eutectic Al–Si–Ni Alloy: Macrostructure, Microstructure, Dendritic Growth and Hardness. Materialia 2019, 7, 100358. [Google Scholar] [CrossRef]
- Richardson, I. Guide to Nickel Aluminum Bronze for Engineers; Copper Development Association: New York, NY, USA, 2016. [Google Scholar]
- Callister, W.D.; Rethwisch, D.G. Materials Science and Engineering: An Introduction, 9th ed.; John Wiley & Sons: New York, NY, USA, 2013; p. 209. [Google Scholar]
- Abbaschian, R.; Abbaschian, L.; Reed-Hill, R.E. Physical Metallurgy Principles, 4th ed.; Cengage Learning: Independence, KY, USA, 2008. [Google Scholar]
- Obara, J.T.; Minei, R.O.; Kakitani, R.; Spinelli, J.E.; Garcia, A.; Cheung, N. Solidification microstructure and mechanical properties of an Al-11wt%Si alloy modified with Nb and Sb. J. Phys. Chem. Solids 2023, 181, 111521. [Google Scholar] [CrossRef]
- Elesbão, D.S.G.; Kakitani, R.; Cheung, N.; Garcia, A.; Barcellos, V.K.; Costa, E.M.; Santos, C.A. Influence of Cu and Cr contents on the solidification path and microstructure formation of hypoeutectic as-cast Al–Cu–Cr alloys. J. Therm. Anal. Calorim. 2023, 148, 9403–9421. [Google Scholar] [CrossRef]
- ASTM B-150; Standard Specification for Aluminum Bronze Rod, Bar, and Shapes. ASTM International: West Conshohocken, PA, USA, 2019.
- ABCOBRE, Brazilian Copper Yearbook, São Paulo, Brazil. 2022. Available online: http://abcobre.org.br/wp-content/uploads/2022/06/Anuario-do-Cobre-2022.pdf (accessed on 7 April 2024).
- Rodrigues, A.V.; Kakitani, R.; Silva, C.; Giovanetti, L.; Dias, M.; Henein, H.; Garcia, A.; Cheung, N. Influence of Minor Additions of Be on the Eutectic Modification of an Al-33wt.%Cu Alloy Solidified under Transient Conditions. Metals 2023, 13, 94. [Google Scholar] [CrossRef]
- Hasan, F.; Jahanafrooz, A.; Lorimer, G.W.; Ridley, N. The morphology, crystallography, and chemistry of phases in as-cast nickel-aluminum bronze. Metall. Trans. 1982, 13, 1337–1345. [Google Scholar] [CrossRef]
- Iqbal, J.; Ahmed, F.; Hasan, F. Development of Microstructure in Silicon-Aluminum-Bronze. Pak. J. Eng. Appl. Sci. 2008, 3, 47–53. [Google Scholar]
- Garcia, A. Solidificação: Fundamentos e Aplicações; Editora da Universidade Estadual de Campinas Unicamp: Campinas, Brazil, 2007. [Google Scholar]
- ASTM E-10; Standard Test Method for Brinell Hardness of Metallic Materials. ASTM International: West Conshohocken, PA, USA, 2023.
- ASTM E-92; Standard Test Methods for Vickers Hardness and Knoop Hardness of Metallic Materials. ASTM International: West Conshohocken, PA, USA, 2023.
- ASTM E-407; Standard Practice for Microetching Metals and Alloys. ASTM International: West Conshohocken, PA, USA, 2023.
- Zhao, L.; Li, K.; Yao, J.; Yuan, Y.; Du, B. The Laser Deposited Nickel-Aluminum Bronze Coatings on SUS630 Stainless Steel and Its Corrosion Resistance in 3.5 wt.% NaCl Solution. Metals 2022, 12, 781. [Google Scholar] [CrossRef]
- Zhao, J.H.; Li, P.; Tang, Q.; Zhang, Y.Q.; He, J.S.; He, K. Influence of Metal-Coated Graphite Powders on Microstructure and Properties of the Bronze-Matrix/Graphite Composites. J. Mater. Eng. Perform. 2017, 26, 792–801. [Google Scholar] [CrossRef]
- Dias, M.; Brito, C.; Bertelli, F.; Rocha, O.L.; Garcia, A. Interconnection of thermal parameters, microstructure, macrosegregation and microhardness of unidirectionally solidified Zn-rich Zn–Ag peritectic alloys. Mater. Des. 2014, 63, 848–855. [Google Scholar] [CrossRef]
- Lv, Y.; Wang, L.; Xu, X.; Lu, W. Effect of Post Heat Treatment on the Microstructure and Microhardness of Friction Stir Processed NiAl Bronze (NAB) Alloy. Metals 2015, 5, 1695–1703. [Google Scholar] [CrossRef]


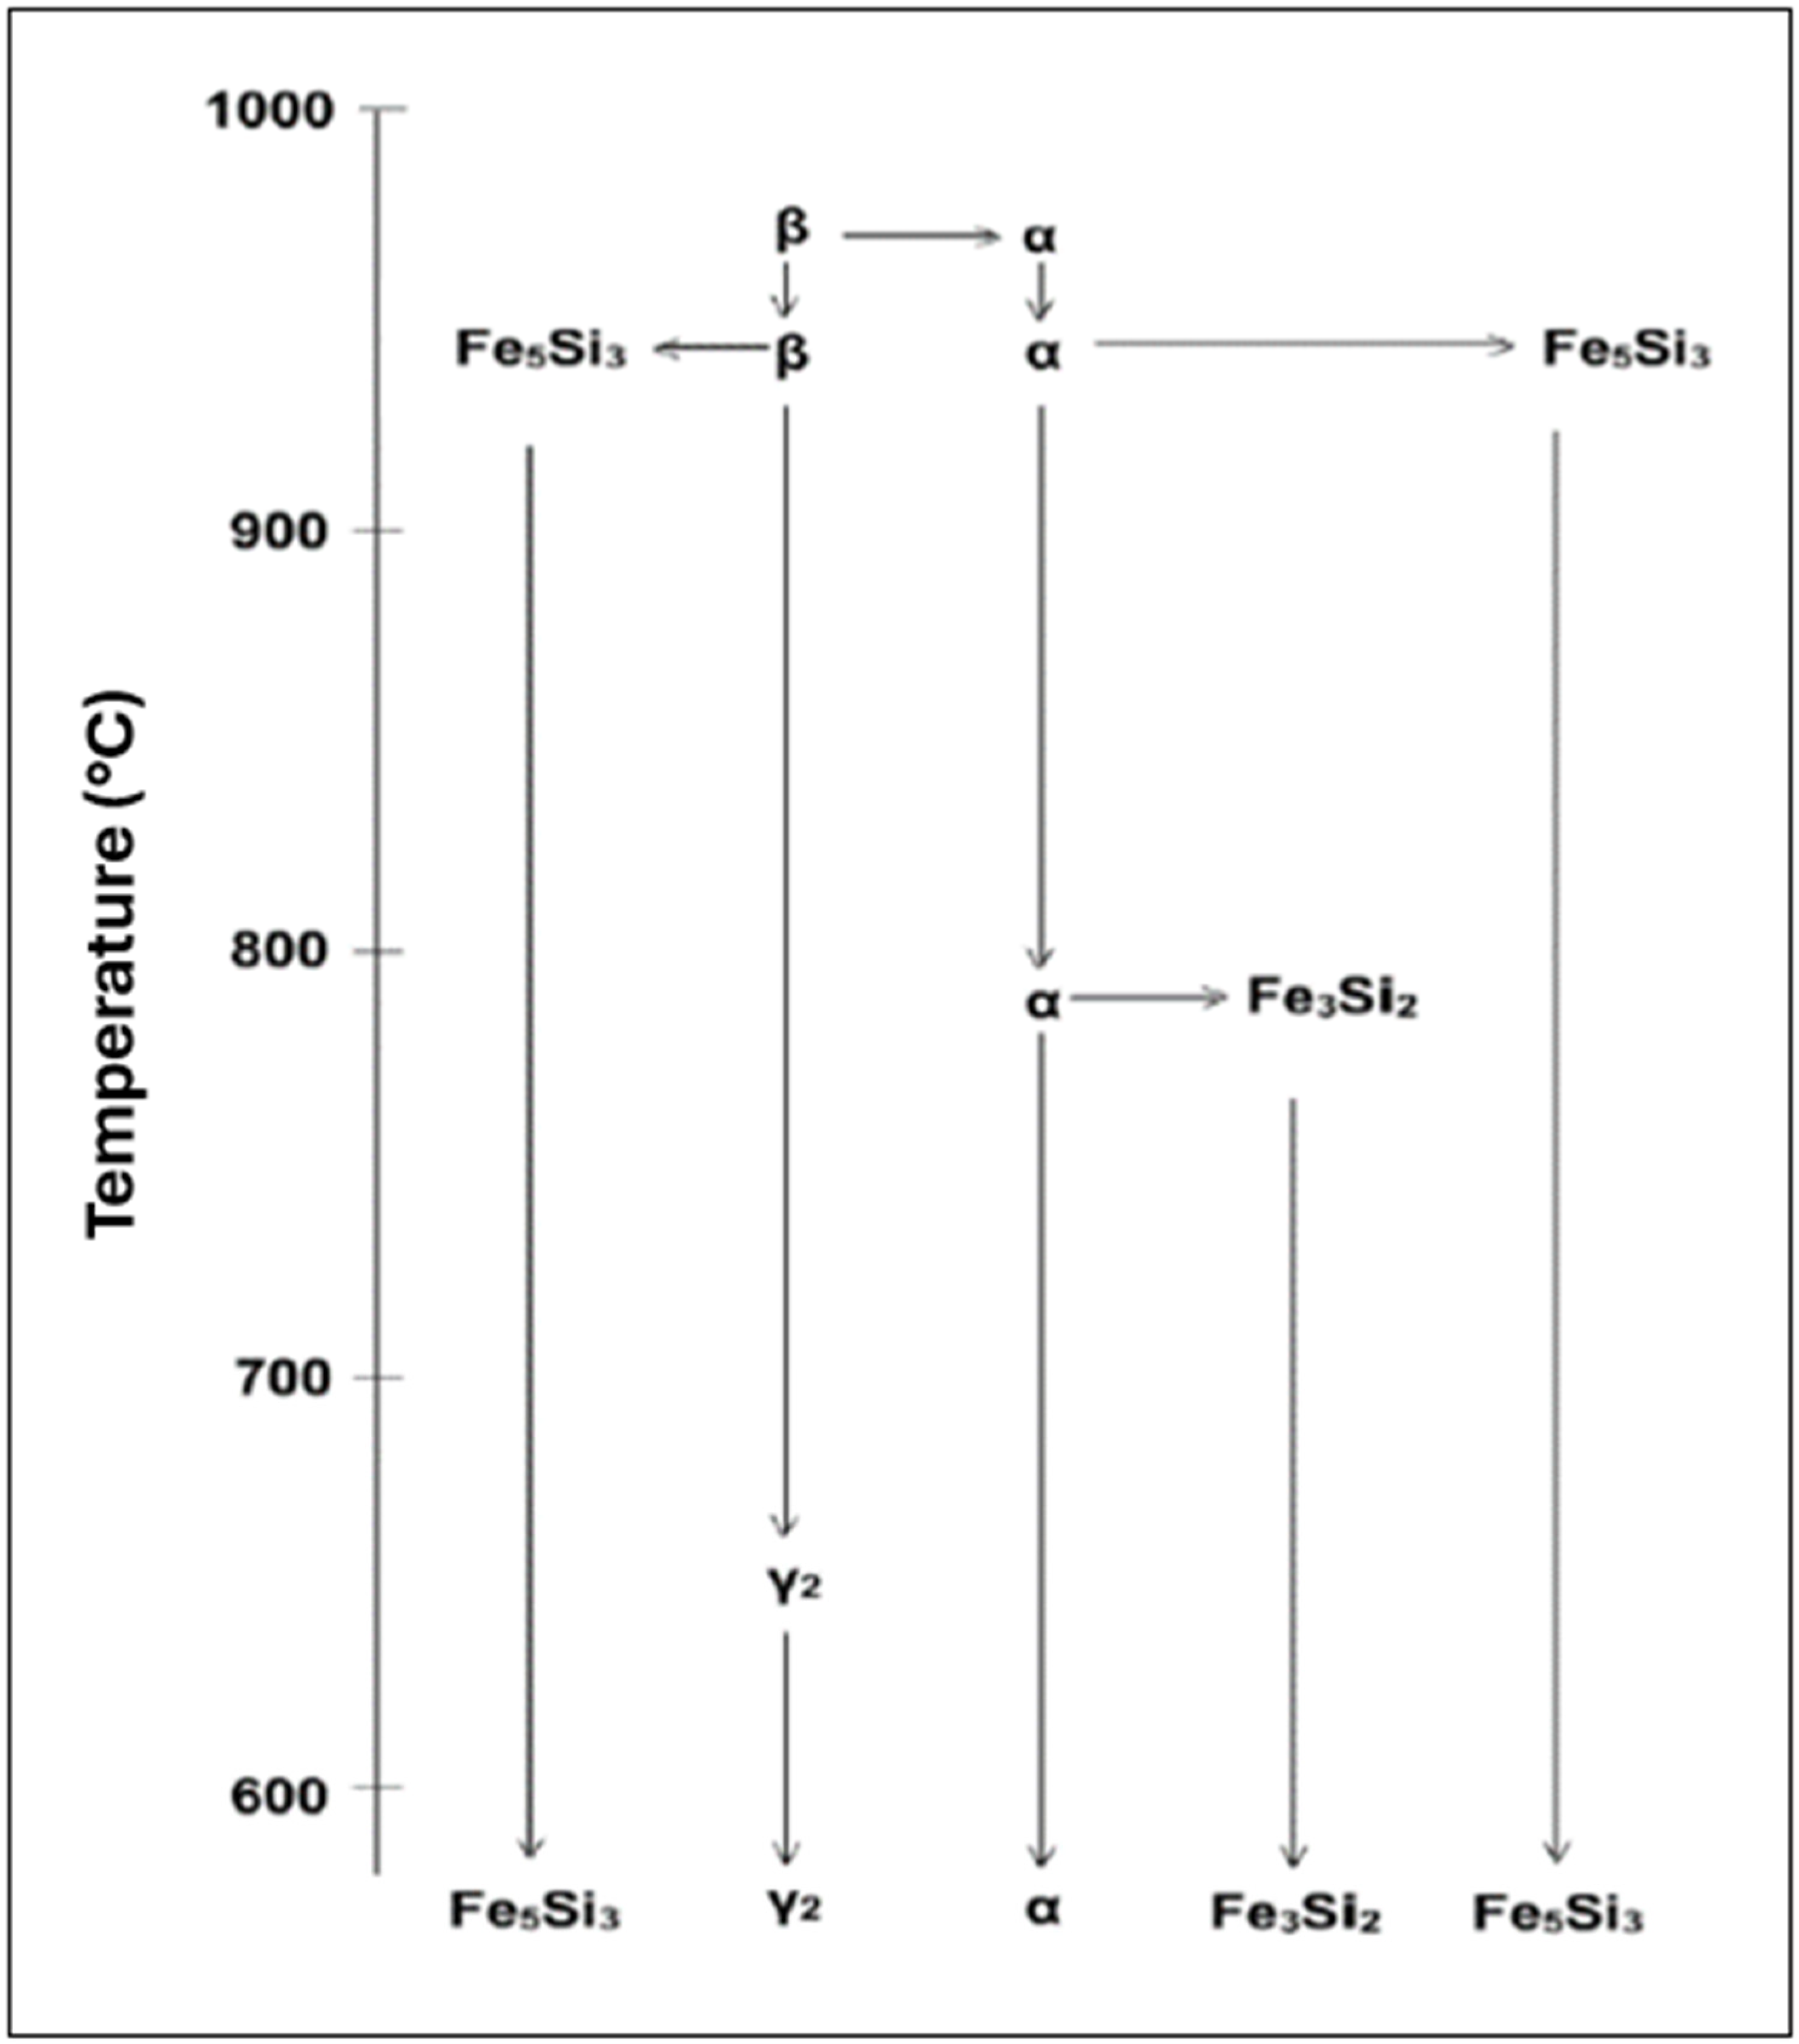
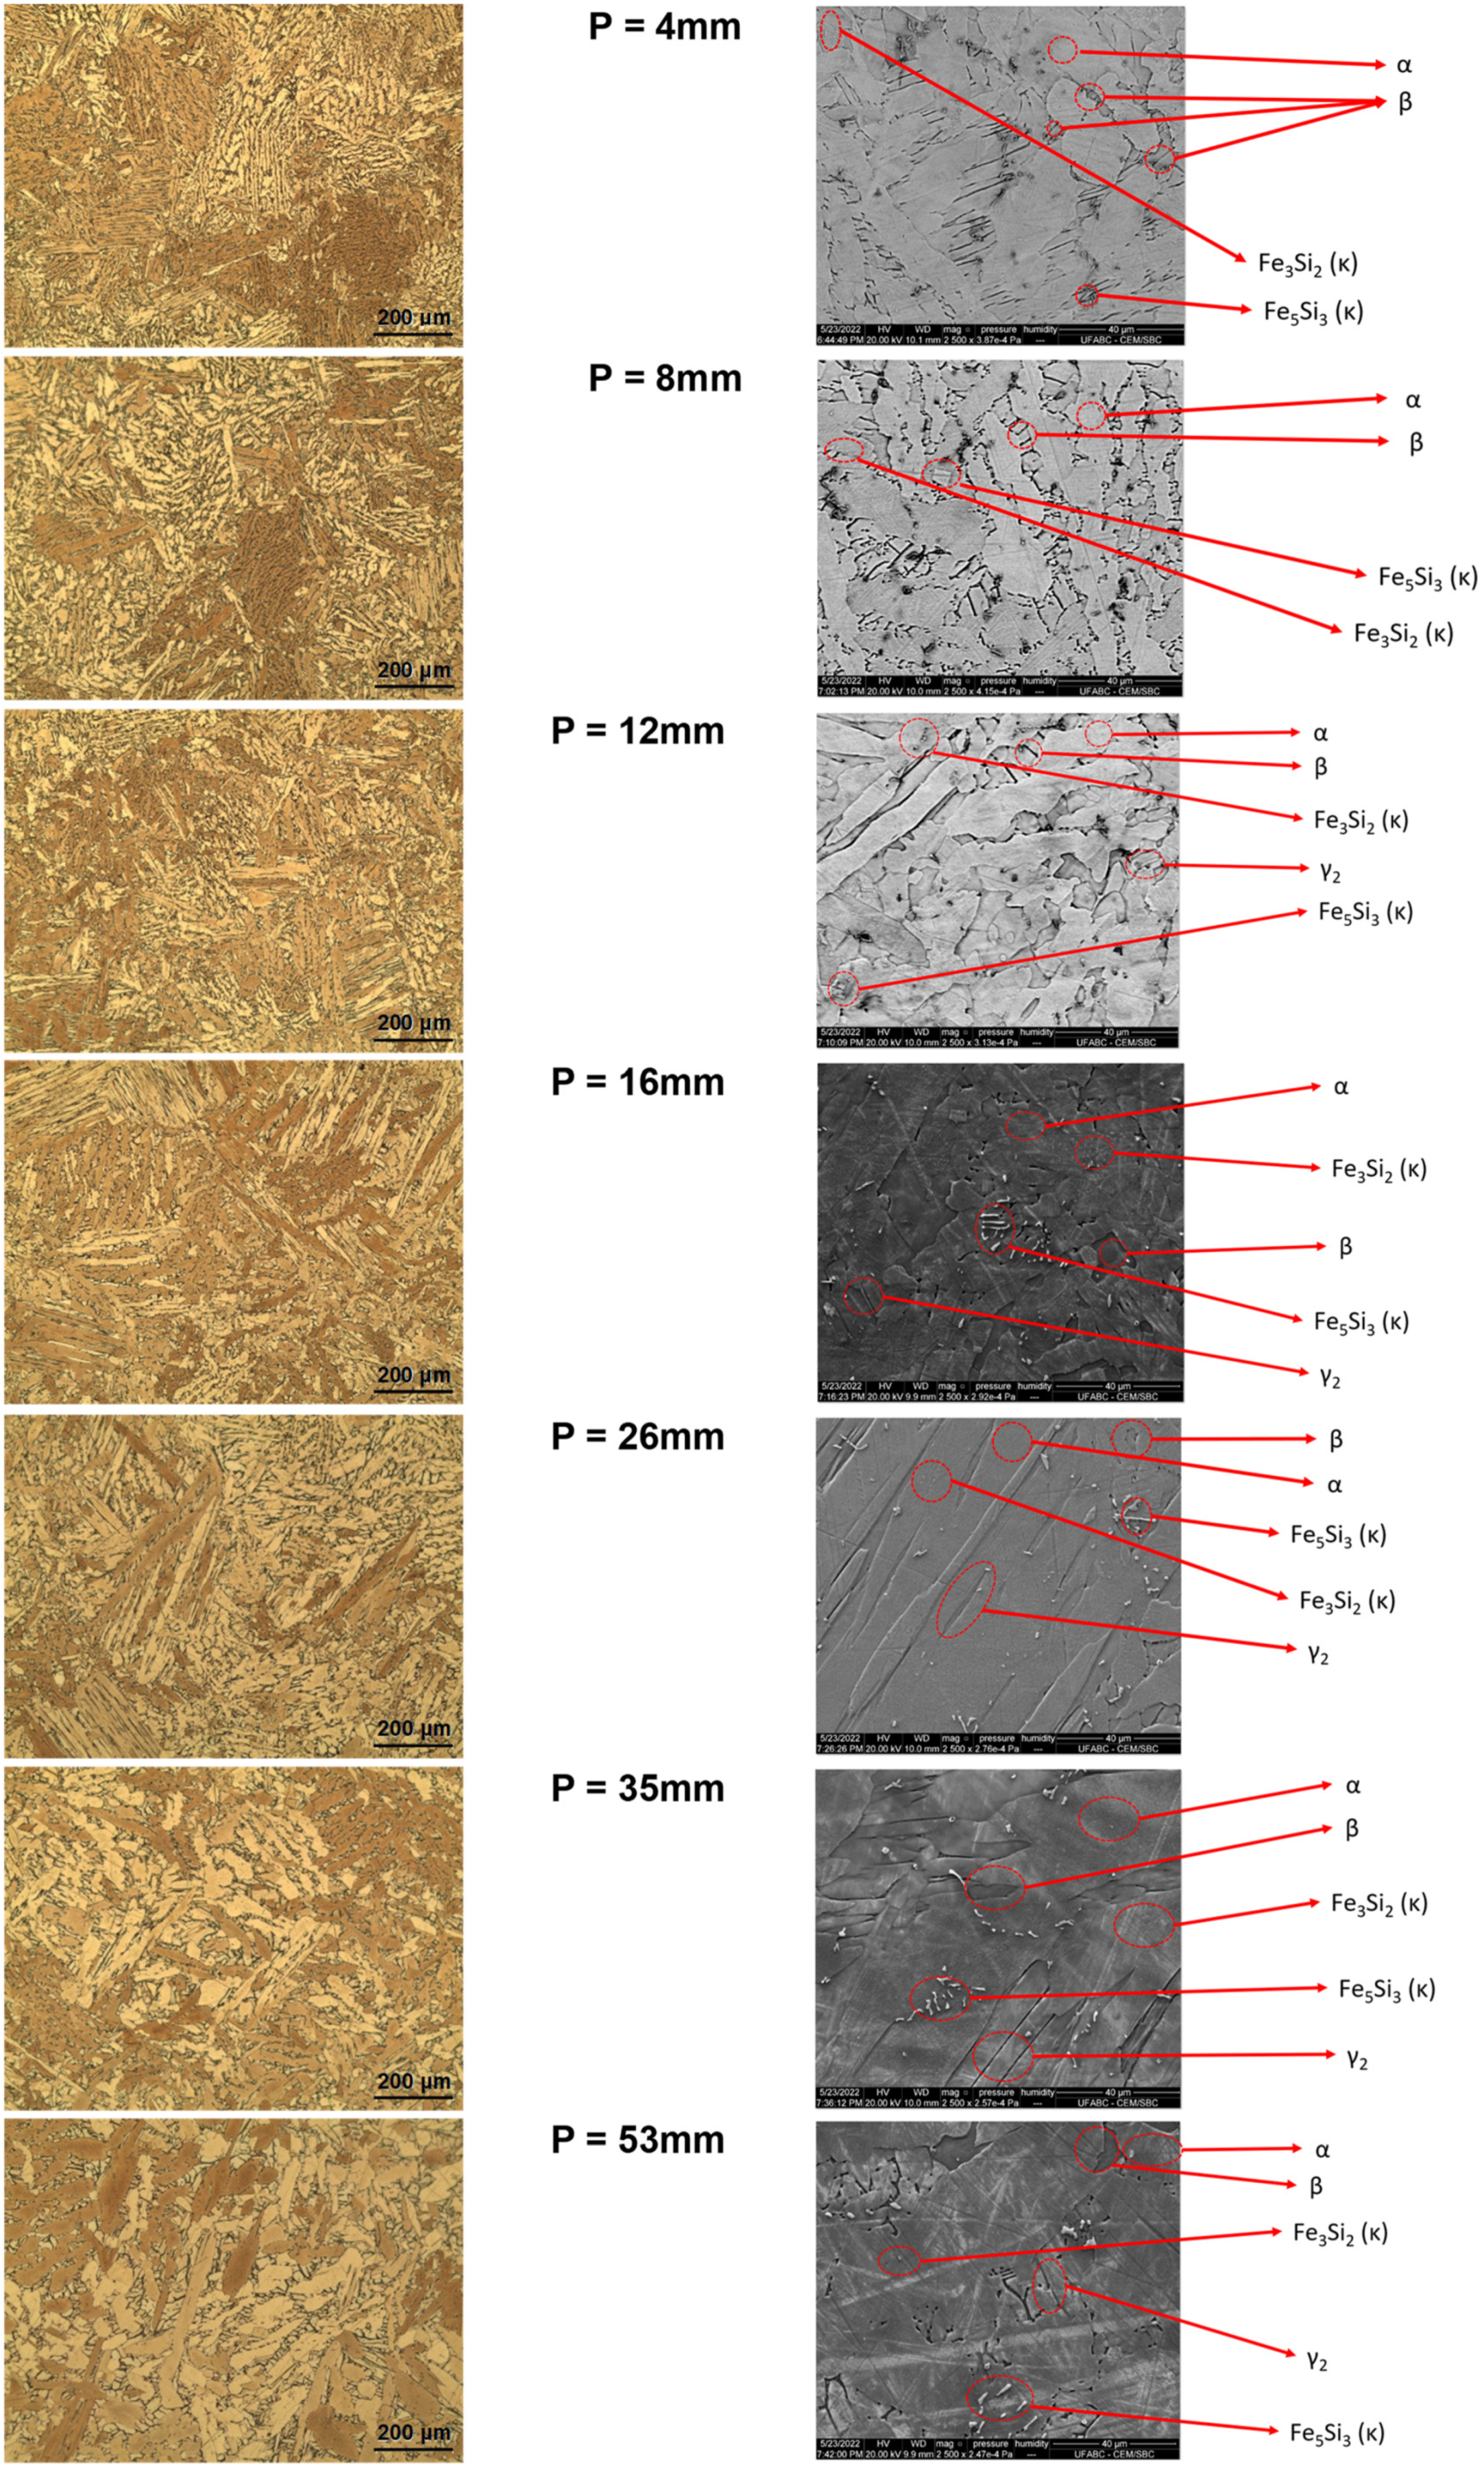
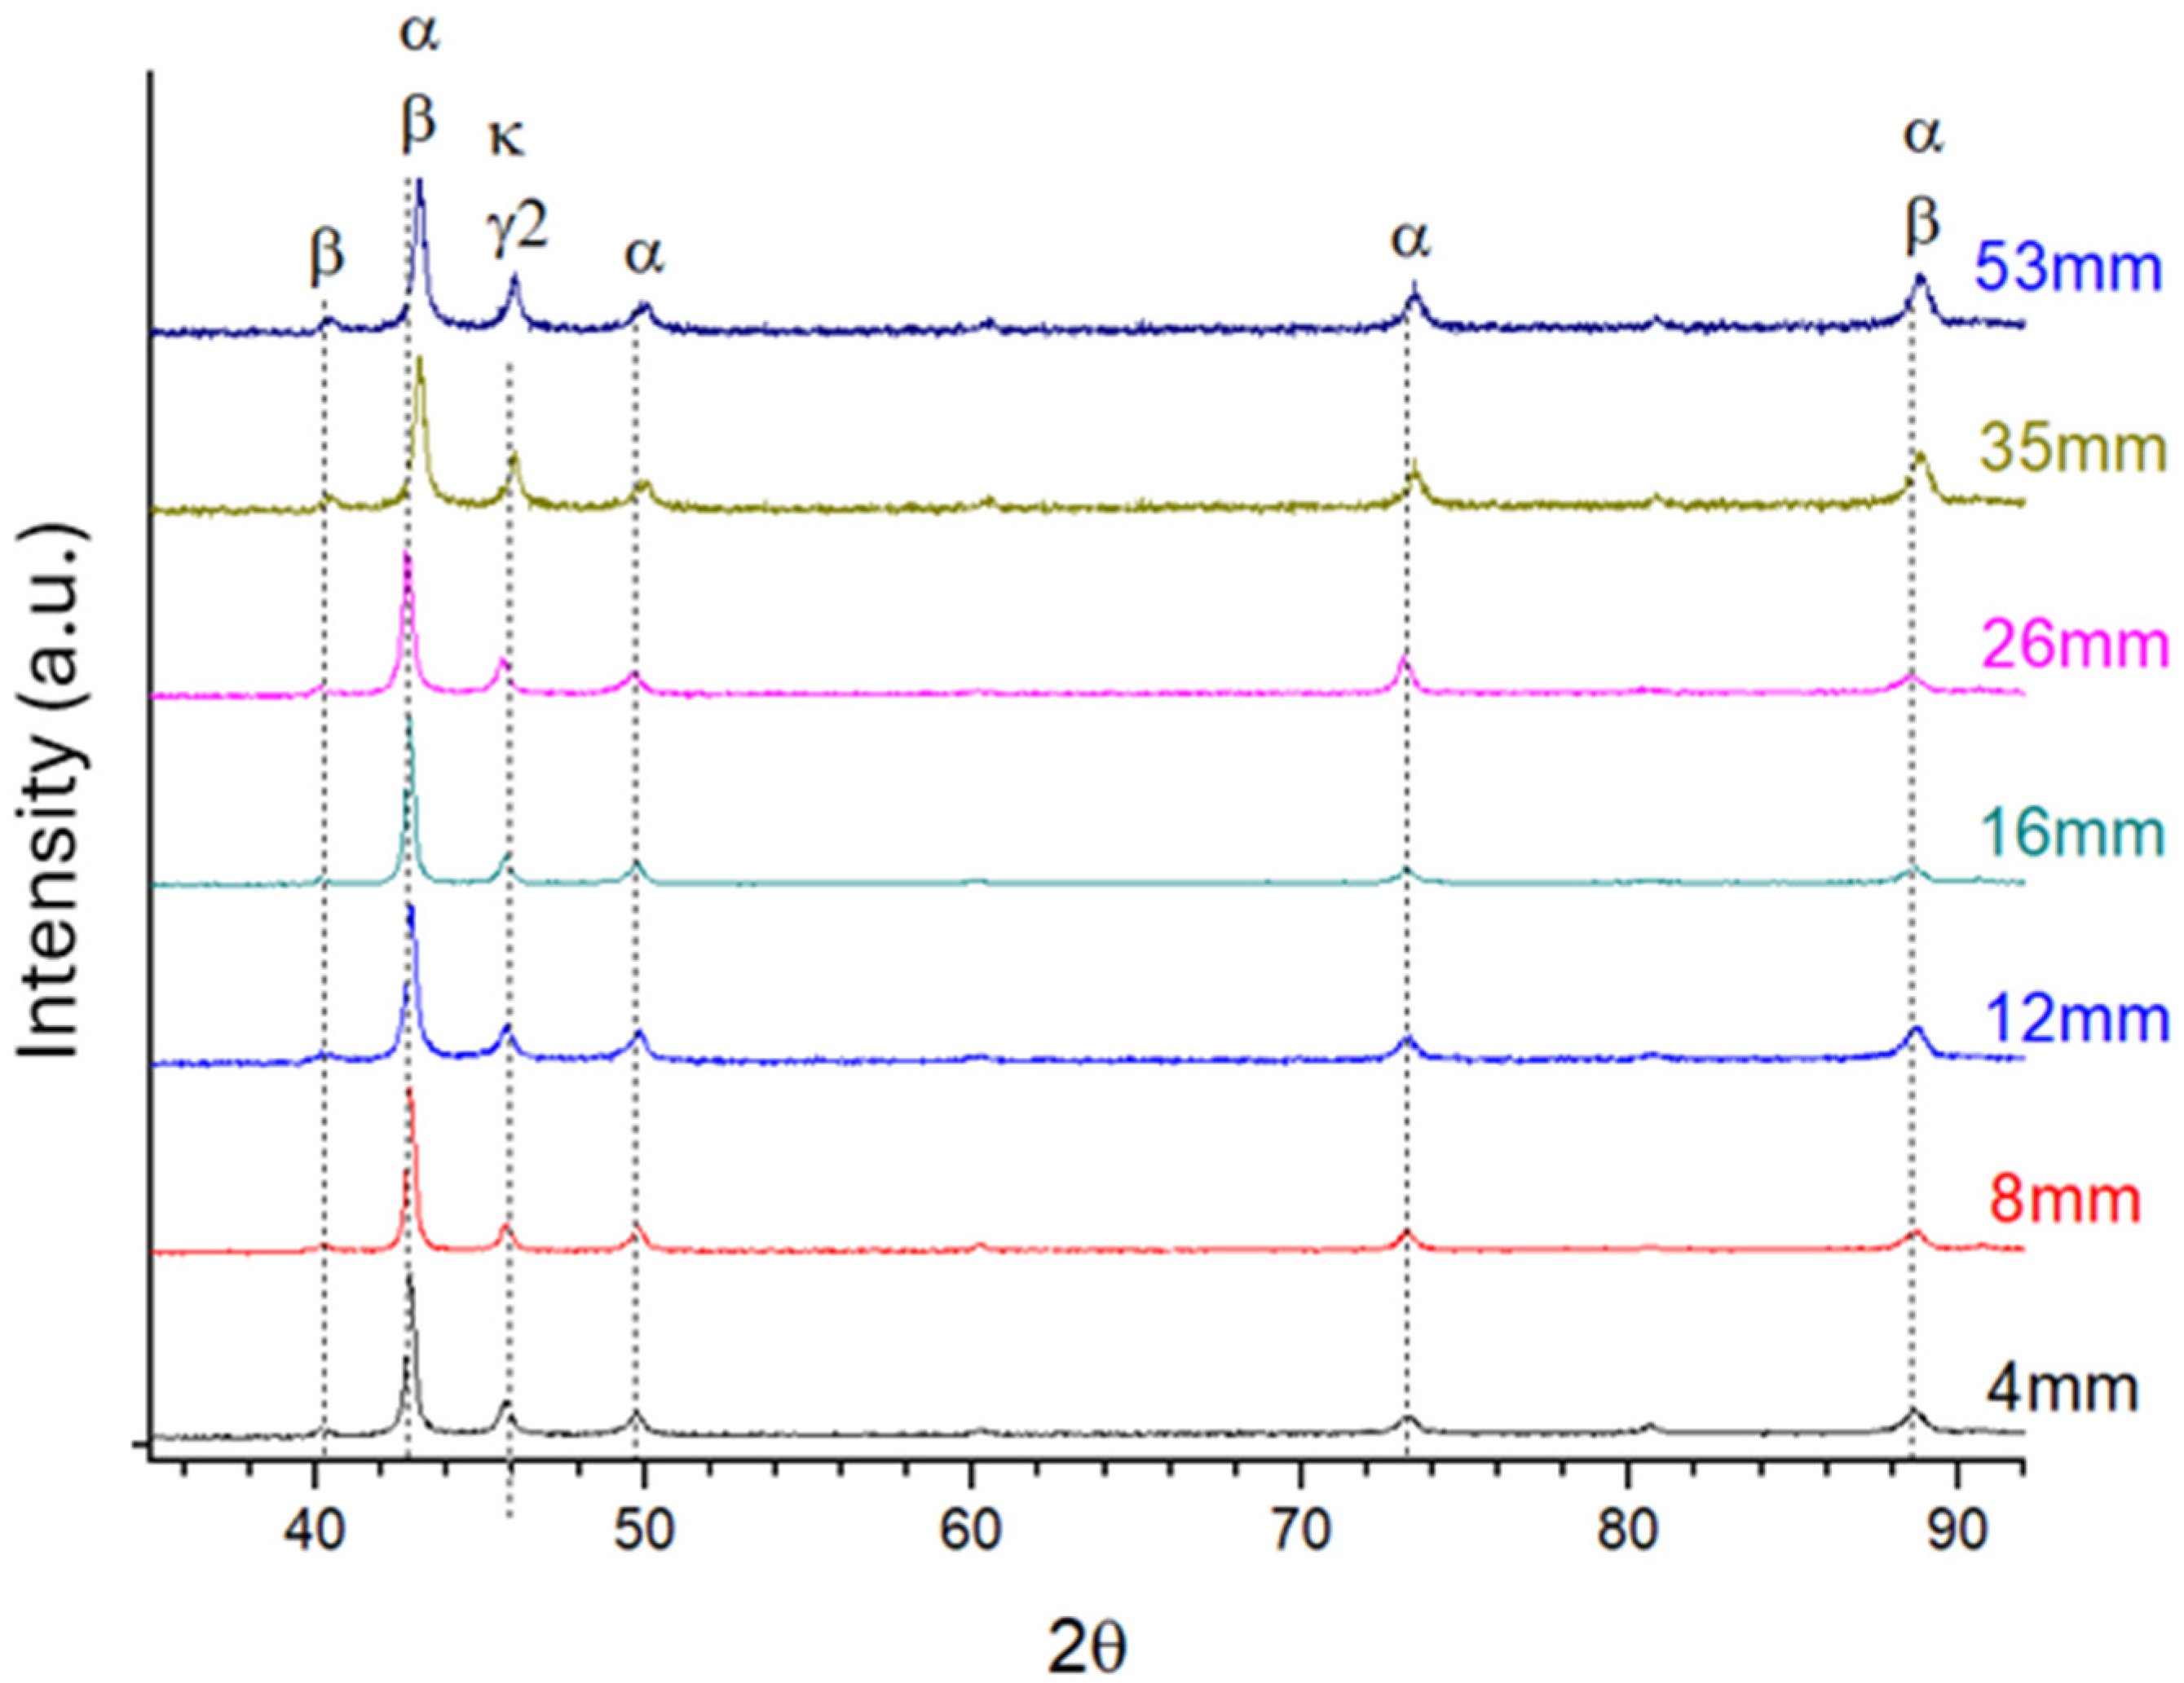
| Phases and Intermetallics | Morphology | Structure | Composition |
|---|---|---|---|
| α | Widmanstätten | FCC | Cu-rich (containing ~12%Al, 5%Si) |
| γ2 | Twin-like plates associated with α phase | CPH | Cu-rich (containing ~12%Al, 3%Si) |
| β | Martensitic phase that is retained in the microstructure between the α grains | BCC | Cu-rich with Al and Si |
| Fe3Si2 (Kappa) | lath-shaped particles | B2 | Fe-rich (containing ~38%Si) |
| Fe5Si3 (Kappa) | Crystals with irregular appearance and parallel sides | Hexagonal | Fe-rich (containing ~30%Si, 16%Cu) |
| α + γ2 | Twin-like plates located at the boundaries of the α and β phases | FCC & CPH | Cu-rich (containing ~15%Al, 8%Si) |
| Alloy | Composition (wt%) | |||
|---|---|---|---|---|
| Cu | Al | Si | Others | |
| CuAl6Si2 | Bal | 6.36 | 2.3 | Ni—0.156 max |
| Fe—0.65 | ||||
| Mn—0.25 max | ||||
| Sn—0.08 max | ||||
| Zn—0.32 max | ||||
| Pb—0.006 max | ||||
| Alloy | Standard | Composition (wt%) | |||
|---|---|---|---|---|---|
| Cu | Al | Si | Others | ||
| CuAl6Si2 | Def Stan 02-834 | Rest | 6.0–6.4 | 2.0–2.4 | Ni—0.25 max |
| Fe—0.5–0.7 | |||||
| Mn—0.50 max | |||||
| Sn—0.1 max | |||||
| Zn—0.4 max | |||||
| Pb—0.01 max | |||||
| CuAl6Si2 | Chemical composition after solidification | Rest | 6.29 | 2.21 | Ni—0.135 max |
| Fe—0.52 | |||||
| Mn—0.23 max | |||||
| Sn—0.06 max | |||||
| Zn—0.17 max | |||||
| Pb—0.006 max | |||||
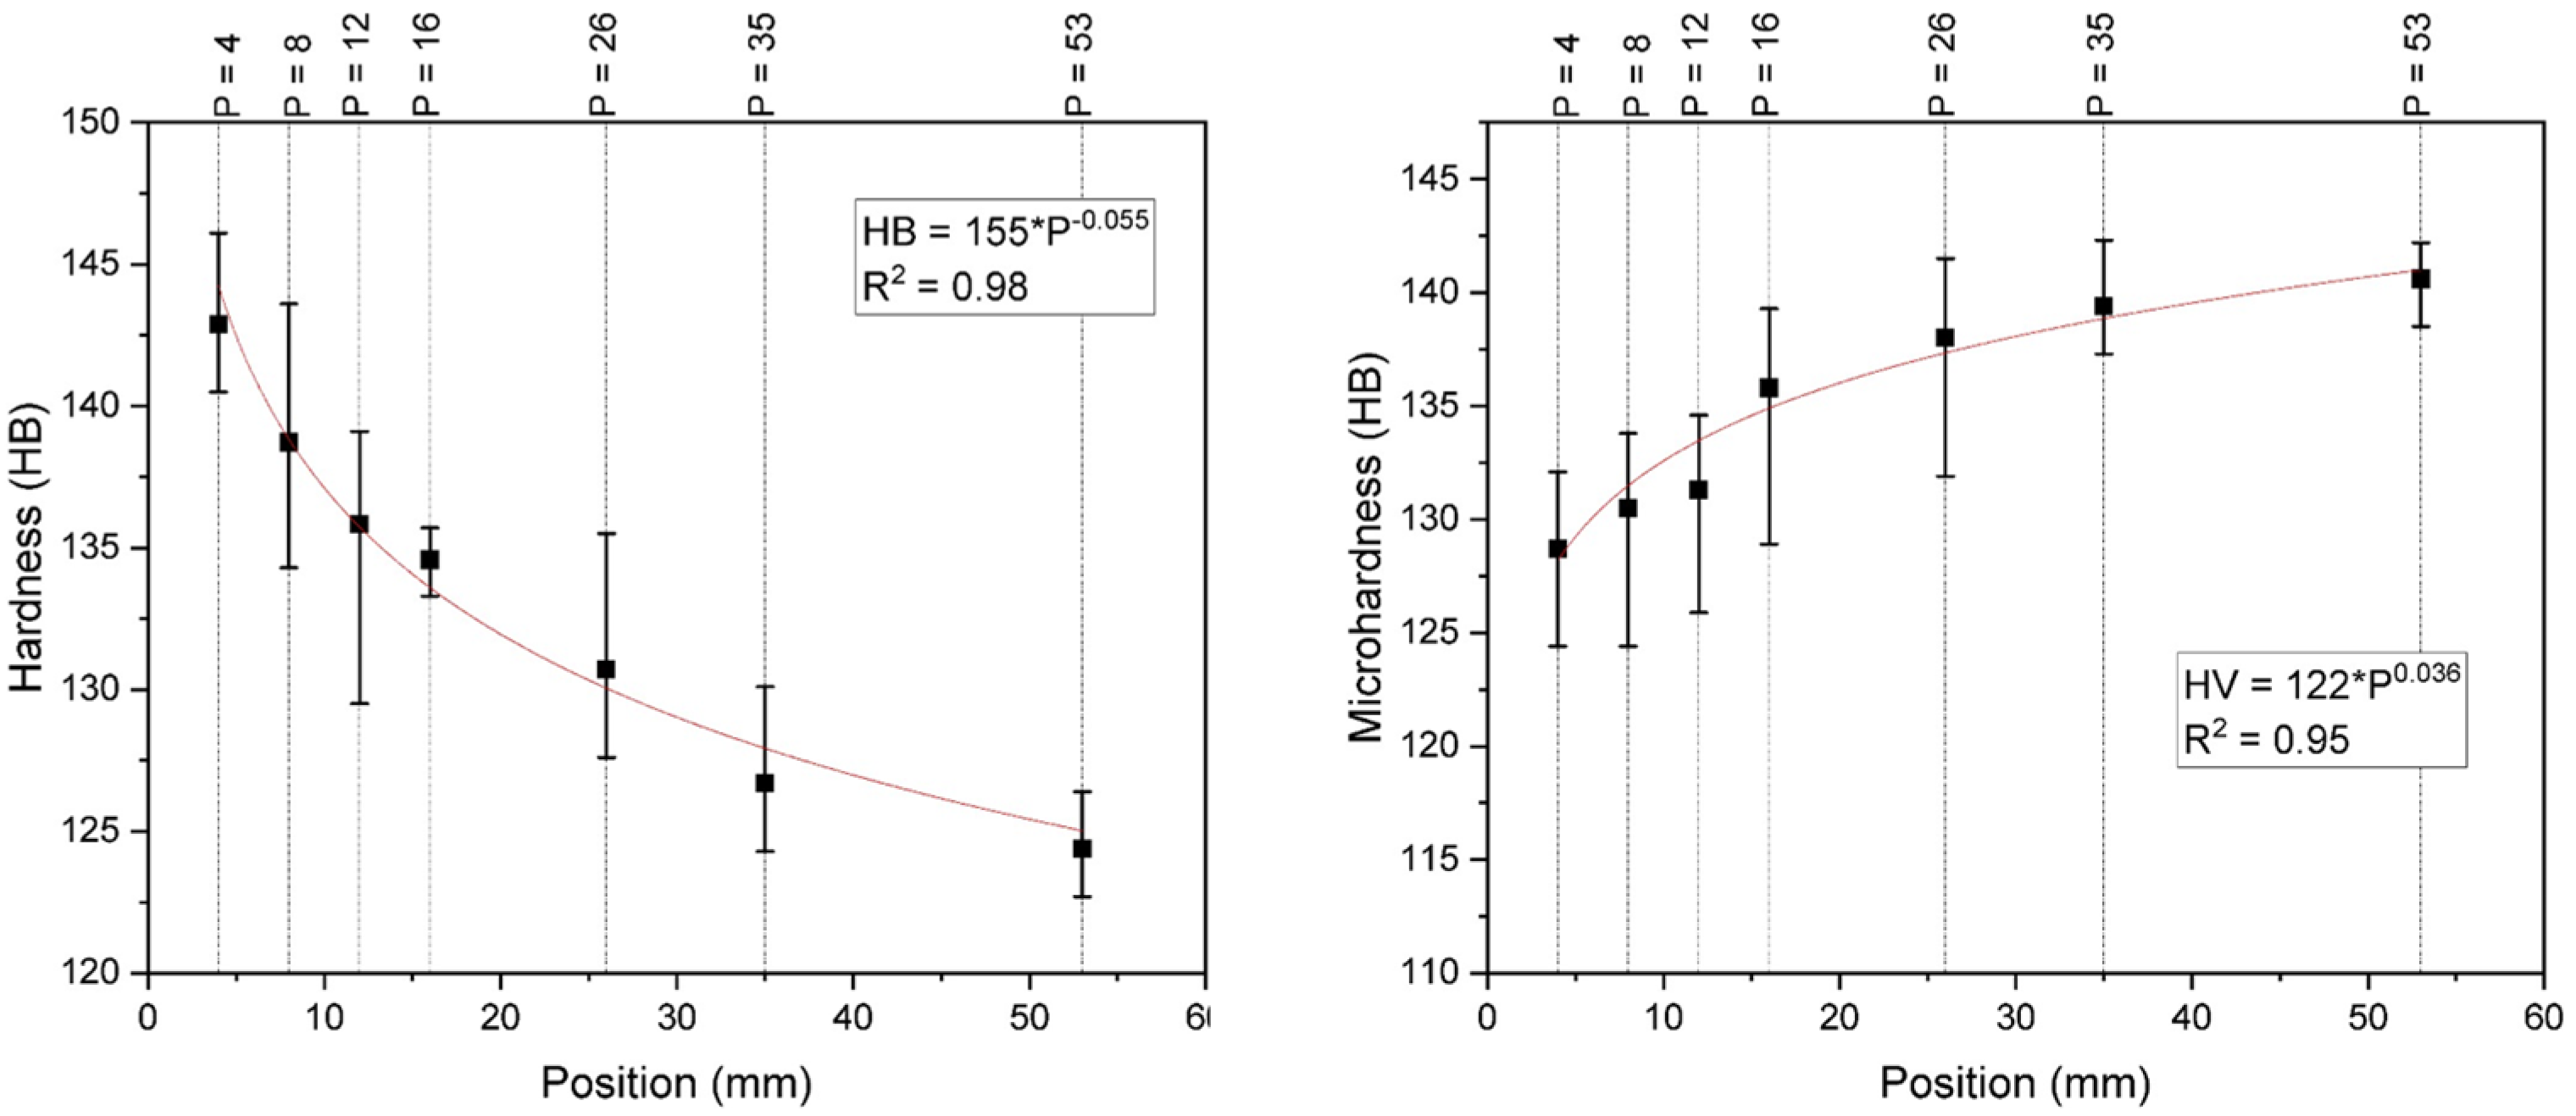
| Position (mm) | VL (mm/s) | TR (°C/min) | GL (°C/mm) | Hardness (HB) | Microhardness (HV1) | Phases Distribution α + γ2 (%) |
|---|---|---|---|---|---|---|
| 4 | 0.47 | 217.06 | 7.7 | 142.9 | 128.7 | 61 |
| 8 | 0.37 | 55.92 | 2.52 | 138.7 | 130.5 | 68 |
| 12 | 0.32 | 46.26 | 2.4 | 135.8 | 131.3 | 75 |
| 16 | 0.29 | 21.7 | 1.25 | 134.6 | 135.8 | 86 |
| 26 | 0.25 | 10.59 | 0.72 | 130.7 | 138.03 | 90 |
| 35 | 0.22 | 4.58 | 0.35 | 126.7 | 139.4 | 93 |
| 53 | 0.19 | 3.01 | 0.26 | 124.4 | 140.6 | 94 |
Disclaimer/Publisher’s Note: The statements, opinions and data contained in all publications are solely those of the individual author(s) and contributor(s) and not of MDPI and/or the editor(s). MDPI and/or the editor(s) disclaim responsibility for any injury to people or property resulting from any ideas, methods, instructions or products referred to in the content. |
© 2024 by the authors. Licensee MDPI, Basel, Switzerland. This article is an open access article distributed under the terms and conditions of the Creative Commons Attribution (CC BY) license (https://creativecommons.org/licenses/by/4.0/).
Share and Cite
Nascimento, P.H.T.d.; Santos, V.T.d.; Luca, R.d.; Silva, M.R.d.; Lobo, F.G.; Teram, R.; Nascimento, M.S.; Cozza, R.C.; Couto, A.A.; Santos, G.A.d.; et al. Effects of Solidification Thermal Variables on the Microstructure and Hardness of the Silicon Aluminum Bronze Alloy CuAl6Si2. Metals 2024, 14, 1134. https://doi.org/10.3390/met14101134
Nascimento PHTd, Santos VTd, Luca Rd, Silva MRd, Lobo FG, Teram R, Nascimento MS, Cozza RC, Couto AA, Santos GAd, et al. Effects of Solidification Thermal Variables on the Microstructure and Hardness of the Silicon Aluminum Bronze Alloy CuAl6Si2. Metals. 2024; 14(10):1134. https://doi.org/10.3390/met14101134
Chicago/Turabian StyleNascimento, Paulo Henrique Tedardi do, Vinicius Torres dos Santos, Ricardo de Luca, Marcio Rodrigues da Silva, Flavia Goncalves Lobo, Rogerio Teram, Mauricio Silva Nascimento, Ronaldo Camara Cozza, Antonio Augusto Couto, Givanildo Alves dos Santos, and et al. 2024. "Effects of Solidification Thermal Variables on the Microstructure and Hardness of the Silicon Aluminum Bronze Alloy CuAl6Si2" Metals 14, no. 10: 1134. https://doi.org/10.3390/met14101134