Article

Effects of Solidification Thermal Variables on the Microstructure and Hardness of the Silicon Aluminum Bronze Alloy CuAl6Si2

by
Paulo Henrique Tedardi do Nascimento
1,2,3,*,
Vinicius Torres dos Santos
1,
Ricardo de Luca
1,
Marcio Rodrigues da Silva
1,
Flavia Goncalves Lobo
1,
Rogerio Teram
4,
Mauricio Silva Nascimento
4,
Ronaldo Camara Cozza
5,
Antonio Augusto Couto
3,
Givanildo Alves dos Santos
4 and
Anibal de Andrade Mendes Filho
2
1
Termomecanica São Paulo S.A., São Bernardo do Campo 09612-000, Brazil
2
Department of Engineering, Modeling and Applied Social Sciences, Federal University of ABC, Santo André 09210-580, Brazil
3
Department of Engineering, Mackenzie Presbyterian University, UPM, São Paulo 01302-907, Brazil
4
Department of Mechanics, Federal Institute of Education, Science and Technology of São Paulo, São Paulo 01109-010, Brazil
5
CEETEPS—State Center of Technological Education “Paula Souza”, Department of Mechanical Manufacturing, Av. Antônia Rosa Fioravante 804, Mauá 09390-120, Brazil
*
Author to whom correspondence should be addressed.
Metals 2024, 14(10), 1134; https://doi.org/10.3390/met14101134
Submission received: 8 July 2024 / Revised: 24 August 2024 / Accepted: 25 August 2024 / Published: 5 October 2024

Abstract

:
The properties of the final product obtained by solidification directly result from the thermal variables during solidification. This study aims to analyze the influence of thermal solidification variables on the hardness, microstructure, and phases of the CuAl6Si2 alloy. The material was solidified using unidirectional solidification equipment under non-stationary heat flow conditions, where heat extraction is conducted through a water-cooled graphite base. The thermal solidification variables were extracted using a data acquisition system, and temperature was monitored at six different positions, with cooling rates ranging from 217 to 3 °C/min from the nearest to the farthest position from the heat extraction point. An optical microscope, scanning electron microscope (SEM), and X-ray diffraction (XRD) were used to verify the fusion structure and determine the volumetric fraction of the formed phases. The XRD results showed the presence of β phases, α phases, and possible Fe3Si2 and Fe5Si3 intermetallics with different morphologies and volumetric fractions. Positions with lower cooling rates showed an increased volume fraction of the α phase and possible intermetallics compared to positions with faster cooling. High cooling rates increased the Brinell hardness of the alloy due to the refined and equiaxed β metastable phase, varying from 143 HB to 126 HB for the highest and lowest rates, respectively.

1. Introduction

A family of copper alloys considered for high-tech applications is aluminum bronzes. This work particularly focuses on Silicon Aluminum Bronze (SAB), known globally by its composition under the Def Stan 02-834 standard [1,2]. Cu-Al-Si alloys are a type of copper-based alloy that typically contains between 3% and 10% aluminum and 1% to 5% silicon. These alloys are known for their high strength, good corrosion resistance, and excellent thermal stability. They are commonly used in applications that require high strength and good thermal conductivity, such as electrical components, heat exchangers, and aerospace structures. They also have good weldability and can be easily machined [3,4]. The mechanical properties of Cu-Al-Si alloys can be improved through heat treatment, which can increase their tensile strength and yield strength [5]. The addition of other elements, such as nickel, can also improve the strength and corrosion resistance of these alloys [6,7,8,9].
Cu-Al-Si alloys are known for their good casting properties, making them a popular choice for castings in a variety of applications [10,11]. In this case, it is necessary to control and understand the effect of different thermal variables during the casting process [1,4,12]. Some of the key solidification variables that can influence the microstructure and properties of these alloys include the following:
(i)
Cooling rate: The cooling rate during solidification can affect the size and distribution of the microstructural constituents in Cu-Al-Si alloys. Higher cooling rates generally result in a finer microstructure with improved mechanical properties [13,14,15,16];
(ii)
Pouring temperature: The temperature at which the alloy is poured into the mold can also affect the microstructure and properties of Cu-Al-Si alloys. Higher pouring temperatures can lead to coarser microstructures and reduced mechanical properties [17,18];
(iii)
Melt treatment: The addition of certain elements or compounds to the melt, such as grain refiners or modifiers, can also influence the microstructure and properties of Cu-Al-Si alloys [18,19,20,21];
(iv)
Mold type and design: The type and design of the mold used for casting can also impact the microstructure and properties of Cu-Al-Si alloys. Factors such as mold temperature, mold material, and mold design can all influence the cooling rate and resulting microstructure [15].
The CuAl6Si2, which is standardized by Defense Standard 02-834/NES834, and C64200 [2,22], is a specific aluminum silicon bronze that offers similar properties to other aluminum bronzes, including good strength levels and a high corrosion resistance. However, it is primarily recognized and specified by the military applications for its controlled low magnetic permeability level of <1.005. Low magnetic permeability in copper alloys is vital in military applications for maintaining stealth, reducing electromagnetic interference, ensuring accuracy in sensitive equipment, and avoiding detection by magnetic sensors. With an aluminum content of ~6% and a ~2% silicon addition, the material gives designers a very good impact strength that is maintained down to cryogenic temperatures. It is usually a wrought alloy, but there is a growing interest in using this alloy in the as-cast condition for large and complex-shaped parts [23].
The expected microstructure of the as-cast Cu-6wt%Al-2wt%Si after slow cooling consists of α, γ2, twin-like plates at α-γ2 grain boundaries, and intermetallic particles based on Fe-Si [3,24]. However, the evolution of the microstructure during different cooling rates, because of the decomposition of the high-temperature β phase, is yet poorly understood. Previous studies had concluded that either the β phase was retained at room temperature for fast cooling rates [25], or it was decomposed to a mixture of α + γ2 phases or α + κ phases [5].
The sequence of microstructural development during continuous cooling from near-solidus temperatures, as illustrated in Figure 1, reveals the following observations: At higher temperatures, the alloy consists of β (BCC) and α (FCC) phases, with the α phase displaying a Widmanstätten structure. As the temperature decreases, irregularly shaped Fe5Si3 particles nucleate. At even lower temperatures, the solubility of iron in the α phase is exceeded, leading to the formation of small, lamellar-shaped Fe3Si2 particles within the α phase. Further cooling transforms the β phase into γ2 [26].
The cast microstructure primarily features a duplex structure comprising two copper-rich phases, α (FCC), and γ2 (CPH), whose proportions depend on the alloy’s composition. The α grains contain fine precipitates of Fe3Si2 at their centers, while the γ2 grains are free from such precipitates. Along most of the α and γ2 grain boundaries, a fine lamellar structure is observed, consisting of plates with irregular shapes, with both α and γ2 phases containing Fe5Si3. Table 1 provides the chemical compositions, crystalline structures of the phases, and intermetallics present in the Silicon Aluminum Bronze alloy, highlighting the predominance of various microstructural morphologies [26].
In this context, here we studied the microstructure resulting from Cu-6wt%Al-2wt%Si alloy after an ascending unidirectional solidification process. Directional solidification allows different microstructures to be obtained in the length of the molten ingot, influencing the alloy properties. The effects of the manufacturing processes on the microstructure and properties of engineering materials have been highlighted in various studies [14,26,27]. Thermal parameters of solidification, as tip growth rate (VL) and cooling rate (TL), were correlated with hardness and microhardness values. Optical microscopy, scanning electron microcopy (SEM) images, and X-ray diffraction (XRD) were obtained from various positions in the ingot to investigate the microstructure evolution. To the best knowledge of the authors, there is no previous investigation published in the scientific literature investigating this specific alloy after ascending unidirectional solidification.

2. Materials and Methods

The CuAl6Si2 alloy was supplied by Termomecanica São Paulo S.A. as 66.5 mm diameter cylindrical bars. The chemical composition of the provided bars is shown in Table 2.
The directional solidification apparatus is fully described in references [1,4,13] and a schematic representation is shown in Figure 2. The temperature data were collected with K-type thermocouples located at distances of 4, 8, 12, 16, 26, and 35 mm from the cooling base and inserted about 30 mm into the 65 mm diameter ingot mold. The thermocouples used in the mold were thin, uncoated, and reached thermal equilibrium with the molten alloy before the cooling water was activated at the base of the solidification device. Their small size and high acquisition frequency ensured accurate measurements, even in regions associated with higher cooling rates. The complete directional solidification was made according to the following steps. Firstly, approximately 2 kg of the CuAl6Si2 bars was melted in a Salamander SIC AS2 graphite crucible using a muffle furnace at 1250 °C, which is above the alloy liquidus temperature of 1004 °C, and kept for 10 min for temperature homogenization. Then, the melt alloy was poured into the ingot mold in the unidirectional solidification apparatus, which was initially at 1100 °C. Finally, the solidification of the liquid metal inside the ingot started when the water jet with a flow rate of 18 L/min started cooling the base of the solidification apparatus.
The tip growth rate (VL) was calculated by determining the function P = f(t), which represents the relationship between the position of the thermocouple (P) and the time interval between the onset of alloy cooling and the moment the liquidus temperature (tL) is detected by each thermocouple. In this context, VL corresponds to the velocity at which the solidification front moves past each thermocouple.
The cooling rate (TR) at each thermocouple position was experimentally determined by evaluating the temperature change (ΔT) over a given time interval (Δt) before and after reaching the liquidus temperature: TR = ΔT/Δt. For this study, a temperature interval of ΔT = ±5 °C, around each thermocouple position P, was used to calculate the cooling rate. Finally, the thermal gradient (GL) was calculated by GL = TR/VL for each P.
The microstructure characterization was performed by optical microscopy (OM), scanning electron microscopy (SEM), and X-ray diffraction (XRD). For XRD analysis, Cu Kα radiation was used at 40 KV and 100 mA, with a scanning angle (2θ) of 30° to 90° and a scanning speed of 2°/min. For metallographic analysis, samples of cross-sections of the molten ingot were selected. The analyzed surfaces of the samples were selected from different positions (P) in relation to the heat exchange surface. These distances were 4, 8, 12, 16, 26, and 35 mm. Scanning electron microscopy (SEM) was performed using JSM-6010LA equipment for checking the phases and intermetallics morphology. The mechanical characteristics were evaluated by Brinell hardness according to ASTM E10 [28], using a load of 62.5 kgf and a sphere 2.5 mm in diameter. The hardness test was performed at five points of each position on the thermocouple. The Vickers microhardness was also measured according to ASTM E92 [29] at five different points of each thermocouple position (P) using a force of 1 kgf and dwell time of 15 s. An additional hardness and microhardness measurement was performed at P = 53 mm to verify the hardness trend at larger distances beyond the region where thermal variables were collected.
Empirical power laws were fitted using Origin software 10.0 to describe the dependence of all thermal variables and hardness measurements as a function of position P. This set of equations can be subsequently used for process design, as well as for predicting hardness and microstructure.

Samples Preparation

The specimens were prepared as illustrated in Figure 3. After solidification, the ingot was cut into two parts using wire EDM for analysis. The first half of the material underwent chemical element analysis via X-ray fluorescence spectroscopy to determine the composition. The second half of the ingot was sectioned longitudinally also using wire EDM, resulting in samples with a cross-sectional area of 1 cm2 and approximately 100 mm in length. These samples were then cut transversely at the thermocouple positions and mounted in bakelite for Vickers microhardness and hardness testing.
For microstructural analysis using optical and scanning electron microscopy, each sample was ground with abrasive papers of various grit sizes and polished with 3–6 μm diamond paste. The etchant used to reveal the microstructure consisted of a solution of 10.7% HCl, 3.4% FeCl3, and 85.9% distilled water, with a reaction time of 25 s [30].

3. Results

The composition of the ingot after unidirectional solidification is presented in Table 3. When compared to the reference standard, the results confirm that the composition remains within the parameters of the Def Stan 02-834 standard. This analysis verifies that no contamination occurred during the unidirectional solidification process and ensures that there was no loss of alloying elements, thereby confirming that the material still meets the required specifications of the standard [2].

Solidification Thermal Variables

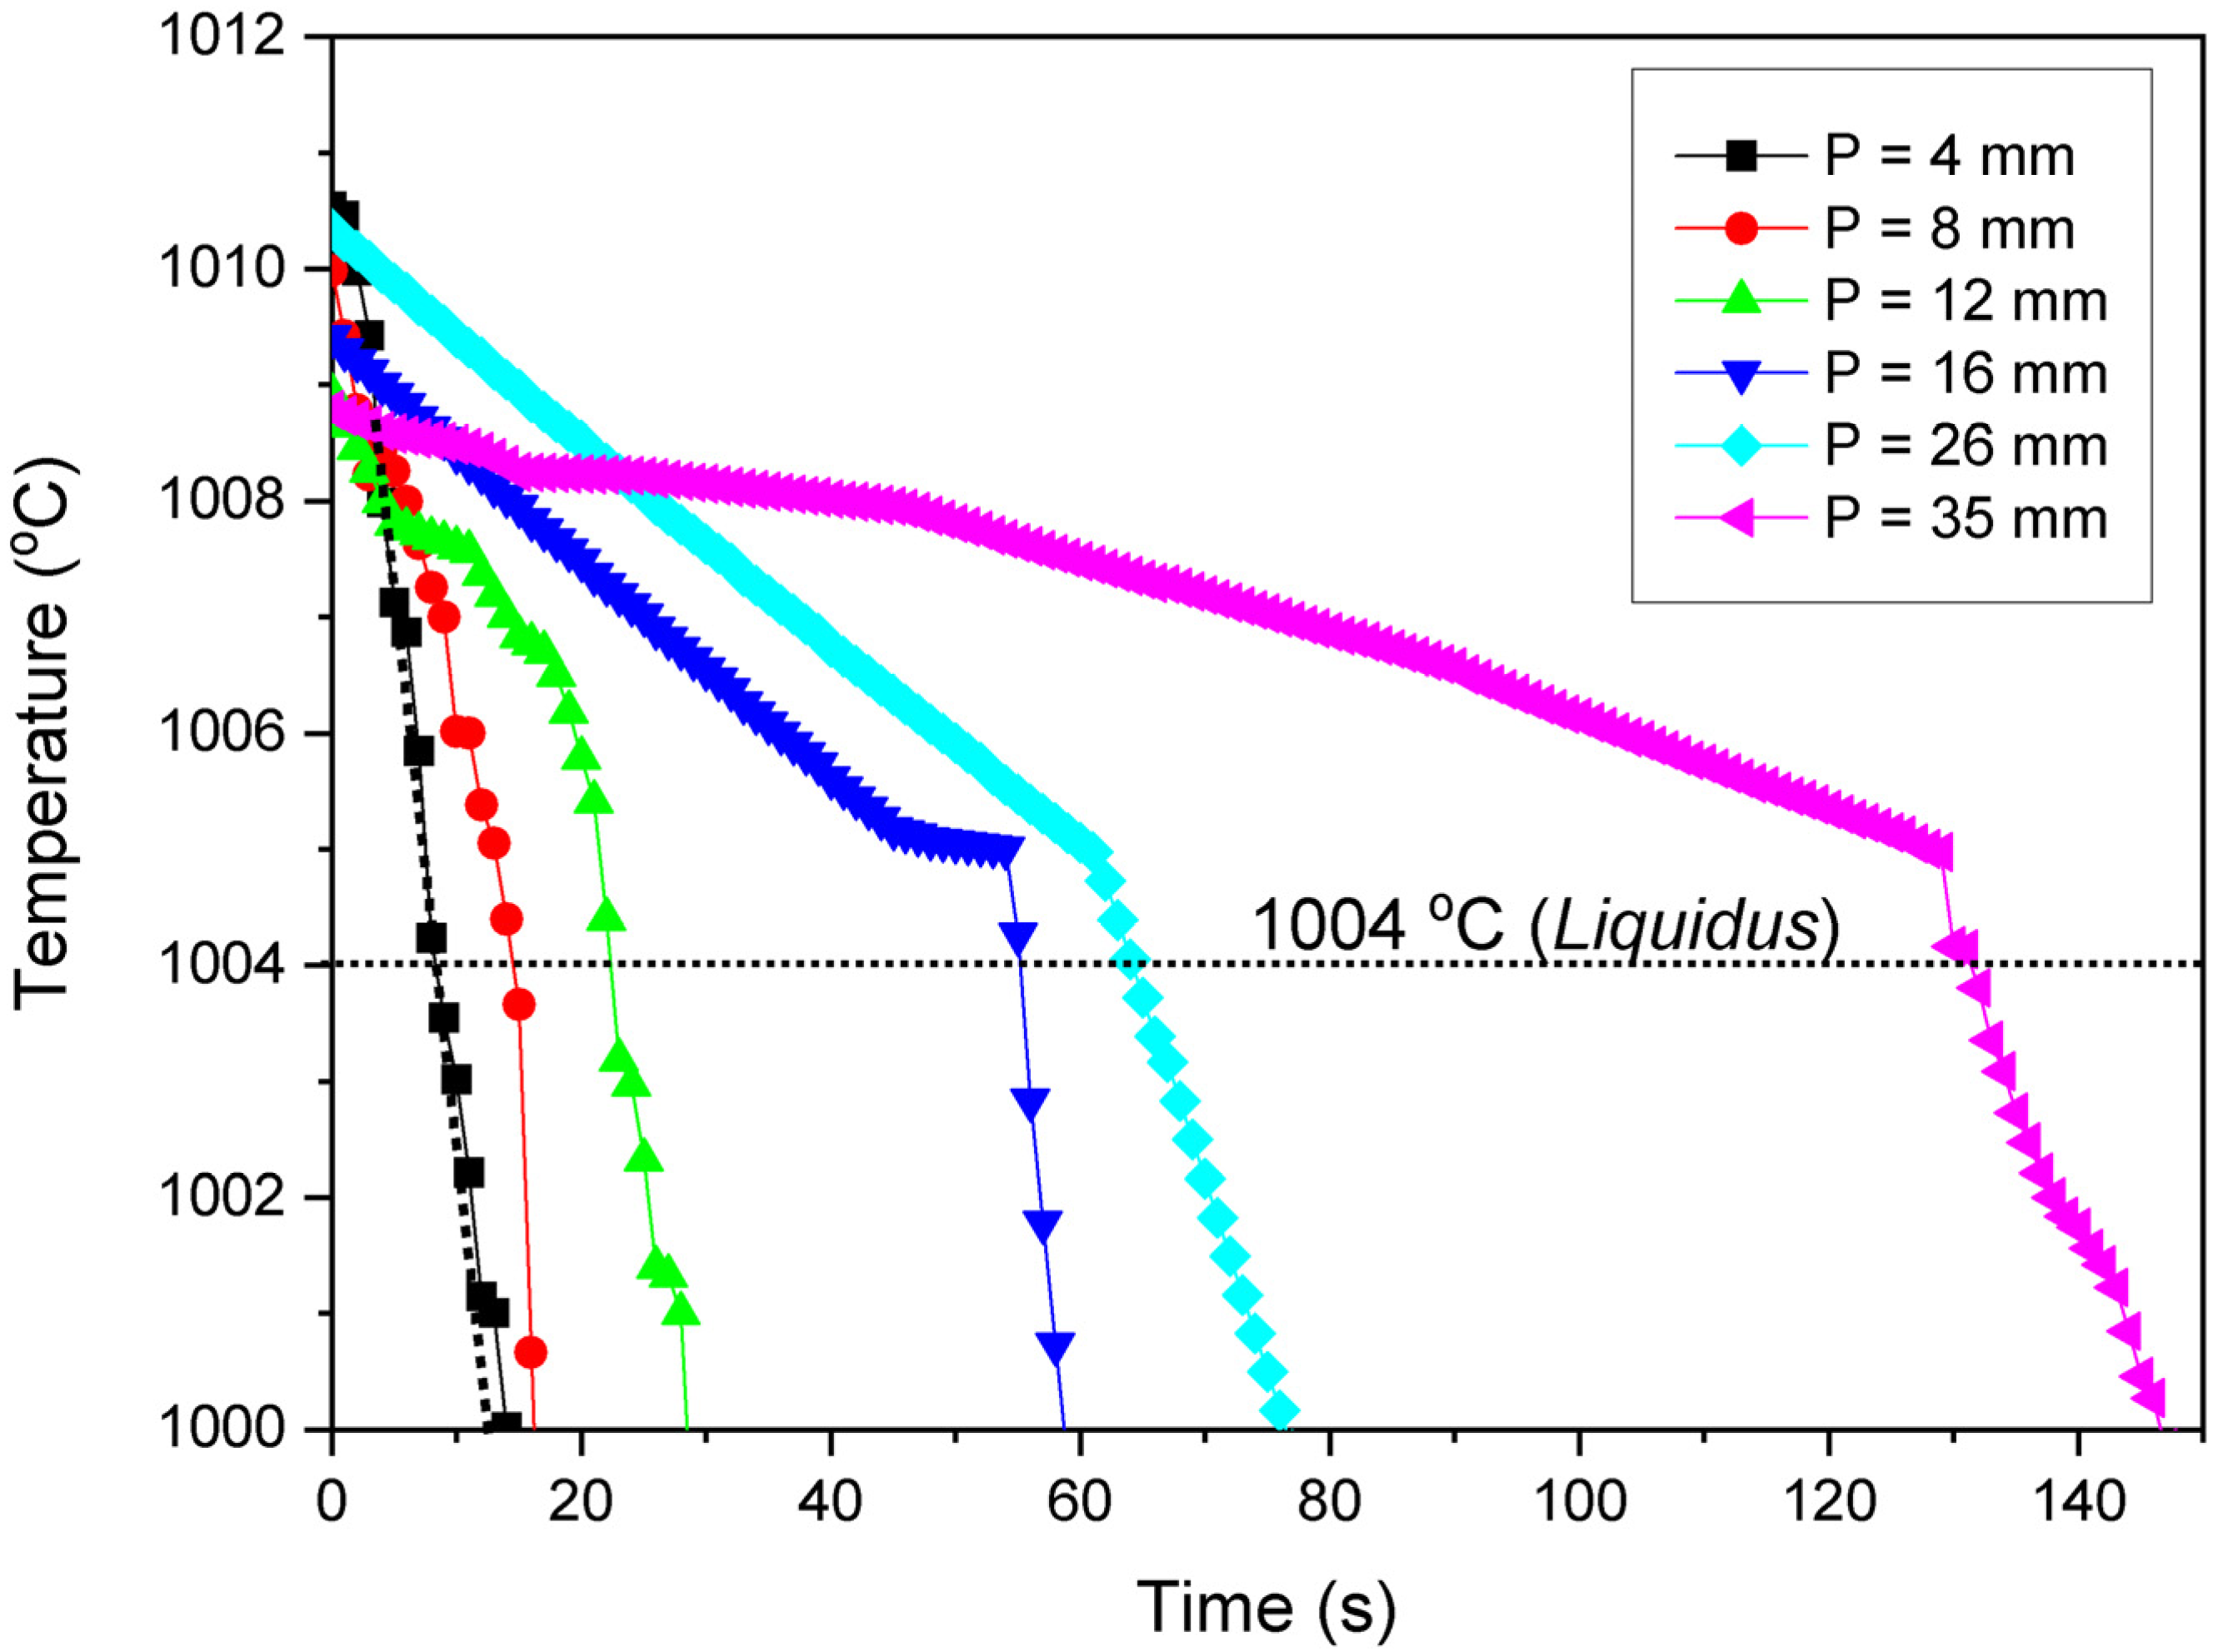
Figure 4 shows the thermal profiles (temperature vs. time) obtained at different positions during the directional solidification. Each curve represents a thermocouple reading inserted along the length of the solidification apparatus, starting from the cooled bottom. These thermal profiles were utilized for computing the solidification thermal characteristics related to the displacement of the liquidus isotherm as mentioned earlier.
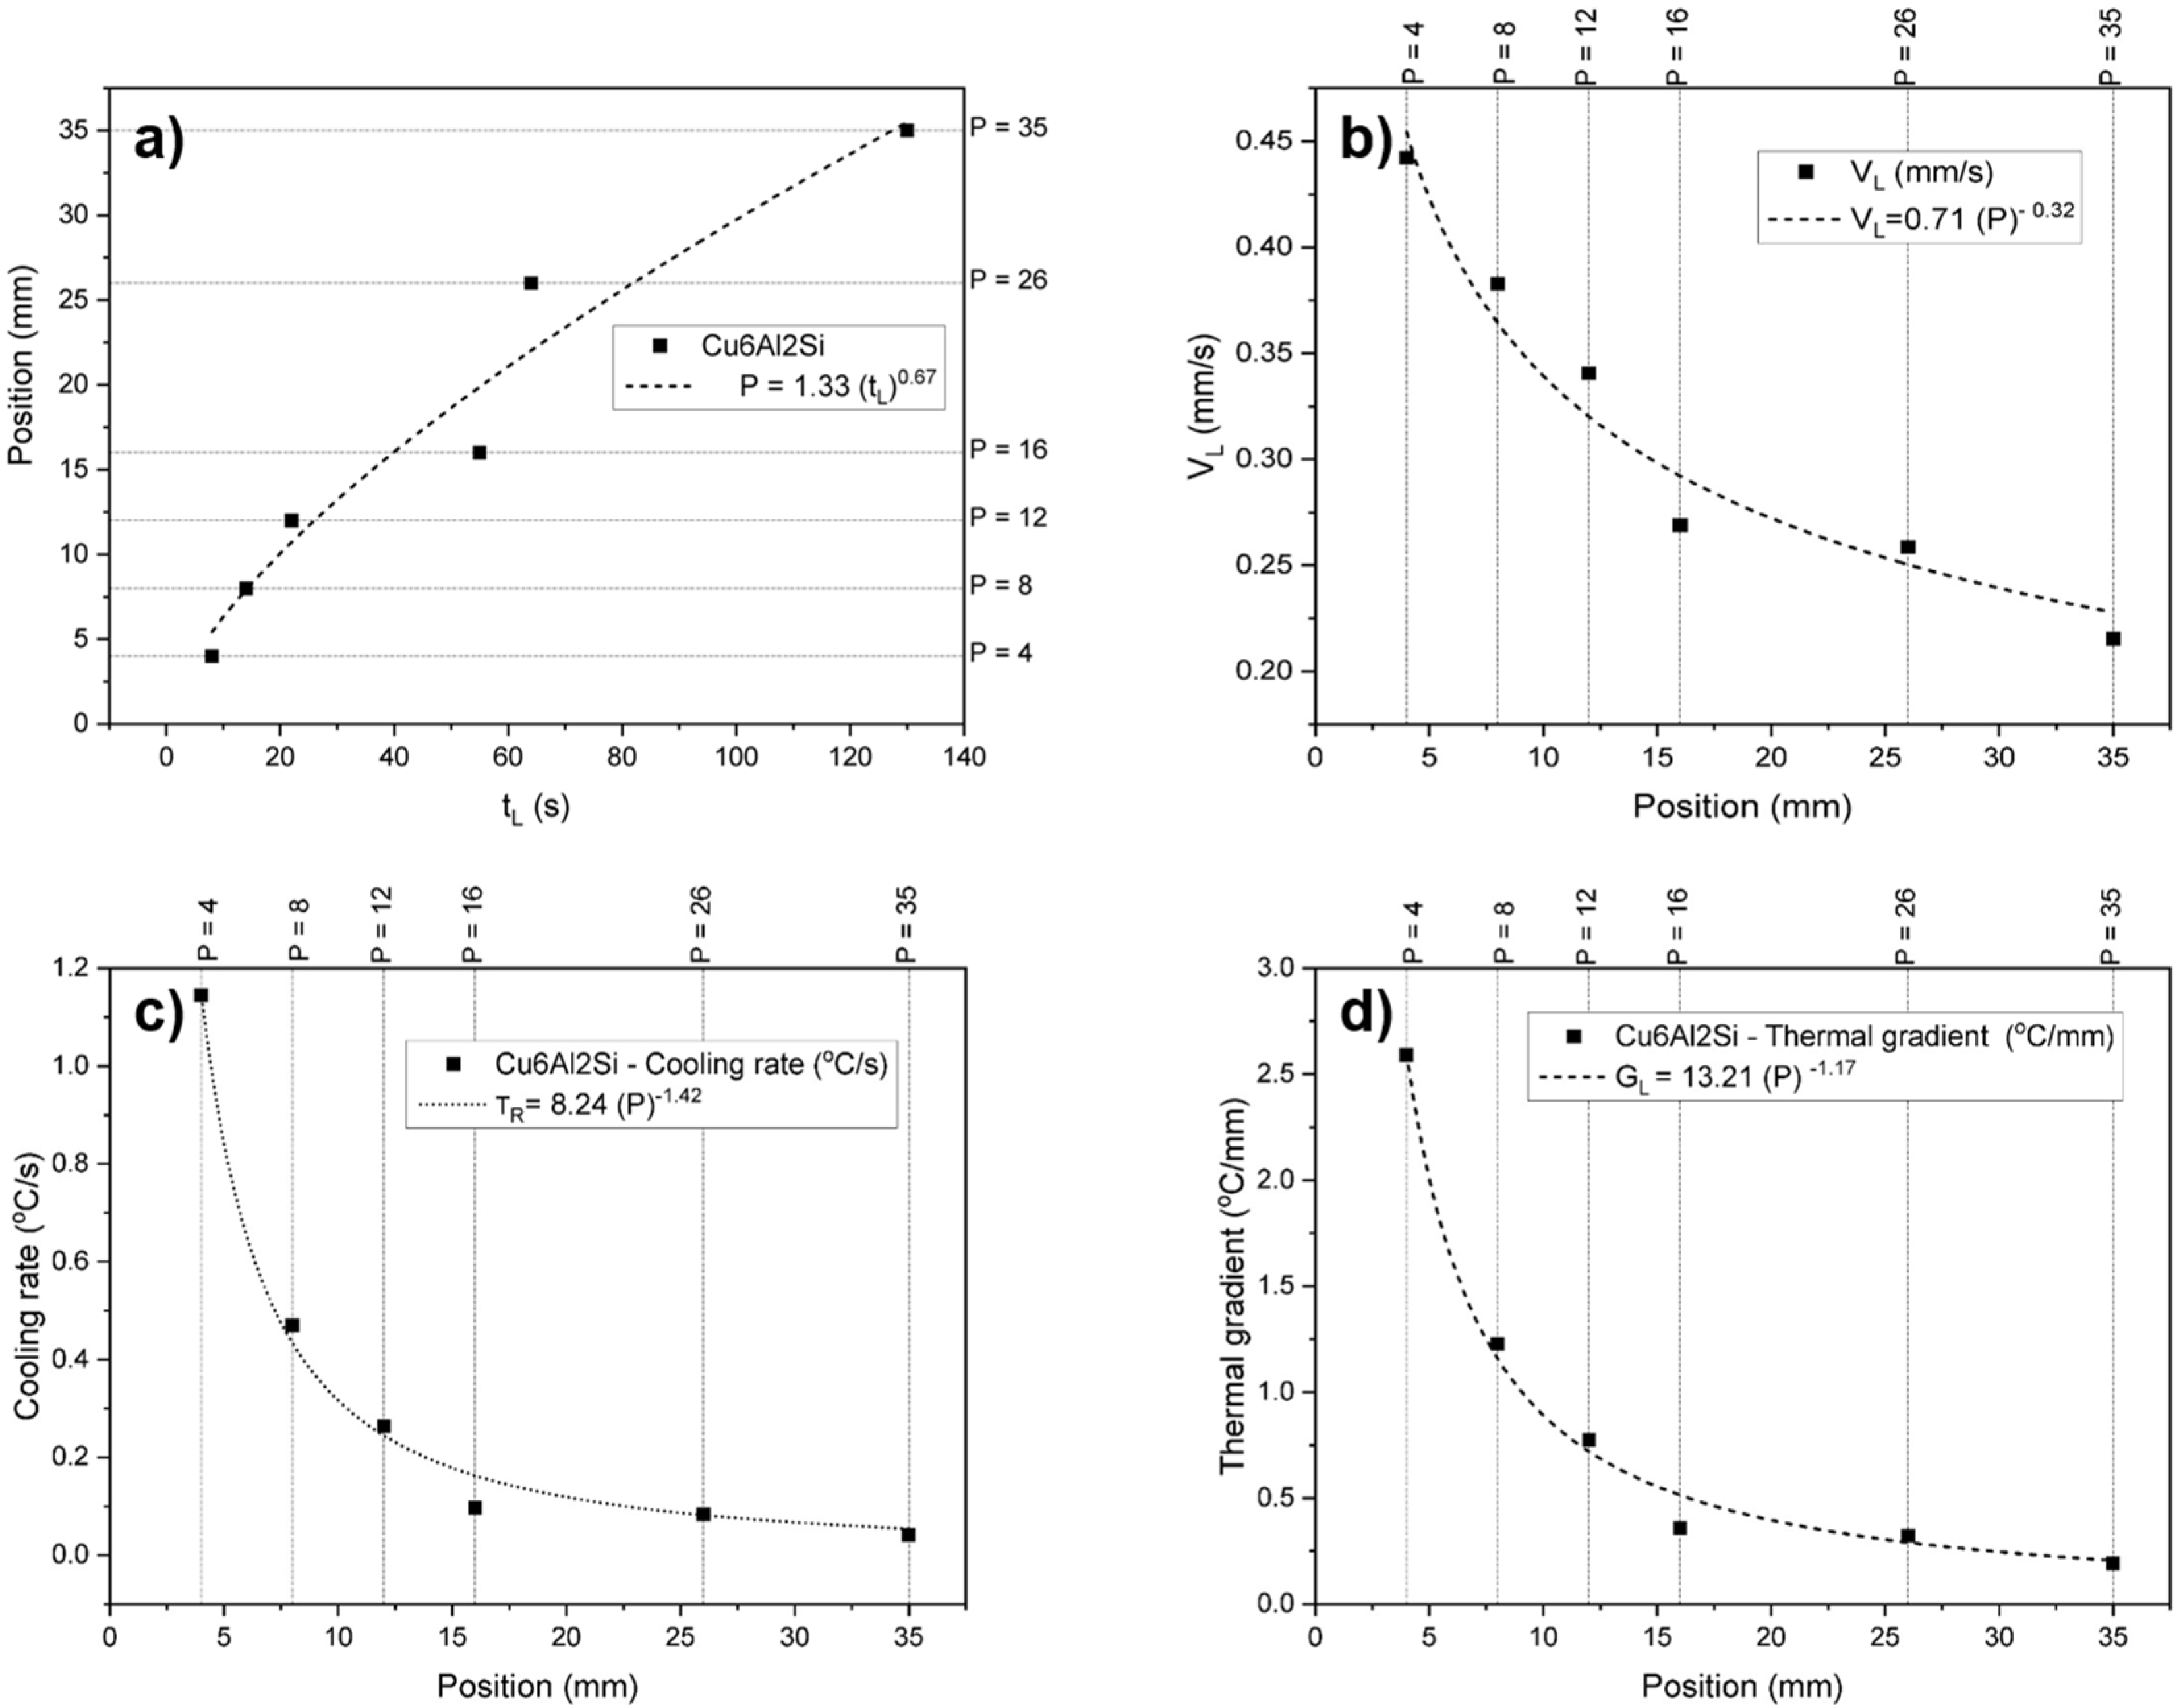
Figure 5 presents the thermal parameters tL, VL, TR, and GL, experimentally obtained as a function of the distance to the heat exchange surface (P). Also, power functions were fitted for all these parameters with an R-square higher than 0.9. As expected, all the thermal parameters decreased during the directional solidification for higher P values, as shown in Figure 5a–d. This decrease can be rationalized by the increasing thermal resistance that progressively occurs along the solidification in the upward vertical direction, from the cooling base to the top [4]. The effect of this decrement is reversely translated to the length scale of the microstructural parameters, such as grain and precipitate size, which are presented in the next sections.
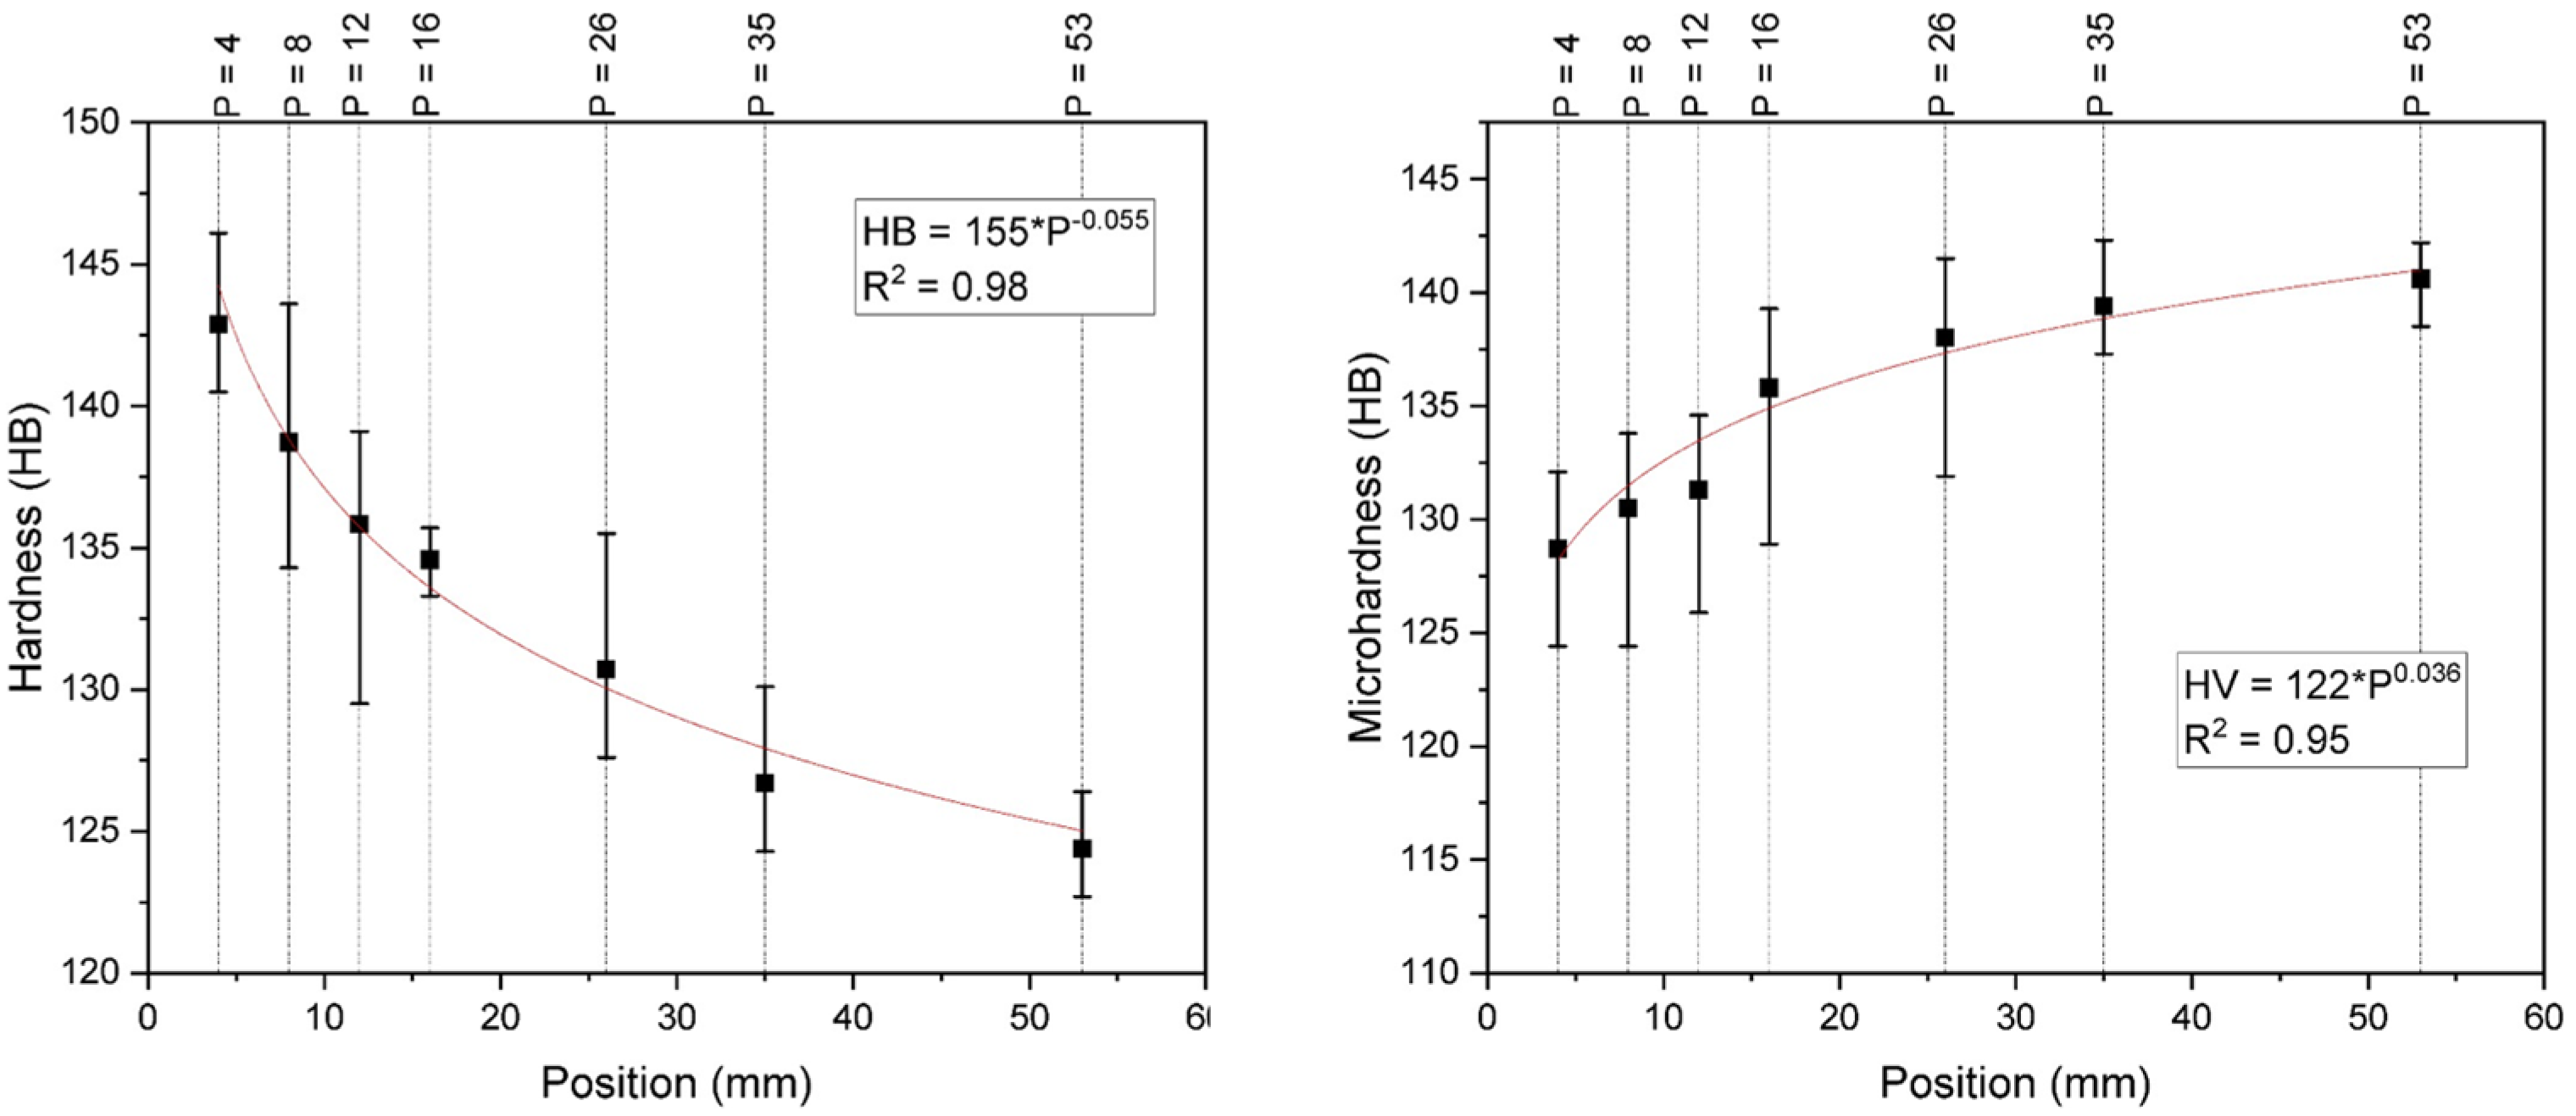
Hardness and microhardness measurements are presented in Figure 6. The average macrohardness measurements (HB) decrease as the distance from the heat extraction surface increases. In contrast, the average microhardness measurements (HV) show the opposite trend. A similar result was observed in reference [4], and it can be rationalized as follows.
When analyzing the error bars presented in Figure 6 left, it is evident that this decrease in macrohardness is statistically significant. Except for the points at P = 12 and P = 16, all other points have hardness intervals distinct from the previous ones. Conversely, for the microhardness values, the error bars indicate no statistically significant increase for positions between 4 and 16 mm. However, a slightly more pronounced increase is observed at more distant positions, between 26 and 53 mm, where both positions show almost the same average and error values.
It is important to note that the Brinell method is a macroscopic hardness evaluation technique, where the indentation occurs over a relatively large area (approximately 2 mm in this case), reflecting the average behavior of a broad region predominantly composed of the α- and β-phase matrix, with possible contributions from precipitates. Therefore, the decrease in Brinell hardness with increasing distance can be attributed to the presence of a coarser matrix microstructure with lower hardness, characteristic of regions with slower cooling rates.
For microhardness, this behavior can be explained by the fact that the Vickers microhardness measurement results from a microscopic indentation (approximately 100 µm), reflecting the local hardness of the region where the indentation was made. Since there is a higher volumetric fraction of hard secondary phases (κ and γ2) in regions farther from the heat extraction base, it is likely that the microhardness measurements are influenced by these precipitates in more distant regions.
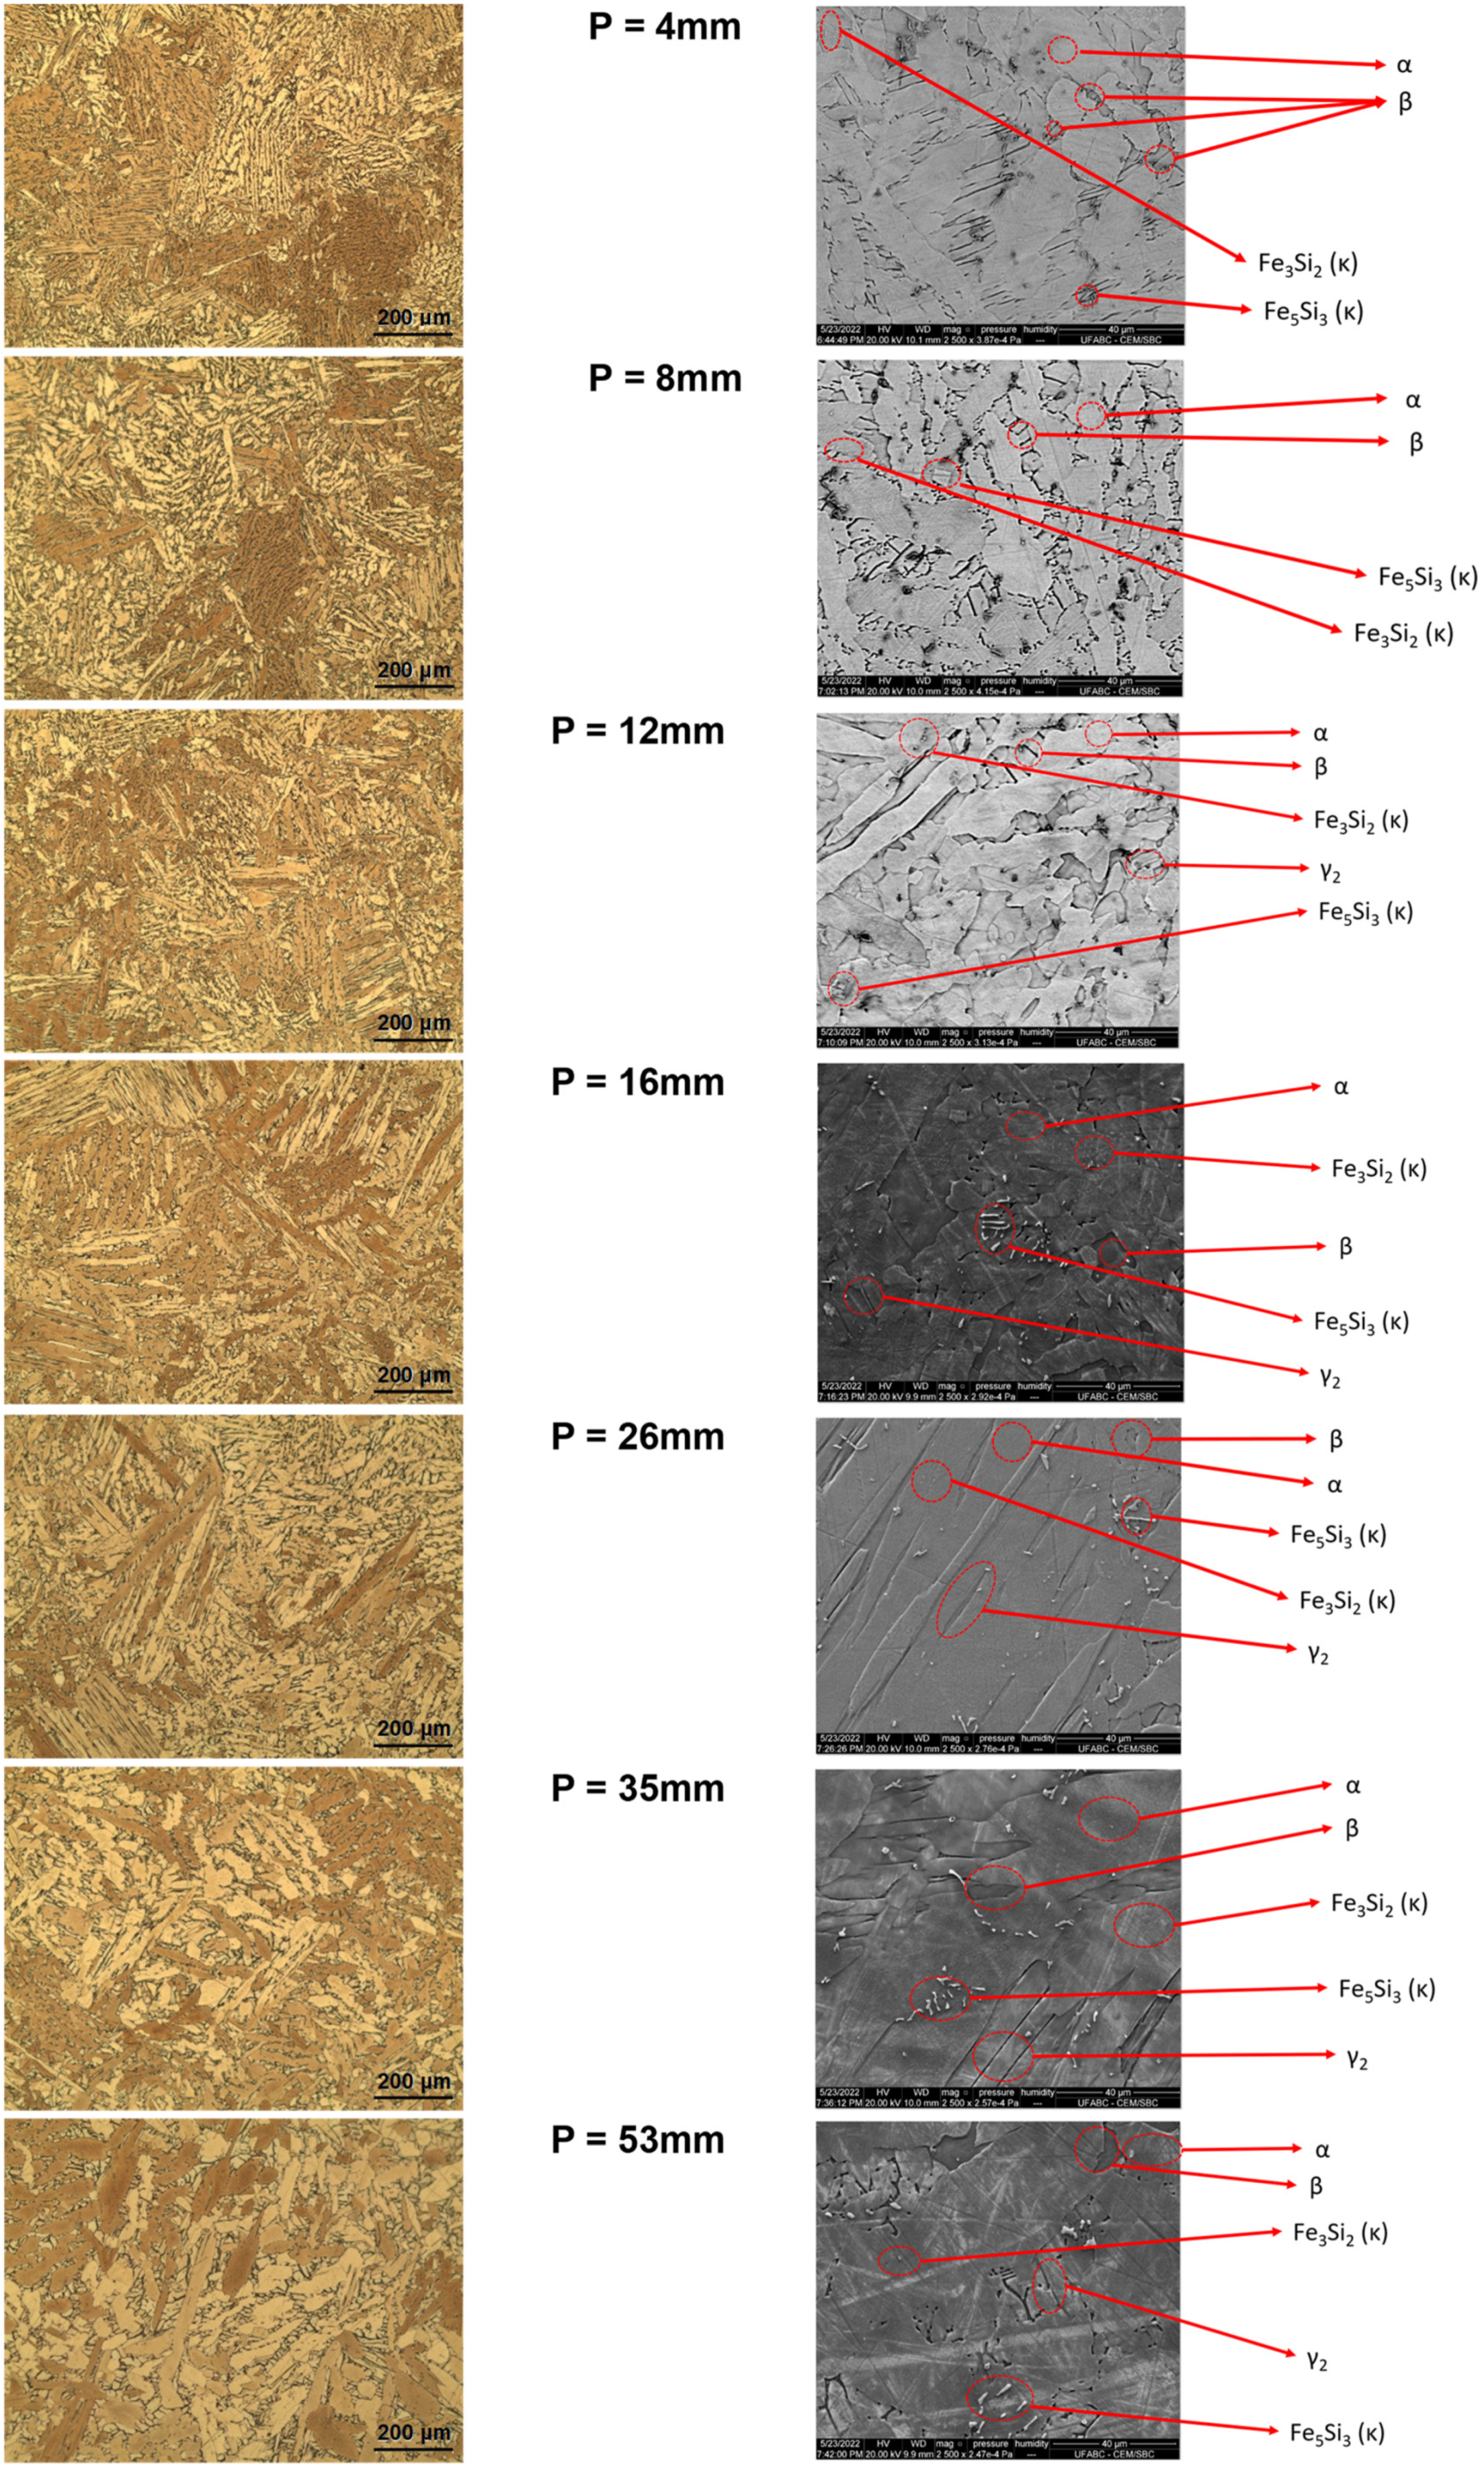
Figure 7 micrographs show structural changes with distance from the cooling base. The left-hand side shows the optical microstructural analysis, and the right-hand side shows the SEM characterization. For P = 4 mm, the microstructure shows equiaxed grains with low Widmanstätten structure formation, with a 247 °C/min cooling rate (see Table 4) and a noticeable β phase and possible Fe5Si3 intermetallic, with α + γ2 phases at 61% volume fraction. This position had 142.9 HB with low intermetallic fraction due to the short diffusion time. The last evaluated position (P = 53 mm) had the lowest cooling rate (3 °C/min) due to distance from the base, showing increased Widmanstätten structure and equiaxed grains, with α + γ2 phases at 94% volume fraction. SEM characterization of the 53 mm position showed a discrete β phase with 126.7 HB. Intermetallic fractions increased as expected, with more Widmanstätten structure at this position.
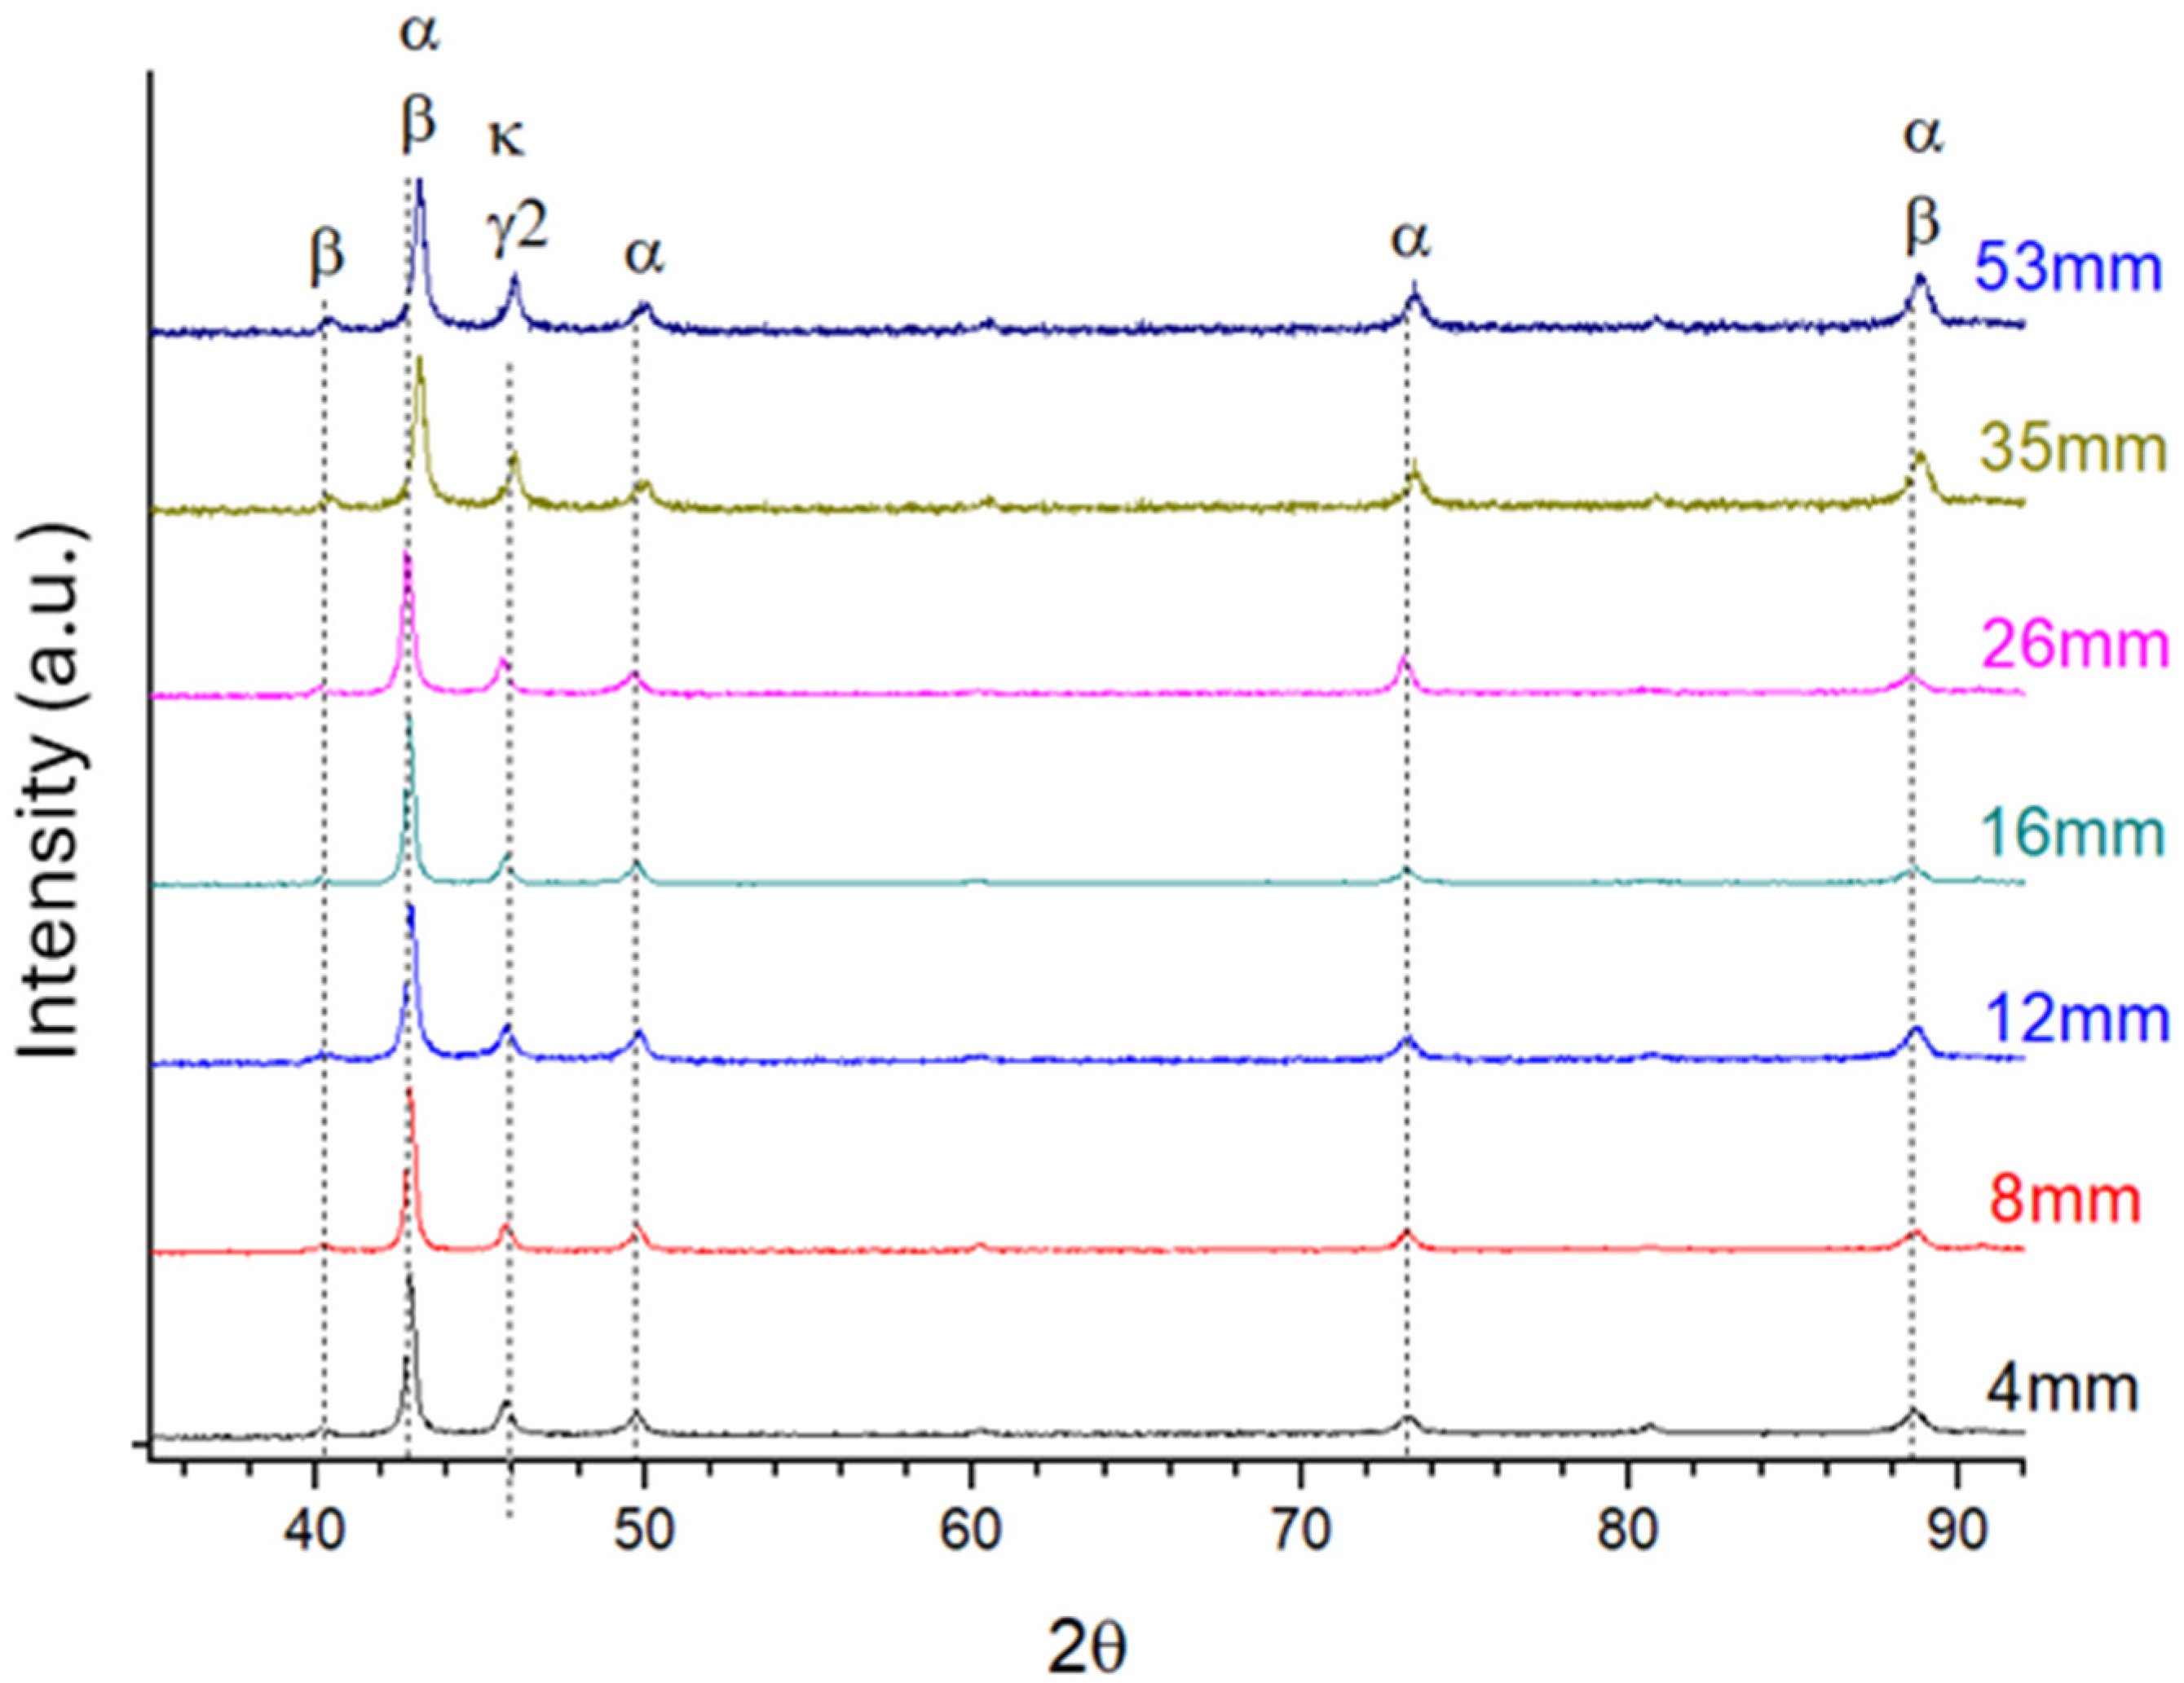
Figure 8 shows XRD diffractograms from different solidification positions, indicating the presence of the β and α phases, as well as the κ and γ2 precipitates. Peaks attributed to the α phase at 73°, and to κ and γ2 at 46°, show increased intensity at higher P values, suggesting higher fractions of these phases in regions with slower cooling rates. According to the phase diagram, the stable phases at low temperatures are α, κ, and γ2, which are expected in conditions with low cooling rates and longer solidification times.
For all positions, peaks attributed to the α, β, κ, and γ2 phases were observed. Additionally, small changes in the relative intensities of the peaks for the different positions were noted. It is worth mentioning that at peaks of approximately 43° and 89°, there is an overlap of the α and β phases, making it difficult to quantify these phases through this XRD analysis, for the same alloy family [8,31,32] also reported similar XRD patterns to those presented here. The results of [27,33] evaluated a Nickel Aluminum Bronze alloy after induction casting and correlated the X-ray diffraction analysis with hardness and optical microscopy. After the correlations, the martensitic β phase was obtained after casting and confirmed by X-ray analysis at the 43° angle, demonstrating the β phase and dispersed acicular precipitates that may correspond to the γ2 phase (46°), as well as higher hardness values at these points.
An increase in the intensity of the peaks attributed to the α phase at approximately 73° and to the κ and γ2 phases at approximately 46° was also observed. This indicates that the volumetric fraction of these phases should increase for positions where cooling is slower. Analyzing the phase diagram, it is possible to observe that the thermodynamically stable phases after cooling are α, κ, and γ2 phases. It is expected that in cases of low cooling rates, where solidification had longer times to reach thermodynamic equilibrium conditions, these will be present. The presence of κ precipitates that appear in positions farther from the base was also found by [33,34]. Reference [34] studied the Aluminum Bronze alloy after milling with the insertion of niobium carbide and its respective change in microstructure and correlation with X-ray diffraction analyses. After verification, it was possible to identify intermetallic κ at angles of 46°, 70°, and 83° and variation in relative intensity according to the exposure time of the heat treatment and rapid cooling.
It is expected that these peaks attributed to the metastable β phase will have their relative intensity decrease with the increase in distance, indicating that their volumetric fraction decreases for slower cooling rates. This same behavior was observed by [33,34] in studies for the Nickel Aluminum Bronze alloy. The authors showed a variation in the relative intensity of the metastable β phase, obtained after heating and rapid cooling for aerospace application in the TQ-30 treatment. After this treatment and identification of the β phase at 43°, there is evidence of increased mechanical strength and hardness of the material.
Additionally, it is possible to note that there is a shift of peaks to higher angles for the more distant positions (35 and 53 mm) when compared to the peaks of the positions near the heat extraction point. Considering Bragg’s law, we know that shifts to the right (to higher angles) indicate a decrease in the interplanar distance of this crystal. In the specific case of this alloy, this shift can be explained by two factors: (i) the greater amount of micro-deformations in the crystalline lattice for the rapidly cooled positions, causing them to have a larger interplanar spacing, and thus, lower 2θ positions (more to the left); (ii) the decrease of alloying elements in solid solution in copper for the more distant positions, resulting in a smaller unit cell. This second factor is also corroborated by the greater intensity of the peaks attributed to the κ and γ2 precipitates. Since these precipitates are present in larger quantities in these slower cooling positions, they will consume alloying elements (Al, Si, and Fe) that were previously in solid solution in copper, expanding its unit cell. Ref. [32] verified this by X-ray diffraction for the Nickel Aluminum Bronze alloy, a formation of the metastable β phase at the 43° angle and the α phase at the 73° angle, corroborating the results obtained in this study. The α phase and κ intermetallics were obtained near the fusion bubble and verified, finally, that their performance was satisfactory compared to the other phases found.
Thermal solidification variables, hardness measurements, and phase distribution are summarized in Table 4.

4. Conclusions

The unidirectional solidification strategy investigated here did not change the chemical composition of the investigated alloy.
The solidification results indicate that positions closer to the heat extraction base exhibit higher liquidus isotherm displacement speeds and cooling rates, leading to higher hardness values (HB). This is attributed to the rapid cooling, more refined microstructure, and the presence of the β phase, as predicted by the crystallization model.
In contrast, microhardness measurements (HV) at positions closer to the cooling base show lower average values compared to those at more distant positions. This can be explained by the higher volume fraction of intermetallic precipitates found in regions with lower cooling rates.
After SEM analysis, a change in the morphology of the phases was observed in the positions farthest from the base due to the difference in the cooling rate; these results were reaffirmed by XRD.
Thermal variable analysis showed increased α + γ2 phase volume fraction with distance from the graphite base, as α phase nucleates at lower cooling rates, with β phase dominating at high cooling rates, resulting in higher mechanical strength due to BCC structure and more refined grain size.

Author Contributions

Conceptualization, P.H.T.d.N. and V.T.d.S.; methodology, P.H.T.d.N., V.T.d.S., R.T. and M.S.N.; software, R.T., F.G.L. and M.S.N.; validation, A.d.A.M.F., G.A.d.S., R.C.C. and A.A.C.; formal analysis, P.H.T.d.N. and M.S.N.; investigation, P.H.T.d.N., M.R.d.S. and V.T.d.S.; resources, R.d.L., M.R.d.S., A.d.A.M.F. and R.C.C.; data curation, P.H.T.d.N., A.d.A.M.F., F.G.L. and V.T.d.S.; writing—original draft preparation, P.H.T.d.N., A.d.A.M.F. and G.A.d.S.; writing—review and editing, V.T.d.S., A.d.A.M.F., M.R.d.S., F.G.L., R.d.L., A.A.C. and G.A.d.S.; visualization, A.d.A.M.F., F.G.L., R.C.C. and R.d.L.; supervision, A.d.A.M.F., M.R.d.S., A.A.C. and G.A.d.S.; project administration, P.H.T.d.N., A.d.A.M.F., G.A.d.S. and R.C.C. All authors have read and agreed to the published version of the manuscript.

Funding

This research received no external funding.

Data Availability Statement

The original contributions presented in the study are included in the article, further inquiries can be directed to the corresponding author.

Acknowledgments

The authors thank Termomecanica São Paulo S.A. for material donations and laboratory access, CAPES and PPGCEM of Federal University of ABC for research infrastructure and SEM image support, and the Instituto Federal de São Paulo (IFSP) and Faculdade de Tecnologia do Estado de São Paulo (FATEC) for research support.

Conflicts of Interest

The authors declare no conflicts of interest.

References

  1. Nascimento, M.S.; Franco, A.T.R.; Frajuca, C.; Nakamoto, F.Y.; Santos, G.A.; Couto, A.A. An Experimental Study of the Solidification Thermal Parameters Influence upon Microstructure and Mechanical Properties of Al-Si-Cu Alloys. Mater. Res. 2018, 21, e20170864. [Google Scholar] [CrossRef]
  2. DEF STAN 02-834; Defence Standard 02-834 (NES 834). Ministry of Defence: Glasgow, UK, 2000.
  3. Harab, M.A.; Kareem, A.H. Investigation Ni and Si Nano-addition effect on the microstructure and hardness of aluminum bronze. Mater. Today Proc. 2021, 45, 5005–5009. [Google Scholar] [CrossRef]
  4. Nascimento, M.S.; Santos, G.A.; Teram, R.; Santos, V.T.; Silva, M.R.; Couto, A.A. Effects of Thermal Variables of Solidification on the Microstructure, Hardness, and Microhardness of Cu-Al-Ni-Fe Alloys. Materials 2019, 12, 1267. [Google Scholar] [CrossRef] [PubMed]
  5. Brezina, P. Heat treatment of complex aluminum bronzes. Int. Met. Rev. 1982, 27, 77–120. [Google Scholar] [CrossRef]
  6. Cruz, R.A.; Santos, G.A.; Nascimento, M.S.; Frajuca, C.; Nakamoto, F.Y.; Silva, M.R.; Santos, V.T.; Batalha, G.F.; Couto, A.A. Microstructural Characterization and Mathematical Modeling for Determination of Volume Fraction of Eutectoid Mixture of the Cu-8.5wt% Sn Alloy Obtained by Unidirectional Upward Solidification. Mater. Sci. Forum 2020, 1012, 302–307. [Google Scholar] [CrossRef]
  7. Faria, J.; Paula, A.; Silva, C.; Kakitani, R.; Barros, A.; Garcia, A.; Brito, C.; Cheung, N. Fe-Containing Al-Based Alloys: Relationship between Microstructural Evolution and Hardness in an Al-Ni-Fe Alloy. Metals 2023, 13, 1980. [Google Scholar] [CrossRef]
  8. Cenoz, I. Metallography of aluminium bronze alloy as cast in permanent iron die. Metall. Mater. Eng. 2010, 16, 115–122. [Google Scholar]
  9. Vaidyanath, L.R. The Manufacture of Aluminium-Bronze Casting; Indian Copper Information Center: Kolkata, India, 1968; Volume 13A. [Google Scholar]
  10. Copper Development Association. Aluminum Bronze Alloys for Industry; CDA: Hemel Hempstead, UK, 1986. [Google Scholar]
  11. Caveagna, L.H. Abcobre. Copper Applications Gain Space in the Aerospace Industry. 2021. Available online: https://abcobre.org.br/aplicacoes-de-cobre-ganham-espaco-na-industria-aeroespacial (accessed on 19 April 2024).
  12. Meigh, H.J. Cast and Wrought Aluminum Bronzes Properties, Processes and Structure, 1st ed.; CRC Press: Hants, UK, 2000; ISBN 978-1861250629. [Google Scholar]
  13. Santos, G.A.; Alves, T.L.; Teram, R.; Cruz, R.A.; Nascimento, M.S.; Santos, V.T.; Silva, M.R.; Couto, A.A.; Machado, I.F. Effects of directional solidification on hardness and microstructure in Al–3wt.%Cu–1wt.%Li alloy. In IOP Conference Series: Materials Science and Engineering; IOP Publishing: Bristol, UK, 2022. [Google Scholar] [CrossRef]
  14. Dias, A.N.O.; Silva, A.; Rodrigues, C.A.; Melo, M.L.N.M.; Rodrigues, G.; Silva, G. Effect of High Energy Milling Time of the Aluminum Bronze Alloy Obtained by Powder Metallurgy with Niobium Carbide Addition. Mater. Res. 2017, 20, 747–754. [Google Scholar] [CrossRef]
  15. Alfaia, M.A.O.; Oliveira, R.; Lima, T.S.; Mariani, F.E.; Casteletti, L.C.; Cheung, N.; Garcia, A. Effects of cooling rate and microstructure scale on wear resistance of unidirectionally solidified Al-3.2wt.%Bi-(1; 3) wt.%Pb alloys. Mater. Today Commun. 2020, 25, 101659. [Google Scholar] [CrossRef]
  16. Kakitani, R.; Cruz, C.B.; Lima, T.S.; Brito, C.; Garcia, A.; Cheung, N. Transient Directional Solidification of a Eutectic Al–Si–Ni Alloy: Macrostructure, Microstructure, Dendritic Growth and Hardness. Materialia 2019, 7, 100358. [Google Scholar] [CrossRef]
  17. Richardson, I. Guide to Nickel Aluminum Bronze for Engineers; Copper Development Association: New York, NY, USA, 2016. [Google Scholar]
  18. Callister, W.D.; Rethwisch, D.G. Materials Science and Engineering: An Introduction, 9th ed.; John Wiley & Sons: New York, NY, USA, 2013; p. 209. [Google Scholar]
  19. Abbaschian, R.; Abbaschian, L.; Reed-Hill, R.E. Physical Metallurgy Principles, 4th ed.; Cengage Learning: Independence, KY, USA, 2008. [Google Scholar]
  20. Obara, J.T.; Minei, R.O.; Kakitani, R.; Spinelli, J.E.; Garcia, A.; Cheung, N. Solidification microstructure and mechanical properties of an Al-11wt%Si alloy modified with Nb and Sb. J. Phys. Chem. Solids 2023, 181, 111521. [Google Scholar] [CrossRef]
  21. Elesbão, D.S.G.; Kakitani, R.; Cheung, N.; Garcia, A.; Barcellos, V.K.; Costa, E.M.; Santos, C.A. Influence of Cu and Cr contents on the solidification path and microstructure formation of hypoeutectic as-cast Al–Cu–Cr alloys. J. Therm. Anal. Calorim. 2023, 148, 9403–9421. [Google Scholar] [CrossRef]
  22. ASTM B-150; Standard Specification for Aluminum Bronze Rod, Bar, and Shapes. ASTM International: West Conshohocken, PA, USA, 2019.
  23. ABCOBRE, Brazilian Copper Yearbook, São Paulo, Brazil. 2022. Available online: http://abcobre.org.br/wp-content/uploads/2022/06/Anuario-do-Cobre-2022.pdf (accessed on 7 April 2024).
  24. Rodrigues, A.V.; Kakitani, R.; Silva, C.; Giovanetti, L.; Dias, M.; Henein, H.; Garcia, A.; Cheung, N. Influence of Minor Additions of Be on the Eutectic Modification of an Al-33wt.%Cu Alloy Solidified under Transient Conditions. Metals 2023, 13, 94. [Google Scholar] [CrossRef]
  25. Hasan, F.; Jahanafrooz, A.; Lorimer, G.W.; Ridley, N. The morphology, crystallography, and chemistry of phases in as-cast nickel-aluminum bronze. Metall. Trans. 1982, 13, 1337–1345. [Google Scholar] [CrossRef]
  26. Iqbal, J.; Ahmed, F.; Hasan, F. Development of Microstructure in Silicon-Aluminum-Bronze. Pak. J. Eng. Appl. Sci. 2008, 3, 47–53. [Google Scholar]
  27. Garcia, A. Solidificação: Fundamentos e Aplicações; Editora da Universidade Estadual de Campinas Unicamp: Campinas, Brazil, 2007. [Google Scholar]
  28. ASTM E-10; Standard Test Method for Brinell Hardness of Metallic Materials. ASTM International: West Conshohocken, PA, USA, 2023.
  29. ASTM E-92; Standard Test Methods for Vickers Hardness and Knoop Hardness of Metallic Materials. ASTM International: West Conshohocken, PA, USA, 2023.
  30. ASTM E-407; Standard Practice for Microetching Metals and Alloys. ASTM International: West Conshohocken, PA, USA, 2023.
  31. Zhao, L.; Li, K.; Yao, J.; Yuan, Y.; Du, B. The Laser Deposited Nickel-Aluminum Bronze Coatings on SUS630 Stainless Steel and Its Corrosion Resistance in 3.5 wt.% NaCl Solution. Metals 2022, 12, 781. [Google Scholar] [CrossRef]
  32. Zhao, J.H.; Li, P.; Tang, Q.; Zhang, Y.Q.; He, J.S.; He, K. Influence of Metal-Coated Graphite Powders on Microstructure and Properties of the Bronze-Matrix/Graphite Composites. J. Mater. Eng. Perform. 2017, 26, 792–801. [Google Scholar] [CrossRef]
  33. Dias, M.; Brito, C.; Bertelli, F.; Rocha, O.L.; Garcia, A. Interconnection of thermal parameters, microstructure, macrosegregation and microhardness of unidirectionally solidified Zn-rich Zn–Ag peritectic alloys. Mater. Des. 2014, 63, 848–855. [Google Scholar] [CrossRef]
  34. Lv, Y.; Wang, L.; Xu, X.; Lu, W. Effect of Post Heat Treatment on the Microstructure and Microhardness of Friction Stir Processed NiAl Bronze (NAB) Alloy. Metals 2015, 5, 1695–1703. [Google Scholar] [CrossRef]
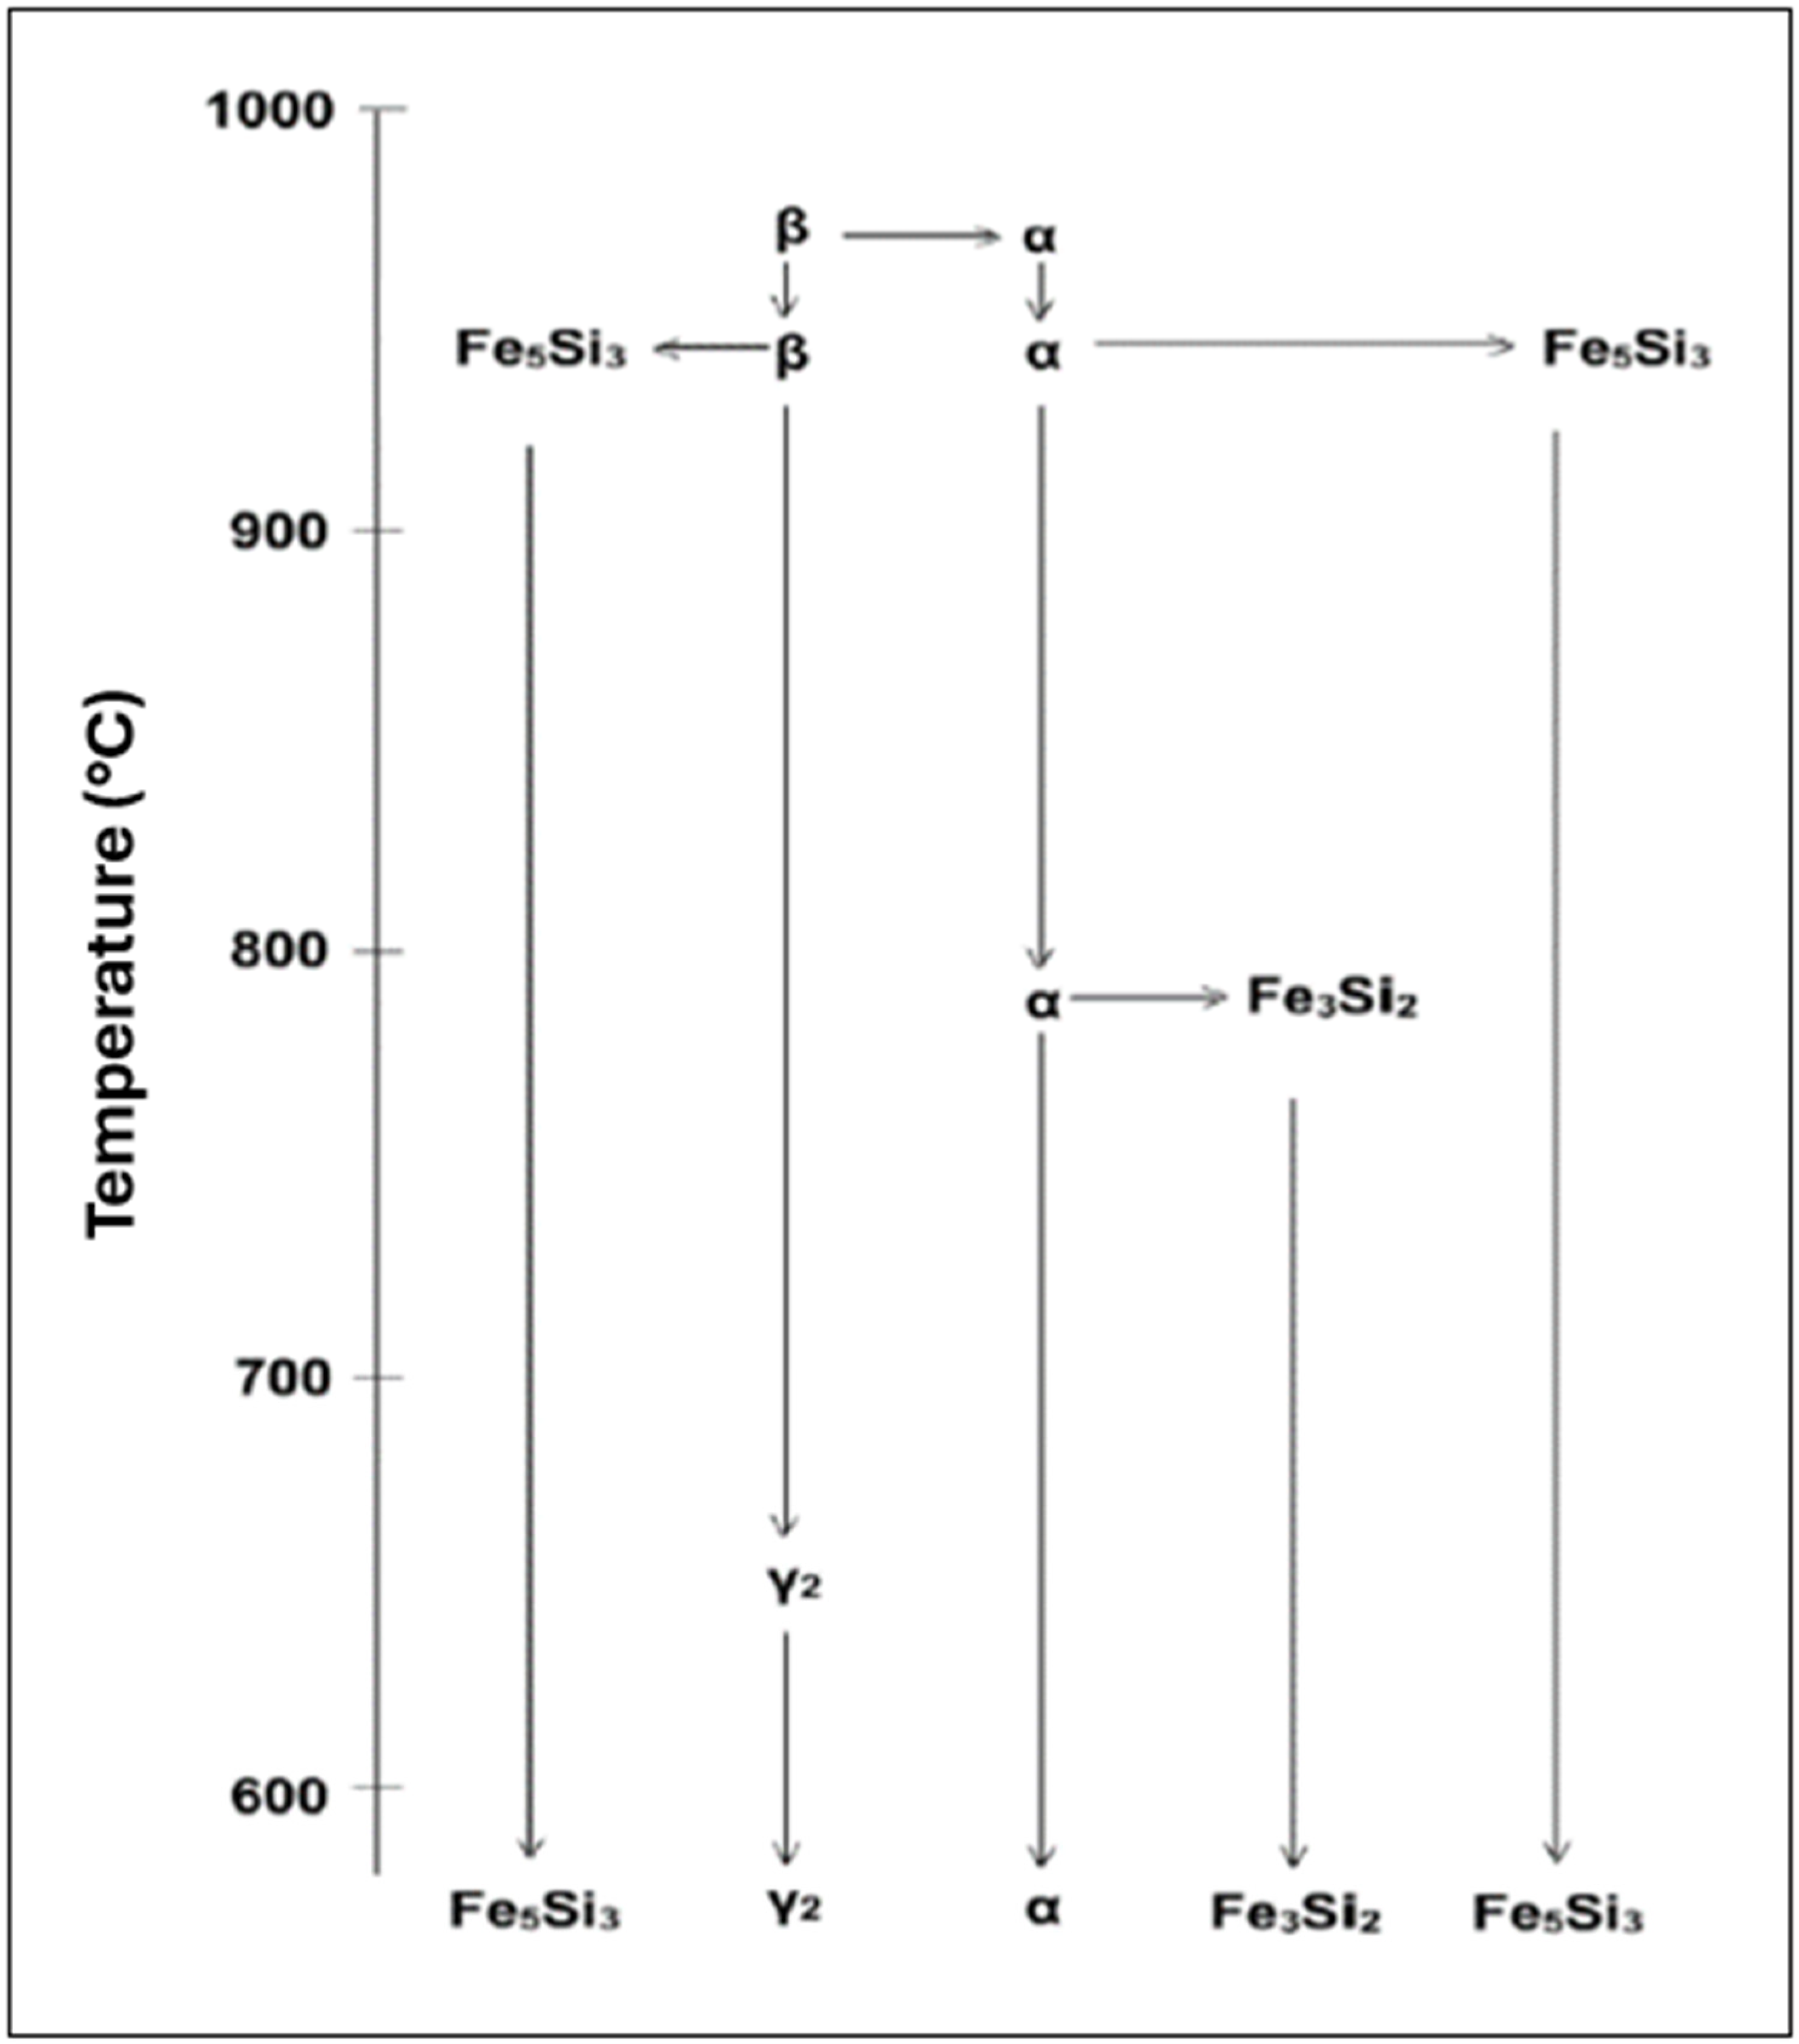
Figure 1. Microstructure development of cast Silicon Aluminum Bronze. Adapted from Ref. [26].
Metals 14 01134 g001
Figure 2. Schematic representation of the directional solidification apparatus used to measure the thermal variables of the CuAl6Si2 Alloy. Adapted from Ref. [4].
Metals 14 01134 g002
Figure 3. Schematic sequence used for sample cut and preparation.
Metals 14 01134 g003
Figure 4. Thermal profiles along the length of the CuAl6Si2 alloy during directional solidification.
Metals 14 01134 g004
Figure 5. Solidification thermal variables experimentally obtained for CuAl6Si2 during directional solidification. In (a) the time at which the liquidus temperature (tL) is observed in each thermocouple, (b) the velocity liquidus isotherm (VL) is observed in each thermocouple, (c) the cooling rate (TR) is observed in each thermocouple, and (d) the thermal gradient (GL) is observed in each thermocouple.
Metals 14 01134 g005
Figure 6. Hardness HB vs. position (left). Microhardness HV1 vs. position (right).
Metals 14 01134 g006
Figure 7. Optical microstructural analysis and phase identification via SE-SEM.
Metals 14 01134 g007
Figure 8. XRD patterns of the Cu6Al2Si alloy after directional solidification at different positions.
Metals 14 01134 g008
Table 1. Structure and composition of the phases and intermetallics present in the Silicon Aluminum Bronze. Adapted from Ref. [26].
Phases and IntermetallicsMorphologyStructureComposition
αWidmanstättenFCCCu-rich (containing ~12%Al, 5%Si)
γ2Twin-like plates associated with α phaseCPHCu-rich (containing ~12%Al, 3%Si)
βMartensitic phase that is retained in the microstructure between the α grainsBCCCu-rich with Al and Si
Fe3Si2 (Kappa)lath-shaped particlesB2Fe-rich (containing ~38%Si)
Fe5Si3 (Kappa)Crystals with irregular appearance and parallel sidesHexagonalFe-rich (containing ~30%Si, 16%Cu)
α + γ2Twin-like plates located at the boundaries of the α and β phasesFCC & CPHCu-rich (containing ~15%Al, 8%Si)
Table 2. Chemical composition of the supplied CuAl6Si2 alloy.
AlloyComposition (wt%)
CuAlSiOthers
CuAl6Si2Bal6.362.3Ni—0.156 max
Fe—0.65
Mn—0.25 max
Sn—0.08 max
Zn—0.32 max
Pb—0.006 max
Table 3. Composition after solidification experiment compared to the reference standard.
AlloyStandardComposition (wt%)
CuAlSiOthers
CuAl6Si2Def Stan 02-834Rest6.0–6.42.0–2.4Ni—0.25 max
Fe—0.5–0.7
Mn—0.50 max
Sn—0.1 max
Zn—0.4 max
Pb—0.01 max
CuAl6Si2Chemical composition after solidificationRest6.292.21Ni—0.135 max
Fe—0.52
Mn—0.23 max
Sn—0.06 max
Zn—0.17 max
Pb—0.006 max
Table 4. Solidification thermal variables, hardness, microhardness, and phases distribution.
Position (mm)VL (mm/s)TR (°C/min)GL (°C/mm)Hardness (HB)Microhardness (HV1)Phases Distribution α + γ2 (%)
40.47217.067.7142.9128.761
80.3755.922.52138.7130.568
120.3246.262.4135.8131.375
160.2921.71.25134.6135.886
260.2510.590.72130.7138.0390
350.224.580.35126.7139.493
530.193.010.26124.4140.694
Disclaimer/Publisher’s Note: The statements, opinions and data contained in all publications are solely those of the individual author(s) and contributor(s) and not of MDPI and/or the editor(s). MDPI and/or the editor(s) disclaim responsibility for any injury to people or property resulting from any ideas, methods, instructions or products referred to in the content.