Article

Research on the Prediction of Roll Wear in a Strip Mill

1
Collaborative Innovation Center of Steel Technology, University of Science and Technology Beijing, Beijing 100083, China
2
Rare Earth Steel Sheet Factory, Baosteel Group, Baotou 014000, China
*
Author to whom correspondence should be addressed.
Metals 2024, 14(10), 1180; https://doi.org/10.3390/met14101180
Submission received: 21 September 2024 / Revised: 10 October 2024 / Accepted: 14 October 2024 / Published: 17 October 2024
(This article belongs to the Special Issue Advances in Metal Rolling Processes)

Abstract

:
In the process of hot rolling silicon steel, roll wear directly affect its shape. Accurate prediction of roll wear is an important condition for rolling qualified silicon steel strips. The traditional roll wear prediction model is established by the slicing method. The wear of F5–F7 work rolls used for finishing rolling silicon steel on a 2250 mm production line in a steel mill was predicted by this model. It was found that there was deviation between the predicted results and the actual wear, and the prediction accuracy of the model was insufficient. Therefore, the wear of the surfaces of the rolls used for rolling silicon steel on this production line was studied. Based on the analysis of the work roll wear’s form and the rolling parameters that affect the roll wear, the traditional roll wear prediction model was optimized by the genetic algorithm. Finally, the optimized model was verified, and the prediction accuracy of the wear prediction model improved. The accurate prediction results provide a basis for the formulation of a shape control strategy when rolling silicon steel on this production line.

1. Introduction

Silicon steel [1,2,3,4] is a kind of electrical steel material widely used in motor manufacturing, transformer manufacturing and other fields. The shape of silicon steel directly affects the performance. Hot rolling is an important rolling process in the production of silicon steel, and the poor shape of silicon steel after hot rolling will be inherited by the end product. At present, in mainstream hot tandem mill units, the design of the bending rolls, shifting rolls, rolling force controls and other plate shapes controls the devices. When a roll is used, the roll’s surface is commonly ground, using a CNC grinding machine, into a variety of roll shapes, such as VCR (varying contact rolling), K-WRS (Kawasaki-work roll shifting) and CVC (continuously variable crown) [5,6,7,8]. The wear on a roll’s surface, when used, damages the roll’s shape, which directly affects the shape of the rolled strip. Accurate prediction of roll wear can provide a basis for the formulation of a strip shape control strategy for rolling mill control systems [9,10,11,12,13].
In order to quantify the wear value of a rolling mill, researchers have carried out related research on various aspects. Prinz et al. [14,15,16] studied the shape of roll surfaces and developed a variety of roll shapes according to the wear condition of the roll surface to achieve the uniform wear of a roll. At the same time, a roll wear model was established for different roll shapes; roll shape wear was predicted for multivariety continuous rolling, and the roll surface wear law was obtained for large-scale production. John et al. [17] established a roll wear prediction model suitable for continuous production on a production line by comprehensively considering the influence of strip width and thickness factors on roll wear, providing a method for optimizing the plate shape of the hot-rolling production line. Liu et al. [18] established a roll wear prediction model by considering the influence of the roll temperature, rolling force, contact arc and other factors on the roll wear, which can better predict the roll wear condition during continuous strip production and simultaneous rolling of multiple grades of steel.
However, these studies mainly focus on the prediction of roll wear during continuous rolling of multivariety strips on hot-rolling lines. There are few reports that specifically research the roll wear of certain steels during production, but it is very necessary to study the forecasting of roll wear for certain steels, such as during the production of silicon steel [19,20,21]. Therefore, in this paper, wear prediction for F5–F7 work rolls in a finishing mill was studied for a 2250 mm production line (In the hot-rolling unit, there were seven rolling mills in the finishing rolling area, which were F1… F7, and the work rolls used in the corresponding frames were called the F1 work roll… F7 work roll).

2. Experiments

Using the traditional work roll wear forecasting method, a model was established to predict the work roll wear of the 2250 hot-rolling line. During the process of hot strip rolling, the working condition of a work roll is poor, and there are many factors that affect the wear of the roll, with each factor affecting the others. So far, it is not possible to derive a correct wear prediction model from the wear mechanism, but a semi-theoretical and semi-empirical wear prediction model can only be established through a lot of measurement and analysis. At present, most mature wear models adopt the slicing method [22,23,24,25], which uniformly cuts s pieces along the radial direction of the work roll body, calculates the amount of wear for each piece, and, finally, accumulates the wear amounts of all pieces to form a wear curve. The prediction formula for wear is shown in Formula (1) [22,23,24,25].
w x = k w 0 L Z P a k w 1 L S D W 1 + k w 2 f ( x )
where x —work roll axis coordinates; k w 0 —composite influence coefficient, which is related to the strip material, work roll material, strip temperature, etc.; L Z —mill length, kM; P a —specific rolling force, kN m m 2 ; k w 1 —influence coefficient of the unit rolling pressure; L S —contact arc length, mm; D W —work roll diameter, mm; k w 2 —coefficient of nonuniform wear over the width of the strip; and f ( x ) —function describing the degree of uneven wear in the direction of the work roll. Among them, f(x) represents the form of the roll wear roll shape, and the specific function form should be determined according to the actual wear condition. The function is a piecewise function, where the edges are the oa and gd lines. The middle part is divided into a flat form and a multiple curve form according to whether there are obvious wear sharp points. As shown in Figure 1, in order to improve the accuracy of the wear prediction model, the function segmentation is becoming increasingly detailed, and the prediction of oa, ab, bd, de, ec, cg and gd are seven function segments.

3. Experiment Results and Discussion

3.1. Using Models to Predict the Wear of Rolling Mill Surfaces

The function f(x) for the nonuniform wear degree in the working roll direction is shown in Formula (2), the wear prediction formula is shown in Formula (1), and the objective function is shown in Formula (3).
f ( x ) = 0   x ( 0 ,   x 1 ) ( x a ) ( a 0 + a 2 ) / L 1       x ( x 1 , x 2 ) a 0 + a 2 x b 0.5 B 1 2 x ( x 2 , x 3 ) ( c x ) ( a 0 + a 2 ) / L 2       x ( x 3 , x 4 ) 0   x ( x 4 , x 5 )
where a0 and a2—multinomial coefficient; x —work roll axis coordinates.
f = i = 1 m ( W i , j W i ) 2 / n k m W _
w h e r e   n k —k wear roll shape corresponding to the number of strips rolled during the rolling cycle; m —number of points taken on the roll; W —predicted wear value of each point on the roll; W —actual wear value of each point on the roll; and W _ —average roll wear depth.
The model has the following 5 parameters that need to be optimized: comprehensive influence coefficient, kw0; unit rolling pressure influence coefficient, kw1; uneven wear coefficient, kw2; and strip width range and polynomial coefficient a0 and a2. In the optimization and determination of the parameters, the 5 parameters are divided into two groups, with the three parameters with physical meaning, kw0, kw1 and kw2, composing one group, and the polynomial coefficients a0 and a2 the other group. In the optimization process, the method of alternate optimization is adopted; that is, the first set of parameters is given a fixed value, the second set of parameters are optimized, the optimization value is obtained, the optimization value is assigned to the second group, and then the first group is optimized. The process is repeated until the first group and the second group of parameters are stable and unchanged; then, the five parameter values are the values to be obtained.
For the optimization process, three groups of wear roll shapes with different rolling periods were selected, and the wear values corresponding to each coordinate point were added as the actual wear values to improve the adaptability of the optimization parameters. The kw0, kw1 and kw2 groups were first optimized, and the values were as follows: a0 = 30 and a2 = 10; initial intervals for kw0, kw1 and kw2 set as [−2, −2, −2]; initial population of [2, 2, 2] set as 300; iteration termination algebra as 300 and replication probability as Ps = 2 for the simulation. The crossover probability was Pc = 0.1, and the mutation probability was Pm = 0.8; then, they were optimized and the values assigned to kw0, kw1, kw2 and optimize groups a0 and a2; the above process was repeated until the 5 parameters were basically unchanged to obtain the optimal solution for the five parameters. Finally, the optimization results obtained were a0 = 24.677, a2 = 4.414, kw0 = 0.216, kw1 = 0.192 and kw2 = 0.367.
The measured and predicted values corresponding to the three groups of wear roll shape used in the optimization process are shown in Figure 2, where the red curve is the predicted value, and the blue curve is the measured value. The objective function value of the prediction of the three groups of wear roll shapes used for optimization is 0.0862. As can be seen from Figure 2, for the value of the objective function, there are differences between the predicted and actual wear roll shapes, and there is a certain deviation between the predicted and actual values. The traditional work roll prediction model cannot truly reflect the work roll wear forms of the downstream frame of the current 2250 mm production line. Therefore, it is necessary to optimize the work roll wear prediction model according to the wear characteristics of the work roll in the rear frame.

3.2. Model Optimization and Verification

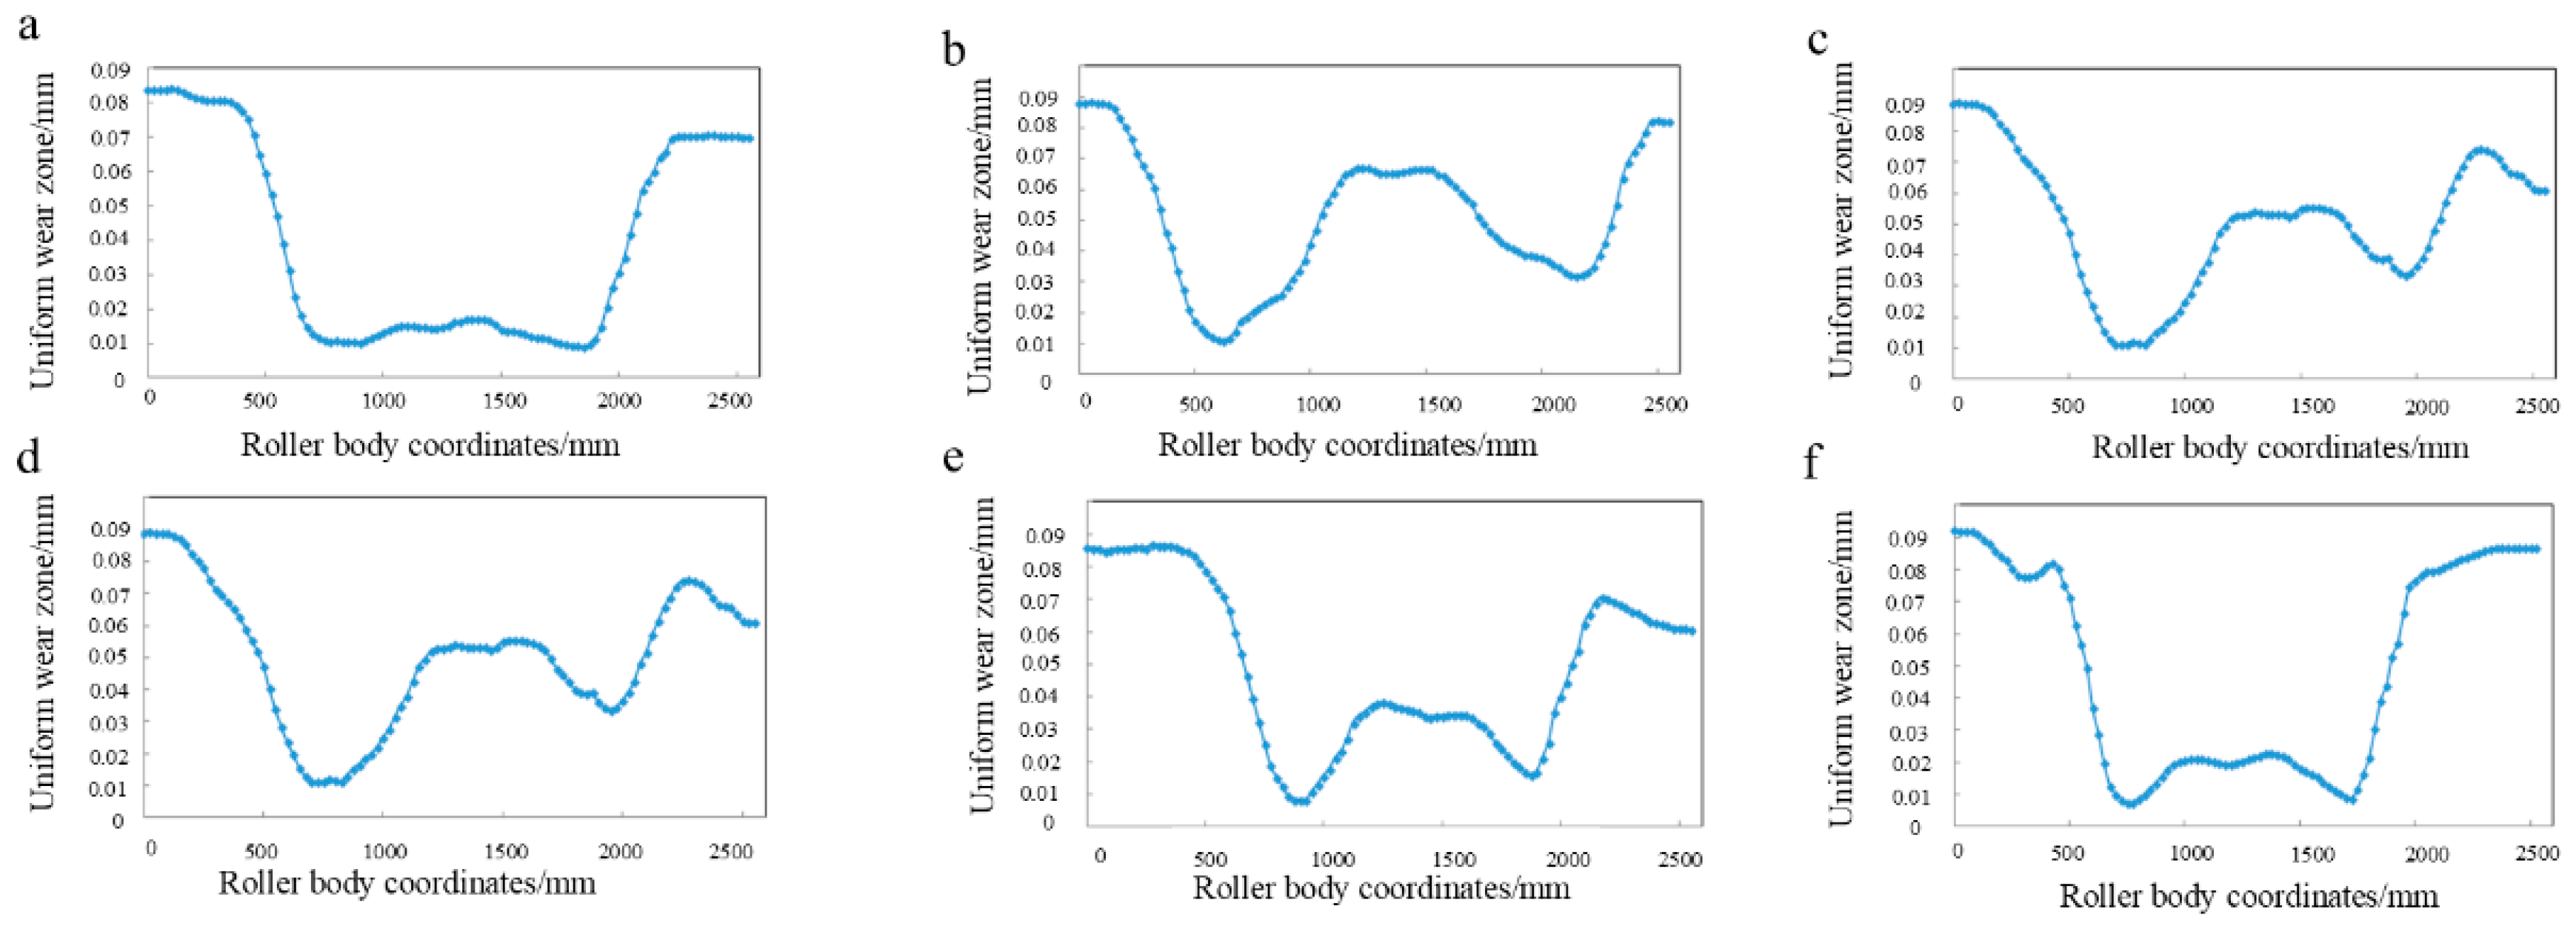
3.2.1. 2250 mm Production Line Roll Wear Typical Wear Patterns

The function describing the nonuniform wear degree of the work roll in the work roll wear prediction model should be consistent with the typical wear curve of the roll in the rolling process so that the wear prediction model can accurately reflect the actual wear amount and form of the roll. Therefore, the typical wear model of the F5–F7 frame work roll in the 2250 mm hot-rolling line was first analyzed. After the work roll rolled the silicon steel, the roll spray cooling system was used to cool it to room temperature, and the surface wear curve of the F5–F7 frame work roll was measured by the CNC grinding machine measurement system. Through the data reading software, the real wear curve of the continuous work roll in the grinding machine system was converted into discrete point values with intervals of 25 mm. The wear forms of the rolled silicon steel with different roll periods were analyzed statistically and classified. The specific wear curve is shown in Figure 3.
It can be seen from Figure 3 that the local wear areas on the roll edges vary significantly for different rolling cycles. The local wear areas on the edges, as shown in Figure 3a–f, significantly intensified; there is no obvious local wear area on the middle edge, as shown in Figure 3a, and the local wear area is serious in Figure 3f, while the wear forms in the middle part of the rolls are not significantly different., the wear is mainly in the form of flat or flat conic curves.

3.2.2. Improvement in Wear Prediction Model and Parameter Optimization

It can be found from the roll wear curve from the actual production process that local wear is prone to occur on the edge of the frame roll in the middle and downstream of the actual production line, but the local wear distribution range is large, while the distribution range of the local wear peak area on the edge is small in the conventional prediction model. Therefore, first, the function of the degree of uneven wear in the working roll direction should be improved to make it more similar to the current roll wear distribution form. Combined with the actual wear data from the field, the function form of the nonuniform wear degree of the working roller axis was optimized, and the optimized results are shown in Formula (4).
f ( x ) = 0     x ( o ,   oa ) a 2 - a 0 ( x a 0 a 2   - o a ) 2           x ( oa , od ) a 4   x ( od , oe ) a 6 a 2 - a 0 ( oe x + a 0 a 2   ) 2         x ( oe , oh ) 0     x ( oh , oi )
Among the parameters, a0, a2, a4 and a6 are undetermined parameters, where a0 represents the quadratic form of the local wear, a2 represents the local wear depth, a4 represents the middle wear depth, and a6 represents the parameter for the local wear asymmetry between the reaction operation side and the drive side, which can be determined according to the field-measured data. In the formula, position parameters such as oa/od/oe/oh and oi also need to be determined (only the values for oa and de can be obtained, and other values can be calculated through geometric relations). The value of oa can be summarized according to the wear roll shape data from actual production, as shown in Formula (5).
oa = L 1.2 B 2
where L-length of the roll body, mm; B-strip width, mm; If 1.2B > L, the oa is 100 mm. The length of de is related to the relevant parameters in the rolling process, and it needs to be determined by combining the wear curve with the rolling data. In addition, it can be seen from the above analysis that the forms of the local edge wear depths from different rolling cycles are not consistent, which indicates that a2 in the forecast model is also directly related to the rolling data. Therefore, it is necessary to analyze the effect of different rolling data on de and a2. Firstly, the local wear degree of the roll is defined. As shown in Figure 4, the wear area of the work roll is divided into a uniform wear area and a local wear area.
The definition of roll local wear is shown in Formula (6). In the formula, S1 is the local wear area, and S2 is the uniform wear area.
α = S 1 S 2
In order to better reflect the wear function form in the forecast model, a partial simplification can be carried out here. The upper local wear area is regarded as an approximate triangle, while the lower uniform wear area is regarded as an approximate trapezoid. Therefore, the expression for the local wear degree can also be written in the form shown in Formula (7).
α = 1 + a 6 a 2 a 4 B d e B + 1.2 B a 4
The expression of de can be obtained by the above formula, as shown in Formula (8).
d e = α B + 1.2 B a 4 1 + a 6 a 2 a 4 + B
Therefore, if the value of the local wear degree, α, can be obtained by analyzing the actual work roll wear data, de can be obtained. Thus simplifying the number of parameters to be optimized in the nonuniform wear function to three. In order to achieve the above purpose, the local wear degree of the downstream work roll in successive cycles was statistically analyzed. The rolling parameters that may affect the degree of the local wear were calculated for analysis. Figure 5 shows the relationships between the local wear, average roll-bending force and roll channeling position in the table.
As can be seen from Figure 5, there is no obvious correspondence between the local wear degree of the roll and the bending force and the position of the roll channeling. Next, the relationships between the rolling force, rolling speed and local wear were compared. In order to facilitate the analysis, the rolling force and rolling speed were normalized, considering that the rolling force ranges from 8000 kN to 16,000 kN and the rolling speed ranges from 2.5 m/s to 11 m/s. Therefore, 8000 kN and 2.5 m/s were taken as the basic rolling force and the basic rolling speed, and dimensionless conversion was achieved by dividing the actual rolling force and the rolling speed by the basic value, with the relationships between them and the local wear degree being expressed, as shown in Figure 6.
It can be seen from the figure that the variation trend for the rolling speed was close to that of the local wear, which indicates that the rolling speed is a major factor affecting local wear. It can also be found that the rolling force also plays a certain role in the local wear through a detailed analysis of the individual points. For example, the rolling speed in the third rolling cycle increased greatly, but the local wear did not increase greatly due to the reduction in the rolling force. The same situation was also obvious for the 2nd, 9th, 10th, 12th, 13th and other cycles. Therefore, it can be concluded from the above analysis that the degree of local wear increased with the increases in the rolling speed and rolling force. With the reductions in the rolling speed and rolling force, the rolling speed plays a more important role. The prediction function for the local wear degree was established, as shown in Formula (9).
α 1 = a V V + b F F
w h e r e   α 1 —forecast value of the local wear degree; a —influence coefficient of the rolling speed, to be optimized; b —influence coefficient of the rolling force, to be optimized; V —rolling speed, m/s; V —base rolling speed, m/s; F —rolling force, KN; F —base rolling force, KN. The objective function is shown in Formula (10), n—number of rolling cycles.
f = i = 1 n ( α 1 α ) 2 / n
The MATLAB-R2023a genetic algorithm toolbox was used to optimize the above parameters, and the final results were a = 0.079 and b = 0.021. Therefore, the local wear of the roll can be expressed as α = 0.079 V V + 0.021 F F . It can be seen from the previous analysis of the roll wear shape that the local wear of the operating side and the transmission side presents obvious asymmetry in the form of the roll wear, which is also a factor to be considered in order to improve the prediction accuracy in the forecasting process. Therefore, the ratio of the local wear area of the transmission side to the local wear area of the operating side is defined as the roll wear asymmetry. The statistical analysis is shown in Table 1.
It can be seen from the data in the above table that the local wear degree of the transmission side is usually greater than that of the operating side. Combined with the above analysis, the parameter a6, representing the asymmetry between the transmission side and the operating side, was set at 1.8. After the above analysis, the original forecast model was further refined, and there were six parameters to be optimized in the refined forecast model, which were the comprehensive influence coefficient, kw0; the influence coefficient of the unit rolling pressure, kw1; the nonuniform wear coefficient within the strip width range, kw2; and the three parameters a0, a2 and a4 in the model, which represent the forms of the nonuniform roll wear. Next, the six parameters were optimized through the genetic algorithm toolbox of MATLAB, and the prediction formula is shown in Formula (1). The function of the nonuniform wear degree adopted the form shown in Formula (4), and the objective function is shown in Formula (3). Three groups of roll wear curves (consistent with those used in the traditional form optimization process) were also selected for optimization. The whole optimization process also adopted the form of group alternating optimization, and the six parameter values were the desired values. The relevant parameters were set as follows: initial population set to 300, iteration termination algebra set to 300, and replication probability set to Ps = 2 in the simulation. The crossover probability was Pc = 0.1, the mutation probability was Pm = 0.8, and the final optimized parameters were a0 = 3.891, a2 = 17.216, a4 = 23.108, kw0 = 0.307, kw1 = 0.147 and kw2 = 0.298. The measured and predicted values corresponding to the three groups of wear roll shapes used in the optimization process are shown in Figure 7, where the red curve is the forecasted value, and the blue curve is the measured value. The objective function value for predicting the three groups of wear roll shapes used in the optimization was 0.0537.

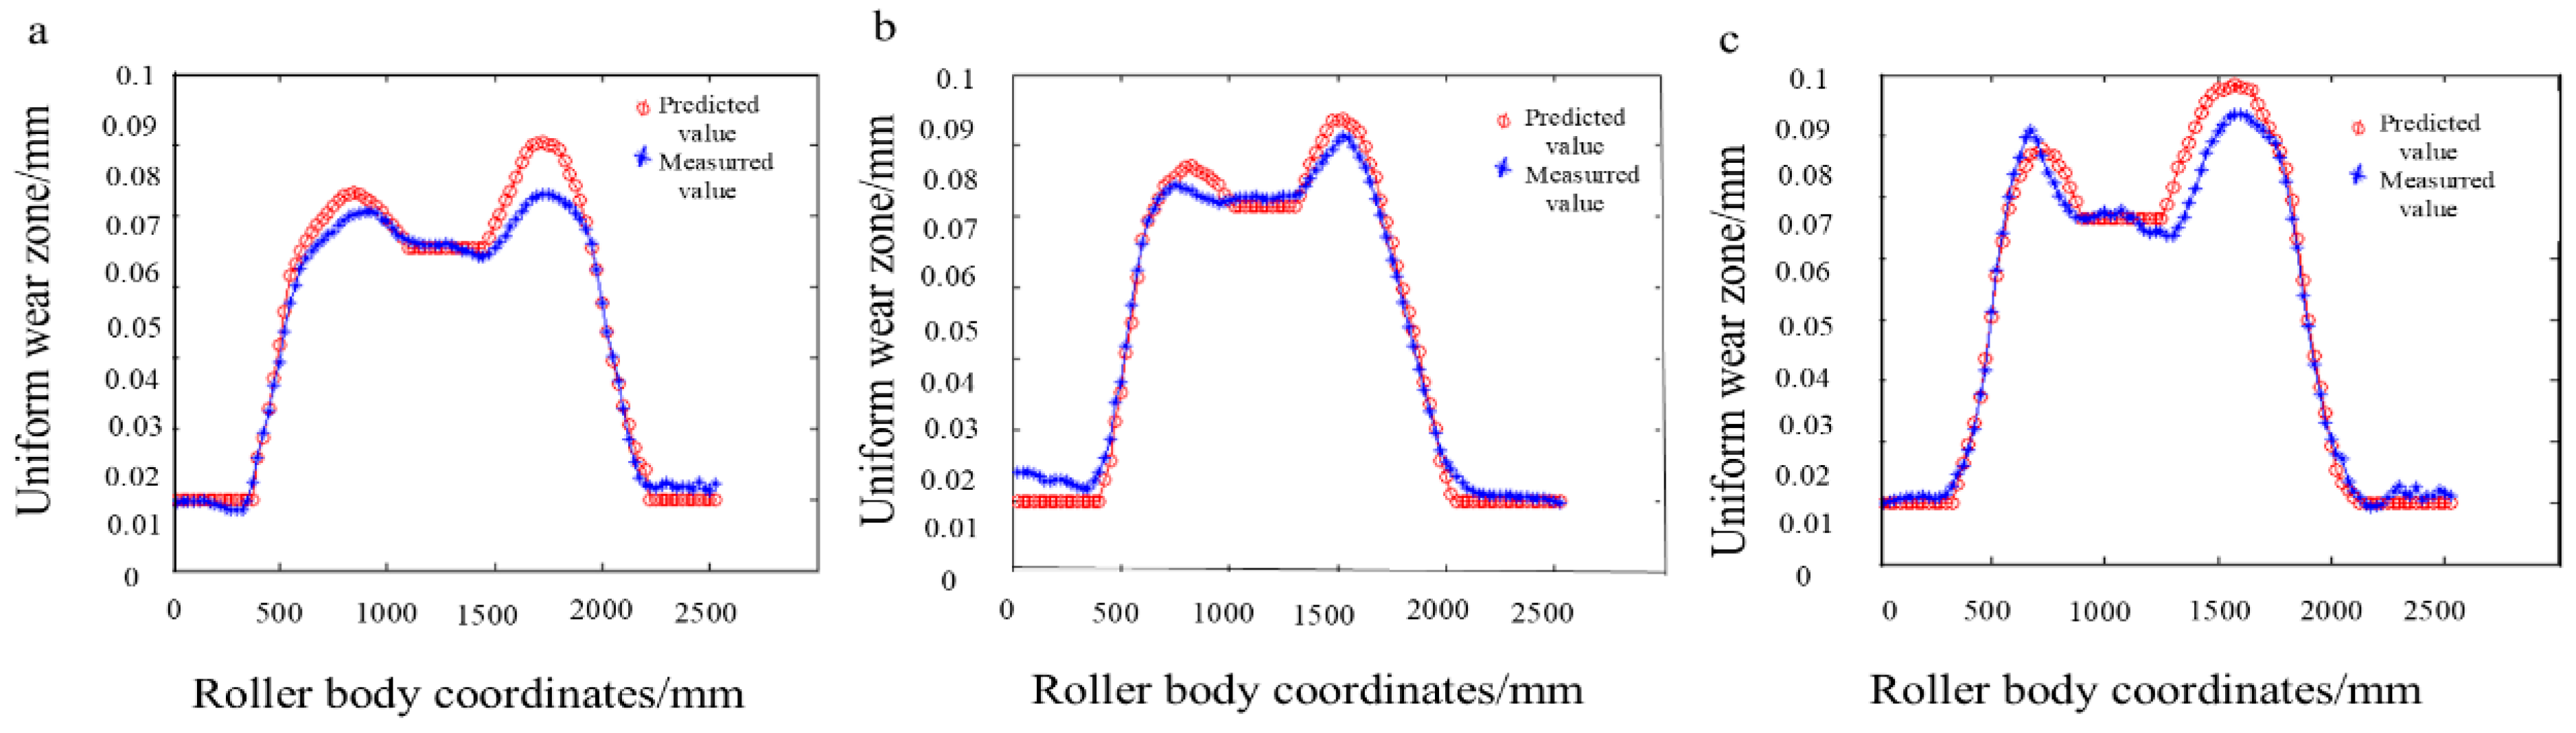
3.3. Optimization Model Effect Verification

As can be seen from Figure 2 and Figure 7, the improved prediction model is obviously more accurate. According to the value of the objective function, the prediction accuracy of the improved wear roll shape model used in the optimization process improved by 0.0325 compared with the conventional model. Therefore, the wear prediction accuracy for the F5–F7 high nickel–chromium work roll of the 2250 mm hot tandem mill for rolling silicon steel was improved by the optimization of the model.

4. Conclusions

When using a 2250 mm hot tandem mill for rolling silicon steel products, the work roll wear form is complex. Wear is influenced by the control strategy, roll shape, rolled steel type and many other factors. The wear of the work roll during hot rolling mainly presents complex asymmetric wear forms. According to the actual working conditions, a traditional roll wear prediction model was established, and the roll wear from the production line was forecasted by the model. Through research and analysis of the forecasted results, combined with the mill parameters that affected the work roll wear, the model was optimized. The following conclusions are drawn:
(1)
In the 2250 mm production line roll wear prediction model, established using the traditional slicing method, the objective function value of the three groups of wear roll shapes’ prediction used in the optimization was 0.0862, and the results were biased and the prediction accuracy was insufficient.
(2)
Based on the analysis of the wear patterns of the hot-rolling work rolls during the rolling of silicon steel on this production line, six typical roll wear patterns were obtained. The typical roll wear patterns were combined with industrial data on the mill parameters that affect the wear, and the parameters of the traditional roll wear prediction model were optimized using the results of the analysis. A roll wear prediction model adapted to the production line was obtained.
(3)
The new model was used to forecast the wear of work rolls for this production line. The objective function value of the three groups of wear roll shapes’ prediction used for the optimization was 0.0537, which is a reduction of 0.0325 compared with 0.0862 before the optimization of the wear prediction model. The predicted results are close to the actual measured wear. Compared with the traditional forecast model, the forecast accuracy is increased by more than 30%. The accurate prediction of the surface wear of the work roll during hot rolling provides a basis for the formulation of a shape control strategy for the subsequent rolling of silicon steel with this production line.

Author Contributions

Conceptualization, A.Z.; Methodology, A.Z.; Software, J.W. and A.Z.; Validation, J.W.; Formal analysis, J.W.; Investigation, J.W.; Resources, J.W. and A.Z.; Data curation, J.W.; Writing—original draft, J.W.; Writing—review and editing, A.Z.; Visualization, J.W.; Supervision, A.Z.; Project administration, J.W. and A.Z.; Funding acquisition, A.Z. All authors have read and agreed to the published version of the manuscript.

Funding

Fundamental Research Funds for the Central Universities (FRF-BD-23-02).

Conflicts of Interest

The authors declare no conflicts of interest.

References

  1. Dorner, D.; Zaefferer, S.; Lahn, L.; Raabe, D. Overview of microstructure and microtexture development in grain-oriented silicon steel. J. Magn. Magn. Mater. 2006, 304, 183–186. [Google Scholar] [CrossRef]
  2. Vourna, P.; Ktena, A.; Tsakiridis, P.E.; Hristoforou, E. A novel approach of accurately evaluating residual stress and microstructure of welded electrical steels. NDT E Int. 2015, 71, 33–42. [Google Scholar] [CrossRef]
  3. Cui, R.; Li, S. Pulsed laser welding of laminated electrical steels. J. Mater. Process. Technol. 2020, 285, 116778. [Google Scholar] [CrossRef]
  4. Muntin, A.V. Advanced technology of combined thin slab continuous casting and steel strip hot rolling. Metallurgist 2019, 62, 900–910. [Google Scholar] [CrossRef]
  5. Wang, F.; Liu, C.; He, A.; Jiang, Z.; Miao, R.; Shao, J.; Zhao, Q. Research on variable crown work roll curve design for W-shaped profile control of strips. Int. J. Adv. Manuf. Technol. 2023, 128, 5463–5475. [Google Scholar] [CrossRef]
  6. Wang, X.D.; Li, F.; Li, B.H.; Zhu, G.S.; Li, B.; Zhang, B.H. VCR back-up roll and negative work roll contour design for solving roll spalling and transfer bar profile problems in hot strip mill. Ironmak. Steelmak. 2010, 37, 633–640. [Google Scholar] [CrossRef]
  7. Shang, F.; Li, H.; Kong, N.; Zhang, J.; Hu, C.; Zhang, C.; Chen, J.F.; Mitchell, D.R. Improvement in continuously variable crown work roll contour under CVC cyclical shifting mode. Int. J. Adv. Manuf. Technol. 2017, 90, 2723–2731. [Google Scholar] [CrossRef]
  8. Li, G.; Gong, D.; Xing, J.; Zhang, D. Optimization of CVC shifting mode for hot strip mill based on the proposed LightGBM prediction model of roll shifting. Int. J. Adv. Manuf. Technol. 2021, 116, 1491–1506. [Google Scholar] [CrossRef]
  9. Kim, D.H.; Lee, Y.; Yoo, S.J.; Choo, W.Y.; Kim, B.M. Prediction of the wear profile of a roll groove in rod rolling using an incremental form of wear model. Proc. Inst. Mech. Eng. Part B J. Eng. Manuf. 2003, 217, 111–126. [Google Scholar] [CrossRef]
  10. Strasser, D.; Bergmann, M.; Smeulders, B.; Paesold, D.; Krimpelstätter, K.; Schellingerhout, P.; Zeman, K. A novel model-based approach for the prediction of wear in cold rolling. Wear 2017, 376, 1245–1259. [Google Scholar] [CrossRef]
  11. Vasilyeva, N.; Fedorova, E.; Kolesnikov, A. Big data as a tool for building a predictive model of mill roll wear. Symmetry 2021, 13, 859. [Google Scholar] [CrossRef]
  12. Song, G.; Wang, X.; Yang, Q. Study on mathematical model of work roll wear in skin-pass rolling of hot steel strip. Int. J. Adv. Manuf. Technol. 2018, 97, 2675–2686. [Google Scholar] [CrossRef]
  13. Xu, D.; Zhang, J.; Li, H.; Lu, J.; Fan, Q.; Dong, H. Research on surface topography wear of textured work roll in cold rolling. Ind. Lubr. Tribol. 2015, 67, 269–275. [Google Scholar] [CrossRef]
  14. Prinz, K.; Steinboeck, A.; Kugi, A. Optimization-based feedforward control of the strip thickness profile in hot strip rolling. J. Process Control 2018, 64, 100–111. [Google Scholar] [CrossRef]
  15. Yamaguchi, S.; Miyake, M.; Kimura, K.; Jinnouchi, T. Work roll shifting method by optimum calculation of work roll profile in hot strip rolling. Procedia Eng. 2017, 207, 1320–1325. [Google Scholar] [CrossRef]
  16. Xia, X.M.; Di, H.S.; Bian, H.; Zhang, Y.X. Optimization of work roll profile on finishing stands for 1422 hot-rolled strip in Meisteel. J. Northeast. Univ. (Nat. Sci.) 2010, 31, 1424. [Google Scholar] [CrossRef]
  17. John, S.; Sikdar, S.; Mukhopadhyay, A.; Pandit, A. Roll wear prediction model for finishing stands of hot strip mill. Ironmak. Steelmak. 2006, 33, 169–175. [Google Scholar] [CrossRef]
  18. Liu, Z.; Guan, Y.; Wang, F. Model development of work roll wear in hot strip mill. IOP Conf. Ser. Mater. Sci. Eng. 2017, 207, 012022. [Google Scholar] [CrossRef]
  19. Tanaka, I.; Nitomi, H.; Imanishi, K.; Okamura, K.; Yashiki, H. Application of high-strength nonoriented electrical steel to interior permanent magnet synchronous motor. IEEE Trans. Magn. 2012, 49, 2997–3001. [Google Scholar] [CrossRef]
  20. Fang, X.; Wang, W.; Brisset, F.; Helbert, A.L.; Baudin, T. Microstructure and texture evolution of nonoriented silicon steel during the punching process. Int. J. Miner. Metall. Mater. 2022, 29, 2064–2071. [Google Scholar] [CrossRef]
  21. Fan, T.; Li, Q.; Wen, X. Development of a high power density motor made of amorphous alloy cores. IEEE Trans. Ind. Electron. 2013, 61, 4510–4518. [Google Scholar] [CrossRef]
  22. He, A.; Zhang, Q.; Wei, G. Cenetic Algorthms of Work Roll Wear Model for Hot Rolling. Iron Steel 2000, 35, 50–59. [Google Scholar] [CrossRef]
  23. Zheng, X.T.; Zhang, J.; Li, H.B.; Cheng, F.W.; Hu, W.D.; Shi, L. Work roll uneven wear prediction model in broad-strip hot rolling mill. Iron Steel 2015, 50, 49–53. [Google Scholar] [CrossRef]
  24. Weigang, L. Roll wear model and effect of work roll shifting on roll wear in hot strip mill. J. Wuhan Univ. Sci. Technol. 2013, 36, 98–103. [Google Scholar]
  25. Dong, Q.; Wang, Z.; He, Y.; Zhang, L.; Shang, F.; Li, Z. The effect of shifting modes on work roll wear in strip steel hot rolling process. Ironmak. Steelmak. 2023, 50, 67–74. [Google Scholar] [CrossRef]
Figure 1. Schematic diagram of the work roll wear model.
Metals 14 01180 g001
Figure 2. Measured and predicted values corresponding to the three groups of wear roll shapes used in the optimization process. (a) The first group. (b) The second group. (c) The third group.
Metals 14 01180 g002
Figure 3. Six typical wear patterns of the downstream frame work rolls in the 2250 mm hot-rolling line. (a) The first typical wear pattern. (b) The second typical wear pattern. (c) The third typical wear pattern. (d) The fourth typical wear pattern. (e) The fifth typical wear pattern. (f) The sixth typical wear pattern.
Metals 14 01180 g003
Figure 4. Division of the work roll wear area.
Metals 14 01180 g004
Figure 5. Relationships between the local wear degree and average roll-bending force and roll channeling position.
Metals 14 01180 g005
Figure 6. Relationships between the local wear and rolling force and rolling speed.
Metals 14 01180 g006
Figure 7. The measured and predicted values of the three groups of wear roll shapes used in the optimization process of the model optimization. (a) The first group. (b) The second group. (c) The third group.
Metals 14 01180 g007
Table 1. Asymmetric degree of roller wear in different rolling cycles.
Rolling Cycle123456789
Degree of asymmetry2.071.741.091.611.672.031.241.822.18
Disclaimer/Publisher’s Note: The statements, opinions and data contained in all publications are solely those of the individual author(s) and contributor(s) and not of MDPI and/or the editor(s). MDPI and/or the editor(s) disclaim responsibility for any injury to people or property resulting from any ideas, methods, instructions or products referred to in the content.

