Article

Experimental and Numerical Characterization of Local Properties in Laser-Welded Joints in Thin Plates of High-Strength–Low-Alloy Steel and Their Dependence on the Welding Parameters

by
Patricio G. Riofrío
1,*,
Germán Omar Barrionuevo
1,2,
Fernando Olmedo
1 and
Alexis Debut
3
1
Departamento de Ciencias de la Energía y Mecánica, Universidad de las Fuerzas Armadas ESPE, Sangolquí 171103, Ecuador
2
Department of Mechanical and Metallurgical Engineering, School of Engineering, Pontificia Universidad Católica de Chile, Av. Vicuña Mackenna, Santiago 4860, Chile
3
Centro de Nanociencia y Nanotecnología, Universidad de las Fuerzas Armadas ESPE, Sangolquí 171103, Ecuador
*
Author to whom correspondence should be addressed.
Metals 2024, 14(11), 1219; https://doi.org/10.3390/met14111219
Submission received: 9 September 2024 / Revised: 25 September 2024 / Accepted: 26 September 2024 / Published: 26 October 2024

Abstract

:
Laser welding on thin plates of high-strength steel is increasing in various industrial applications. The mechanical behavior of welded joints depends on their local properties, which in turn depend on the welding parameters applied to join the base material. This work characterizes the local properties of butt-welded joints of thin plates of high-strength–low-alloy (HSLA) steel. This study focuses on the effect of welding parameters on the microstructure, tensile response, microhardness, and weld bead profile. For this purpose, a factorial experimental design was formed, covering a heat input range from 53 to 75 J/mm. This study identified the main effects and interactions of welding speed and laser power on the weld bead profile and on its width. The microstructure, weld bead width, hardness, and tensile mechanical properties were significantly influenced by heat input. Furthermore, numerical simulations on real weld bead profiles revealed high values of the stress concentration factor and suggested a correlation with heat input.

1. Introduction

To reduce weight, energy consumption, and emissions harmful to the environment, high-strength steels and laser welding are increasingly being used in various industrial and construction sectors [1,2,3,4]. High-strength–low-alloy (HSLA) steels have a good combination of mechanical properties and weldability, with multiple applications in industries such as automotive, marine, pressure vessels, and pipelines due to its good formability, corrosion resistance, and durability [5,6,7,8]. HSLA steel is a versatile material with many advantages; however, it can also present limitations in ductility, machinability, and fatigue [8,9].
Laser welding is preferred over conventional welding processes due to its advantages when welding mainly thin aluminum, titanium, stainless steel, high-strength steels, and dissimilar metal alloys [9,10]. The high power density of the laser allows for lower heat inputs (HIs), high cooling rates, lower distortion, narrow heat-affected zones, high speeds, and precise control, all favorable conditions for welding [11,12,13].
Despite all the advantages of laser welding, in a welded joint, the microstructure of the base metal evolves in the heat-affected zone (HAZ) and fusion zone (FZ). A profile of the weld bead is formed, where imperfections commonly appear, and residual stresses are induced [14]. Therefore, the mechanical properties and structural integrity of the welded joint depend on the local properties of the welded zone.
Numerous studies have examined high-strength steel’s microstructure and mechanical properties during laser welding. Research by Yang [4] and He [15] on dual-phase (DP) steels with high tensile strengths found that the base metal microstructure composed of ferrite and martensite evolved into ferrite and various martensite morphologies depending on whether they were located in the heat-affected zone or the fusion zone. Sowards et al. [16] reported that, for HSLA steel, the microstructure evolved from ferrite, carbide precipitates at grain boundaries, and perlite to martensite, bainite, and ferrite. Similarly, Afkhami et al. [3] found that, in steels S900 and S1100, the initial microstructures changed to various forms of martensite (tempered martensite, massive fresh martensite, and lath martensite), bainite, and ferrite in the HAZ. Other studies explored the impact of welding parameters on the microstructure and mechanical behavior of HSLA steels; for example, Palanivel et al. [17] studied the effect of welding speed. Meanwhile, Zhao et al. [5] and Chen et al. [18] focused on the effect of heat input. According to these studies, increasing the welding speed and decreasing the heat input increased the ultimate tensile strength and the elongation percentage. As for the microstructures formed, they ranged from martensite in its various morphologies, bainite, and ferrite, depending on the heat input and the welding zone where they were found.
Regarding the mechanical properties of the base materials, both in DP and HSLA steels from previous works, the general trends were as follows: the hardness decreased in the FG-HAZ, while in the FZ, it increased, the tensile strength was similar, although the elongation was lower, and the fatigue strength of welded joints exhibited a great decrease. However, in the study by Farabi et al. [19], when welding a DP 980 steel, the hardness in the FZ did not increase, and Viňáš et al. [20] found that the ultimate tensile strength of welded joints with HSLA, DP, and TRIP steels exceeded the corresponding strength of their base metals.
Few studies have reported the weld bead profile and imperfections, even though they are important factors, especially in fatigue strength [21]. The profile of the weld bead can increase the stresses of external loads due to changes in section and by the presence of notches, which cause the well-known stress concentrator effect, and the presence of imperfections in welded joints can reduce the fatigue life by reducing the stage of crack formation [22]. After cracks have formed, their growth depends on the microstructure in which they are located. The crack growth rate differs if they are in ferrite–perlite, ferrite–bainite, bainite, or martensite phases [23,24,25].
In recent studies, imperfections and the weld bead profile are related to the laser welding parameters. Zhang et al. [26] studied the change in weld bead geometry by varying the heat input; there were weld root defects in three of the four heat inputs. Riofrio et al. [27] described the imperfections in butt-welded joints in S700 steel, relating them to laser welding parameters. Cui et al. [28] found that laser power had a greater influence than welding speed on the weld width and penetration and, therefore, on the mechanical properties of welded joints. Preventing defects through proper welding parameters and material preparation is crucial for ensuring the durability and safety of welded structures.
In laser welding of high-strength steels, many studies focus on determining the parameters (such as laser power and welding speed) that allow for achieving an optimal weld bead free of imperfections [2,16,29,30,31]; however, they generally do not analyze the variation of the weld bead profile and imperfections along the length of the weld axis, and, as already noted, several works have been limited to characterizing the microstructure and mechanical properties for a single combination of welding parameters.
On the other hand, due to computational progress, modeling heat and mass transfer phenomena have become commonplace. The finite element method (FEM) represents an effective solution to understanding temperature fields, deformation, and phase changes during welding processes. Rehman et al. [32] employed FEM to analyze the distortion in laser-welded Grade 91 steel. The results obtained showed good accuracy when applying a conical heat source model. Aberbache et al. [33] predicted the macrostructure and the displacement by implementing a thermo-mechanical model in austenitic stainless steel. Numerical simulation allows for the optimization of welding processes without extensive experimental trials.
The literature review also shows that few studies have identified the main effects and interaction of parameters such as laser power and welding speed on the local properties of welded joints to predict their effect on mechanical properties. In this work, a 22 factorial experimental design is used for this purpose. Four complete penetration butt joints of 3 mm thick HSLA steel laser welded in a small range of laser power and welding speed are formed to characterize local properties of the welded zone, such as microstructure, hardness, weld bead profile, tensile strength, and stress concentration factor. Macrography, optical microscopy (OM), scanning electron microscopy (SEM), tensile and hardness tests, profile measurements, and the finite element method (FEM) are used in this work to establish the local properties of the welded joints. Analysis of variance is applied to establish the prevalence of the main effect and the interaction of the welding parameters on imperfections of the weld bead.

2. Materials and Methods

2.1. Base Material

Three-millimeter plates of HSLA steel, produced by Strenx grade S700 MCE, were used in this research. Table 1 shows the chemical composition of the material determined experimentally through X-ray fluorescence and carbon analysis by automatic direct combustion, while Table 2 shows the corresponding mechanical properties that resulted from the tensile test according to the ASTM E8 standard. For comparison with the experimental results (Exp. in Table 1 and Table 2), both tables also include the corresponding information provided in the manufacturer’s datasheet [34] (D.S. in Table 1 and Table 2).

2.2. Laser Welding

For the study proposed in this work, two 100 mm × 80 mm × 3 mm plates were laser-cut to form single-pass butt joints. The surfaces of the plates on the side of the incidence of the laser beam were prepared by sanding, with two sandpapers, one #80 and the other #120, while the edges of the plates were ground to achieve uniformity and practically zero free space between them. Before performing the welding, the surfaces and edges were cleaned with acetone, the welding line was aligned to the trajectory of the laser beam, and the plates were fastened to the support with screws through their slots. The weld axis was arranged transversely to the rolling direction. Figure 1a schematically shows the arrangement of the plates to form the laser-welded butt joint and the location of the test specimens, while Figure 1b shows the assembly of the plates on the laser welding equipment.
Laser welding was performed in the keyhole mode. This mode is affected by several parameters and conditions, such as laser power (P), welding speed (v), focus position (fp), focus size (fd), laser beam angle (ϴ), joint gap, and surface condition. The scheme presented in Figure 2a illustrates some of the mentioned parameters and the weld bead formation in the keyhole mode.
The focus diameter, focus position, and beam inclination were constant for all samples, with values of 350 µm, −2 mm, and 9 degrees, respectively. During the welding, 99.96% pure argon shielding gas was supplied at a flow rate of 20 L/min. Disk laser equipment, Trumpf TruDisk 2000 (Farmington, NM, USA), was used in the continuous mode at 6000 Hz.
A factorial experimental design with two levels for the welding parameters welding speed and laser power was used to determine their influence on local properties. The above welding parameters were chosen to achieve, on the one hand, full penetration of all butt joints with a single pass and, on the other hand, a relatively wide variation in heat input. This last parameter is used in any welding process to measure the heat provided to the material per unit of welding length. In the case of laser welding, the nominal heat input (HI) is determined by Equation (1):
HI = P/v
where P is the laser power and v is the welding speed. The values of the laser welding parameters and the corresponding heat inputs for the four samples formed in the 22 factorial experimental design are shown in Table 3.

2.3. Weld Bead Geometry, Microstructure, and Mechanical Properties

The profile of the formed weld beads was determined with a Mitutoyo Surtest SJ-5000 profilometer (Kawasaki, Minato-ku, Japan) using a step of one micron. In three positions of the plates (see Figure 1a), the upper and lower profiles of the weld beads were captured. The generated data were processed with a spreadsheet to graphically represent the weld profiles; in the latter, various imperfections can be measured. By this means, the weld bead profile was characterized in terms of the imperfections of underfill (−), weld excess (+), and weld excess angle (α) (Figure 1b). Additionally, the weld bead geometry was complemented by measuring the width (W) of HAZ and FZ, instead of the individual size of each zone to indicate the HI effect. The measurement was made on the top weld bead of the macrographs using an OM. For this purpose, cross-section macrographs of small pieces removed from the center and near the ends of the butt-welded samples were used (Figure 1a). The pieces were sanded, polished, and etched with Nital solution (97 mL alcohol and 3 mL HNO3) at 3% by rubbing for 7 s.
The microhardness Vickers’ profile (HV, 0.5 Kg, 10 s) was determined in a piece at a depth of 50 µm from the top weld bead, and it was the average of two indentations made with a Struers’ Duramin equipment (Ballerup, Denmark). A Meiji Techno IM7200 optical microscope (Saitama, Japan) was used for the microstructure observation and photomicrographs, while the macrostructure and appearance of the weld seam were characterized by macrographs obtained with a Zeiss Stemi 305 optical stereo microscope (Aalen, Germany). Representative micrographs of the welded samples and the base material were also obtained with a MIRA3 TESCAN scanning electron microscope (SEM) (Brno, Czech Republic) to show the evolution of the microstructure.
The tensile mechanical properties of the welded samples and base material were determined according to the ASTM E8M standard. The specimens tested to tension were cut by a plasma machine and tested on an Instron 4206 machine (Norwood, MA, USA); the results are the average of two specimens.

2.4. Numerical Simulation

The experimentally obtained profile geometry was processed in CAD/CAE software (ANSYS Workbench 2024 R2) for 3D modeling and application of the finite element method (FEM) to determine how the weld profile affects stress concentration. A structural static analysis of the welding profiles was employed (Figure 3a). For the mesh configuration, an element size of 0.01 mm and the MultiZone Quad/Tri method was used (Figure 3b), which creates square and triangular elements, as well as contains an automatic optimization, allowing for greater precision in areas of higher stress concentration (smaller elements and a greater number of elements).
As for the static analysis, the left side was defined as fixed support and, as the cross-sectional area is known (0.1 × 3) mm2, a normal force of 3 [N] is assumed in order to calculate the normal stress (σo = 10 MPa). The stress concentration factor (Kt) is calculated as the maximum principal stress obtained numerically (σmax) over the nominal normal stress (σo) using Equation (2):
Kt = σmax/σo

3. Results and Discussion

3.1. Weld Bead Geometry Assessment

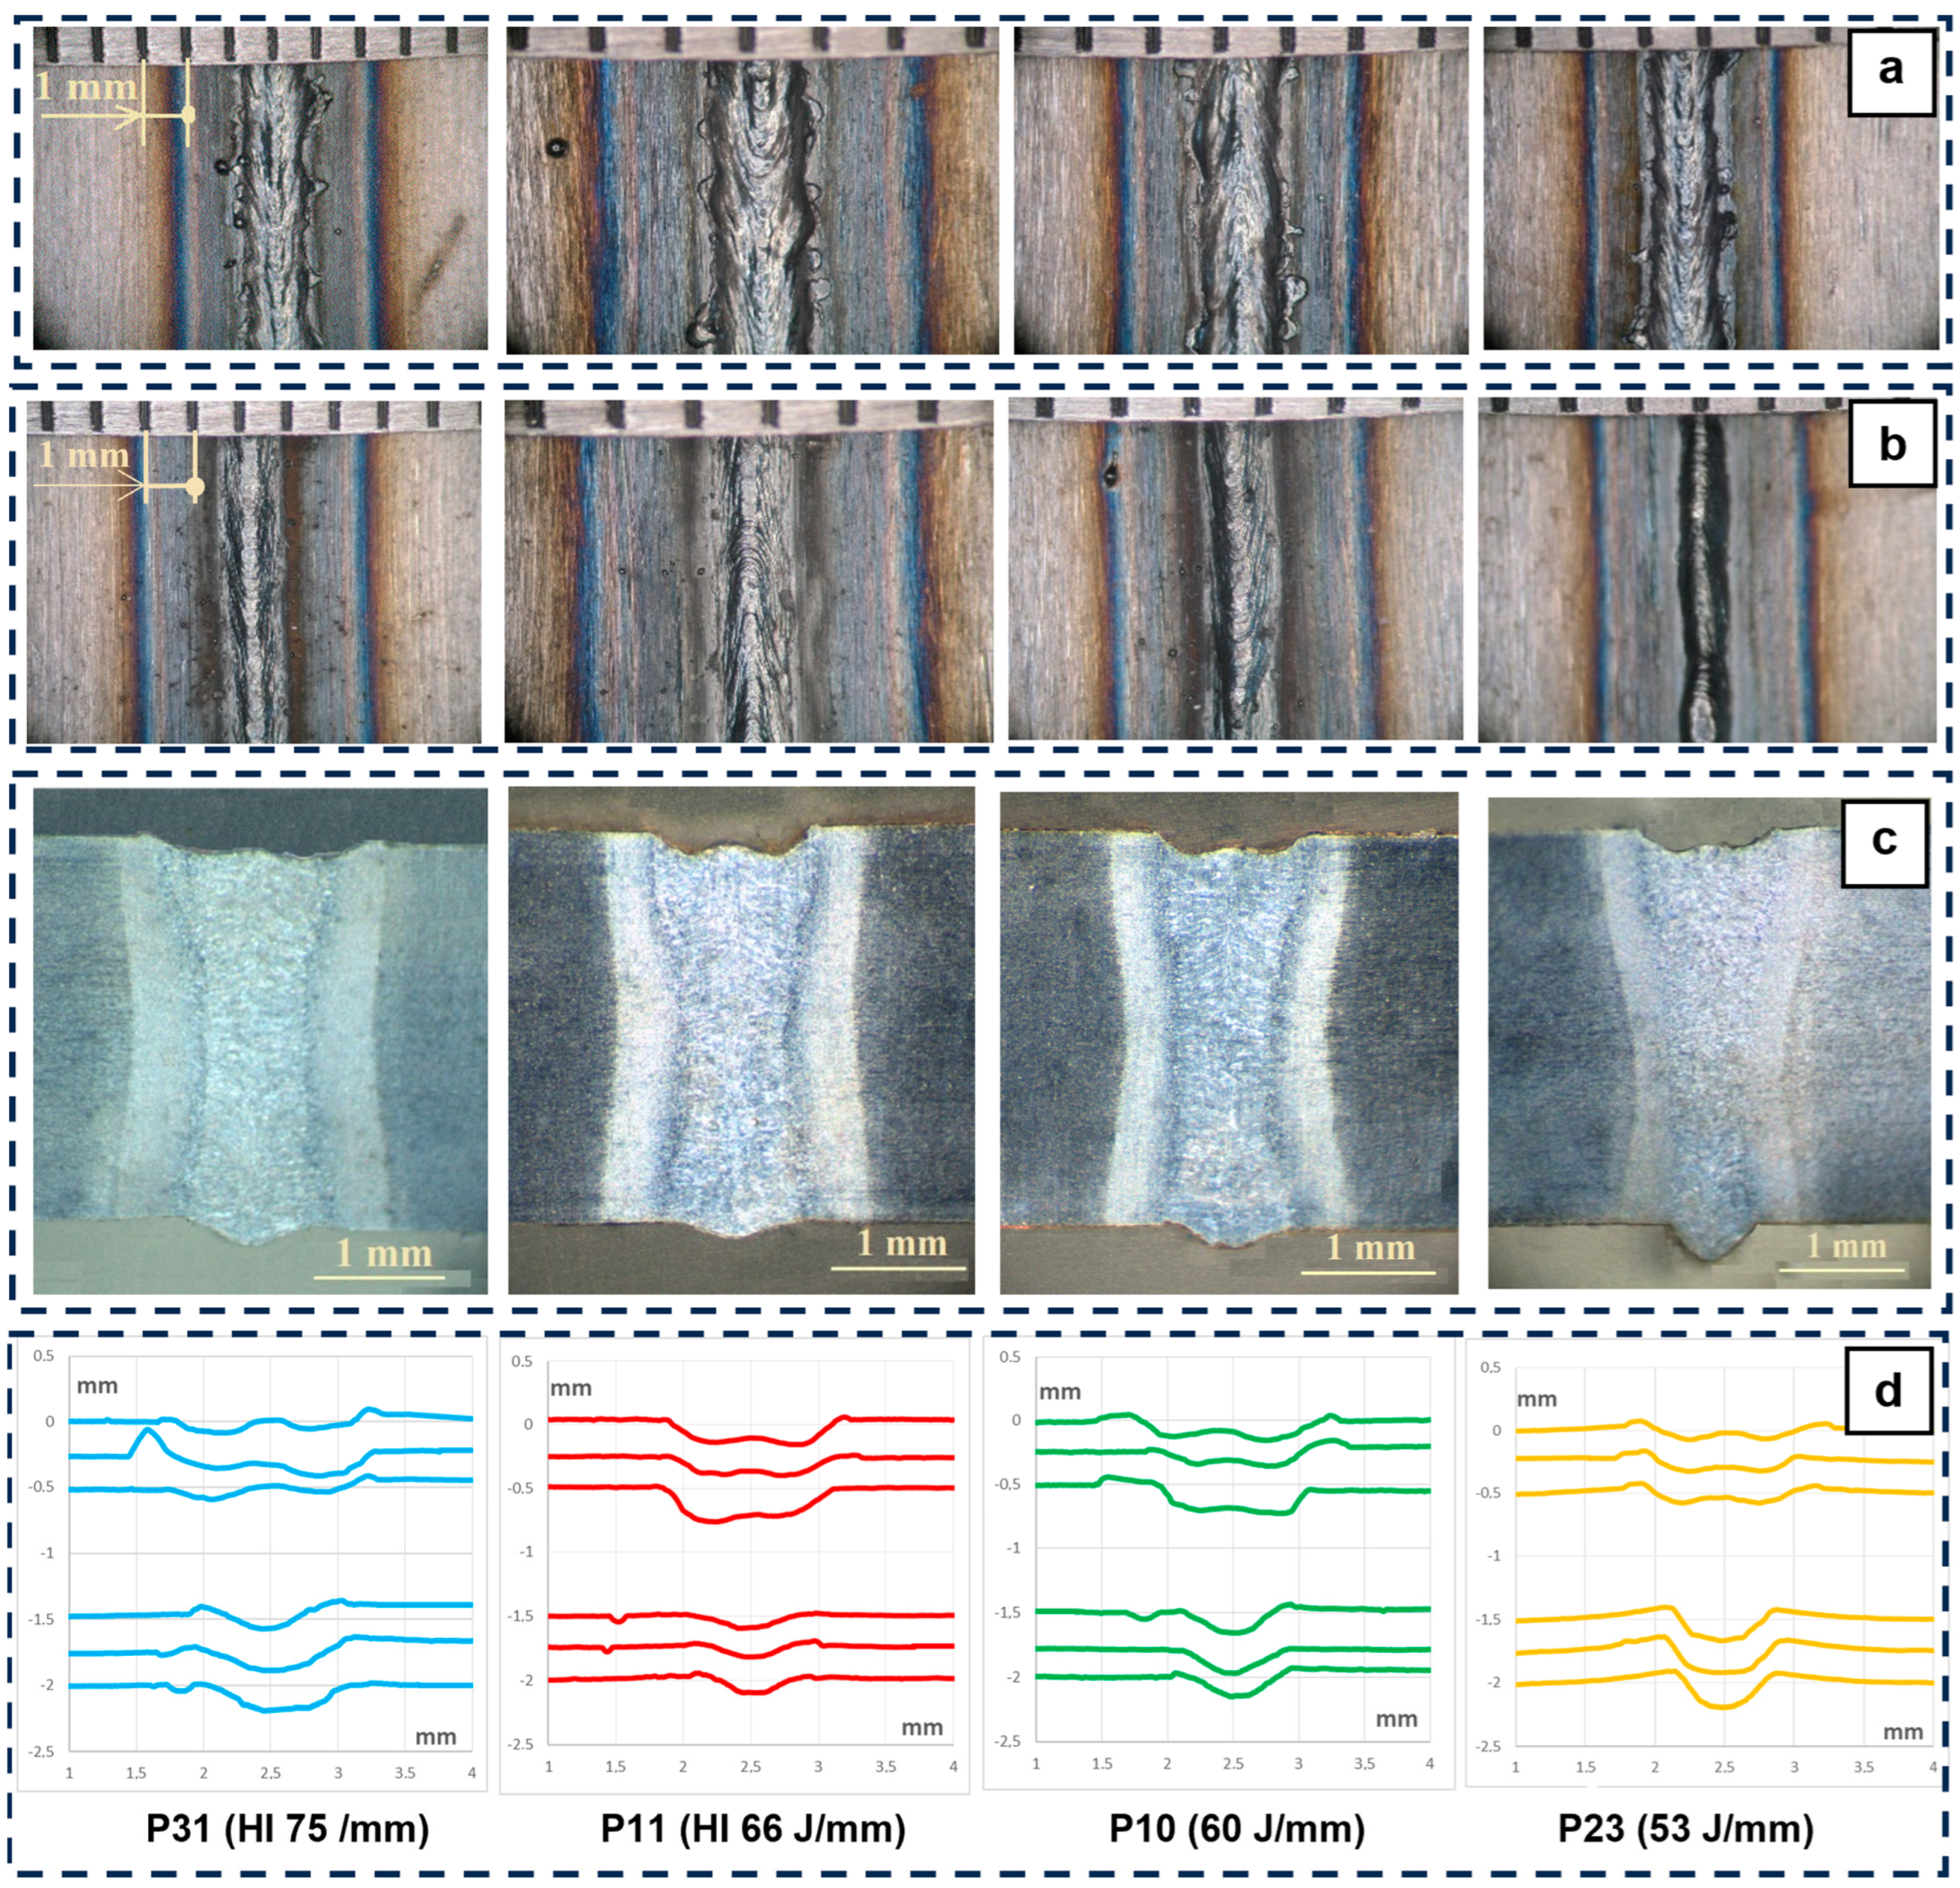
The weld bead geometry of the four samples of the experimental design is illustrated in Figure 4, with photographs of the appearance of the upper and lower weld seams (Figure 4a,b), macrographs of the cross-sections (Figure 4c), and three upper profiles and three lower profiles, captured with a profilometer (Figure 4d).
According to Figure 4, the photographs show variations in the weld bead profiles along the weld axis; the macrographs of the cross-sections highlight the presence of underfill and excess weld in all welded samples, and there are also noticeable differences in the width of the fusion zones, as well as the heat-affected zones.
Although at first glance of the macrographs and profiles, all the weld beads appear similar, a more careful observation highlights the following observations: (1) the weld bead width increases with increasing heat input; (2) the angle of the excess weld of all samples is similar except in sample P23, which is much more pronounced; (3) the underfill is lower in sample P31; (4) sample P11 has the lowest excess weld; and (5) samples P11 and P10 have quite similar profiles.

3.2. Microstructural Evolution of Welded Joints

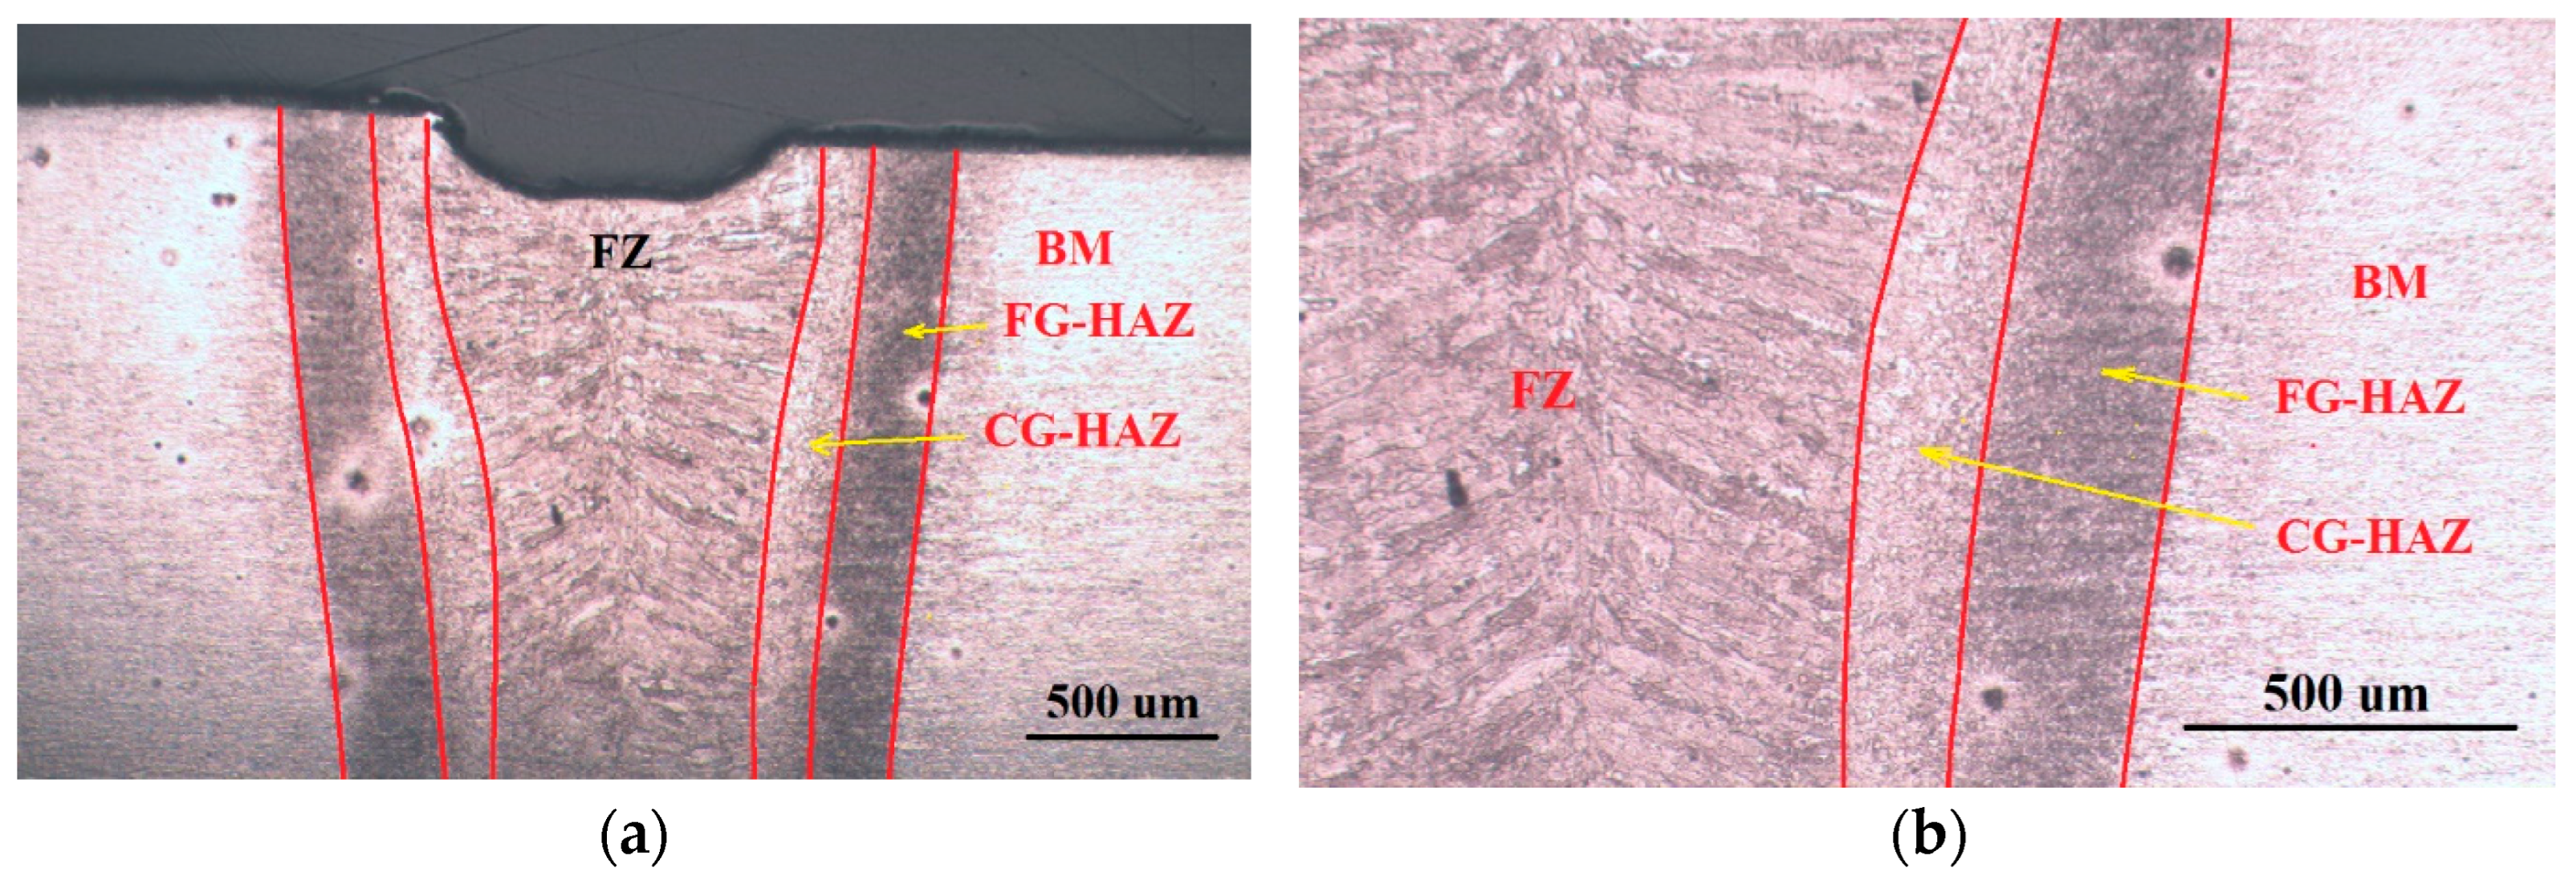
The evolution of the microstructure of the base metal (BM) of the HSLA steel due to the heat of laser welding can be observed in the optical micrographs of Figure 5 and the SEM micrographs of Figure 6 and Figure 7. Although the evolution of the microstructure of each sample depends on the amount of HI provided for welding, macroscopically, three zones are typically distinguished in all samples: the FZ, the coarse-grained heat-affected zone (CG-HAZ), and the fine-grained heat-affected zone (FG-HAZ). The aforementioned zones, illustrated with the optical micrographs of sample P10 in Figure 5a,b and the SEM micrographs in Figure 6a–c, reveal the thorough change that the microstructure of the BM underwent alongside the HAZ.
As can be seen in Figure 6a, showing the large and elongated grains of the ferrite (F) and bainite (B) products of the thermomechanical process applied in the formation of the base metal plate recrystallized into FG-HAZ and CG-HAZ, between these two zones, the difference in grain size was notorious. Small grains of ferrite and bainite were observed in the FG-HAZ, while in the CG-HAZ, there was a complex microstructure composed predominantly of bainite and lath-shaped bainite (LB). For lower heat inputs, small amounts of martensite may also appear [35].
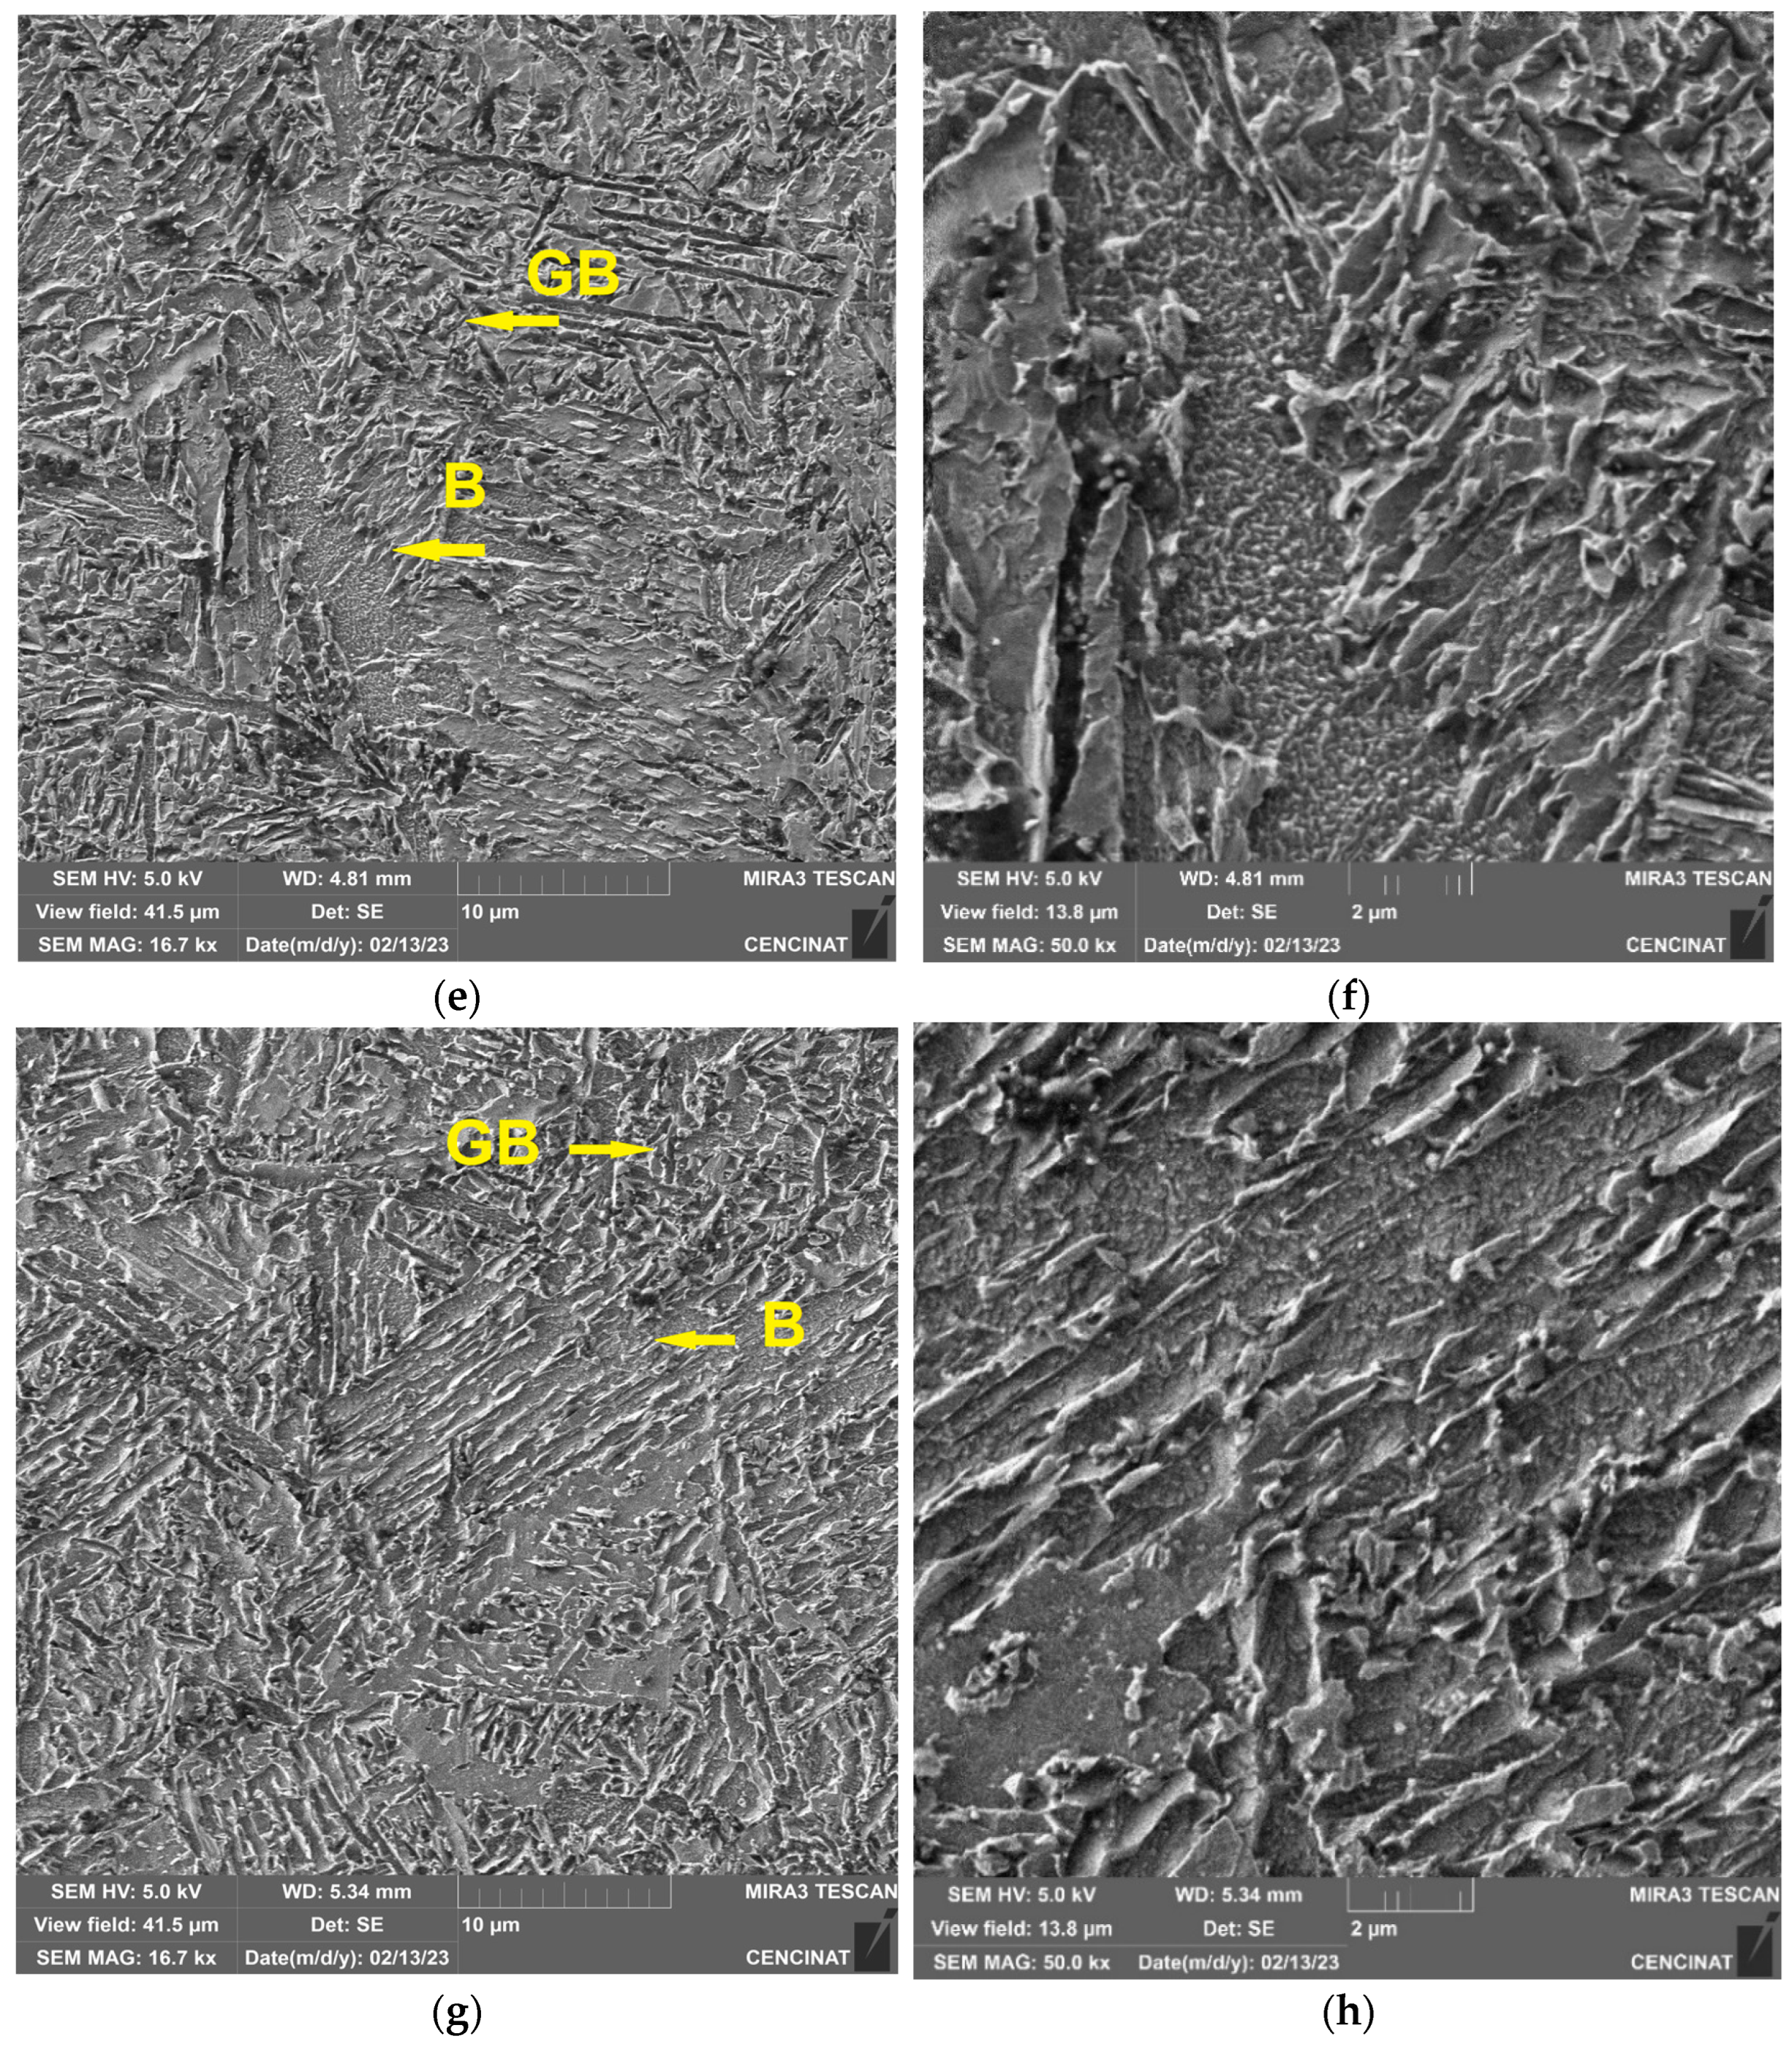
The FZ also presents an abrupt change in the microstructure, with columnar grains oriented in the direction of solidification much larger than those of the CG-HAZ, as can be seen in Figure 5a,b. The effect of heat input is much more noticeable in the FZ, as observed in the evolution suffered by the microstructure from the lowest heat input (53 J/mm) up to the highest heat input (75 J/mm) in the SEM micrographs of the samples, as shown in Figure 7a–h. Thus, a microstructure predominantly composed of many blocks of lath-shaped bainite progressively evolves to one composed of granular bainite (GB) and upper bainite (UB) [36]. In the samples with low heat input, martensite and retained austenite may also be present in small amounts. In several studies [18,37,38,39] on laser welding or thermomechanical simulation of the heat-affected zones with bainitic microstructures in the base metal, the formation of martensite, mixtures of martensite and bainite, bainite, and mixtures of bainite and ferrite has been reported, depending on the heat input, the thicknesses used, and the cooling rates that occurred.
The microstructural changes observed in Figure 7 are because, as the heat input decreased, the cooling rates were greater, producing phase transformations with a greater proportion of harder phases, such as martensite and bainite [40,41].

3.3. Mechanical Properties

3.3.1. Microhardness

Figure 8 shows the microhardness Vickers’ profiles (HV, 0.5 Kg, 10 s) and the widths of HAZ and FZ produced in the four welded samples. There was a progressive variation in the hardness and the width of the FZ and HAZ when the HI varied from 75 to 53 J/mm. The hardness increased in the FZ and CG-HAZ; conversely, in the FG-HAZ, the samples suffered softening while the width of the HAZ and FZ decreased [35]. The described behavior is consistent with the results reported by Khan et al. [2]. Regarding the hardness of the BM, in the FG-HAZ zone, a maximum softening of −20 HV occurs for the sample with a thermal input of 75 J/mm, while in the FZ zone, a maximum hardening of +50 HV occurs for the sample with a thermal input of 53 J/mm.
The hardness results obtained in each zone are consistent with their microstructures. It should be noted that, despite the small difference between the applied heat inputs to welded samples P10 and P11 (60 and 66 J/mm), there was also a small difference in the hardness and width corresponding to these two welded samples. It is also noted that the increase in hardness in FZ and CG-HAZ and the decrease in the level of softening in FG-HAZ, as already explained in the microstructure section, is due to the fact that, by decreasing the heat input, the cooling rate increases and, therefore, the austenized microstructures increase hardness [42].
It is worth noting that the sizes of the HAZ and FZ of the laser processes are smaller than those of the conventional process [43]. HSLA laser welding offers significant advantages, particularly in precision industries, with minimal material distortion, and is highly effective for welding thin materials with minimal risk of burn-through.

3.3.2. Tensile Response

Table 4 shows the tensile mechanical properties of the four welded samples and the BM; meanwhile, Figure 9 presents representative stress–strain curves obtained through the tensile test according to the ASTM E8M standard. The results in Table 4 are the average of two specimens, and it should be noted that all welded specimens failed in the base metal.
Although the values of the mechanical properties of the welded samples in Table 4 were very close to each other, a general trend could be observed (Figure 9). As the heat input decreased, the mechanical properties increased, approaching those of the base metal. However, the tensile strength was exceeded, as in the samples welded with heat inputs of 60 and 53 J/mm. The most significant decrease relative to the base metal occurred in elongation at 23% for heat input of 75 J/mm, while the decreases in yield point and tensile strengths were not significant and were less than 4%.
The behavior found for the welded joints was as follows: increase in the ultimate tensile strength, decrease in the elongation percentage (Table 4), and increase in hardness (Figure 8) when decreasing the heat input, consistent with the literature reviewed [18,34,39,44]. Considering that all welded samples failed in the base metal, imperfections in the weld bead profile did not have a major influence on the mechanical properties of the tensile test.
Proper welding parameter selection allows for obtaining high-quality HSLA steel welds with minimal distortion. Key mechanical properties, such as the tensile and yield strength, are generally preserved, but rapid cooling can lead to increased hardness and reduced toughness in the heat-affected zone. Overall, laser welding is highly effective for HSLA steels in applications where precision, high strength, and minimal deformation are required, though attention must be paid to microstructure and post-weld treatment to avoid brittleness [45,46].

3.4. Statistical Analysis of the Weld Bead Profile

According to the experimental design to study the effect of laser power, welding speed, and the interaction on the weld bead geometry, and of the various elements and imperfections that define it, the width W of the HAZ and FZ, the underfill, the excess weld, and the angle α were considered, as shown in Figure 2b. The results are presented in Table 5, which are the averages of three replicas except for the width W, which is the value of two replicas, while Figure 10 indicates the main effects and interaction of laser power and welding speed on the aforementioned elements and imperfections.
Figure 10 reveals that there is an interaction between laser power and welding speed on the imperfections: underfill, excess weld, and angle α, while, for the width W of the HAZ and FZ, it is evident that there is no interaction due to the parallelism of the lines observed in Figure 10d.
It is highlighted in the three figures of the imperfections (Figure 10a–c) that, at the high laser power level (2 kW), there was practically no variation in the size of the imperfections when the welding speed varied, while, concerning the welding speed, at the low level for the angle α and high level for the excess weld, there was no appreciable variation in the sizes with the variation of the laser power.
In terms of minimizing imperfections, it can be observed that, in the range of parameters examined, no welded sample minimized all three imperfections at the same time, but at a welding power of 1.75 kW and a welding speed of 1.60 m/min, the lowest α angle and the least welding excess were produced; however, the underfill was high and therefore, the selection of a welded sample must consider the effect that a given imperfection produces on the desired mechanical behavior [27].
This study applied ANOVA to the three imperfections that showed interaction to determine which effects were statistically significant. Using the statistical analysis of the fixed-effects model [47], with F0.05; 1; 8 = 5.32 for both the main effects and the interaction, the results in Table 6, Table 7 and Table 8 show that each main effect and interaction can be significant depending on imperfection. Thus, the main effect of power is more significant in excess weld, the main effect of welding speed is more significant in angle α, and the interaction effect is more significant in underfill. It can also be observed that both the welding speed and the interaction were significant in the three imperfections, while the laser power was not significant in the underfill.

3.5. Stress Concentrating Effect Due to Weld Bead Profile

The stress concentration effect due to section changes and notches in a welded joint is important in mechanical behavior. In common practice for welded joint design and analysis, the well-known stress concentration factor Kt is used, determined according to simplified geometries similar to the geometries of real joints. In this work, the Kt values were determined using the numerical simulation in ANSYS on real profiles for the four welded samples.
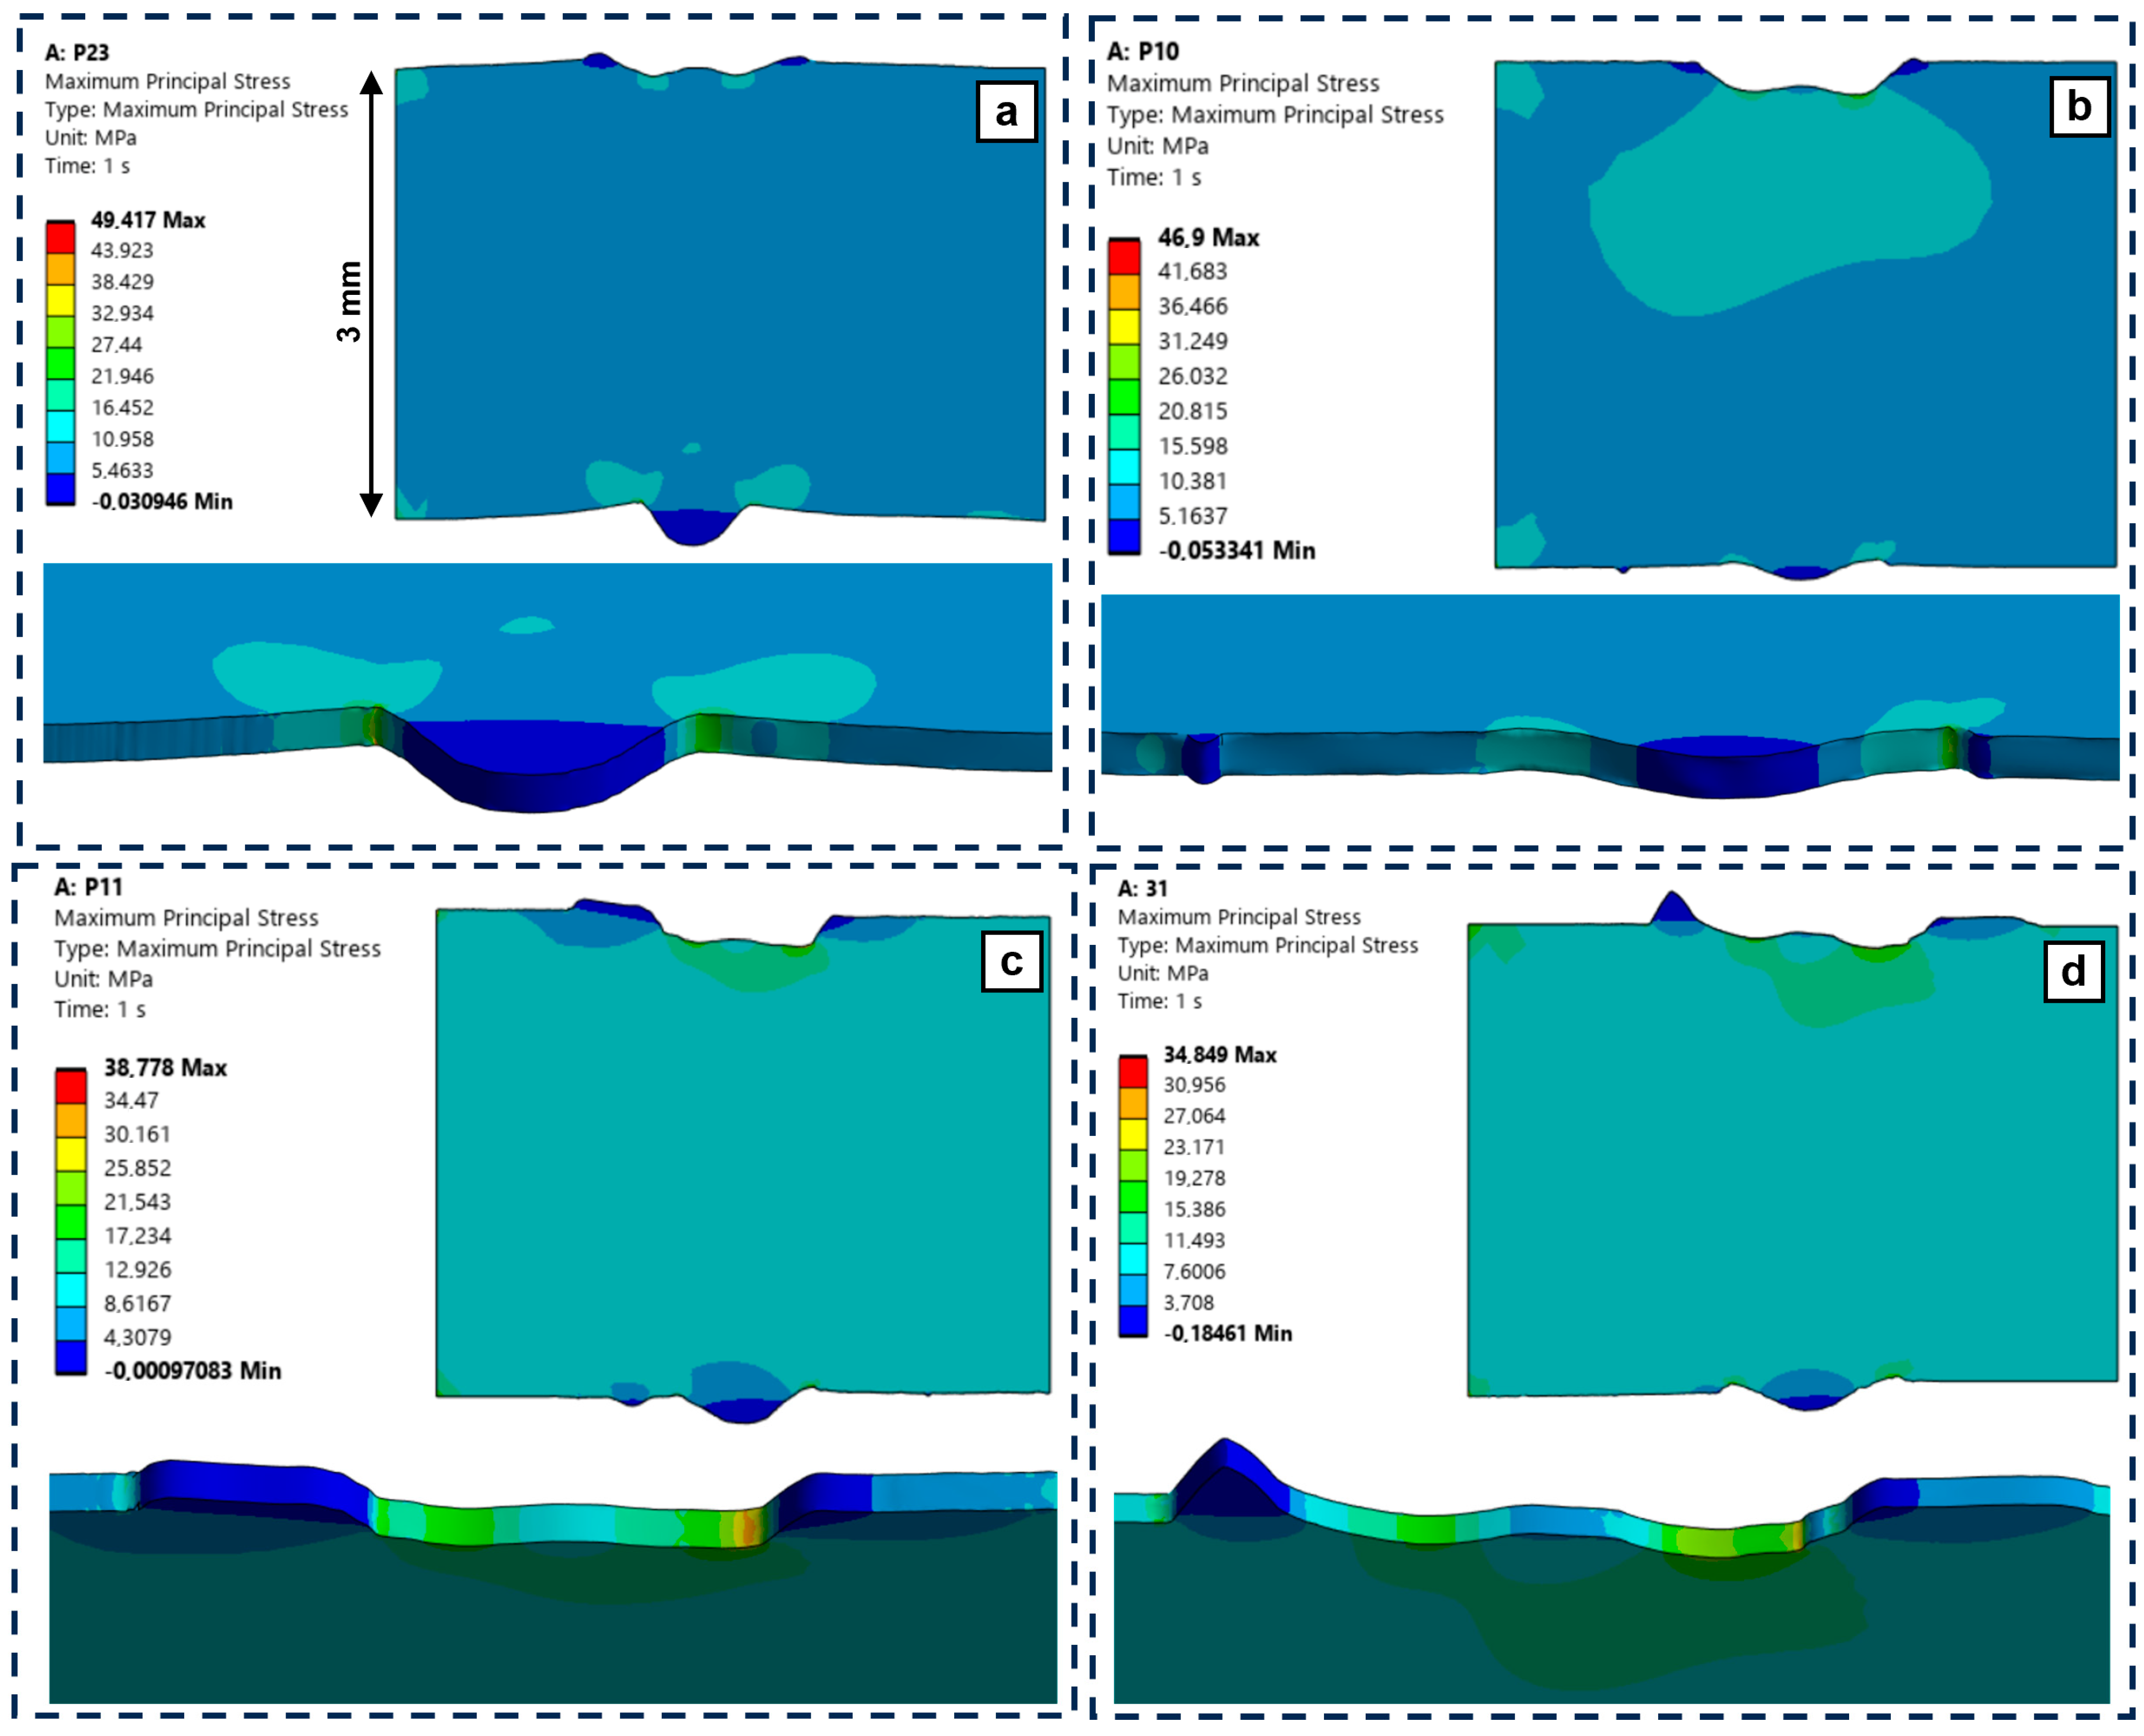
The results are shown in Table 9, while Figure 11 illustrates the maximum principal stress distribution and the sites of maximum stress concentration according to the numerical simulation. As can be seen in Table 9, the values of the stress concentration factor were relatively high, being higher than those produced in the lower profile due to the pronounced alpha angle in sample P23 and the undercut that tended to form in sample P10, while in the other samples, P11 and P31, the maximum stress concentrators were located in the upper profile and were due to the underfill. A tendency to decrease the value of the stress concentrator as the heat input increases could also be noticed, which may have been due to the fact that smoother transitions of the sections were achieved because the width of the beads increased, as found. However, this last found tendency requires further investigation.
Numerical methods are widely used to describe and analyze heat-affected processes, such as welding, metal cutting, heat treatment, and additive manufacturing, due to their ability to simulate complex thermal, mechanical, and metallurgical phenomena [48,49]. In this sense, it is recommended to extend its use to study defects produced during the welding process beyond modeling the welding profile.

4. Conclusions

In this work, for laser welded butt joints in 3 mm thick, high-strength–low-alloy steel over a range of heat inputs using a factorial experimental design, the local properties of the welded joints were characterized and the dependence on laser welding parameters was determined; the main findings are as follows:
  • The base metal microstructure, composed of elongated ferrite and bainite grains, evolved into different microstructures depending on their location in the weld joint and the heat input. For all heat inputs, the FG-HAZ evolved to small equiaxed ferrite and bainite grains, causing softening, and, in the CG-HAZ, to larger grains composed mainly of bainite and lath bainite, causing hardening. In the FZ evolved presenting large columnar grains that, as the heat input increased, blocks of lath-shaped bainite changed to granular bainite, hardening occurred, regardless of the amount of heat input.
  • As the heat input increased in the welding joints, the weld bead width, hardness, and mechanical properties resulting from the tensile test also increased. Concerning the base metal, the mechanical properties of the welded joints showed the following behavior: hardness decreased in the FG-HAZ, while it increased in the CG-HAZ and FZ; the ultimate tensile strength was equaled and even slightly exceeded for low heat inputs; the yield strength and the elongation percentage were lower for all heat inputs.
  • The factorial experimental design identified the main effects and interaction of laser power and welding speed on the imperfections and weld bead width. It was shown that there was an interaction on all three imperfections, while there was no interaction on weld bead width. ANOVA analysis revealed that underfill was affected by the interaction of the parameters, the excess weld by laser power, and α angle of the excess weld by the welding speed. The welding speed and the interaction turned out to be the most influential considering all the imperfections.
  • The values of the stress concentration factor Kt determined by FEM in the real profiles of the weld beads showed relatively high values, the stress concentration was both in the upper profile and lower profile, and there was a slight tendency to increase the value of Kt as the heat input decreased.

Author Contributions

Conceptualization, P.G.R.; methodology, P.G.R., G.O.B., F.O. and A.D.; software, G.O.B. and F.O.; validation, P.G.R. and F.O.; formal analysis, P.G.R. and G.O.B.; investigation, P.G.R. and A.D.; writing—original draft preparation, P.G.R.; writing—review and editing, G.O.B. and F.O. All authors have read and agreed to the published version of the manuscript.

Funding

The authors acknowledge the support provided by the Universidad de las Fuerzas Armadas ESPE.

Data Availability Statement

The raw data supporting the conclusions of this article will be made available by the authors on request.

Acknowledgments

The authors would like to thank the Universidad de las Fuerzas Armadas ESPE for supporting publishing research. To the Orthopedia Medica Company for laser welding manufacturing.

Conflicts of Interest

The authors declare no conflict of interest.

References

  1. Song, D.; Kim, R.; Choi, K.; Shin, D.; Lee, S. Effects of Beam Shape on the Microstructures and Mechanical Properties during Thin-Foil Laser Welding. Metals 2023, 13, 916. [Google Scholar] [CrossRef]
  2. Khan, M.S.; Soleimani, M.; Midawi, A.R.H.; Aderibigbe, I.; Zhou, Y.N.; Biro, E. A review on heat affected zone softening of dual-phase steels during laser welding. J. Manuf. Process. 2023, 102, 663–684. [Google Scholar] [CrossRef]
  3. Afkhami, S.; Javaheri, V.; Amraei, M.; Skriko, T.; Piili, H.; Zhao, X.L.; Björk, T. Thermomechanical simulation of the heat-affected zones in welded ultra-high strength steels: Microstructure and mechanical properties. Mater. Des. 2022, 213, 110336. [Google Scholar] [CrossRef]
  4. Yang, L.; Gao, S.; Huang, Y.; Sun, M.; Li, Y. Effect of microstructure on tensile and fatigue properties of laser-welded DP780 and DP980 high-strength steel joints. Mater. Sci. Eng. A 2019, 754, 535–555. [Google Scholar] [CrossRef]
  5. Zhao, W.; Wang, J.; Li, Z.; Gao, S. Effect of heat input on microstructure and corrosion resistance of high-nitrogen austenitic stainless steel welded joints. J. Phys. Conf. Ser. 2023, 2478, 122075. [Google Scholar] [CrossRef]
  6. Čapek, J.; Kec, J.; Trojan, K.; Černý, I.; Ganev, N.; Kolařík, K.; Němeček, S. Heat-Resistant Pressure Vessel Steel, Verification on Vessel Model. Metals 2022, 12, 1517. [Google Scholar] [CrossRef]
  7. Churiaque, C.; Sánchez-Amaya, J.M.; Porr, M.; Gumenyuk, A.; Rethmeier, M. The Effects of HLAW Parameters for One Side T-Joints in 15 mm Thickness Naval Steel. Metals 2021, 11, 600. [Google Scholar] [CrossRef]
  8. Ribeiro, H.V.; Reis Pereira Baptista, C.A.; Fernandes Lima, M.S.; Santos Torres, M.A.; Marcomini, J.B. Effect of laser welding heat input on fatigue crack growth and CTOD fracture toughness of HSLA steel joints. J. Mater. Res. Technol. 2021, 11, 801–810. [Google Scholar] [CrossRef]
  9. Vidal, J.G.; Barrionuevo, G.O.; Ramos-grez, J.A.; Vergara, J.; Mullo, J.L. Vibration-assisted laser welding: Frequency and amplitude vibration effect on the microhardness of A36 steel. Proc. Inst. Mech. Eng. Part L J. Mater. Des. Appl. 2022, 236, 2139–2149. [Google Scholar] [CrossRef]
  10. Mullo, J.L.; Ramos-Grez, J.; Barrionuevo, G.O. Effect of Laser Heat Treatment on the Mechanical Performance and Microstructural Evolution of AISI 1045 Steel-2017-T4 Aluminum Alloy Joints during Rotary Friction Welding. J. Mater. Eng. Perform. 2021, 30, 2617–2631. [Google Scholar] [CrossRef]
  11. Ma, B.; Gao, X.; Huang, Y.; Gao, P.P.; Zhang, Y. A review of laser welding for aluminium and copper dissimilar metals. Opt. Laser Technol. 2023, 167, 109721. [Google Scholar] [CrossRef]
  12. Chen, Y.; Xu, X.; Liu, Y.; Cui, H. A Comparative Study on Microstructural Characterization of Thick High Strength Low Alloy Steel Weld by Arc Welding and Laser Welding. Materials 2023, 16, 2212. [Google Scholar] [CrossRef] [PubMed]
  13. Cornacchia, G.; Cecchel, S. Study and characterization of EN AW 6181/6082-T6 and EN AC 42100-T6 aluminum alloy welding of structural applications: Metal inert gas (MIG), cold metal transfer (CMT), and fiber laser-MIG hybrid comparison. Metals 2020, 10, 441. [Google Scholar] [CrossRef]
  14. Paul, S.; Singh, R.; Yan, W. Lasers Based Manufacturing; Springer New Delhi: New Delhi, India, 2015; ISBN 978-81-322-2351-1. [Google Scholar]
  15. He, H.; Forouzan, F.; Volpp, J.; Robertson, S.M.; Vuorinen, E. Microstructure and mechanical properties of laser-welded DP steels used in the automotive industry. Materials 2021, 14, 456. [Google Scholar] [CrossRef]
  16. Sowards, J.W.; Pfeif, E.A.; Connolly, M.J.; McColskey, J.D.; Miller, S.L.; Simonds, B.J.; Fekete, J.R. Low-cycle fatigue behavior of fiber-laser welded, corrosion-resistant, high-strength low alloy sheet steel. Mater. Des. 2017, 121, 393–405. [Google Scholar] [CrossRef]
  17. Palanivel, R.; Dinaharan, I.; Laubscher, R.F. Microstructure and mechanical behavior of Nd:YAG laser beam welded high strength low alloy steel joints. Optik 2020, 208, 164050. [Google Scholar] [CrossRef]
  18. Chen, L.; Nie, P.; Qu, Z.; Ojo, O.A.; Xia, L.; Li, Z.; Huang, J. Influence of heat input on the changes in the microstructure and fracture behavior of laser welded 800MPa grade high-strength low-alloy steel. J. Manuf. Process. 2020, 50, 132–141. [Google Scholar] [CrossRef]
  19. Farabi, N.; Chen, D.L.; Zhou, Y. Fatigue properties of laser welded dual-phase steel joints. Procedia Eng. 2010, 2, 835–843. [Google Scholar] [CrossRef]
  20. Viňáš, J.; Brezinová, J.; Sailer, H.; Brezina, J.; Sahul, M.; Maruschak, P.; Prentkovskis, O. Properties evaluation of the welded joints made by disk laser. Materials 2021, 14, 2002. [Google Scholar] [CrossRef]
  21. Riofrío, P.G.; Antunes, F.; Ferreira, J.; Batista, A.C.; Capela, C. Fatigue performance of thin laser butt welds in HSLA steel. Metals 2021, 11, 1499. [Google Scholar] [CrossRef]
  22. Schork, B.; Kucharczyk, P.; Madia, M.; Zerbst, U.; Hensel, J.; Bernhard, J.; Tchuindjang, D.; Kaffenberger, M.; Oechsner, M. The effect of the local and global weld geometry as well as material defects on crack initiation and fatigue strength. Eng. Fract. Mech. 2018, 198, 103–122. [Google Scholar] [CrossRef]
  23. Guan, M.; Yu, H. Fatigue crack growth behaviors in hot-rolled low carbon steels: A comparison between ferrite–pearlite and ferrite–bainite microstructures. Mater. Sci. Eng. A 2013, 559, 875–881. [Google Scholar] [CrossRef]
  24. Li, S.; Kang, Y.; Kuang, S. Effects of microstructure on fatigue crack growth behavior in cold-rolled dual phase steels. Mater. Sci. Eng. A 2014, 612, 153–161. [Google Scholar] [CrossRef]
  25. Riofrío, P.G.; de Jesus, J.; Ferreira, J.A.M.; Capela, C. Influence of local properties on fatigue crack growth of laser butt welds in thin plates of high-strength low-alloy steel. Appl. Sci. 2021, 11, 7346. [Google Scholar] [CrossRef]
  26. Zhang, H.; Jiang, M.; Chen, X.; Wei, L.; Wang, S.; Jiang, Y.; Jiang, N.; Wang, Z.; Lei, Z.; Chen, Y. Investigation of Weld Root Defects in High-Power Full-Penetration Laser Welding of High-Strength Steel. Materials 2022, 15, 1095. [Google Scholar] [CrossRef]
  27. Riofrío, P.G.; Ferreira, J.A.M.; Capela, C.A. Imperfections and modelling of the weld bead profile of laser butt joints in hsla steel thin plate. Metals 2021, 11, 151. [Google Scholar] [CrossRef]
  28. Cui, S.; Pang, S.; Zhang, S.; Liao, Y.; Cai, H. Influence of Different Welding Parameters on the Morphology, Microstructure, and Mechanical Properties of 780 Duplex-Phase Steel Laser Lap Welded Joint. Materials 2022, 15, 3627. [Google Scholar] [CrossRef]
  29. Ai, Y.; Jiang, P.; Shao, X.; Wang, C.; Li, P.; Mi, G.; Liu, Y.; Liu, W. An optimization method for defects reduction in fiber laser keyhole welding. Appl. Phys. A 2015, 122, 31. [Google Scholar] [CrossRef]
  30. Guo, B.; Zhang, J.; Ananth, K.P.; Zhao, S.; Ji, X.; Bai, J. Stretchable, self-healing and biodegradable water-based heater produced by 3D printing. Compos. Part A Appl. Sci. Manuf. 2020, 133, 105863. [Google Scholar] [CrossRef]
  31. Khan, M.M.A.; Romoli, L.; Fiaschi, M.; Dini, G.; Sarri, F. Experimental design approach to the process parameter optimization for laser welding of martensitic stainless steels in a constrained overlap configuration. Opt. Laser Technol. 2011, 43, 158–172. [Google Scholar] [CrossRef]
  32. Rehman, A.; Lathkar, G.S.; Zubairuddin, M. Finite element analysis of laser welding of 304L butt joint. Mater. Today Proc. 2023. [Google Scholar] [CrossRef]
  33. Aberbache, H.; Mathieu, A.; Bolot, R.; Bleurvacq, L.; Corolleur, A.; Laurent, F. Experimental analysis and numerical simulation of Laser welding of thin austenitic stainless-steel sheets using two models: Bilinear isotropic strain hardening model and Johnson–Cook model. J. Adv. Join. Process. 2024, 9, 100198. [Google Scholar] [CrossRef]
  34. STRENX. “Strenx®700 MC”, SSAB. Available online: https://www.ssab.com/en/brands-and-products/strenx (accessed on 25 September 2024).
  35. Mičian, M.; Frátrik, M.; Brůna, M. Softening effect in the heat-affected zone of laser-welded joints of high-strength low-alloyed steels. Weld. World 2024, 68, 1497–1514. [Google Scholar] [CrossRef]
  36. Xie, W.; Tu, H.; Nian, K.; Zhang, X. Microstructure and mechanical properties of laser beam welded 10 mm-thick Q345 steel joints. Weld. Int. 2024, 38, 34–44. [Google Scholar] [CrossRef]
  37. Górka, J. Assessment of steel subjected to the thermomechanical control process with respect to weldability. Metals 2018, 8, 169. [Google Scholar] [CrossRef]
  38. Bayock, F.N.; Kah, P.; Mvola, B.; Layus, P. Effect of Heat Input and Undermatched Filler Wire on the Microstructure and Mechanical Properties of dissimilar S700MC/S960QC high-strength steels. Metals 2019, 883, 10. [Google Scholar] [CrossRef]
  39. Chen, S.; Hu, J.; Shan, L.; Wang, C.; Zhao, X.; Xu, W. Characteristics of bainitic transformation and its effects on the mechanical properties in quenching and partitioning steels. Mater. Sci. Eng. A 2021, 803, 140706. [Google Scholar] [CrossRef]
  40. Lun, N.; Saha, D.C.; Macwan, A.; Pan, H.; Wang, L.; Goodwin, F.; Zhou, Y. Microstructure and mechanical properties of fibre laser welded medium manganese TRIP steel. Mater. Des. 2017, 131, 450–459. [Google Scholar] [CrossRef]
  41. Yakubtsov, I.A.; Poruks, P.; Boyd, J.D. Microstructure and mechanical properties of bainitic low carbon high strength plate steels. Mater. Sci. Eng. A 2008, 480, 109–116. [Google Scholar] [CrossRef]
  42. Olasolo, M.; Uranga, P.; Rodriguez-Ibabe, J.M.; López, B. Effect of austenite microstructure and cooling rate on transformation characteristics in a low carbon Nb–V microalloyed steel. Mater. Sci. Eng. A 2011, 528, 2559–2569. [Google Scholar] [CrossRef]
  43. Sanati, S.; Nabavi, S.F.; Esmaili, R.; Farshidianfar, A.; Dalir, H. A Comprehensive Review of Laser Wobble Welding Processes in Metal Materials: Processing Parameters and Practical Applications. Lasers Manuf. Mater. Process. 2024, 11, 492–528. [Google Scholar] [CrossRef]
  44. Guo, W.; Crowther, D.; Francis, J.A.; Thompson, A.; Liu, Z.; Li, L. Microstructure and mechanical properties of laser welded S960 high strength steel. Mater. Des. 2015, 85, 534–548. [Google Scholar] [CrossRef]
  45. Zhang, P.; Laleh, M.; Hughes, A.E.; Marceau, R.K.W.; Hilditch, T.; Tan, M.Y. Effect of microstructure on hydrogen embrittlement and hydrogen-induced cracking behaviour of a high-strength pipeline steel weldment. Corros. Sci. 2024, 227, 111764. [Google Scholar] [CrossRef]
  46. Rudzinskas, V.; Kapustynskyi, O. The Role of Welding Parameters in Hydrogen Embrittlement Mitigation: A Case Study in Steel. Res. Rev. Int. J. Multidiscip. 2024, 9, 203–212. [Google Scholar] [CrossRef]
  47. Montgomery, D.C. Design and Analysis of Experiments; John Wiley & Sons: Hoboken, NJ, USA, 2017; Volume 106, ISBN 9781119113478. [Google Scholar]
  48. Behúlová, M.; Babalová, E. Heat source models for numerical simulation of laser welding processes—A short review. J. Phys. Conf. Ser. 2024, 2712, 012018. [Google Scholar] [CrossRef]
  49. Barrionuevo, G.O.; Ramos-Grez, J.; Walczak, M.; La Fé-Perdomo, I. Numerical analysis of the effect of processing parameters on the microstructure of stainless steel 316L manufactured by laser-based powder bed fusion. Mater. Today Proc. 2021, 59, 93–100. [Google Scholar] [CrossRef]
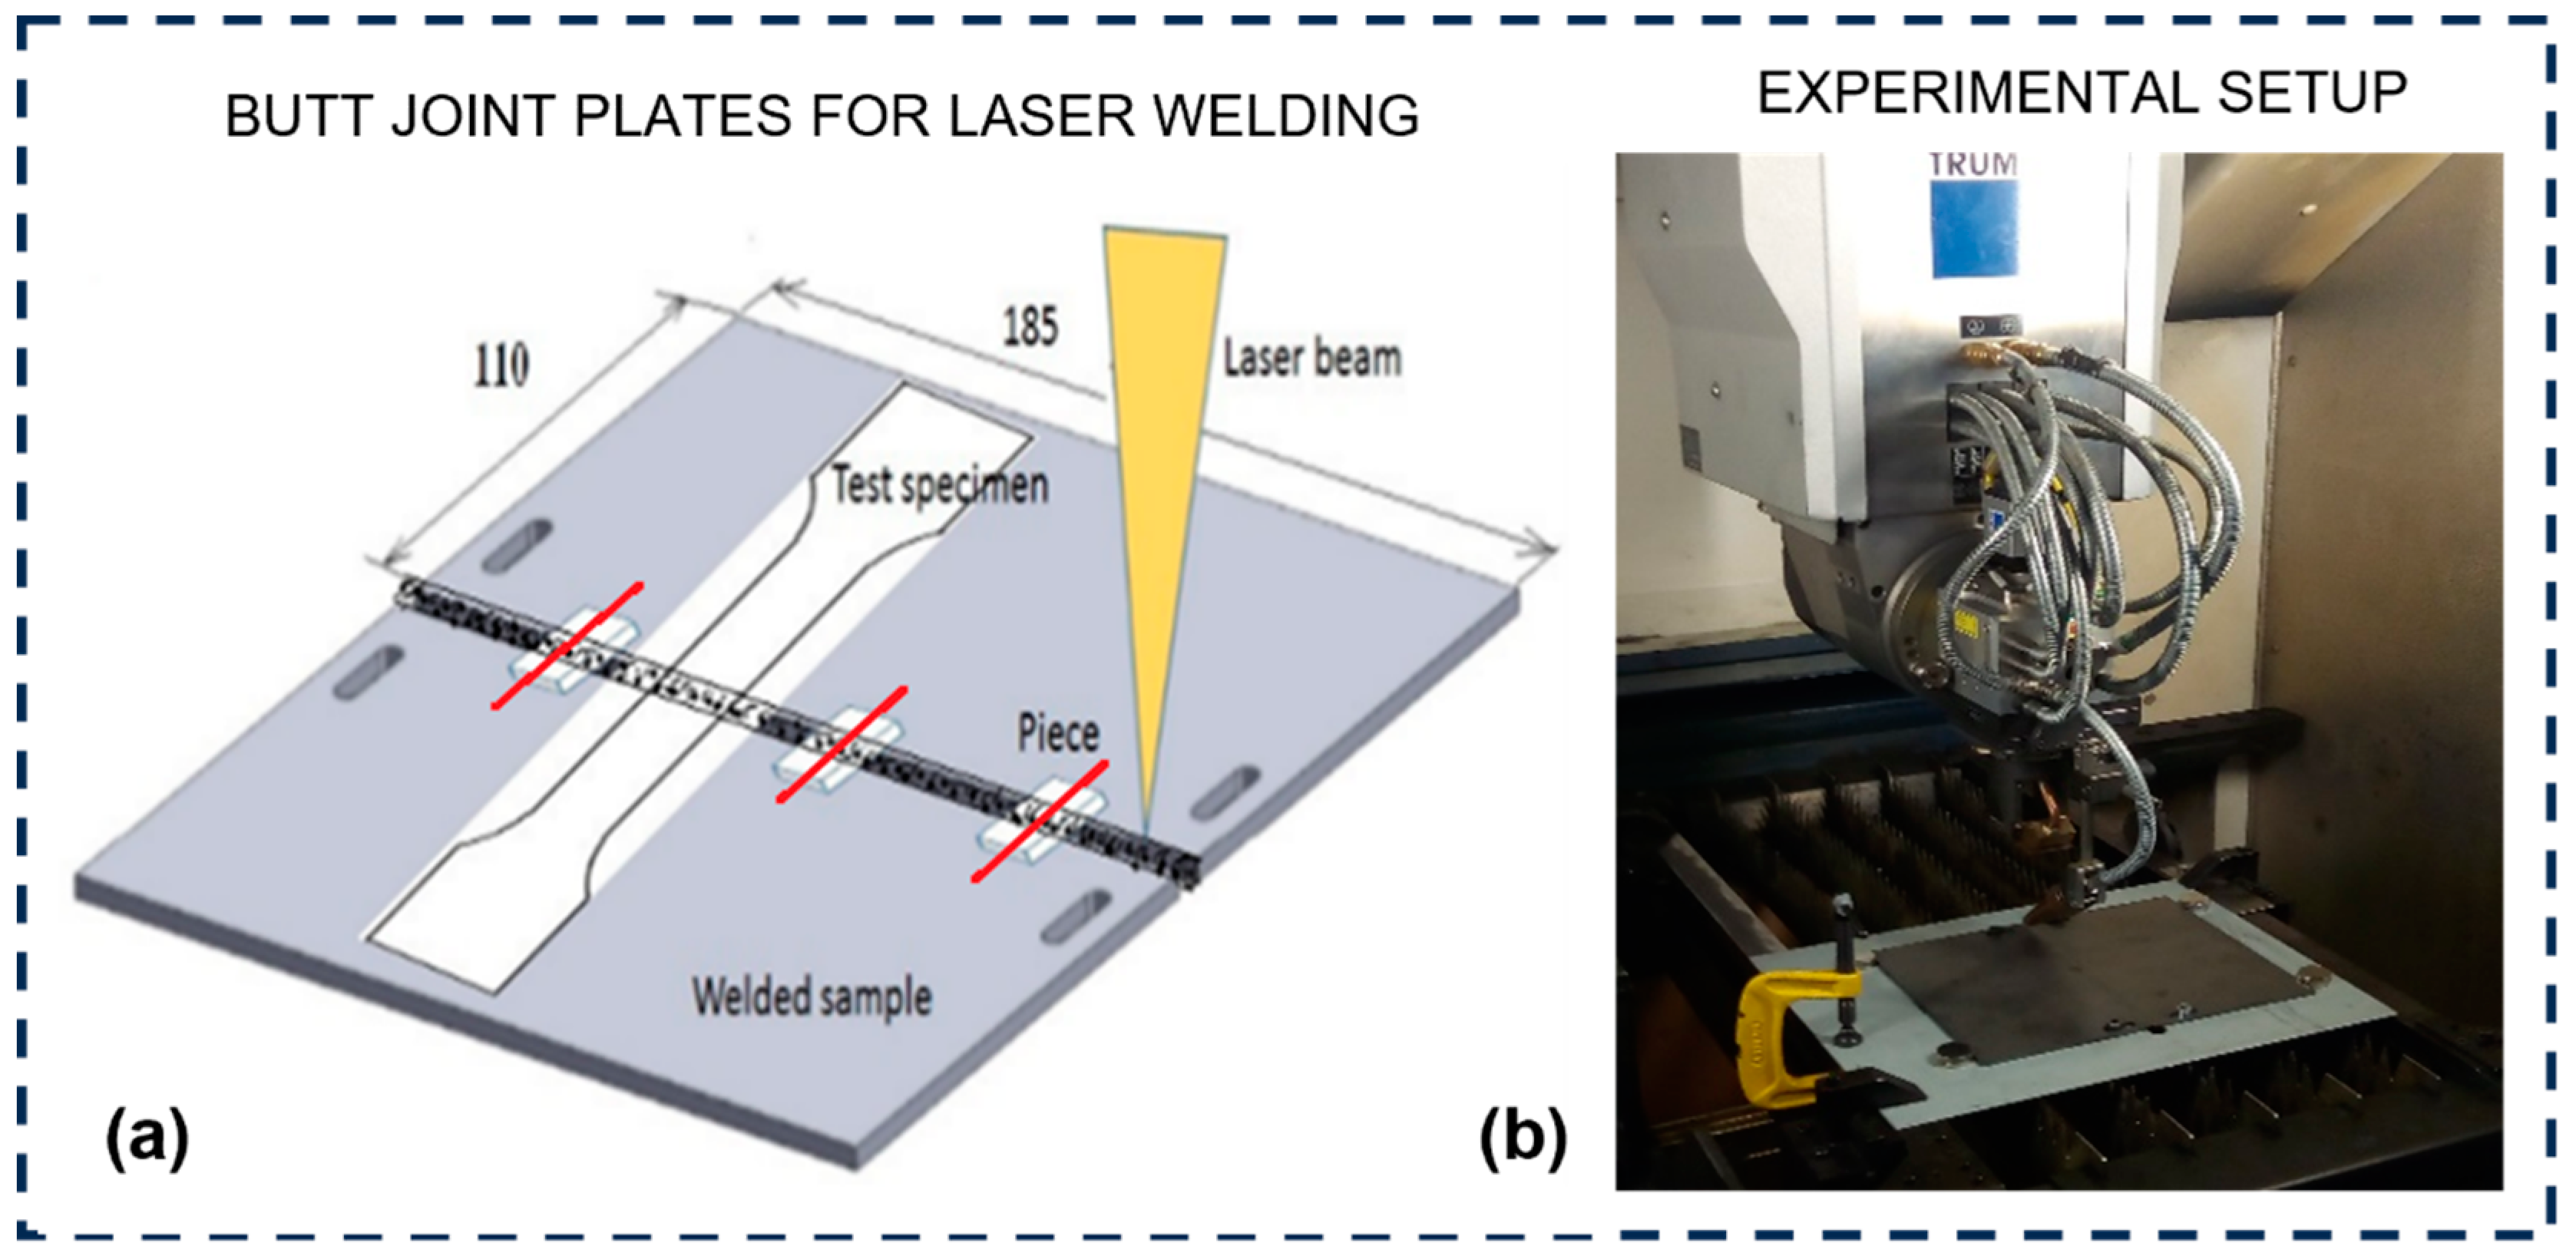
Figure 1. (a) Scheme of arrangement of butt joint plates for laser welding, (b) experimental setup of the laser equipment used in the experimental work.
Metals 14 01219 g001
Figure 2. (a) Schematic representation of the weld bead during laser welding (b) and of weld bead geometry measurements.
Metals 14 01219 g002
Figure 3. Weld profile models of the welded samples and details of meshing used in FEM. (a) boundary conditions (b) Mesh detail.
Metals 14 01219 g003
Figure 4. Appearance of the welding seams (top (a) and bottom (b)), cross-sections of the weld beads (c), and upper and lower profiles of the weld beads captured with a profilometer (d). From left to right, heat input (75, 66, 60, and 53 J/mm).
Metals 14 01219 g004
Figure 5. Optical macrography of the weld bead (sample P10) showing the weld zones at (a) low magnification and (b) at high magnification.
Metals 14 01219 g005
Figure 6. SEM micrographs (low magnification above, high magnification below) of welded sample P10: (a) BM, (b) FG-HAZ, and (c) CG-HAZ.
Metals 14 01219 g006
Figure 7. SEM micrographs of FZ (low magnification left, high magnification right) of sample P23 (a,b), sample P10 (c,d), sample P11 (e,f), and sample P31 (g,h).
Metals 14 01219 g007aMetals 14 01219 g007b
Figure 8. Microhardness profiles of the welded samples.
Metals 14 01219 g008
Figure 9. Stress–strain curves of the welded samples and base metal.
Metals 14 01219 g009
Figure 10. Main effects and interactions of laser power and welding speed on: (a) underfill, (b) excess weld, (c) angle of excess weld, and (d) width W of the HAZ.
Metals 14 01219 g010
Figure 11. Maximum principal stress distribution on the weld profile models through the FEM. (a) Sample P23, (b) Sample P10, (c) Sample P11, (d) Sample P31.
Metals 14 01219 g011
Table 1. Chemical composition of base metal.
CMnSiPSCrVNbNiCuAlMoTiCoFe
Exp.0.071.690.010.0120.0060.030.020.0460.040.0110.0440.0160.1170.016balanced
D.S.*0.122.10.210.0200.01-0.200.09--0.015-0.15-balanced
D.S.* maximum values except for Al being minimum.
Table 2. Mechanical properties of base metal.
Yield Strength (MPa)Ultimate Tensile Strength (MPa)Elongation
(%)
Exp.75180818.2
D.S.700750–95012
Table 3. Laser welding parameters used in the experimental work.
Sample DesignationPower
(kW)
Welding Speed
(m/min)
Heat Input
(J/mm)
P231.752.053
P102.002.060
P111.751.666
P312.001.675
Table 4. Mechanical properties and heat input of the welded samples and BM.
Sample DesignationYield Strength (MPa)Ultimate Tensile Strength
(MPa)
Elongation
(%)
Heat Input
(J/mm)
BM75180818.2--
P2373882014.453
P1073781515.060
P1172779714.866
P3172378714.175
Table 5. Average values of imperfections and width W of the HAZ-FZ of the welded samples.
SampleWelding Parameters
P (kW); v (m/min); HI (J/mm)
Width
(mm)
Underfill (µm)Excess Weld (µm)Angle
(Degrees)
P 312.00; 1.60; 752.10−16220227
P 111.75; 1.60; 661.98−20410226
P 102.00; 2.00; 601.81−16419431
P 231.75; 2.00; 531.72−7718052
Table 6. ANOVA for Excess Weld.
Source of
Variation
Sum of SquaresDegrees of
Freedom
Mean SquareFop-ValueTest the
Hypothesis
Power9.68719.68744.20.0002Rejected
Welding speed3.66313.66316.70.0035Rejected
Interaction5.64515.64525.70.0010Rejected
Error1.7548219
Total20.74911
Table 7. ANOVA for Underfill.
Source of
Variation
Sum of SquaresDegrees of FreedomMean SquareFop-ValueTest the
Hypothesis
Power1416114161.40.2687Not Rejected
Welding speed11,633111,63311.60.0093Rejected
Interaction12,470112,47012.40.0078Rejected
Error802081003
Total33,54011
Table 8. ANOVA for Angle α.
Source of
Variation
Sum of SquaresDegrees of
Freedom
Mean SquareFop-ValueTest the
Hypothesis
Power316131614.10.0056Rejected
Welding speed694169430.90.0005Rejected
Interaction362136216.10.0038Rejected
Error179822
Total155111
Table 9. Stress concentration factor results.
SampleHeat Input
(J/mm)
Maximum Equivalent Stress
(MPa)
Stress Concentration
Factor-Kt
Maximum Stress
Location
P235332.443.24Lower profile, weld root
P106029.782.98Lower profile, weld root
P116631.773.18Upper profile,
underfill
P317527.532.75Upper profile,
underfill
Disclaimer/Publisher’s Note: The statements, opinions and data contained in all publications are solely those of the individual author(s) and contributor(s) and not of MDPI and/or the editor(s). MDPI and/or the editor(s) disclaim responsibility for any injury to people or property resulting from any ideas, methods, instructions or products referred to in the content.