Article

Deformation Behaviors and Microstructure Evolution of Mg-Zn-Y-Zr Alloys During Hot Compression Process

1
School of Materials and Chemistry, University of Shanghai for Science and Technology, Shanghai 200093, China
2
School of Materials Science and Engineering, Shanghai Jiao Tong University, Shanghai 200240, China
3
Key Laboratory of Materials and Surface Technology (Ministry of Education), School of Materials Science and Engineering, Xihua University, Chengdu 610097, China
*
Author to whom correspondence should be addressed.
Metals 2024, 14(12), 1332; https://doi.org/10.3390/met14121332
Submission received: 14 October 2024 / Revised: 22 November 2024 / Accepted: 22 November 2024 / Published: 24 November 2024

Abstract

:
This study investigated the thermal compression deformability of the low-alloyed Mg-Zn-Y-Zr magnesium alloy temperatures ranging from 300 to 450 °C, and strain rates between 0.01 s−1 and 1 s−1. A hot processing map was established using a novel constitutive model. The results demonstrate that the flow stress of the low-alloyed Mg-Zn-Y-Zr alloy is markedly affected by the deformation temperature and strain rate, predominantly manifesting characteristics of work hardening (WH) and dynamic recrystallization-induced softening. The high-temperature rheological behavior of the alloy is accurately portrayed with a constitutive model, with an activation energy measured at 287 kJ/mol. The mechanism of dynamic recrystallization (DRX) gradually shifts from twinning dynamic recrystallization (TDRX) to continuous dynamic recrystallization (CDRX) and discontinuous dynamic recrystallization (DDRX). At 400 °C, as the strain rate decreases, the I-phase in the microstructure gradually transforms into the W-phase, weakening the inhibitory effect on DRX grain growth.

1. Introduction

With an elastic modulus similar to human tissue, excellent biodegradability, and biocompatibility, magnesium alloys are considered to hold significant promise for biomedical applications [1,2,3]. In recent years, high-strength Mg-Zn-Y-Zr (ZWK) alloys have been developed utilizing the age-hardening effect of the Zn element and the strengthening effect of the quasicrystalline phase (I-Mg3Zn6Y). It has gradually gained widespread attention in the medical field, such as through hemostatic clips, suturing needles, and cardiovascular stents [4,5,6].
Rare-earth elements are one of the important additives in magnesium alloys. The addition of the rare-earth element Y significantly improves its mechanical properties and biocompatibility at room temperature and high temperature. Research on Y-containing magnesium alloys has shown that their yield strength can reach up to 400 MPa [7,8]. Currently, most ZWK alloys use high contents of Zn and Y elements. However, a high content of Zn leads to increasing the alloy’s susceptibility to hot cracking and poor processability, becoming a major bottleneck in its application. At the same time, the high content of rare-earth element Y significantly increases the cost of the alloy. On the other hand, low alloying can effectively weaken the texture of magnesium alloys and hinder grain growth, thereby improving their formability. Therefore, the development of low-alloyed ZWK magnesium alloys with good processability has become a new research focus [9,10].
There are three equilibrium phases in Mg-Zn-Y magnesium alloys, namely Mg3Zn6Y (I-phase), Mg3Zn3Y2 (W-phase), and Mg12ZnY (long-period stacking order, LPSO-Z phase). The alloy’s phase composition changes as the Y/Zn atomic ratio increases, transitioning from α-Mg + I, α-Mg + I + W, α-Mg + W, α-Mg + W + Z to α-Mg + Z [11]. Quasicrystal I-phase is the main reinforcement phase in Mg-Zn-Y alloys. It has a strong pinning effect on the grain boundary, which inhibits grain growth and refines grain size, thus improving the mechanical properties of the alloy [12].
The W-phase will form preferentially at the grain boundary and is incoherent with the matrix, resulting in weak interface bonding and thus reducing the plasticity and other mechanical properties of the alloy [13]. As a new effective strengthening phase, the LPSO phase has the functions of grain refinement, coordinated deformation, and dispersion strengthening. The continuous network block LPSO phase often causes the alloy plasticity to decrease, while the dispersed lamellar LPSO phase can effectively improve the strength and plasticity of the alloy [14]. However, the addition of high concentrations of alloying elements leads to the formation of more secondary phases in the magnesium alloy. These secondary phases tend to cause stress concentration during deformation, which can result in crack initiation and propagation, ultimately leading to alloy fracture. As a result, it is difficult for traditional high-alloyed magnesium alloys to achieve a balance between high strength and excellent plasticity [15,16]. In contrast, low-alloyed ZWK magnesium alloys can significantly reduce the formation and precipitation of secondary phases, which helps improve the processing performance of the magnesium alloy [16,17,18].
Because of the HCP structure and low stacking fault energy of magnesium alloys, the deformation of components at low temperatures poses significant challenges. At elevated temperatures, magnesium alloys can obtain additional slip systems, thereby significantly improving their processability [19,20]. During thermoplastic processing, Mg-Zn-Y-Zr alloys undergo complex processes such as WH, dynamic recovery (DRV), and DRX [21,22,23,24,25]. The hot deformation behavior and microstructure evolution are affected by many factors, such as deformation degree, deformation temperature, and strain rate. Previous studies have found that the precipitate phases in ZWK alloys change under different extrusion temperatures [26,27].
Additionally, the precipitate phases in ZWK alloys can influence the orientation of recrystallized grains by either inhibiting or inducing recrystallization nucleation and growth. The formation of precipitate phases has a profound impact on the alloy’s performance [28,29]. Xu et al. [30] studied the low-speed extrusion of Mg-Zn-Y-Zr at different temperatures. The microstructure of the extruded alloy was composed of fine DRX recrystallized grains and long non-DRX grains. The study found that the broken W-phase after extrusion promoted the occurrence of DRX. At the same time, with the decrease in extrusion temperature, the average size and volume fraction of DRX grains decreased. The extruded alloy had excellent mechanical properties at 300 °C, with a tensile strength, yield strength, and elongation of 347.1MPa, 329.3MPa, and 12.8%, respectively. At the same time, Zhang et al. [31] found that DRX at the α-Mg/18R-LPSO phase interface belongs to the DDRX mechanism, and DRX at the a-Mg/14H-LPSO interface belongs to the CDRX mechanism through the backward extrusion of the Mg-Zn-Y-Zr alloy. With the increase in strain, high-density dislocations are easily generated at the a-Mg/18R-LPSO interface, which promotes the occurrence of DDRX. With the increase in strain, the kink angle of the 14H-LPSO layer gradually increases, which promotes the nucleation of CDRX grains at the boundary of the kink band. Therefore, it is necessary to investigate the effects of deformation conditions on the microstructure evolution and the flow behavior during the hot working process of the low-alloyed Mg-Zn-Y-Zr alloy.
In this paper, the low-alloyed ZWK alloy was selected, and an examination was conducted on its thermal deformation characteristics using hot compression trials within the temperature range of 300 to 450 °C and strain rates varying from 0.01 to 1 s−1. The effects of the temperature and strain rate on the microstructure and DRX behavior of this alloy were investigated by optical microscopy (OM), transmission electron microscopy (TEM), and electron backscatter diffraction (EBSD) techniques. Through the utilization of an Arrhenius equation and Zener–Hollomon parameters, a constitutive equation was formulated.

2. Materials and Methods

2.1. Materials Preparation

Alloy ingots of Mg-3Zn-0.5Y-0.5Zr (ZW305K) were prepared in an electric resistance furnace with lumpy pure Mg (99.5 wt.%), pure Zn (99.5 wt.%), Mg-Y (25 wt.%) master alloy, and Mg-Zr (30 wt.%) master alloy. The mixed protective gas (1 vol.% SF6 + 99 vol.% CO2) needed to be introduced during the smelting process to prevent combustion. The chemical composition of ZW305K used in the test measured by ICP-AES (7300DV, PerkinElmer, MA, USA) is shown in Table 1. At 480 °C, the ZW305K ingots underwent solid solution treatment for a duration of 10 h, followed by a water-cooling process.

2.2. Thermal Compression Test

With the use of athermal simulation test machine (Gleeble-3800, DSI, NY, USA), a thermal compression test was conducted. After undergoing a solution treatment, the ZW305K magnesium alloy was transformed through wire cutting into a cylindrical sample measuring Ø8 × 12 mm. Before the experiment, the surface of the specimen was polished clean with sandpaper, and then a heating resistance wire was welded onto the cylindrical surface of the specimen. To reduce some uneven deformations of the sample caused by friction factors and the occurrence of severe deformation, graphite lubricant was evenly applied at the contact position between the indenter and both ends of the sample before the experiment to reduce friction. Finally, the sample was installed on the thermal simulation testing machine device, and the resistance wire was connected. Thermal compression deformations were performed at temperatures of 300 °C, 350 °C, 400 °C, and 450 °C, with strain rates of 0.01 s−1, 0.1 s−1, and 1 s−1. The strain was set at 0.5. Prior to compression, the sample was heated at a rate of 10 °C/s. Upon reaching the compression temperature, a 3 min warm-holding period was conducted. Immediate water quenching was performed post thermal deformation to maintain the microstructure. The thermal compression process illustration can be referred to in Figure 1.

2.3. Characterization

The microstructures of the as-cast and solution-treated samples were observed using an optical microscope (OM, Leica Dmi-8, Wetzlar, Germany) and a scanning electron microscope (SEM, Quanta 450, FEI, Hillsboro, OR, USA). The samples were mechanically polished using #240 to #7000 SiC sandpaper and a diamond polishing agent with a particle size of 0.25 μm. Subsequently, they were etched for 40 s using an etchant composed of 29.4 g of picric acid, 41 mL of distilled water, 50 mL of acetic acid, and 350 mL of anhydrous ethanol. X-ray diffraction patterns were obtained from the polished specimen surfaces at room temperature using an X-ray diffractometer (XRD, D8 Advance, Bruker, Karlsruhe, Germany) with Cu Kα radiation, operating at 40 kV and 40 mA, a scanning speed of 2°/min, and a scanning range of 20–90 °C.
For electron backscatter diffraction (EBSD), the samples were electrolytically polished at room temperature using a solution of 60% methanol, 30% n-butanol, and 10% perchloric acid. After polishing, the samples were rinsed with anhydrous ethanol. The polishing process was carried out at a current of 0.05 A and a voltage of 15 V for 90 s. The polished samples were analyzed using a SEM (Nova NanoSEM 450, FEI, Hillsboro, OR, USA) equipped with a fast EBSD detector (NordlysMax3, Oxford Instruments, Oxford, UK). The acceleration voltage was set to 20 kV, the sample tilt angle to 70°, and the scanning step size to 0.5 μm.
The alloy’s second phase and micromorphology were analyzed using a high-resolution transmission electron microscope (TEM, TECHAIG2S-TWIN, FEI, Hillsboro, OR, USA) equipped with an energy-dispersive X-ray spectroscopy detector (EDS, Super-X, FEI, Hillsboro, OR, USA). TEM samples were prepared by polishing and ion milling. Coarse grinding was performed using 400#–3000# sandpaper to reduce the thickness to 1 mm, followed by fine grinding with 5000#–7000# sandpaper to achieve a thickness of approximately 50 μm while ensuring uniform pressure to prevent warping. Finally, the samples were punched into three circular disks, each 3 mm in diameter, and further thinned using an ion milling instrument, completing the preparation process.

3. Results and Discussion

3.1. Microstructure of Initial State

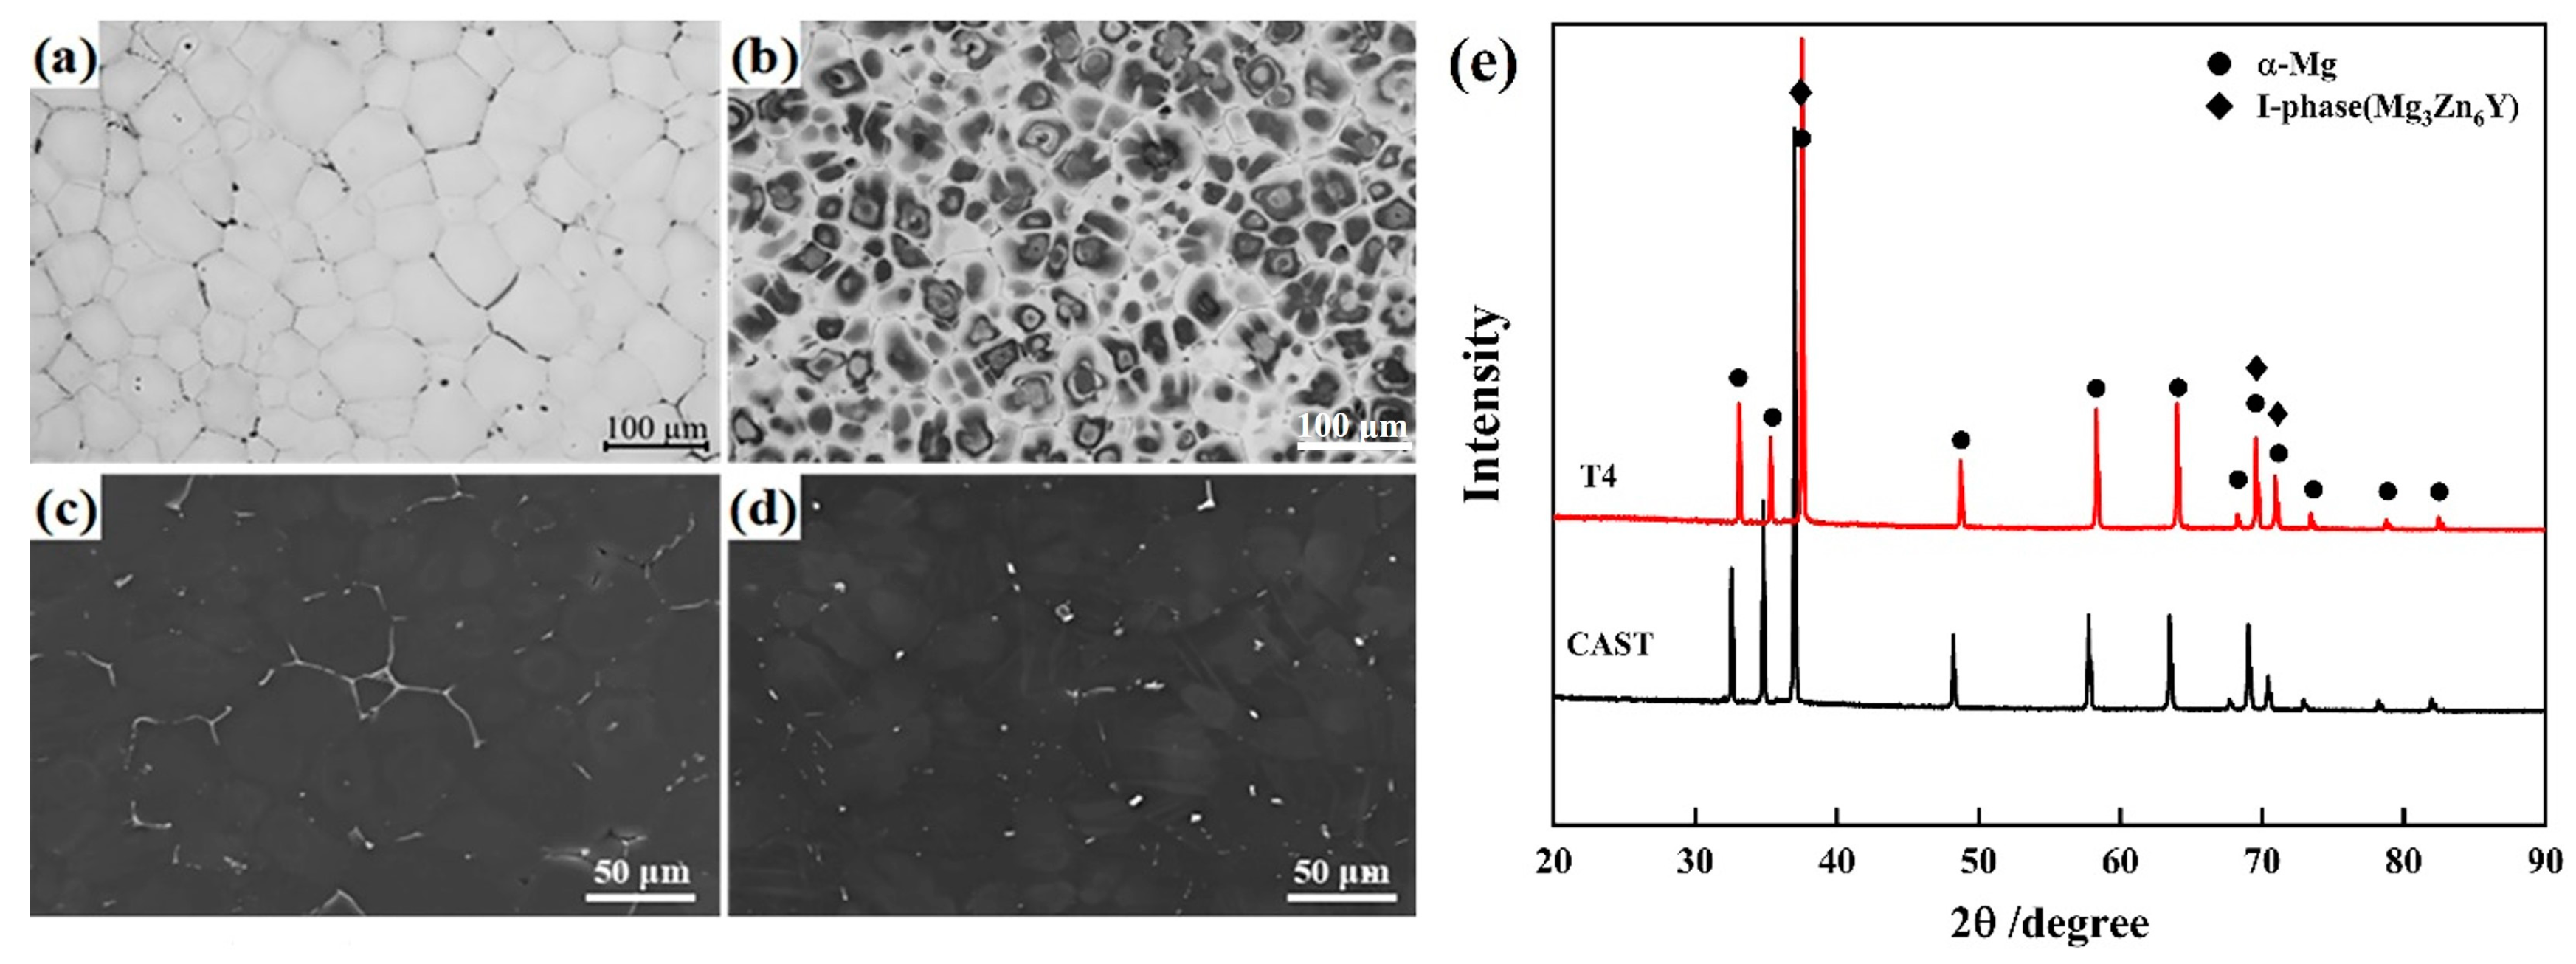
The microstructures of the as-cast and solid solution states are shown in Figure 2. It can be observed from Figure 2a,c that the grains of the as-cast alloy are equiaxed, with an uneven size distribution. This structure mainly consists of an α-Mg matrix, with a secondary phase dispersed intermittently around the grain boundaries, accompanied by Zr cores that are heterogeneously nucleated within the matrix. After solid solution treatment, there is minimal change in the morphology of the alloy structure, which remains equiaxed grains. However, the grain size becomes more uniform, and the continuous network-like second phase along grain boundaries has decomposed into fine particle phases. From Figure 2b,d, we can see that after solution treatment at 480 °C, rose-like patches appear within the matrix, which are the Zn-Zr phases precipitated from the matrix [32]. XRD analysis reveals that the microstructure of the alloy, both as-cast and in solid solution, primarily consists of an α-Mg matrix and the I-phase, with the I-phase serving as an intermediary phase, as depicted in Figure 2e.

3.2. True Stress–Strain Curves

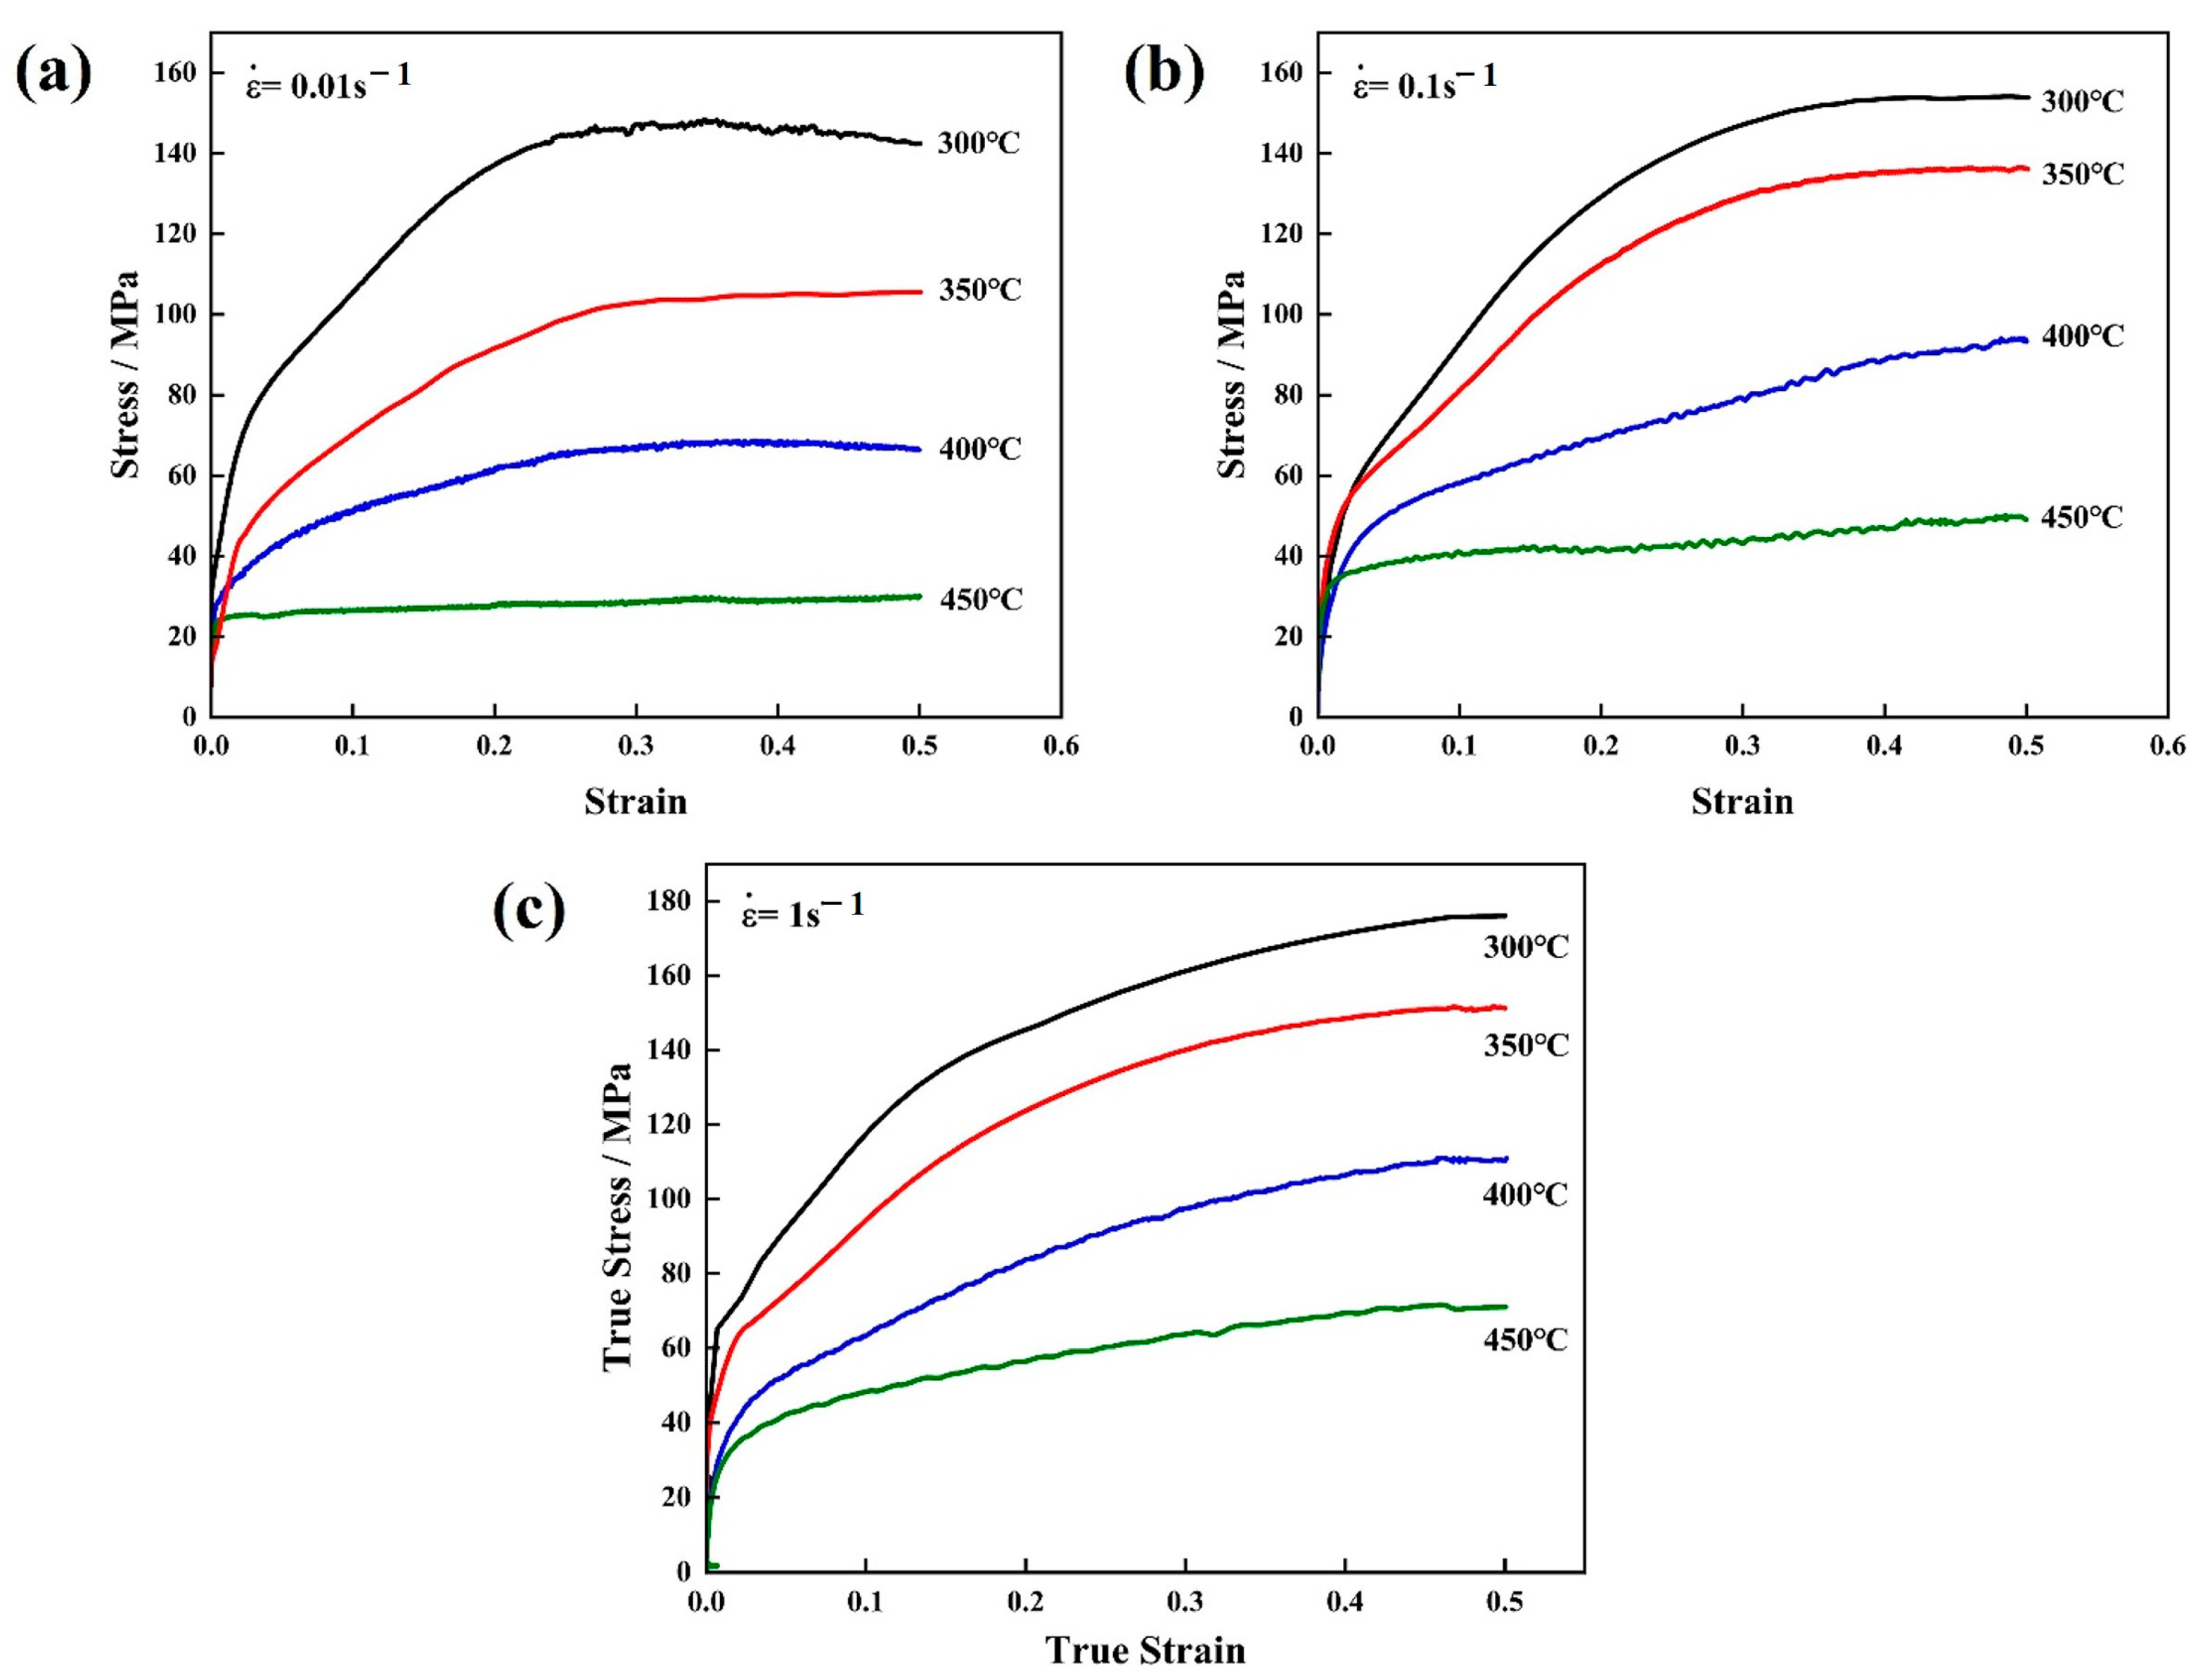
Stress–strain data for the ZW305K alloy are depicted in Figure 3. As shown in Figure 3a, the true stress–true strain curve of the ZW305K magnesium alloy at 300 °C and a strain rate of 0.01 s−1 illustrates DRX behavior. Initially, WH is primarily observed, causing a continuous rise in flow stress as deformation progresses. This is attributed to the accumulation and entanglement of dislocations inside the crystal, which hinders dislocation motion, resulting in a gradual increase in work hardening, far exceeding the softening effect, and causing rapid stress rise [33]. As strain increases, the dislocation density gradually rises. Upon reaching a certain level of compression, the energy necessary for DRX is attained and the alloy undergoes dynamic recovery (DRV). During DRV, the consumption of dislocations begins, leading to a gradual slowdown in the rate of stress increase. When the effects of DRV and DRX counterbalance the WH effect, the flow stress peaks and then stabilizes. When softening greatly exceeds WH, the flow stress decreases rapidly, showing a distinct DRX-type curve [34,35,36].
Figure 3 displays noticeable impacts of the deformation temperature and strain rate on the material’s flow characteristics. Lowering the deformation temperature and raising the strain rate results in higher peak stress levels for the ZW305K magnesium alloy. At a constant temperature, the flow stress increases markedly with rising strain rates. Specifically, with the increase in strain rate from 0.01 to 1 s−1, the peak stress gradually rises. This is attributed to the fact that the rise in strain rate results in the accumulation of numerous dislocations in the material. These dislocations are unable to move promptly and eventually become tangled, thereby hindering the dislocation movement. This boosts the WH effect, resulting in increased flow stress. Meanwhile, at a consistent strain rate, the flow stress diminishes as temperature rises. This appearance occurs due to the rise in deformation temperature, which boosts the efficiency of atomic diffusion, augments the quantity of active slip systems, hastens the movement of dislocations, and intensifies the impacts of DRV and DRX, ultimately resulting in heightened softening [37].

3.3. Constitutive Strain-Dependent Equation

At elevated temperatures, the ZW305K alloy exhibits high sensitivity to stress, showing complex nonlinear flow behavior, especially under high deformation temperatures and strain rates. The modified Arrhenius equation replaces the simple stress exponent with a hyperbolic sine term, making it more suitable for describing this nonlinearity under high-stress conditions and thus enhancing the predictive accuracy. Equation (1) illustrates this relationship [38]:
ε ˙ = A   [ sin h α σ ] n exp   Q / R T
In Equations (1)–(3), ε ˙ is the strain rate, unit s−1; σ is flow stress, unit MPa; R is the gas constant: 8.314 kJ//mol; T is the deformation temperature; Q is the thermal deformation activation energy; and A, α, β, n, and n1 are all material constants, where α = β/n1;
There are different functional relationships under different high- and low-stress conditions. The σ and ε ˙ under different conditions follow different functional relationships, respectively [39]:
Under low-stress conditions, the exponential model is used as shown in Equation (2):
ε ˙ = A 1 σ n 1                                     α σ < 0.8
Under high-stress conditions, the power exponential model is used as shown in Equation (3):
ε ˙ = A 2 exp β σ                                     0.8 < α σ < 1.2
By applying the natural logarithm to the aforementioned three equations, we obtain Equation (4):
ln ε ˙ = ln A + n l n sin h α σ Q / R T
l n ε ˙ = n 1 l n σ + l n A 1
l n ε ˙ = β σ + l n A 2
From Equations (5) and (6), it can be seen that ln ε ˙ and σ are linearly related. Take the peak flow stress σ of the alloy material under different deformation temperatures and strain rates, draw the ln ε ˙   lnσ and ln ε ˙   σ diagrams, and perform a linear regression on them. After fitting, as shown in Figure 4, the average slope of the two low-stress straight lines in Figure 4a is n1 = 6.625. In taking the average value of the slope of the two high-stress straight lines in Figure 4b, where β = 0.1135, it can be determined that α = β/n1 = 0.0147.
The expression of the deformation activation energy Q can be obtained by taking the partial derivatives of 1/T on both sides of Equation (4) at the same time.
Q = R l n ε ˙ l n [ s i n ( α σ ) ] T l n   [ s i n ( α σ ) ] ( 1 / T ) ε ˙
n = l n ε ˙ l n [ s i n ( α σ ) ] T
b = l n   [ s i n ( α σ ) ] ( 1 / T ) ε ˙
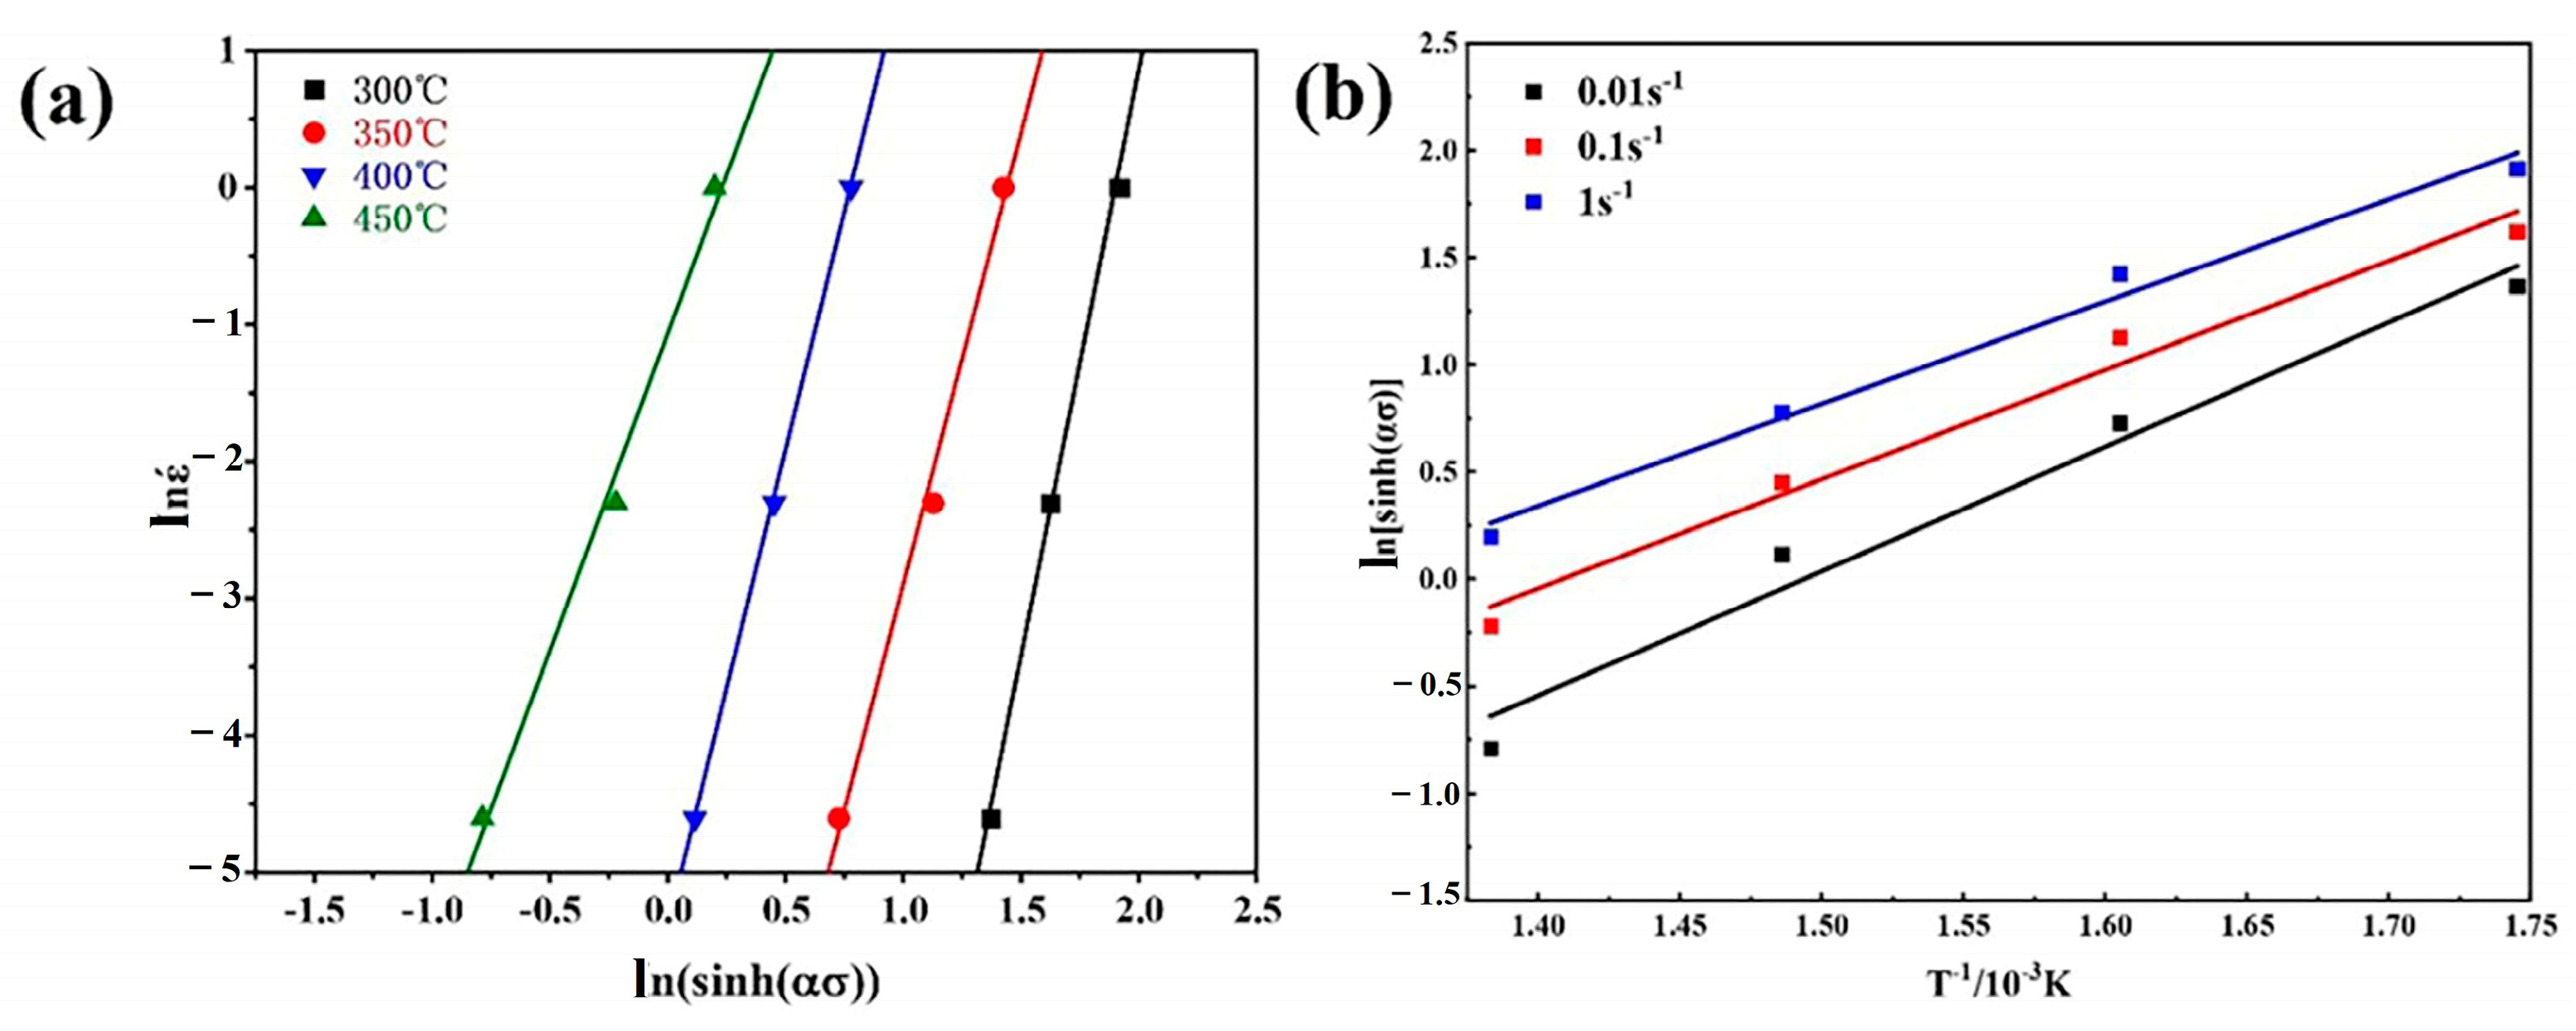
Similarly, take the peak flow stress σ under various conditions, drawing the relationship diagram of ln [sinh(ασ)] − 1/T, ln ε ˙ −ln [sinh(ασ)] and perform a univariate linear regression analysis, as shown in Figure 5. From the slope of the straight lines ln ε ˙ −ln[sinh(ασ)] in Figure 5, the stress index n value at different strain rates and the material constant b at different deformation temperatures can be determined and averaged, where n is 6.625 and b is 5.223. Through substituting these averages into Equation (7), the deformation activation energy Q is obtained as 287.7 kJ/mol. Due to the inclusion of the rare-earth element Y in the ZW305K alloy and the presence of a precipitated second phase, the alloy elements and the second phase are pinned and obstructed during deformation, resulting in higher activation energy.
Zener and Hollomon introduced the parameter Z representation by verifying the influence of the strain rate and deformation temperature on flow stress during the plastic deformation of materials at high temperatures:
Z = ε ˙ exp ( Q R T ) = A [ sinh α σ ] n
Taking the logarithm of both sides of Equation (10), we can obtain
ln   Z   = ln A + n l n [ sinh α σ ]
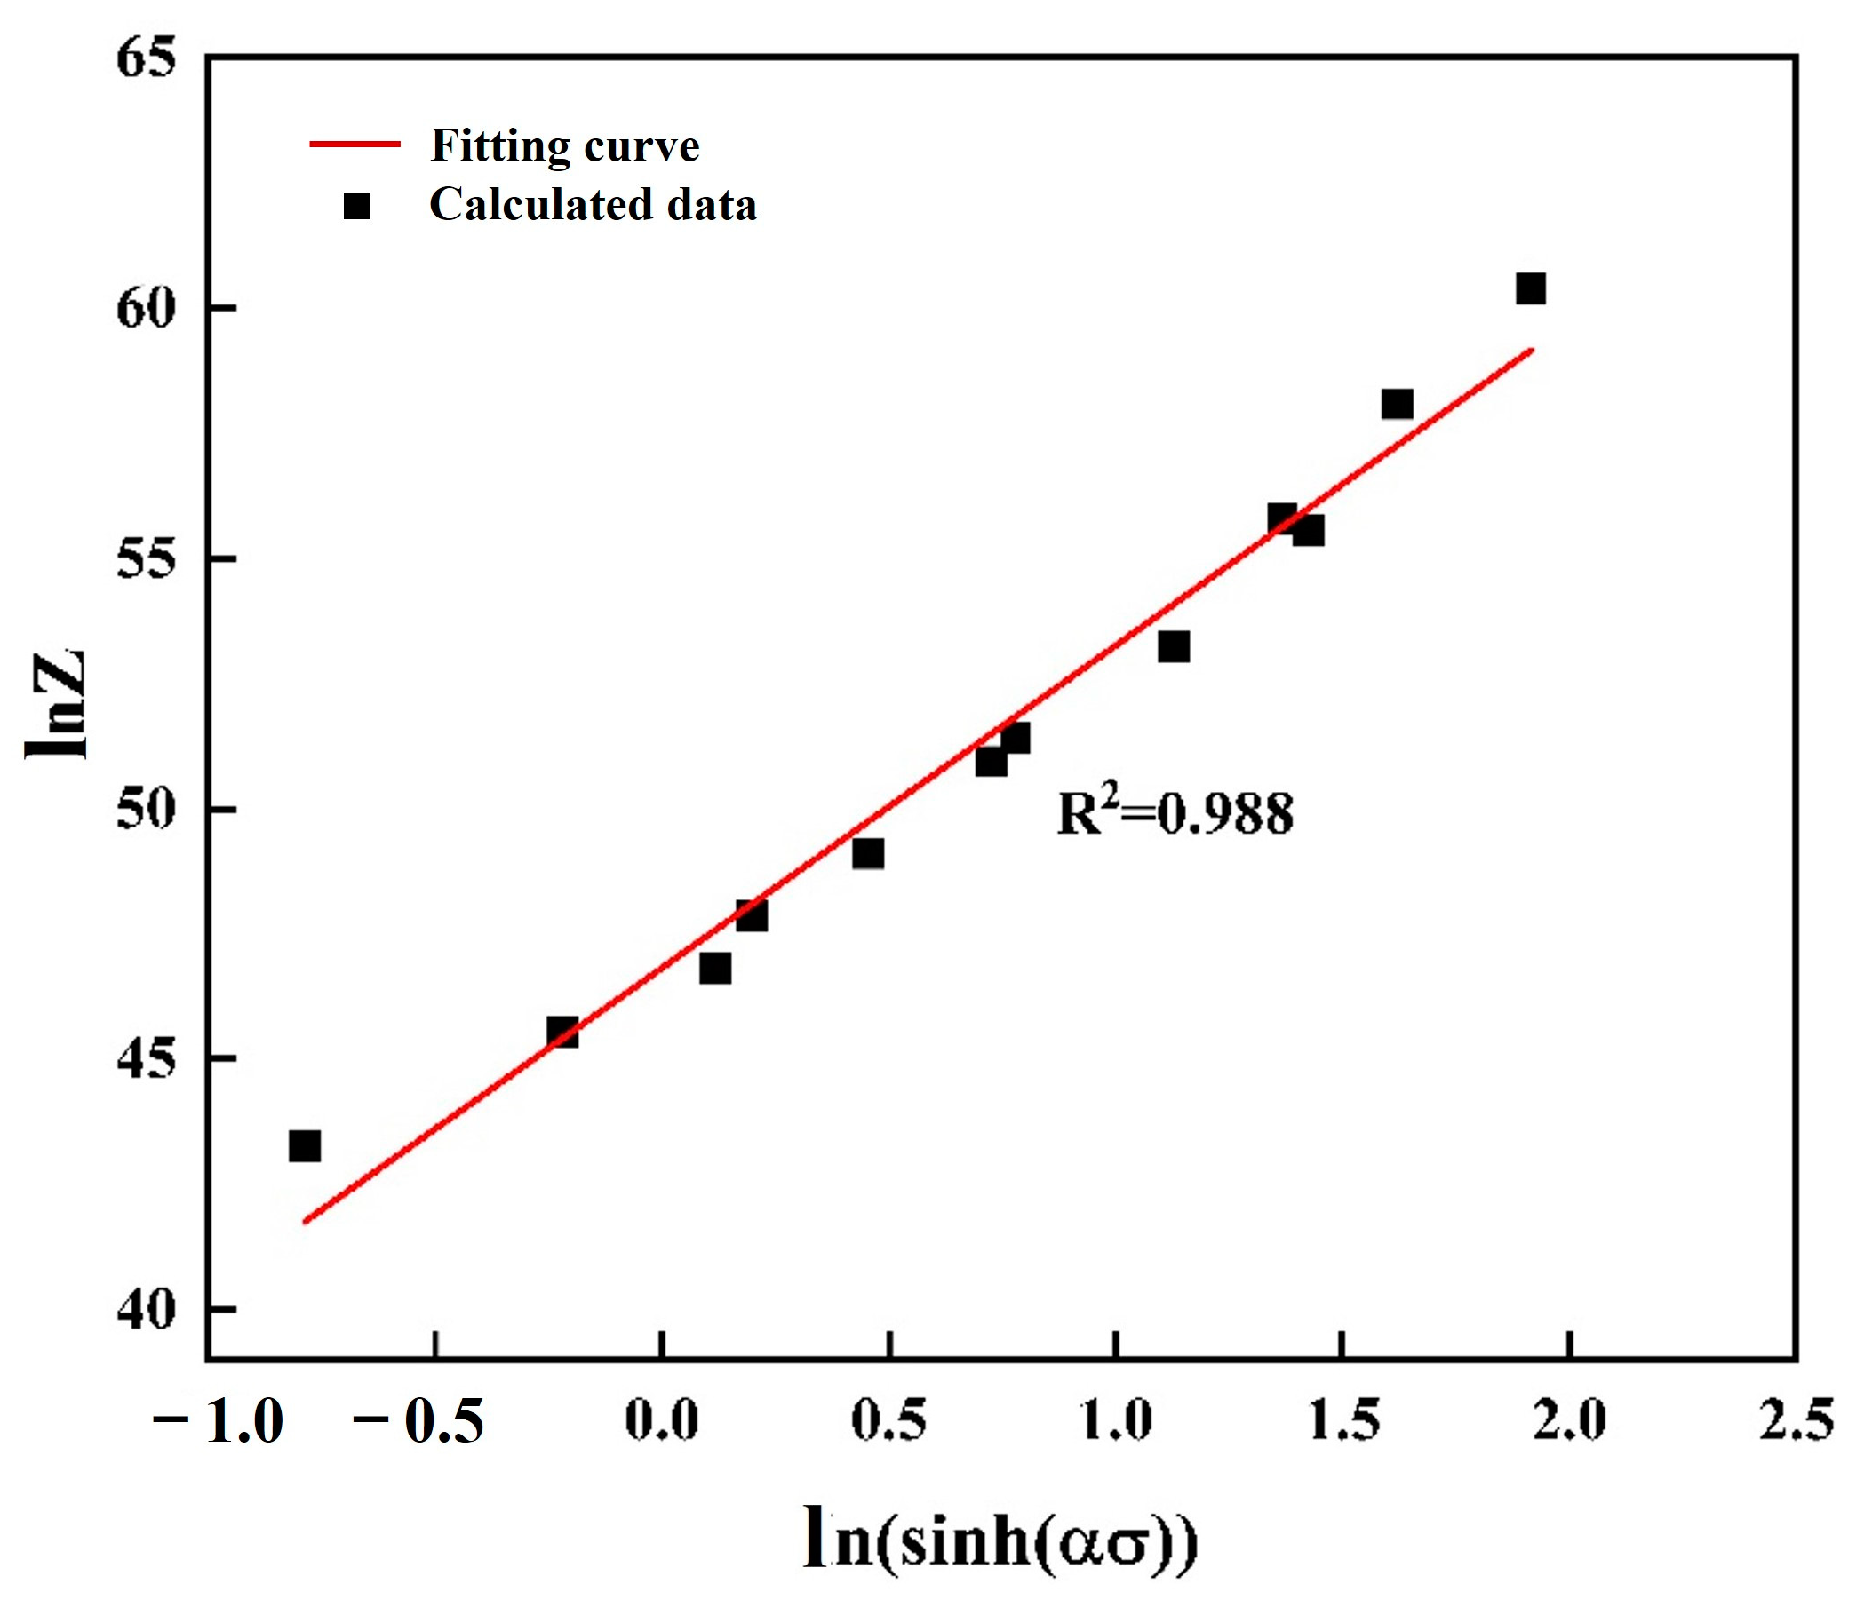
The Z value can be obtained by bringing in different deformation parameters and thermal deformation activation energy through Equation (10). A linear regression analysis was performed on the relationship between lnZ and ln [sinh(ασ)], as illustrated in Figure 6. Through fitting the slope of the line, the stress exponent n is determined to be 6.79, and the material constant A is obtained as 1.42 × 10²⁰ from the intercept of the line. It can be seen from Figure 6 that the fitting coefficient reaches 98.8%, indicating that the hyperbolic sine constitutive equation accurately predicts the deformation behavior of ZW305K.
In substituting the material constants A, Q, n, and α into Equation (1), the flow stress equation of the alloy expressed by the Amhenius relation can be obtained as shown in Equation (12):
ε ˙ = 1.42 × 10 20 sin h ( 0.0147 σ ] 6.79 exp ( 287 , 703 R T )

3.4. Thermal Processing Maps

A thermal processing diagram can effectively assess the performance of alloys during the processing. A technique developed by Prasad et al. utilizing the dynamic material model (DMM) constructs a thermal processing map through the superimposition of the power dissipation map and instability map [40]. It is widely used in the design and optimization of material processing processes to avoid the occurrence of unstable regions during the process of selecting appropriate processing conditions and optimizing processing parameters, thereby achieving the required microstructure and performance goals. This study used DMM processing diagrams to investigate the hot working properties of the ZW305K alloy.
During thermal plastic processing, the workpiece consumes energy in two directions: firstly, energy stored within the material due to the plastic deformation of the workpiece, represented by dissipation quantity G; secondly, energy dissipated due to the change in microstructure during deformation and processing. It is also called the dissipative co-variant and is represented by J; the expression is Equation (13).
P = σ ε ˙ = G + J = 0 ε ˙ σ d ε ˙ + 0 σ ε ˙ d σ
The ratio of power dissipation quantity G to power dissipation corollary J is determined using the material’s strain rate sensitivity index, denoted by m:
m = J G = ε ˙ σ σ ε ˙ = ln σ ln ε ˙
When the deformation conditions are constant, the flow stress of material deformation can be represented by the strain rate:
σ = K ε ˙ m
In the equation, K is the material constant. Substituting Equation (15) into Equation (13), we can obtain Equation (16):
J = 0 σ ε ˙ d σ = m m + 1 σ ε ˙
Generally speaking, energy dissipation changes nonlinearly during thermal processing. When m = 0, no energy is consumed; when m is between 0 and 1, the material is in a stable state; when m = 1, the energy dissipation of the material achieves an ideal state, and the maximum power dissipation of the material is Jmax, as shown in Equation (17):
J M A X = ε ˙ σ 2
Since there is energy dissipation in material deformation, the power dissipation factor η is introduced. It represents the ratio of the energy J consumed by the microstructure during material deformation to the maximum dissipated energy Jmax:
η = J J m a x = 2 m m + 1
The efficiency map of power dissipation was obtained by calculating the variation in power dissipation efficiency with the temperature and strain rate. The efficiency map of power dissipation exhibits domains in which the efficiency shows a local maximum corresponding to each of the microstructural mechanisms.
Instability phenomena such as strain failure may also occur in materials during processing. The instability map is developed based on the extremum principles of irreversible thermodynamics applied for a large plastic flow body. Based on the dynamic material model, it is also necessary to determine the instability area through the instability criterion proposed by Prasad [40]:
ξ ( ε ˙ ) = l n m m + 1 l n ε ˙ + m < 0
The processing instability of the material is influenced by temperature and strain rate. When ξ ( ε ˙ ) is less than 0, the material will become unstable during plastic deformation processing, leading to defects and other phenomena.
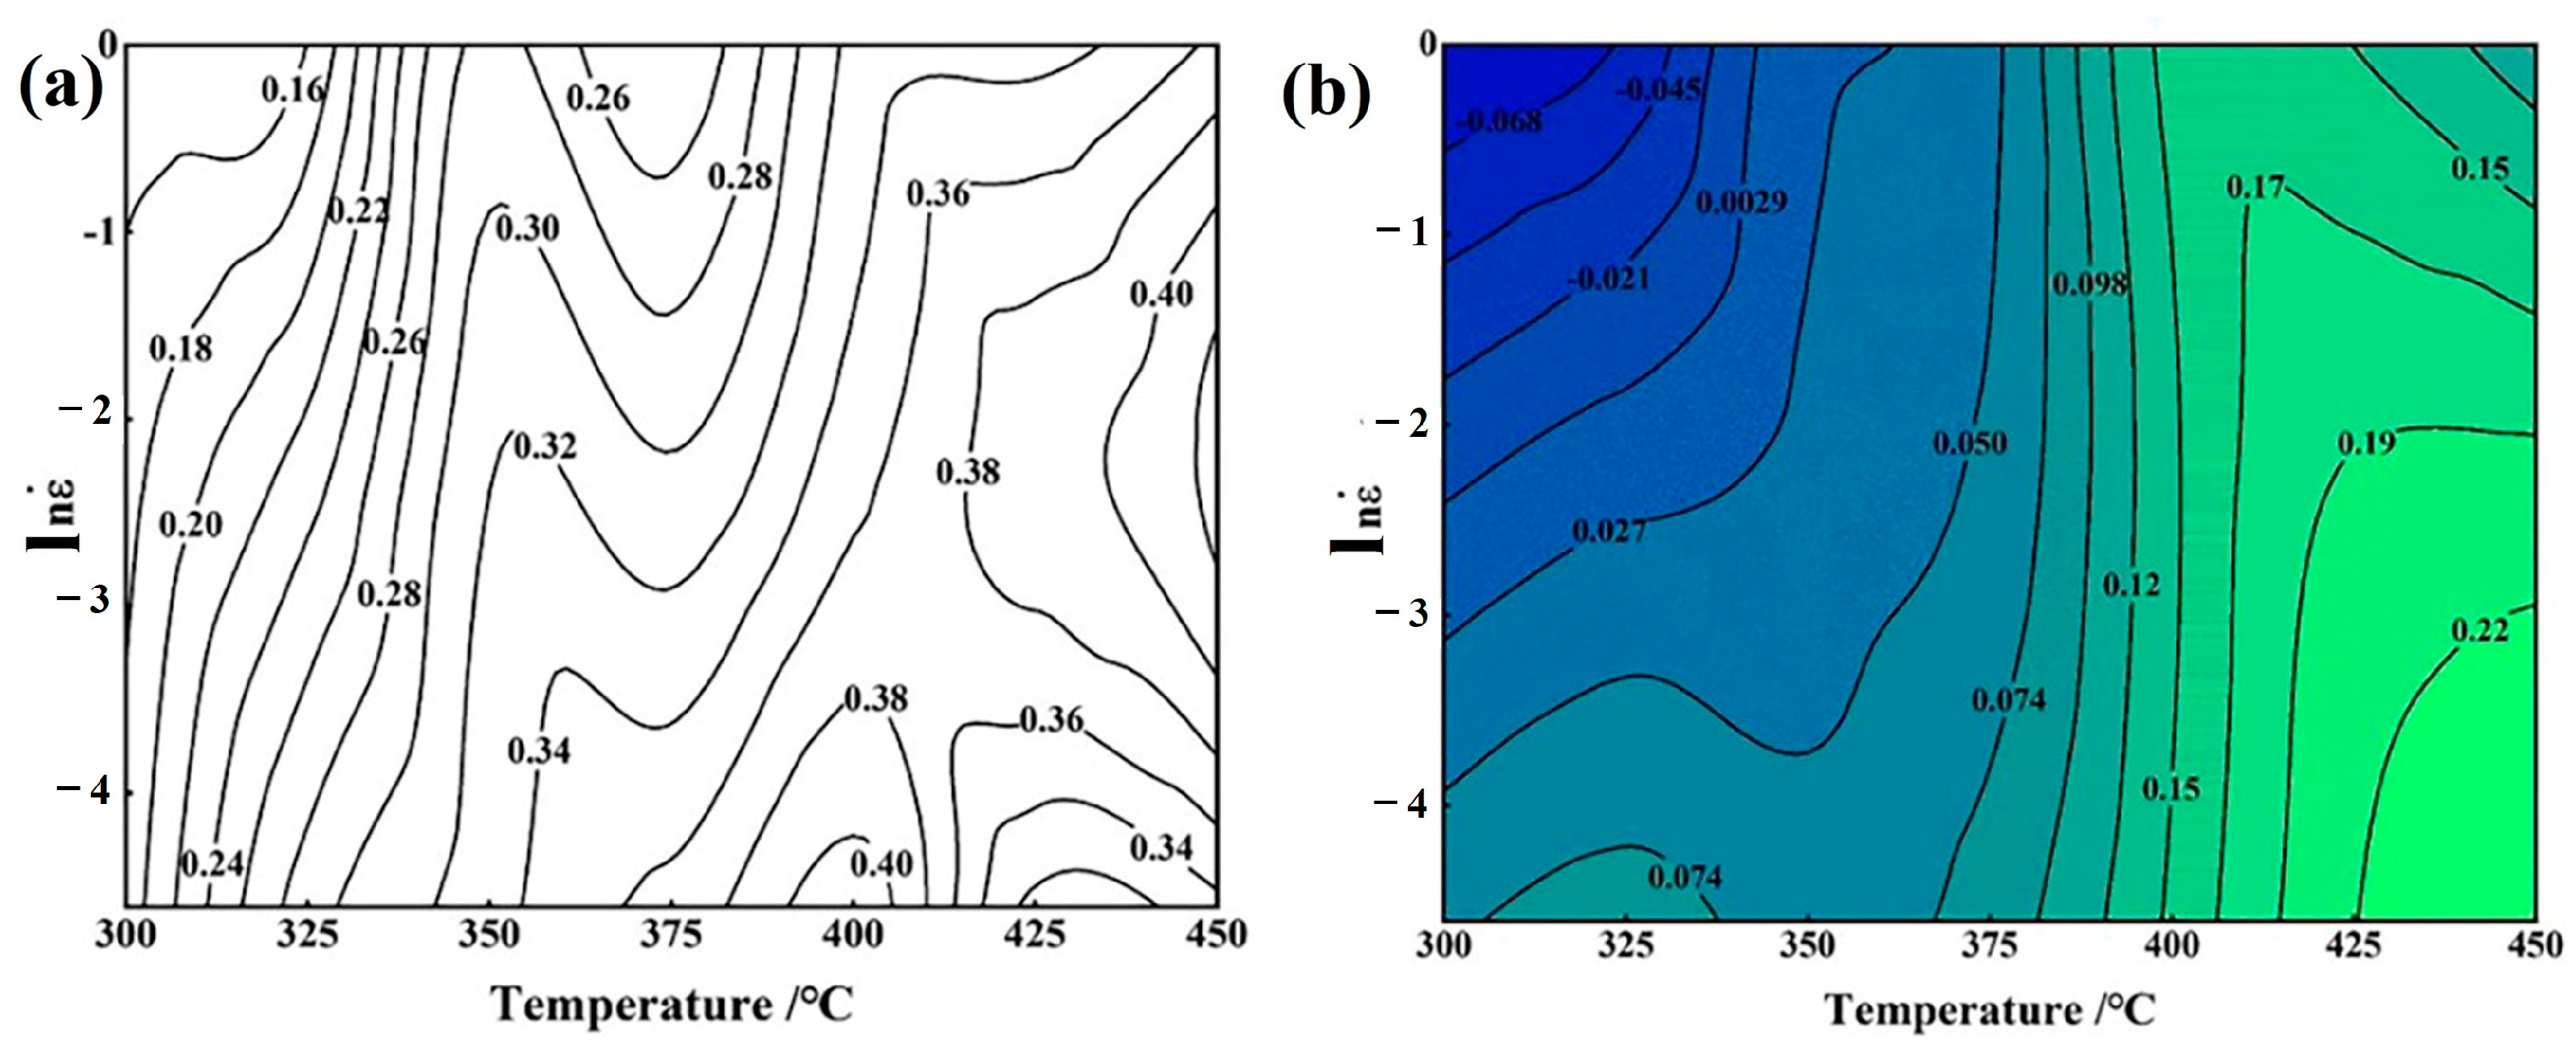
Figure 7a illustrates the power dissipation diagram of the ZW305K magnesium alloy plotted under 0.5 strain. The contour lines in the figure represent the dissipation factor, highlighting the distinct influence of temperature and strain rate on this coefficient [41]. At 300 °C and 350 °C, the power dissipation coefficient is relatively low and diminishes gradually with an increasing strain rate. Above 350 °C, however, the coefficient exceeds 30%, and DRX begins to occur inside the material. As temperature rises and the strain rate decreases, dislocations are progressively consumed, promoting the formation of DRX. The power dissipation coefficient gradually increases. The power dissipation coefficient is larger at 400 °C, 0.01 s−1 and 450 °C, 0.1 s−1, so the degree of recrystallization is higher in this region. The larger the dissipation coefficient, the higher the proportion of microstructure dissipated energy, thereby increasing the possibility of DRX, which helps to promote the deformation process of the material and provides more favorable conditions for plastic deformation. However, at high temperatures and high strain rates such as 450 °C and 0.01 s−1, the power dissipation coefficient decreases, the degree of recrystallization in the structure is relatively sufficient, and the fine grains gradually grow into equiaxed grains, which is not suitable for hot deformation processing [41,42]. The darker the color in the instability diagram, the more likely it is that instability will occur. Figure 7b shows the ZW305K alloy suffering from instability at a low temperature and high strain rate (300 °C, 1 s−1). Due to the lower temperature, the magnesium alloy material has limited activated slip systems and reduced plasticity. Higher strain rates accelerate dislocation accumulation at grain boundaries, which leads to rheological instability in the material.
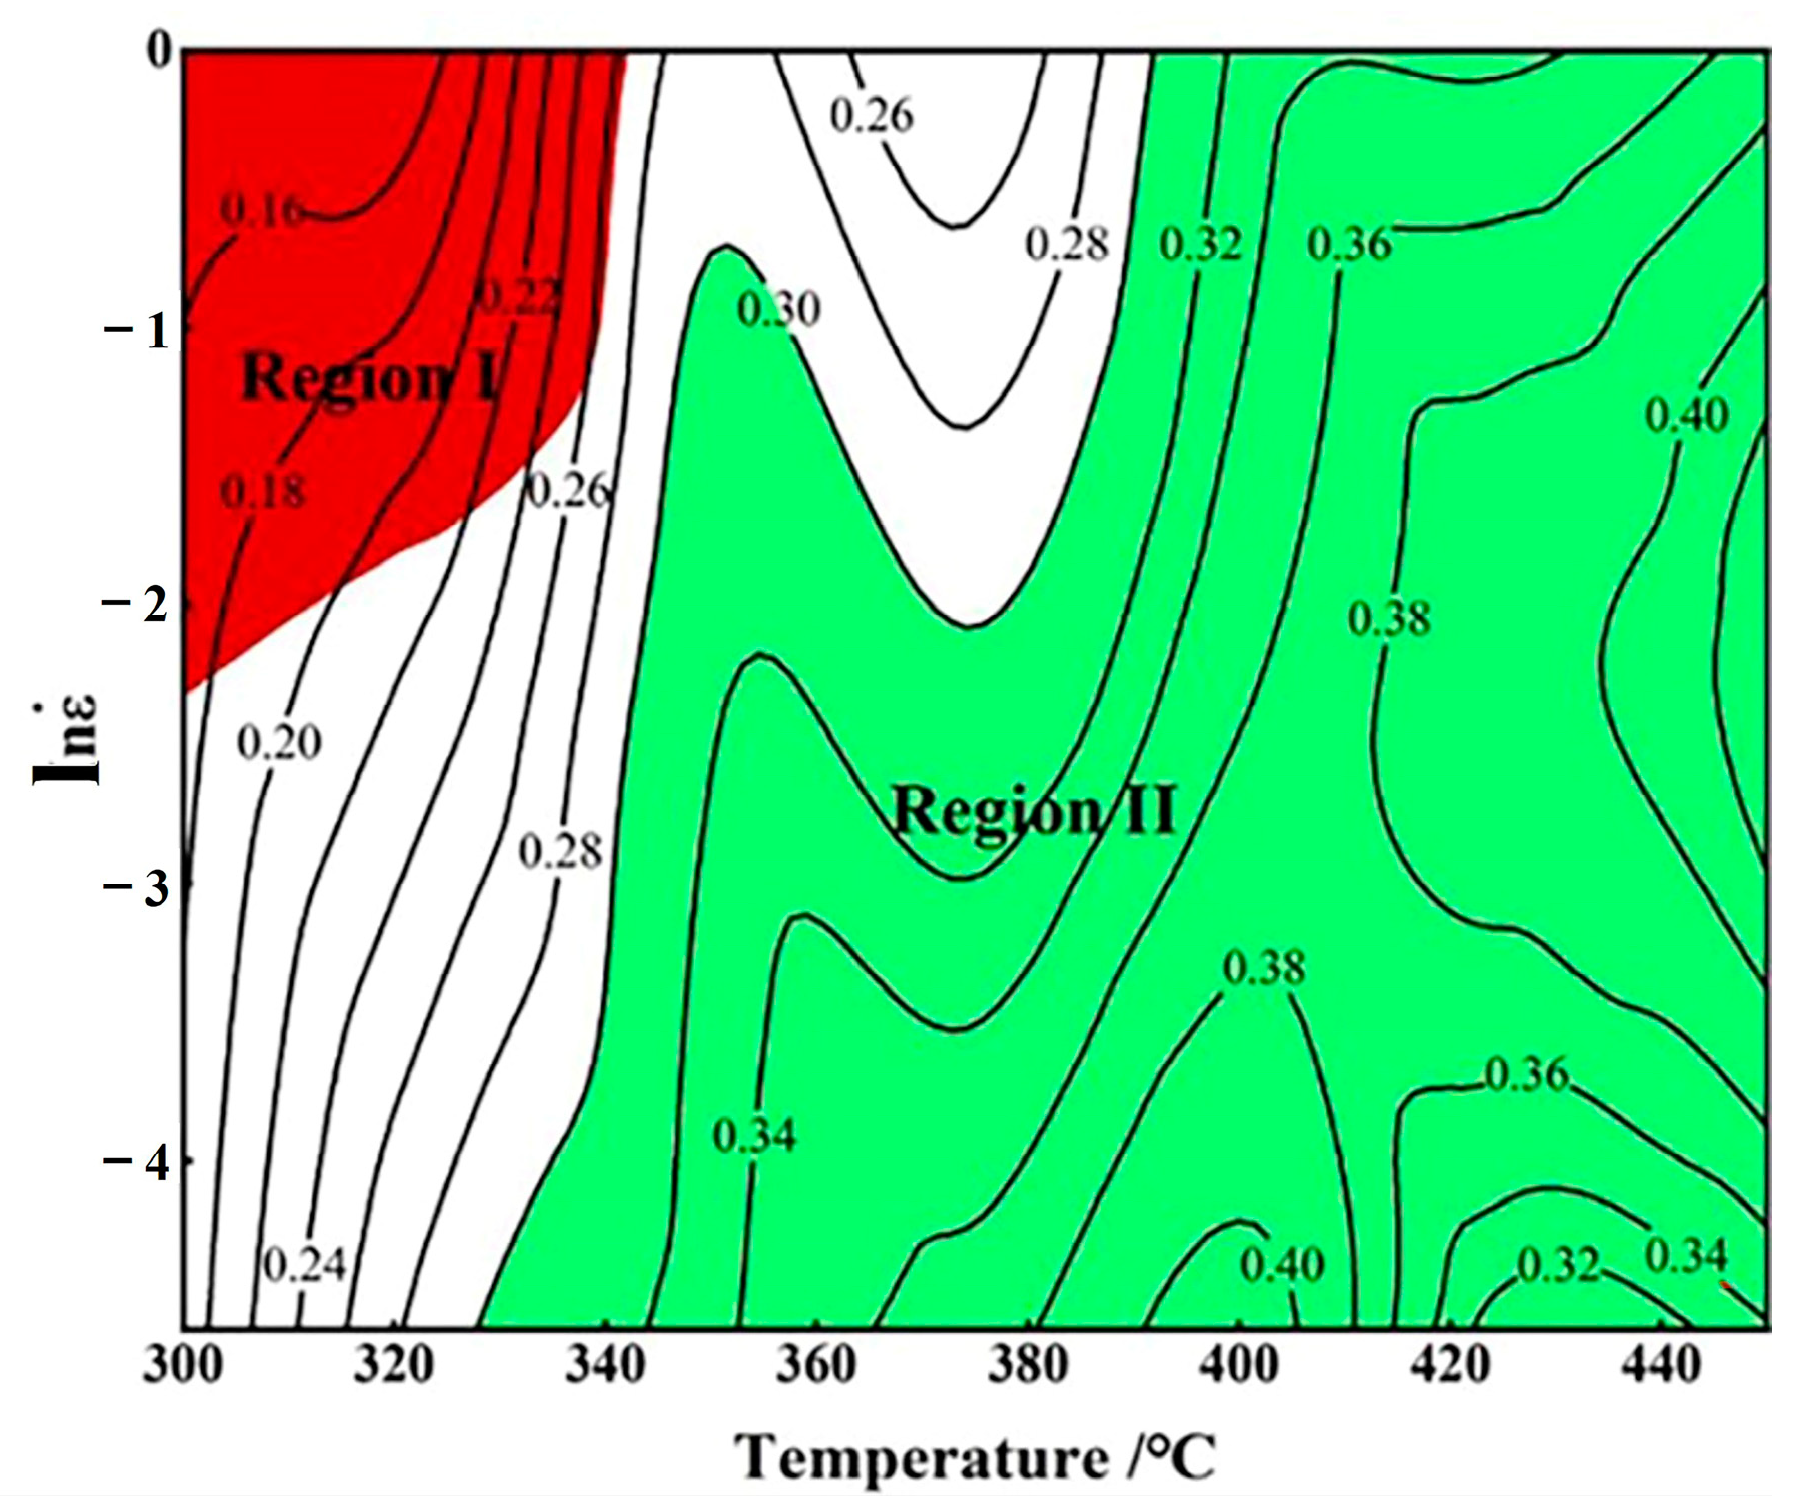
Figure 8 is a thermal processing diagram, where red region I denotes the instability area, whereas region II, highlighted in green, indicates where DRX occurs. At high temperatures, a higher degree of DRX is typically achieved, and the power dissipation coefficient is increased, which is beneficial for deformation processing. However, a lower strain rate promotes the growth of recrystallized grains, which inhibits the nucleation of recrystallization and results in a decrease in the power dissipation coefficient. Therefore, increasing the strain rate or lowering the temperature can help form fine recrystallized grains and improve the mechanical properties of the material.

3.5. Microstructure Evolution

3.5.1. Degree of Deformation

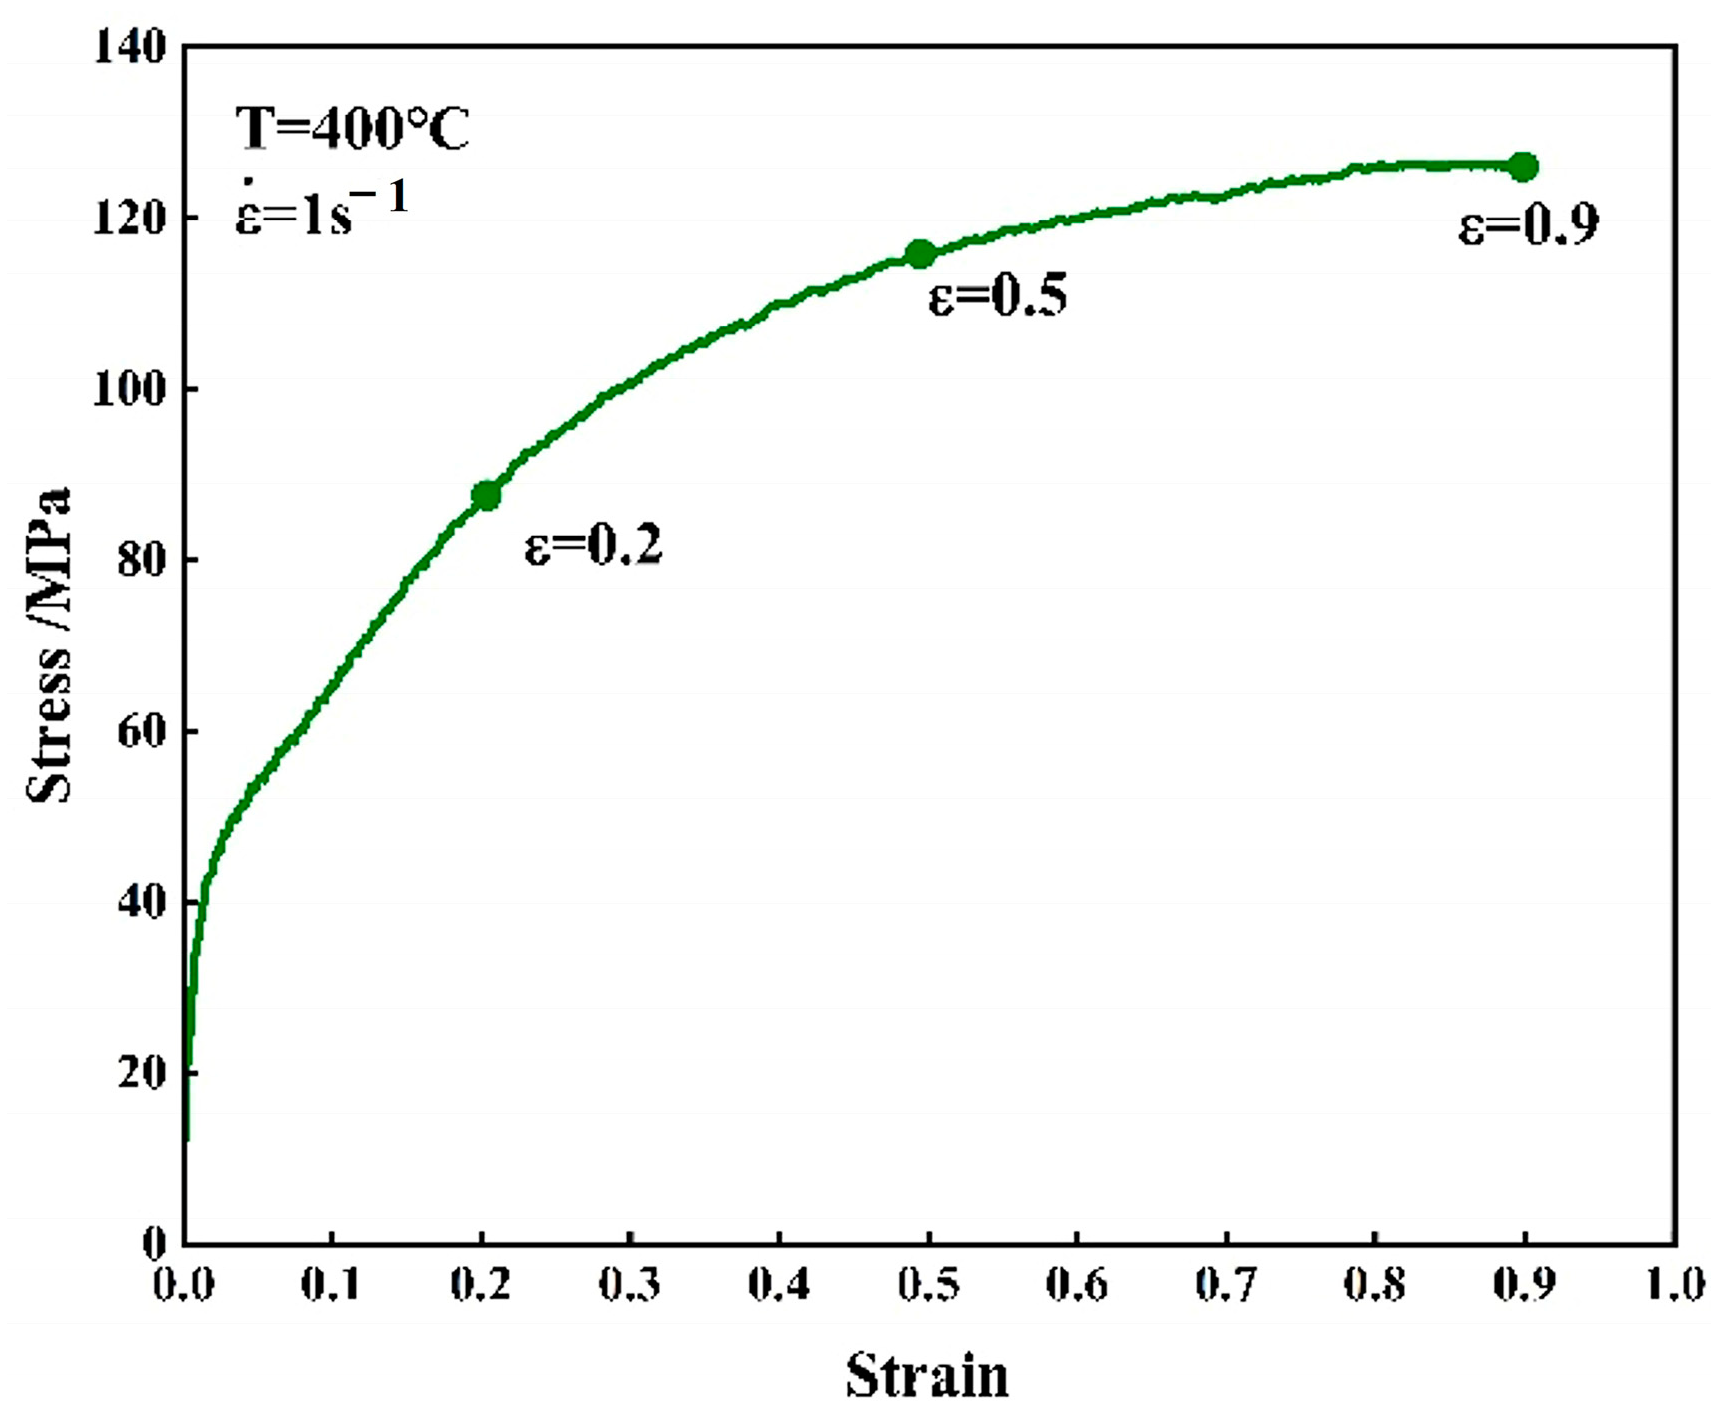
Figure 9 depicts the true stress–strain relationship of the ZW305K alloy under 1 s−1 and 400 °C, and a strain value of 0.9. Following the yielding of the ZW305K magnesium alloy, there is a swift increase in stress. As the strain surpasses 0.2, the rate of stress augmentation decreases with escalating deformation. Upon reaching a strain of 0.5, the rate of stress rise decelerates, eventually leveling off as the strain nears 0.9.
Figure 10 shows the metallographic microstructure at 400 °C and 1 s−1, and the strains are 0.2, 0.5, and 0.9, respectively. When the strain is 0.2, the deformation of the alloy is small, and the grains in the structure are still equiaxed, but there are some twins. When the strain rises to 0.5, the original grains are compacted due to compressive forces. However, the outlines of the grain boundaries remain distinct. Numerous twin structures are formed within the grains, and recrystallized grains are initiated along the twin boundaries. Once the strain hits 0.9, the grains undergo compression into flat shapes, and evident streamlines of compression can be observed within the structure, along with numerous small, recrystallized grains emerging at the boundaries of the grains. This observation showcases that with the rise in deformation intensity, the structure experiences significant distortion, leading to heightened dislocation density at the grain boundaries, subsequently elevating the rate of recrystallization nucleation.

3.5.2. Deformation Temperature

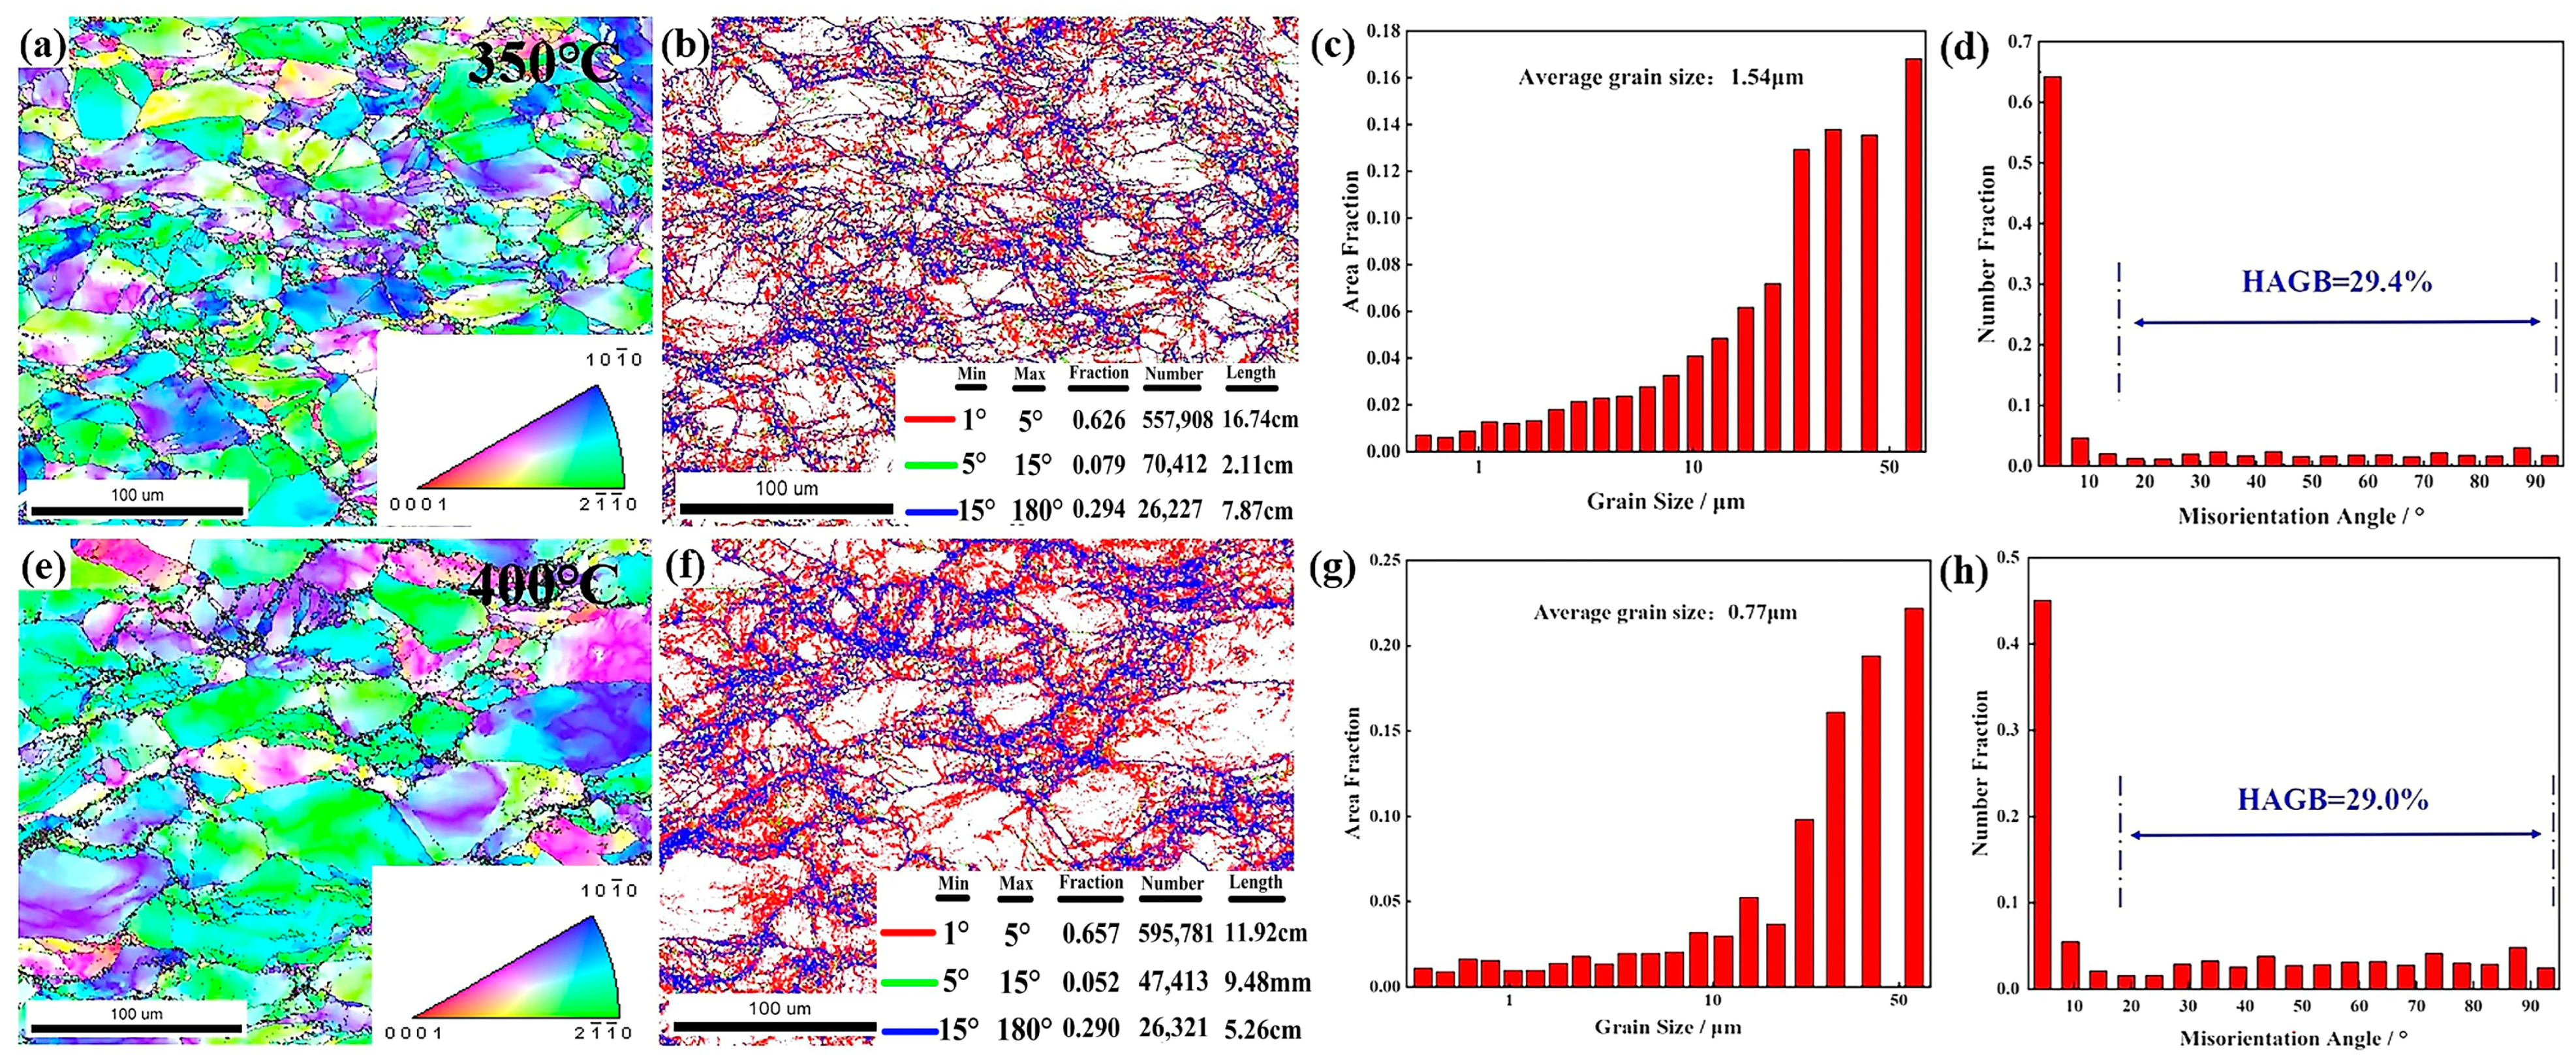
At a strain rate of 1 s−1, the EBSD findings for the ZW305K alloy at 350 °C and 400 °C can be observed in Figure 11. When the deformation temperature is 350 °C and the strain rate is 1 s−1, a large number of elongated deformed grains can be observed in the microstructure in Figure 11a,b compared to the original structure. There are many twin structures inside, and a minimal amount of fine DRX grains appear near the grain boundaries of some elongated grains. The difference in lattice orientation between dynamic recrystallized grains and original grains after thermal deformation is obvious. When the temperature reaches 400 °C, the rate of atomic diffusion escalates, resulting in decreased twinning and the start of dislocation mechanisms. Elongated deformed grains are gradually substituted by coarse DRX grains, while many fine DRX grains emerge in proximity to the grain boundaries. As the deformation temperature rises, the energy needed for atomic diffusion and migration along grain boundaries also increases, facilitating the formation of DRX grains. Consequently, the average grain size shifts from 1.54 μm to 0.77 μm, as illustrated in the grain size distribution chart depicted in Figure 11c,g.
From Figure 11b,f, we can see that in the grain boundary diagram, different colors represent grain boundaries with different angles, the thick blue lines represent high-angle grain boundaries (HAGBs) from 15° to 180°, the green line represents low-angle grain boundaries (LAGBs) ranging from 5° to 15°, and 1° to 5° corresponds to a very low-angle grain boundary (VLAGBs). As the temperature increases, dislocations gradually form sub-grains through movement and reorganization, and the sub-grains rotate, causing the LAGBs to gradually transform into HAGBs. The percentage of LAGBs decreases from 0.079 to 0.052, while the proportion of HAGBs increases slightly. This is because TDRX mainly occurs at 350 °C. The HAGBs in the structure are mainly distributed around the twin boundaries. Twin interactions serve to impede the motion of dislocations, leading to entanglement and intersection among dislocations. This process promotes the formation of recrystallized grains at twin boundaries, leading to the development of smaller recrystallized grains and a rise in the abundance of HAGBs. With rising temperatures, the twinned areas reduce gradually, and the prevalence of HAGBs shifts toward the initial grain boundaries, resulting in the generation of numerous smaller recrystallized grains.

3.5.3. Strain Rate

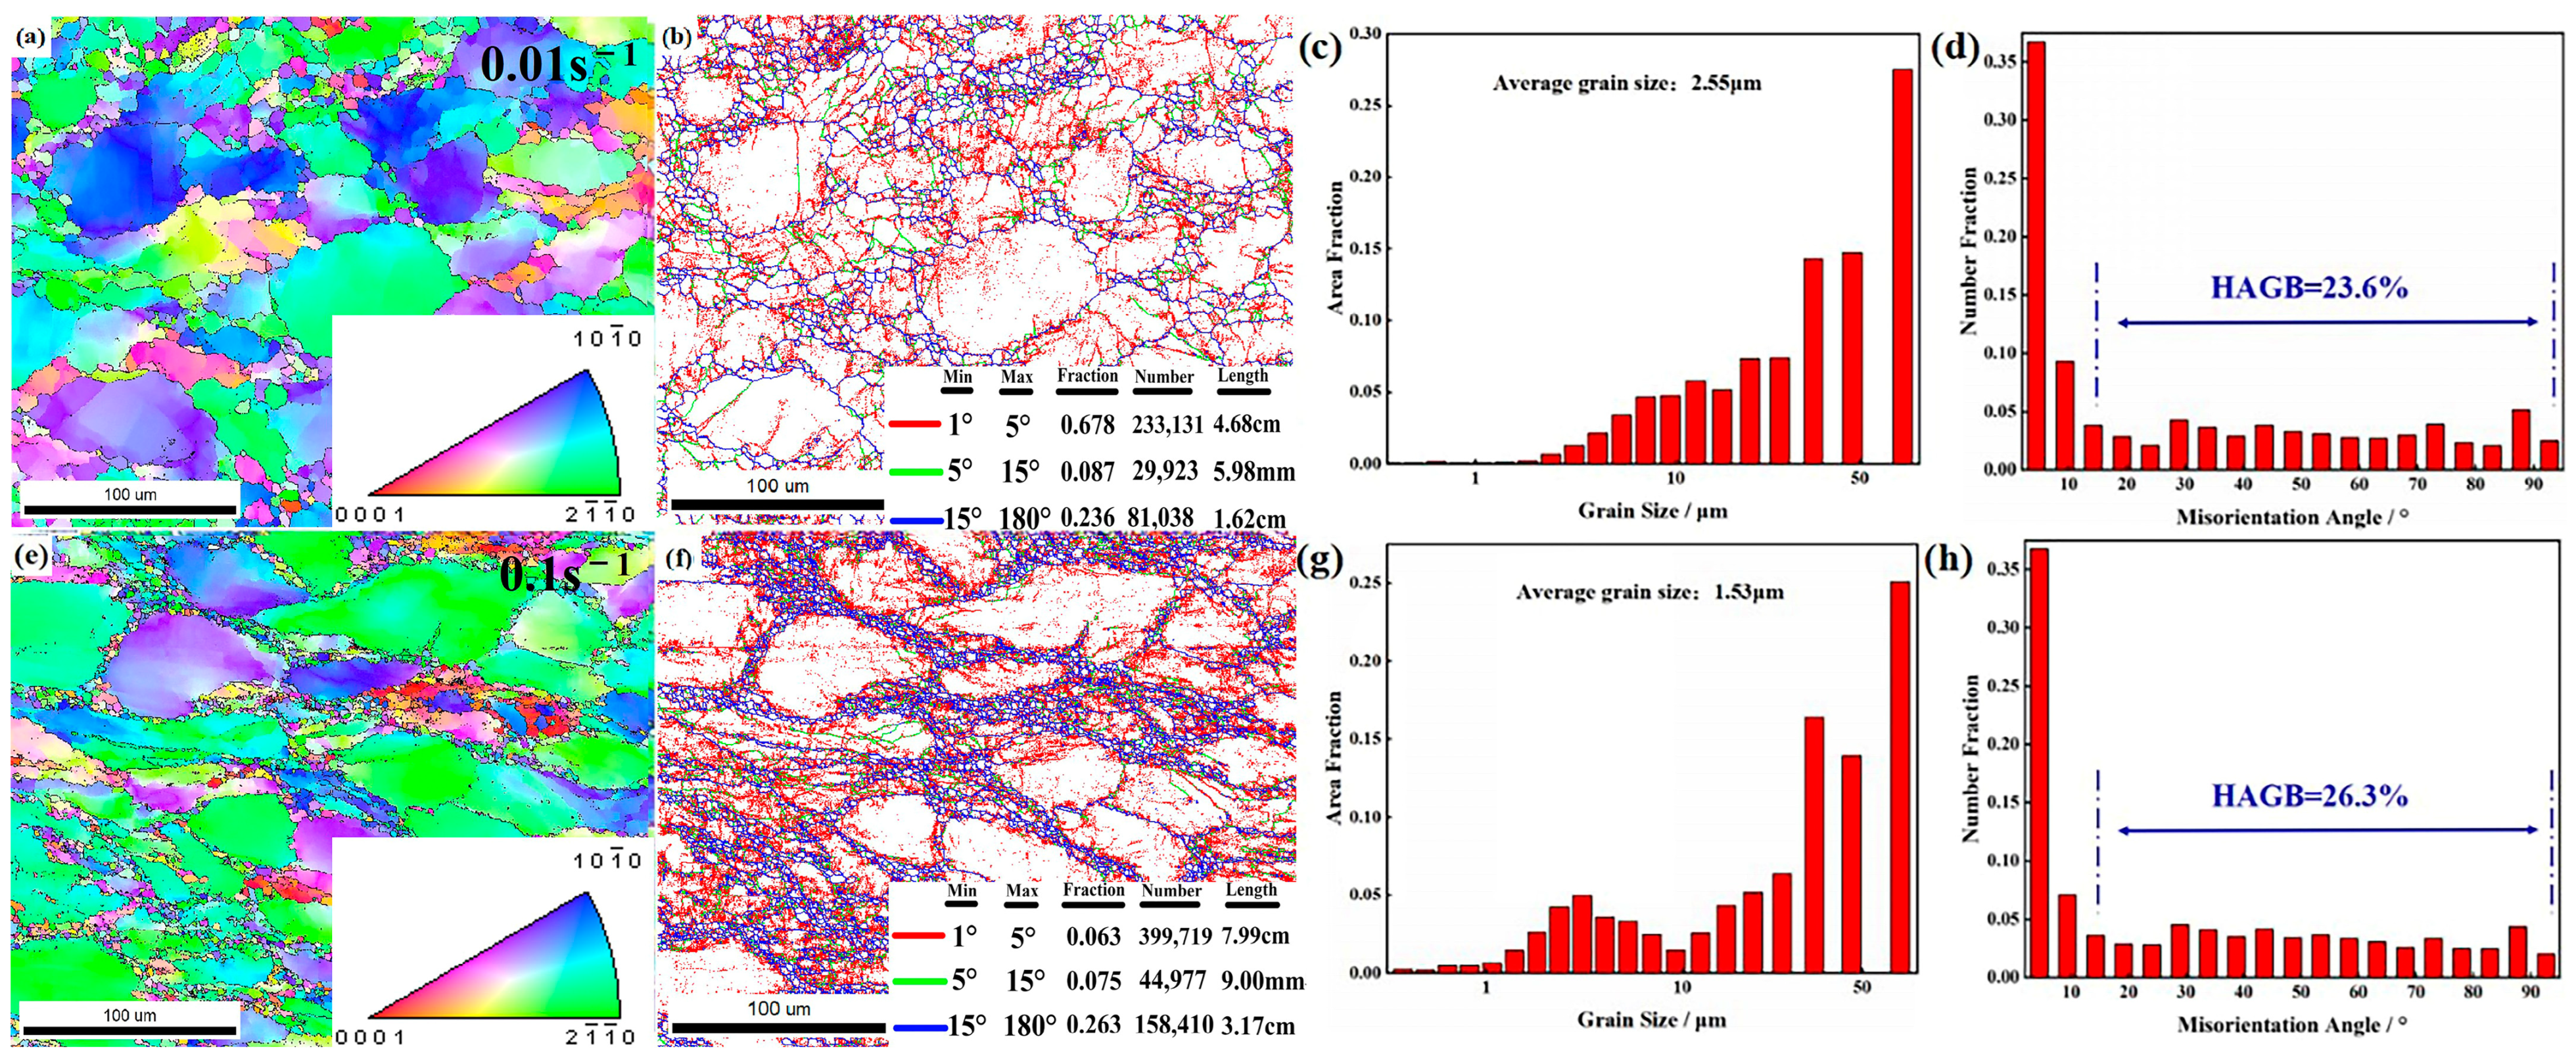
Figure 12 displays EBSD mappings of the ZW305K magnesium alloy that underwent deformation at 400 °C with strain rates of 0.01 s−1 and 0.1 s−1. The structure of the material reveals different levels of recrystallized grains formed at 400 °C. At 0.1 s−1, there is a notable presence of numerous small, recrystallized grains surrounding the boundaries of the original grains. At 0.01 s−1, the crystal grain size has grown noticeably. Additionally, the grain size distribution diagram shows that the average grain size at this strain rate is 2.55 μm. In contrast, when the strain rate is increased to 0.1 s−1, the average grain size decreases to 1.53 μm. These findings suggest that decreasing the strain rate results in a decrease in the number of grains ranging from approximately 1 to 10 μm, while the proportion of grains around 10 μm in size increases.
Upon comparison, it was observed that as the strain rate decreases, the size of DRX grains increases gradually. This phenomenon is because a lower deformation rate results in an extended period of grain deformation. Additionally, at a temperature of 400 °C, the increase in atomic diffusion leads to the accelerated migration of grain boundaries, promoting grain growth. Grain growth can more fully consume the accumulated dislocations, so the recrystallization volume fraction gradually increases. At higher strain rates, the alloy does not have sufficient time for DRX, which inhibits the growth of recrystallized grains. Consequently, more sub-grains begin to transform into recrystallized grains, forming smaller recrystallized grains under the effect of thermal deformation. This is also why there are more fine recrystallized particles at a strain rate of 1 s−1 compared to 0.1 s−1.
At different strain rates, Figure 12b–f depict grain boundary maps and plots showing orientation deviation angles. At 400 °C, the number of slip systems in the alloy that can participate in slip gradually increases, and the movement of dislocations proceeds more easily, thereby promoting the occurrence of DRX. As the strain rate increases from 0.01 s−1 to 0.1 s−1, the percentage of HAGBs increases from 23.6% to 26.3%. This increase in strain rate accelerates the proliferation and movement of dislocations, thereby rapidly accumulating the energy necessary for recrystallization within a short period. As LAGBs gradually absorb energy and transform into HAGBs, they promote the nucleation of recrystallized grains. However, the recrystallized grains do not have sufficient time to grow, so the number of recrystallized grains increases with the increase in strain rate. The average grain size gradually decreases, which is also confirmed in the grain size distribution diagram.
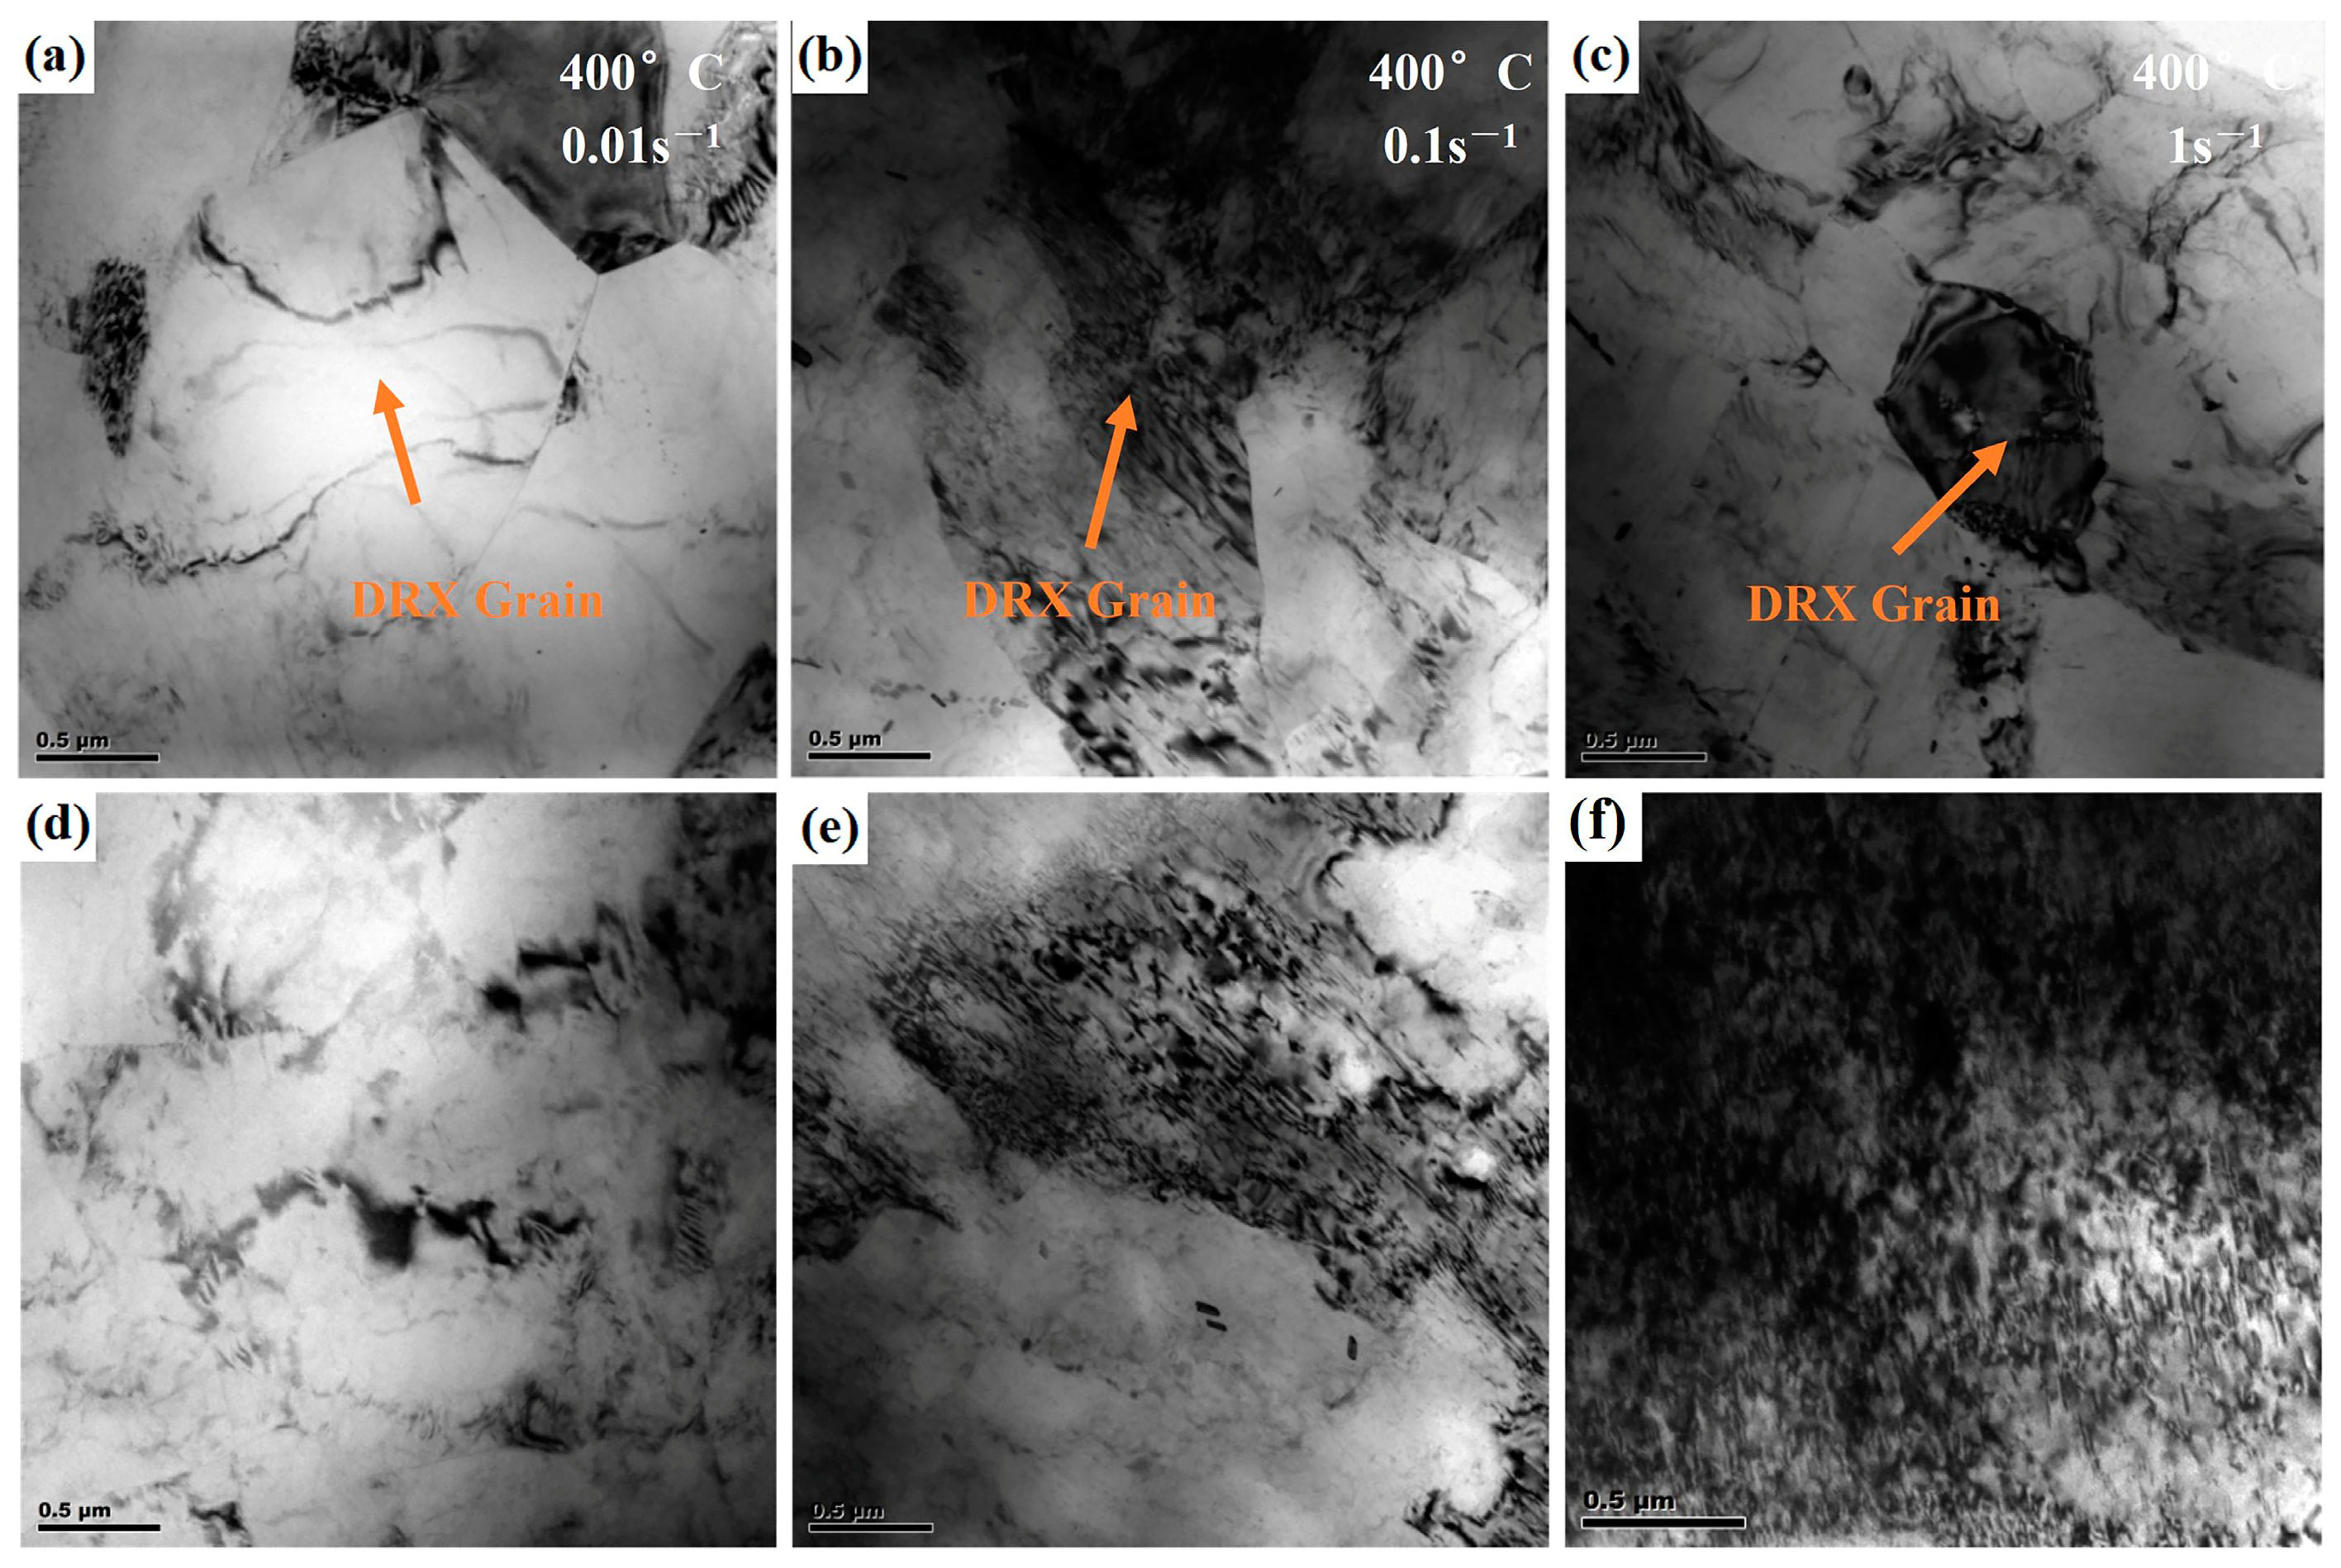
To investigate the effect of the strain rate on DRX and precipitation of secondary phases in the microstructure, TEM morphology was observed at different strain rates at 400 °C, as shown in Figure 13. At high strain rates, the alloy contains fine recrystallized grains with a significant accumulation of dislocations inside the grains [43]. As the strain rate decreases, the size of the recrystallized grains grows to a certain extent, and the dislocation density within the structure gradually decreases, and the degree of dislocation entanglement and deposition also decreases [44].
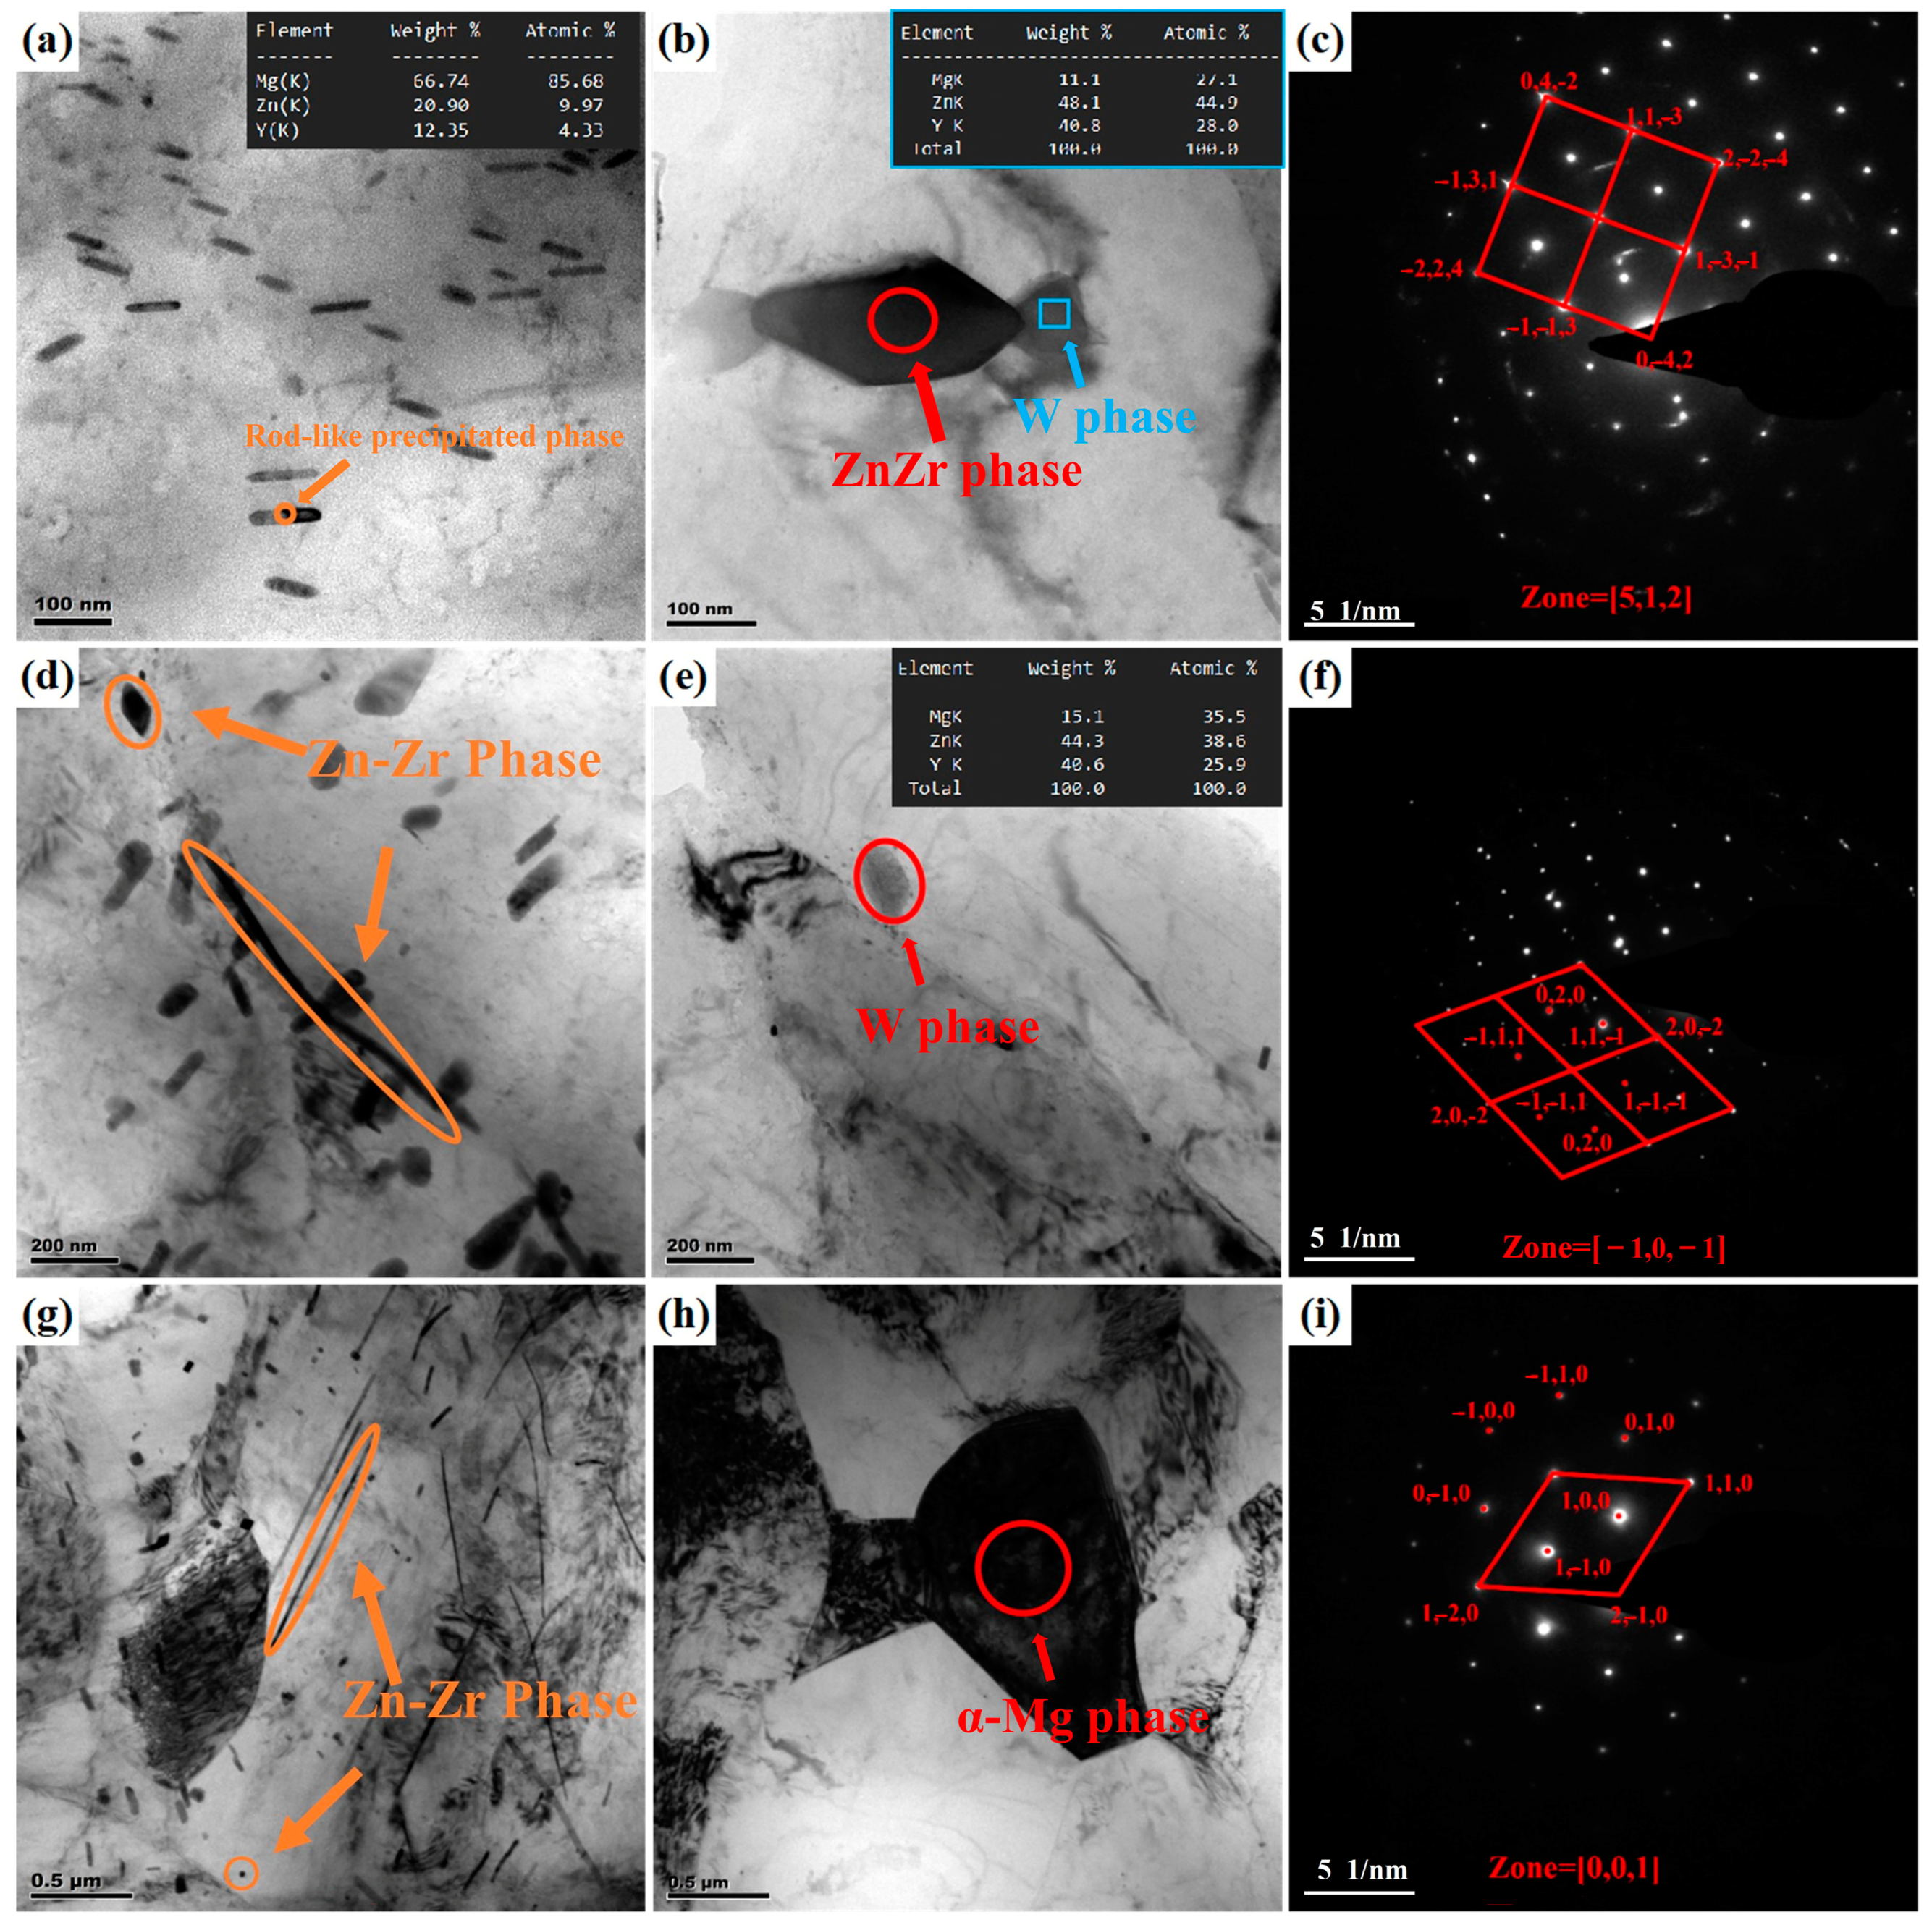
To investigate the precipitation behavior of the second phase during the DRX of the ZW305K magnesium alloy, TEM analysis was performed on samples at different strain rates. Figure 14 shows the TEM images of the precipitated phases in the microstructure under different strain rates. It can be observed that the morphology of the precipitated phases varies under different conditions, including rod-like, granular, and elongated shapes. At a strain rate of 1 s−1, a large number of rod-like second phases are dispersed throughout the matrix. EDS analysis revealed a Zn/Y atomic ratio of 2.5:1, which is intermediate between the I-phase and W-phase. This may be due to the transformation of the I-phase into the W-phase in the microstructure. In the literature [45], it is mentioned that at 400 °C, the increase in atomic diffusion rate leads to the transformation of the I-phase into the W-phase. Wang et al. [46] observed that in a friction stir processed Mg-6Zn-1Y-0.5Zr alloy, the eutectic I-phase was decomposed into small particles. These particles underwent accelerated diffusion through pipe diffusion, promoting the transformation into the W-phase, forming dispersed particles with a core–shell structure. This transformation resulted in an Zn/Y ratio higher than 1.5. In Figure 14b, as shown in the blue box, fine nano-sized particles can be seen nucleating near larger particles. The diffraction pattern obtained from the region marked by the red circle identified the phase as face-centered cubic, confirming it as the ZnZr phase. The precipitates attached to both sides of the ZnZr phase were analyzed by EDS, revealing a Zn-Y atomic ratio of 45:28, close to 3:2, indicating the presence of the W-phase. Therefore, the W-phase can be formed not only through the transformation of the I-phase but also via heterogeneous nucleation on the ZnZr phase.
At a strain rate of 0.1 s−1, a large number of elongated and nano-sized dispersed phases were observed in the microstructure, as shown in Figure 14d. Through EDS analysis, it was found that the dispersed phases in this region contained both Zn and Zr elements, with the elongated ZnZr phase having an atomic ratio of 2:3, consistent with the ZnZr phase structure observed at a strain rate of 1 s−1. Near the grain boundaries, a second phase with a particle size of approximately 200 nm was observed. Diffraction and EDS analysis of this phase revealed a face-centered cubic lattice, with a Mg-Zn-Y atomic ratio of 3:3:2, identified as the W-phase. This indicates that compared to a strain rate of 0.1 s−1, at the slower strain rate, the I-phase in the T4 condition had already transformed into the W-phase. Liao et al. [47] studied the precipitate phases and DRX behavior in low-alloyed Mg-Zn-Y-Zr magnesium alloys under different extrusion temperatures. Their research found that as the Zn/Y atomic ratio increased, the precipitate phases in the alloy changed. At higher extrusion temperatures, the W-phase exhibited a weak inhibitory effect on DRX grain growth, while the LPSO phase promoted DRX behavior through the PSN mechanism, resulting in a higher DRX fraction. Additionally, the layered LPSO phase effectively hindered grain boundary migration and dislocation movement, thereby impeding the nucleation and growth of DRX grains, and improving the strength and ductility of the alloy. Therefore, as the strain rate changes from 1 s−1 to 0.1 s−1, the I-phase changes to the W-phase. The W-phase has a weak inhibition on the growth of DRX grains, resulting in the growth of DRX grains, which has a certain promoting effect on the occurrence of DRX, thus further confirming the conclusion drawn by the above EBSD.
At a strain rate of 0.01 s−1, where the strain rate is relatively low, the microstructure exhibits dynamic recrystallized grains that sufficiently absorb dislocations for nucleation and growth. The diffraction calibration of the orange circled in red in Figure 14g confirms it as having a close-packed hexagonal crystal structure, corresponding to the α-Mg matrix phase. In the microstructure, elongated and granular Zn-Zr phases can still be observed, as shown in Figure 14i. Compared to the strain rate of 0.1 s−1, the quantity of elongated Zn-Zr phases has increased significantly, with relatively longer dimensions, approximately 1–2 μm. Meanwhile, the number of granular phases gradually decreases, and the phases are unevenly distributed within the microstructure. This phenomenon may be attributed to the faster deformation rate at 0.1 s−1, which accelerates the fragmentation of elongated second phases into granular nanoscale second phases, leading to their uneven distribution within the matrix. The fine and dispersed Zn-Zr precipitates can consume Zn dissolved in the Mg matrix, reducing the degree of lattice distortion. This leads to a decrease in the number of newly formed recrystallized grains, allowing the already formed grains more space to grow, resulting in an increase in the average size of the recrystallized grains, which is consistent with the conclusions drawn from the EBSD analysis.

3.6. Dynamic Recrystallization Mechanism Analysis

Magnesium alloys are typical hexagonal close-packed (HCP) crystal materials. The common dislocation slip systems in magnesium alloys include the (0001) < 11 2 ¯ 0 > basal a-slip, 10 1 ¯ 0 < 11 2 ¯ 0 > prismatic slip, 10 1 ¯ 0 < 11 2 ¯ 3 > first pyramidal slip, and 11 2 ¯ 2 < 11 2 ¯ 3 > second pyramidal slip. At lower temperatures, the deformation mechanism in magnesium alloys is mainly basal slip and twinning, while at higher temperatures, prismatic and pyramidal slip systems are activated, accompanied by cross-slip and dislocation climb. The plastic deformation mechanisms in magnesium alloys have a significant impact on dynamic recrystallization [48]. In this study, the TDRX phenomenon was observed in the microstructure at 350 °C and 1 s−1. To investigate the DRX behavior in ZW305K magnesium alloy, a detailed analysis was conducted on the EBSD orientation maps obtained at 400°C and 0.01 s−1. Figure 15a,b present the IPF map and grain boundary map, respectively, of the ZW305K magnesium alloy. Two typical regions, region 1 and region 2, were selected from Figure 15b for analysis, and the DRX mechanism was discussed in detail. Figure 15c,d show magnified orientation maps. The white lines represent LAGBs (2°~15°), and the black lines represent HAGBs (15°~180°).
Throughout thermal deformation, the primary mechanisms of DRX include DDRX and CDRX processes [49]. Qi et al. [50] explored the DRX mechanism of Mg-8Gd-3Y-1Nd-0.5Zr under different deformation conditions and found that as the temperature increased from 350 °C to 500 °C, the main DRX occurred inside the alloy. The mechanism is gradually transformed from TDRX, CDRX, and DDRX. In region 1, typical DDRX characteristics can be observed. Due to the variation in dislocation density at the grain boundaries, DDRX primarily forms serrated or protruding grain boundaries through strain-induced boundary migration (SIBM), which serve as the main nucleation sites for DRX. As shown in Figure 15c, irregular protrusions appear near the original grain boundaries, and these protrusions are separated by LAGBs formed by dislocation accumulation. The reason is due to the rapid dislocation climb at high temperatures; dislocations tend to accumulate and form LAGBs. As deformation progresses, moving dislocations interact with sub-grain boundaries and gradually push LAGBs to transform into HAGBs. During deformation, the migration of initial HAGBs induces local stress concentration, leading to a significant increase in dislocation density on both sides of the grain boundary. The high dislocation density provides a driving force for grain boundary protrusion, further promoting the transformation of LAGBs into HAGBs. As the grain boundaries protrude, new recrystallized grains begin to nucleate and grow through the migration of original grain boundaries and dislocation elimination mechanisms. Dislocation climb not only plays a critical role in plastic deformation but also regulates the formation and development of DRX by driving grain boundary migration and nucleation. In analyzing the orientation difference from the grain interior to the protruding grain boundaries, the orientation angle along the line A-B in Figure 15c does not significantly increase. This may be because, with the continuous migration of HAGBs, the energy produced by dislocations at the grain boundaries is gradually consumed, resulting in a reduced orientation difference. Additionally, the hexagonal lattice units of the original grains and the recrystallized grains shown in the Figure 15c are different. The original grains exhibit a typical basal texture, while the majority of DRX grains have a significant deviation in orientation compared to the original grains.
In region 2, a large number of sub-grain boundaries can be observed near the grain boundaries, indicating significant CDRX. As the temperature increases and the strain rate decreases, the cross-slip of a dislocations changes from screw to edge dislocation type [51]. Additionally, non-basal planes have higher stacking fault energy, making edge dislocations on non-basal planes more prone to climb. The dislocation rearrangement caused by cross-slip and climb results in the formation of many small-angle grain boundaries near the original grain boundaries. On these small-angle grain boundaries, the continuous absorption of dislocations triggers CDRX leading to the formation of new grains, as shown in Figure 15d. The progressive accumulation of dislocations within grains undergoing deformation results in a dislocation density that meets the criteria for DRX initiation. Dislocations then follow the pathway of “dislocation cells—sub-grains—DRX nuclei”, resulting in the formation of CDRX grains [52].
The sub-grains adjacent to the original grains form HAGBs by continuously absorbing dislocations, leading to the formation of recrystallized grains. In the orientation difference diagram, movement from the grain center to the sub-grain boundary along line C-D in Figure 15d is observed, and the orientation deviation from the reference point significantly increases. A high orientation gradient is the fundamental driving force for the transformation of LAGBs into HAGBs [53,54]. The sub-grains achieve the transformation into dynamically recrystallized grains through grain misorientation, which is why the orientation of the sub-grains is consistent with that of the original grains in the diagram. The formation of DRX grains is primarily due to the continuous increase in the LAGB orientation difference. From the pole figures in Figure 15c,d, it can be seen that the grain orientations tend to be more randomly distributed compared to DDRX, indicating that CDRX is more favorable for texture weakening in the alloy [55].
Overall, at 350 °C and a strain rate of 1 s−1, DRX nucleation in the microstructure is primarily induced by twinning, with recrystallized grains mainly distributed around twin boundaries. When the temperature increases to 400 °C and the strain rate decreases to 0.01 s−1, the amount of twinning in the microstructure significantly decreases. At this condition, the nucleation of CDRX occurs due to sub-grain rotation near original grain boundaries. Additionally, there is also DDRX behavior associated with grain boundary migration near these boundaries. The DDRX, CDRX, and TDRX mechanisms contribute to grain refinement, enhancing both strength and ductility. It was also found in the extruded ZM61 alloy after hot rolling [56].

4. Conclusions

In the study, isothermal compression tests on the solution-treated ZW305K were conducted at temperatures ranging from 300 to 450 °C and strain rates between 0. 01 s−1 and 1 s−1. The corresponding constitutive equations and thermal processing diagrams were constructed, and the thermal deformation behavior and DRX mechanism were analyzed through microstructure observation. The following conclusions were drawn:
  • As-cast ZW305K alloy is mainly composed of α-Mg matrix and I-phase and Zn-Zr phase distributed at the grain boundaries. After solution treatment, most of the I-phase on the grain boundary is dissolved into the matrix, and the Zn-Zr phase exists in α-Mg matrix in the form of a precipitated phase. After hot compression deformation, a large number of dispersed second phases appear, which hinders dislocation movement and strengthens the alloy. As the strain rate decreases, the I-phase in the microstructure gradually transforms into the W-phase, and its inhibitory effect on the growth of DRX grains gradually weakens.
  • The activation energy for deformation of ZW305K was determined to be Q = 287 kJ/mol. The constitutive equation obtained is as follows:
    ε ˙ = 1.42 × 10 20 sin h ( 0.0147 σ ] 6.79 exp ( 287,703 R T )
  • Based on the hot processing map, material instability primarily occurs at low temperatures and high strain rates. An increase in temperature or a decrease in strain rate is conducive to the occurrence of dynamic recrystallization, leading to improved processability of the material. The optimal processing range is 400 °C at 0.01 s−1 and 450 °C at 0.1 s−1.
  • The higher the deformation temperature, the lower the strain rate, and the greater the amount of deformation, the higher the degree of recrystallization. At 350 °C and 1 s−1, TDRX nucleation occurs in the microstructure. As the temperature increases and the strain rate decreases, CDRX and DDRX, primarily nucleating at grain boundaries, become the dominant phenomena in the microstructure.

Author Contributions

Conceptualization, H.J.; investigation, H.J.; formal analysis, H.J., Y.W., B.P. and M.H.; funding acquisition, H.J.; writing—original draft, H.J.; writing—review and editing, H.J. and B.P.; investigation, B.Y., Y.W. and M.H.; writing and editing, B.Y. All authors have read and agreed to the published version of the manuscript.

Funding

This study was sponsored by Key Laboratory of Materials and Surface Technology (China Ministry of Education), Xihua University, China, open project xxx-2023-zd004 and University of Shanghai for Science and Technology Medical Engineering Cross Key Support Project 10–22-310–508, and the National Natural Science Foundation of China (52371070).

Data Availability Statement

The original contributions presented in the study are included in the article; further inquiries can be directed to the corresponding author.

Conflicts of Interest

The authors declare no conflicts of interest.

References

  1. Dong, J.; Lin, T.; Shao, H.; Wang, H.; Wang, X.; Song, K.; Li, Q. Advances in degradation behavior of biomedical magnesium alloys: A review. J. Alloys Compd. 2022, 908, 164600. [Google Scholar] [CrossRef]
  2. Wang, J.; Dou, J.; Wang, Z.; Hu, C.; Yu, H.; Chen, C. Research progress of biodegradable magnesium-based biomedical materials: A review. J. Alloys Compd. 2022, 923, 166377. [Google Scholar] [CrossRef]
  3. Huang, Y.; Zhang, Y.; Song, J.; Pan, F.; Willumeit-Römer, R.; Kainer, K.U.; Hort, N. Development and prospects of degradable magnesium alloys for structural and functional applications in the fields of environment and energy. J. Magnes. Alloys 2023, 11, 3926–3947. [Google Scholar] [CrossRef]
  4. Bai, H.; He, X.; Ding, P.; Liu, D.; Chen, M. Fabrication, microstructure, and properties of a biodegradable Mg-Zn-Ca clip. J. Biomed. Mater. Res. B Appl. Biomater. 2019, 107, 1741–1749. [Google Scholar] [CrossRef] [PubMed]
  5. Ikeo, N.; Nakamura, R.; Naka, K.; Hashimoto, T.; Yoshida, T.; Urade, T.; Fukushima, K.; Yabuuchi, H.; Fukumoto, T.; Ku, Y.; et al. Fabrication of a magnesium alloy with excellent ductility for biodegradable clips. Acta Biomater. 2016, 29, 468–476. [Google Scholar] [CrossRef]
  6. Savaedi, Z.; Motallebi, R.; Mirzadeh, H.; Mehdinavaz Aghdam, R.; Mahmudi, R. Superplasticity of fine-grained magnesium alloys for biomedical applications: A comprehensive review. Curr. Opin. Solid State Mater. Sci. 2023, 27, 101058. [Google Scholar] [CrossRef]
  7. Zhang, J.; Liu, S.; Wu, R.; Hou, L.; Zhang, M. Recent developments in high-strength Mg-RE-based alloys: Focusing on Mg-Gd and Mg-Y systems. J. Magnes. Alloys 2018, 6, 277–291. [Google Scholar] [CrossRef]
  8. Li, H.-z.; Liu, H.-t.; Li, F.-b.; Wang, H.-j.; Liang, X.-p.; Liu, C.-m. Microstructures and Properties of Extruded Mg-Gd-Y-Zr Alloys Containing Zn. J. Mater. Eng. Perform. 2011, 21, 1056–1060. [Google Scholar] [CrossRef]
  9. Zhang, Z.; Liu, X.; Wang, Z.; Le, Q.; Hu, W.; Bao, L.; Cui, J. Effects of phase composition and content on the microstructures and mechanical properties of high strength Mg–Y–Zn–Zr alloys. Mater. Des. 2015, 88, 915–923. [Google Scholar] [CrossRef]
  10. Bazhenov, V.E.; Koltygin, A.V.; Sung, M.C.; Park, S.H.; Tselovalnik, Y.V.; Stepashkin, A.A.; Rizhsky, A.A.; Belov, M.V.; Belov, V.D.; Malyutin, K.V. Development of Mg–Zn–Y–Zr casting magnesium alloy with high thermal conductivity. J. Magnes. Alloys 2021, 9, 1567–1577. [Google Scholar] [CrossRef]
  11. Li, P.; Sun, Y.; Zhu, S.; Wang, L.; Guan, S.; Wang, J. Microstructure, corrosion and mechanical properties of as-cast Mg-Zn-Y with different Zn-to-Y ratios. Mater. Today Commun. 2023, 37, 107562. [Google Scholar] [CrossRef]
  12. Singh, A.; Watanabe, M.; Kato, A.; Tsai, A.P. Strengthening in magnesium alloys by icosahedral phase. Sci. Technol. Adv. Mater. 2016, 6, 895–901. [Google Scholar] [CrossRef]
  13. Huang, Z.H.; Liang, S.M.; Chen, R.S.; Han, E.H. Solidification pathways and constituent phases of Mg–Zn–Y–Zr alloys. J. Alloys Compd. 2009, 468, 170–178. [Google Scholar] [CrossRef]
  14. Yamasaki, M.; Hashimoto, K.; Hagihara, K.; Kawamura, Y. Effect of multimodal microstructure evolution on mechanical properties of Mg–Zn–Y extruded alloy. Acta Mater. 2011, 59, 3646–3658. [Google Scholar] [CrossRef]
  15. Huang, H.; Miao, H.; Yuan, G.; Wang, Z.; Ding, W. Fabrication of ultra-high strength magnesium alloys over 540 MPa with low alloying concentration by double continuously extrusion. J. Magnes. Alloys 2018, 6, 107–113. [Google Scholar] [CrossRef]
  16. Pan, H.; Qin, G.; Huang, Y.; Ren, Y.; Sha, X.; Han, X.; Liu, Z.-Q.; Li, C.; Wu, X.; Chen, H.; et al. Development of low-alloyed and rare-earth-free magnesium alloys having ultra-high strength. Acta Mater. 2018, 149, 350–363. [Google Scholar] [CrossRef]
  17. Hu, K.; Li, C.; Xu, G.; Guo, R.; Le, Q.; Liao, Q. Effect of extrusion temperature on the microstructure and mechanical properties of low Zn containing wrought Mg alloy micro-alloying with Mn and La-rich misch metal. Mater. Sci. Eng. A 2019, 742, 692–703. [Google Scholar] [CrossRef]
  18. Nakata, T.; Mezaki, T.; Xu, C.; Oh-ishi, K.; Shimizu, K.; Hanaki, S.; Kamado, S. Improving tensile properties of dilute Mg-0.27Al-0.13Ca-0.21Mn (at.%) alloy by low temperature high speed extrusion. J. Alloys Compd. 2015, 648, 428–437. [Google Scholar] [CrossRef]
  19. Stanford, N.; Callaghan, M.D.; de Jong, B. The effect of rare earth elements on the behaviour of magnesium-based alloys: Part 1—Hot deformation behaviour. Mater. Sci. Eng. A 2013, 565, 459–468. [Google Scholar] [CrossRef]
  20. Xia, X.; Zhang, K.; Li, X.; Ma, M.; Li, Y. Microstructure and texture of coarse-grained Mg–Gd–Y–Nd–Zr alloy after hot compression. Mater. Des. 2013, 44, 521–527. [Google Scholar] [CrossRef]
  21. Jonas, J.J.; Aranas, C.; Fall, A.; Jahazi, M. Transformation softening in three titanium alloys. Mater. Des. 2017, 113, 305–310. [Google Scholar] [CrossRef]
  22. Ning, Y.Q.; Luo, X.; Liang, H.Q.; Guo, H.Z.; Zhang, J.L.; Tan, K. Competition between dynamic recovery and recrystallization during hot deformation for TC18 titanium alloy. Mater. Sci. Eng. A 2015, 635, 77–85. [Google Scholar] [CrossRef]
  23. Zhang, H.; Chen, S.; Huang, Y.; Zhou, H.; Qin, S.; Liu, J. Hot deformation behavior and processing map of vanadium particles reinforced AZ31 composite. J. Alloys Compd. 2024, 999, 175047. [Google Scholar] [CrossRef]
  24. Yin, L.; Wu, Y. Comparison of Constitutive Models and Microstructure Evolution of GW103K Magnesium Alloy during Hot Deformation. Materials 2022, 15, 4116. [Google Scholar] [CrossRef]
  25. Xia, X.; Chen, Q.; Huang, S.; Lin, J.; Hu, C.; Zhao, Z. Hot deformation behavior of extruded Mg–Zn–Y–Zr alloy. J. Alloys Compd. 2015, 644, 308–316. [Google Scholar] [CrossRef]
  26. Singh, A.; Somekawa, H.; Mukai, T. High temperature processing of Mg–Zn–Y alloys containing quasicrystal phase for high strength. Mater. Sci. Eng. A 2011, 528, 6647–6651. [Google Scholar] [CrossRef]
  27. Singh, A.; Watanabe, M.; Kato, A.; Tsai, A.P. Formation of icosahedral–hexagonal H phase nano-composites in Mg–Zn–Y alloys. Scr. Mater. 2004, 51, 955–960. [Google Scholar] [CrossRef]
  28. Zhang, Y.; Hong, Y.; Li, H.; Zhang, D. Creep behavior and dynamic precipitation of highly heat-resistant Mg alloy with low rare-earth content. J. Alloys Compd. 2024, 997, 174960. [Google Scholar] [CrossRef]
  29. Xia, Z.; Huang, R.; Yan, C.; Xin, Y.; Feng, B.; Xu, J.; Huang, G.; Zhao, L. Mechanical properties and corrosion behavior of a ZK60 magnesium alloy containing profuse twins and precipitates. J. Mater. Res. Technol. 2024, 29, 1767–1778. [Google Scholar] [CrossRef]
  30. Xu, Y.; Li, J.; Qi, M.; Liao, L.; Gao, Z. Enhanced mechanical properties of Mg-Zn-Y-Zr alloy by low-speed indirect extrusion. J. Mater. Res. Technol. 2020, 9, 9856–9867. [Google Scholar] [CrossRef]
  31. Zhang, N.; Liu, M.; Li, Q.; Chen, X.; Zheng, Z. Effect of long-period stacking ordered phase on dynamic recrystallization in Mg-Y-Zn-Zr alloy processed by backward extrusion. J. Mater. Res. Technol. 2023, 26, 2384–2393. [Google Scholar] [CrossRef]
  32. Sun, W.; Deng, Y.; Zhan, H.; Zhou, X.; Yao, Y.; Liu, W.; Zeng, G. Interaction of dynamic precipitation and dynamic recrystallization of a Mg-4Sn-3Al-1Zn alloy during hot compression. J. Alloys Compd. 2024, 970, 172434. [Google Scholar] [CrossRef]
  33. Zhang, L.; Yuan, S.; Wang, J.; Chen, L.; Jin, P. Hot deformation behavior, processing map, microstructure evolution and dynamic recrystallization mechanism of Mg-5Al-0.6Sc alloy. J. Alloys Compd. 2022, 922, 166244. [Google Scholar] [CrossRef]
  34. Li, H.Z.; Wang, H.J.; Li, Z.; Liu, C.M.; Liu, H.T. Flow behavior and processing map of as-cast Mg–10Gd–4.8Y–2Zn–0.6Zr alloy. Mater. Sci. Eng. A 2010, 528, 154–160. [Google Scholar] [CrossRef]
  35. Ebrahimpourghandi, B.; Mahmudi, R. Hot deformation constitutive analysis and processing maps of the as-cast and wrought Mg–2.5Gd–0.5Zr alloy. J. Alloys Compd. 2023, 942, 169132. [Google Scholar] [CrossRef]
  36. Savaedi, Z.; Motallebi, R.; Mirzadeh, H. A review of hot deformation behavior and constitutive models to predict flow stress of high-entropy alloys. J. Alloys Compd. 2022, 903, 163964. [Google Scholar] [CrossRef]
  37. Tahreen, N.; Zhang, D.F.; Pan, F.S.; Jiang, X.Q.; Li, D.Y.; Chen, D.L. Texture evolution and deformation activity of an extruded magnesium alloy: Effect of yttrium and deformation temperature. J. Alloys Compd. 2016, 688, 270–284. [Google Scholar] [CrossRef]
  38. Zhou, Z.; Wang, Q.; Chen, R.; Wang, X.; Chen, D.; Fu, H. Hot deformation and constitutive equation for ultrasonic treated Nb-Si-Ti-Gd refractory alloy. Int. J. Refract. Met. Hard Mater. 2023, 112, 106129. [Google Scholar] [CrossRef]
  39. Zhou, H.T.; Li, Q.B.; Zhao, Z.K.; Liu, Z.C.; Wen, S.F.; Wang, Q.D. Hot workability characteristics of magnesium alloy AZ80—A study using processing map. Mater. Sci. Eng. A 2010, 527, 2022–2026. [Google Scholar] [CrossRef]
  40. Prasad, Y.V.R.K.; Gegel, H.L.; Doraivelu, S.M.; Malas, J.C.; Morgan, J.T.; Lark, K.A.; Barker, D.R. Modeling of dynamic material behavior in hot deformation: Forging of Ti-6242. Metall. Trans. A 1984, 15, 1883–1892. [Google Scholar] [CrossRef]
  41. Li, C.; Huang, L.; Zhao, M.; Guo, S.; Su, Y.; Li, J. Characterization of hot workability of Ti-6Cr-5Mo-5V-4Al alloy based on hot processing map and microstructure evolution. J. Alloys Compd. 2022, 905, 164161. [Google Scholar] [CrossRef]
  42. Long, J.; Deng, L.; Jin, J.; Zhang, M.; Tang, X.; Gong, P.; Wang, X.; Xiao, G.; Xia, Q. Enhancing constitutive description and workability characterization of Mg alloy during hot deformation using machine learning-based Arrhenius-type model. J. Magnes. Alloys 2024, 12, 3003–3023. [Google Scholar] [CrossRef]
  43. Ding, N.; Du, W.; Li, S.; Liu, K.; Du, X.; Yu, Z. Strain rate dependence of dynamic recrystallization and texture evolution in hot compressed Mg-Gd-Er-Zr alloy. J. Magnes. Alloys 2023. [Google Scholar] [CrossRef]
  44. Li, Z.; Wu, G.; Yu, J.; Wang, J.; Han, J.; Cui, H.; Zhang, Z. Influence of strain rate on grain refinement and texture evolution under complex shear stress conditions. J. Magnes. Alloys 2022, 11, 2558–2584. [Google Scholar] [CrossRef]
  45. Liu, J.F.; Yang, Z.Q.; Ye, H.Q. In situ transmission electron microscopy investigation of quasicrystal-crystal transformations in Mg–Zn–Y alloys. J. Alloys Compd. 2015, 621, 179–188. [Google Scholar] [CrossRef]
  46. Wang, Y.; Huang, Y.; Meng, X.; Wan, L.; Feng, J. Microstructural evolution and mechanical properties of Mg Zn Y Zr alloy during friction stir processing. J. Alloys Compd. 2017, 696, 875–883. [Google Scholar] [CrossRef]
  47. Liao, Q.; Hu, W.; Chen, R.; Le, Q. Effect of Zn/Y atomic ratio on precipitation behavior and dynamic recrystallization behavior of Mg–Zn–Y alloy under different extrusion temperature. J. Mater. Res. Technol. 2023, 27, 48–62. [Google Scholar] [CrossRef]
  48. Liu, Q.; Roy, A.; Silberschmidt, V.V. Temperature-dependent crystal-plasticity model for magnesium: A bottom-up approach. Mech. Mater. 2017, 113, 44–56. [Google Scholar] [CrossRef]
  49. Zhu, Y.; Cao, Y.; He, Q.; Zhang, J.; Luo, R.; Di, H.; Huang, G.; Liu, Q. Three-dimensional hot processing map of a nickel-based superalloy (Alloy 925) established by modified artificial neural network model. Intermetallics 2022, 141, 107433. [Google Scholar] [CrossRef]
  50. Qi, H.N.; Zhang, Z.M.; Yu, J.M.; Yin, X.Y.; Du, Z.Y. Dynamic Recrystallization of Mg-8Gd-3Y-1Nd-0.5Zr Alloy during Hot Deformation. Mater. Sci. Forum 2017, 898, 311–322. [Google Scholar] [CrossRef]
  51. del Valle, J.A.; Carreño, F.; Ruano, O.A. Influence of texture and grain size on work hardening and ductility in magnesium-based alloys processed by ECAP and rolling. Acta Mater. 2006, 54, 4247–4259. [Google Scholar] [CrossRef]
  52. Jia, Z.; Zhang, P.; Wang, H.; Ji, J.; Wang, T.; Wang, Y.; Wang, X. Thermal Deformation Characteristics and Dynamic Recrystallization Mechanism of Incoloy 800H Alloy under Different Deformations. Adv. Eng. Mater. 2023, 25. [Google Scholar] [CrossRef]
  53. Beer, A.G.; Barnett, M.R. Microstructural Development during Hot Working of Mg-3Al-1Zn. Metall. Mater. Trans. A 2007, 38, 1856–1867. [Google Scholar] [CrossRef]
  54. Ding, X.; Zhao, F.; Shuang, Y.; Ma, L.; Chu, Z.; Zhao, C. Characterization of hot deformation behavior of as-extruded AZ31 alloy through kinetic analysis and processing maps. J. Mater. Process. Technol. 2020, 276, 116325. [Google Scholar] [CrossRef]
  55. Wang, L.; Zhang, Z.; Zhang, H.; Wang, H.; Shin, K.S. The dynamic recrystallization and mechanical property responses during hot screw rolling on pre-aged ZM61 magnesium alloys. Mater. Sci. Eng. A 2020, 798, 140126. [Google Scholar] [CrossRef]
  56. Ling, Z.; Yang, K.; Wang, L.; Ma, K.; Zhang, D.; Li, Y.; Zhang, Z.; Zhao, Z.; Bai, P. Hot deformation behavior and microstructural evolutions of a Mg-Gd-Y-Zn-Zr alloy prepared by hot extrusion. J. Alloys Compd. 2024, 1009, 176916. [Google Scholar] [CrossRef]
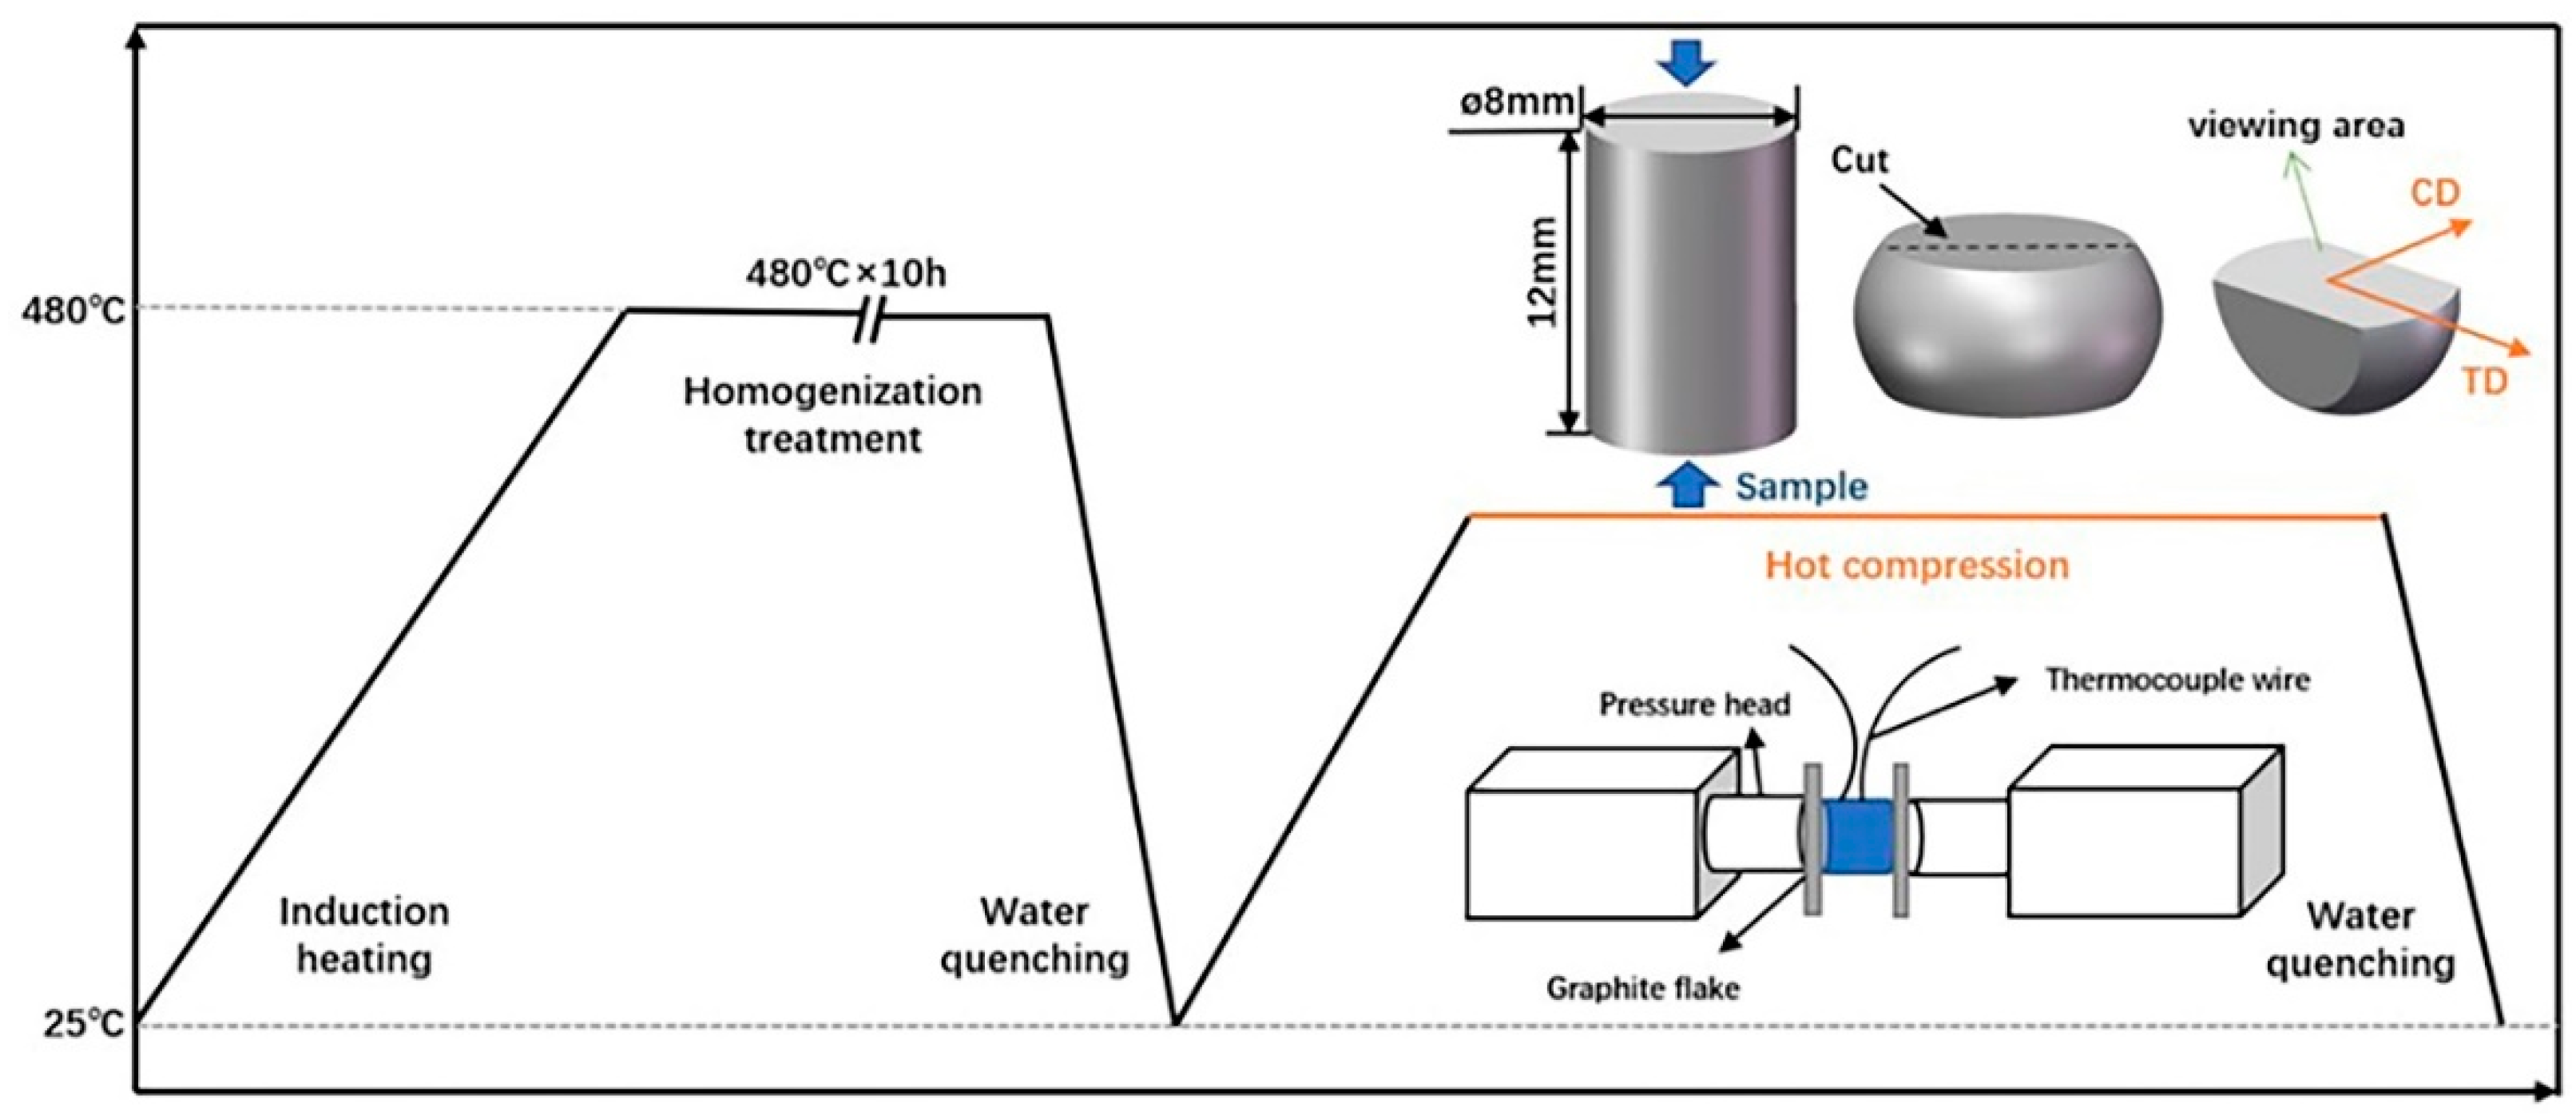
Figure 1. Schematic of hot compression process.
Metals 14 01332 g001
Figure 2. Microstructures and XRD patterns of ZW305K magnesium alloy: (a,c) as-cast; (b,d) T4 state; (e) XRD.
Metals 14 01332 g002
Figure 3. True stress–strain curves of ZW305K at various temperatures with different strain rates: (a) 0.01 s−1; (b) 0.1 s−1; (c) 1 s−1.
Metals 14 01332 g003
Figure 4. Linear relationship fitting: (a) ln σ   ln ε ˙ ; (b) σ l n ε ˙ .
Metals 14 01332 g004
Figure 5. Linear relationship fitting: (a) ln ε ˙ − ln[sinh(ασ)]; (b) ln[sinh(ασ)] − 1/T.
Metals 14 01332 g005
Figure 6. Relationship between ln Z and ln ( sinh α σ ).
Metals 14 01332 g006
Figure 7. Power dissipation diagram (a) and flow instability diagram (b) of ZW305K magnesium alloy at 0.5 strain.
Metals 14 01332 g007
Figure 8. Processing map of ZW305K magnesium alloy at 0.5 strain.
Metals 14 01332 g008
Figure 9. The true stress–strain curve with a strain rate of 1 s−1, a deformation temperature of 400 °C, and a strain of 0.9.
Metals 14 01332 g009
Figure 10. The microstructure of ZW305K magnesium alloy at different strains with a strain rate of 1 s−1 and a deformation temperature of 400 °C: (a) ε = 0.2; (b) ε = 0.5; (c) ε = 0.9.
Metals 14 01332 g010
Figure 11. EBSD results of ZW305K magnesium alloy at 350 °C (ad) and 400° C (eh) with strain rate of 1 s−1: (a,e) IPF maps; (b,f) grain boundary images; (c,g) grain size distribution diagrams; (d,h) orientation difference angle distribution diagrams.
Metals 14 01332 g011
Figure 12. EBSD results of ZW305K magnesium alloy at 400 °C with strain rates of 0.01 s−1 (ad) and 0.1 s−1 (eh): (a,e) IPF maps; (b,f) grain boundary images; (c,g) grain size distribution diagrams; (d,h) orientation difference angle distribution diagrams.
Metals 14 01332 g012
Figure 13. TEM morphology of ZW305K magnesium alloy at 400 °C under different strain rates: (a,d) 0.01 s−1 (b,e) 0.1 s−1; (c,f) 1 s−1.
Metals 14 01332 g013
Figure 14. TEM morphology of ZW305K magnesium alloy at 400 °C under different strain rates: (ac) 1 s−1; (df) 0.1 s−1; (gi) 0.01 s−1.
Metals 14 01332 g014
Figure 15. Overview of the DRX mechanism of ZW305K magnesium alloy (T = 400 ℃, ε ˙   = 0.01 s−1) (a) IPF map; (b) grain boundary diagram; (c,d) area enlargement diagram.
Metals 14 01332 g015
Table 1. Chemical composition of experimental alloy (wt.%).
ElementMgZnYZrFe
ContentBal2.800.320.650.0081
Disclaimer/Publisher’s Note: The statements, opinions and data contained in all publications are solely those of the individual author(s) and contributor(s) and not of MDPI and/or the editor(s). MDPI and/or the editor(s) disclaim responsibility for any injury to people or property resulting from any ideas, methods, instructions or products referred to in the content.