Article

Fracture and Fatigue Crack Growth Behaviour of A516 Gr 60 Steel Welded Joints

1
Faculty of Technical Sciences, Department for Mechanical Engineering, 38220 Kosovska Mitrovica, Serbia
2
Faculty of Mechanical Engineering, University of Belgrade, 11120 Belgrade, Serbia
3
Military Technical Institute, 11000 Belgrade, Serbia
4
Innovation Center of the Faculty of Technology and Metallurgy, 11120 Belgrade, Serbia
5
Innovation Center of the Faculty of Mechanical Engineering, 11100 Belgrade, Serbia
*
Author to whom correspondence should be addressed.
Metals 2024, 14(12), 1447; https://doi.org/10.3390/met14121447
Submission received: 3 November 2024 / Revised: 7 December 2024 / Accepted: 12 December 2024 / Published: 17 December 2024
(This article belongs to the Special Issue Fracture Mechanics and Failure Analysis of Metallic Materials)

Abstract

:
The facture and fatigue behaviour of welded joints made of A516 Gr 60 was analysed, bearing in mind their susceptibility to cracking, especially in the case of components which had been in service for a long time period. With respect to fracture, the fracture toughness was determined for all three zones of a welded joint, the base metal (BM), heat-affected zone (HAZ) and weld metal (WM), by applying a standard procedure to evaluate KIc via based on JIc values (ASTM E1820). With respect to fatigue, the fatigue crack growth rates were determined according to the Paris law by the standard procedure (ASTM E647) to evaluate the behaviour of different welded joint zones under amplitude loading. The results obtained for A516 Gr. 60 structural steel showed why it is widely used in the case of static loads, since the minimum value of fracture toughness (185 MPa√m) provides relatively large critical crack lengths, whereas its behaviour under amplitude loading indicated a need for further improvement in WM and HAZ, since the crack growth rate reached values as high as 4.58 × 10⁻⁴ mm/cycle. In addition, risk-based analysis was applied to assess the structural integrity of a pressure vessel, including comparison with the high-strength low-alloy (HSLA) steel NIOVAL 50, proving once again its superior behaviour under static loading.

1. Introduction

Welded joints are of crucial importance for structural integrity in all welded constructions due to their crack sensitivity, caused by material heterogeneity (base metal—BM; heat-affected zone—HAZ; and weld metal—WM), as well as eventual stress concentrations in the case of geometry imperfections [1,2,3]. As shown recently, not only are welded joints typically accompanied by defects, but often multiple defects play an important role [3]. This was shown even for common carbon structural steels (S235, S275), which were examined with respect to their fracture behaviour in the presence of cracks, revealing somewhat surprising results, [3]. On the other had, it is well known that HSLA steels are prone to cracking [1,2,4,5,6] requiring so-called undermatching welded joint design as opposed to more common overmatching design. In both cases, welded joint mismatching is designed to prevent fracture under service loading.
This issue is especially important for components which have been service for a long time period, not only due to the inevitable damage of the material under loading, but also due to the fact that early generations of this steel, and steels in general, were not of the same high quality as they are now. In particular, the contents of phosphorus and sulphur were significantly higher couple of decades ago, making steels more susceptible to cracking than they are nowadays. In addition, the quality of welded joints was also significantly lower than that today. One well-known example of welded joints cracking is the history of problems with Nioval 50 back in 1980s [7].
With respect to A516 steels, few studies can be found in the literature, but they are worth considering, [8,9,10,11]. In [8], a SA516 Gr. 70 steel welded joint was analysed with a focus on the effect of the submerged arc welding speed on strength, microstructure, hardness and impact toughness in the WM and in the HAZ. Mechanisms of fracture were correlated with the impact toughness values using SEM fractography. As expected, the highest hardness values were in the coarse-grained HAZ followed by the WM, with the lowest hardness in the BM.
In [9], the objective was to quantify the effect of loading rate temperature dependence of cleavage fracture toughness data of SA516 Gr. 70 steel (P265GH according to EN standards) on the ductile-to-brittle transition temperature (DBTT) regime. For integrity analysis in a radioactive environment, the concept of a master curve according to ASTM E1921 [10] was used and the reference temperature T0 was evaluated. Toward this aim, a specially designed test setup was made to carry out tests using sub-sized single-edged notched-bend specimens. It was found that the median fracture toughness value, as well as its scatter, increases with temperature in the DBTT regime.
In [11], fracture toughness determination was crucial for the design phase of pressure vessels made of ASTM A516 Gr. 70 steel [12]. Tensile properties and the JIc values were evaluated, taking into account rolling parallel and transverse orientations, to evaluate the effect of perlite banding. Additionally, as for JIc determination, the differences were associated with the different blunting line slope estimations in different standards, indicating the need to use a work-hardening-based blunting line.
In [13], the growth of a semi-elliptical crack in the walls of thick-walled cylindrical pressure vessels made of A516 steel was investigated numerically using 3D FEM models to estimate fatigue life, based on the experimentally evaluated fatigue crack growth rate, using a new proposed specimen. Hardness, tensile properties and Charpy impact toughness were also determined experimentally, but fracture toughness was not.
The research presented in [8,9,11,13] provides good insight into properties and behavioural of A516 steel in the presence of cracks, including its welded joints. Although generally accepted as a material which is not susceptible to cracking and brittle fracture, A516 Gr. 60 steel and its welded joints may still face problems with cracking, especially under fatigue loading, which is not addressed thoroughly in the literature. Therefore, in this paper, A516 Gr. 60 steel is considered a typical carbon structural steel with a somewhat increased level of manganese to improve its strength and to keep its weldability and ductility at a sufficient level [14,15].
This research is focused on A516 Gr. 60 steel welded joints’ resistance to fracture and fatigue crack growth under different types of loading (static, amplitude), bearing in mind its use for pressure vessels (PVs) in the chemical and petrochemical industry, including the transportation of gas and oil, both at ambient and low temperatures. As already mentioned, the main reason for this research was the need to obtain precise data about A516 Gr. 60 steel crack resistance in order to determine the structural integrity of critical components which have been in service for a long time. To assess the structural integrity of a PVs, taken as an example, a recently introduced risk-based procedure is applied, using risk assessment by a risk matrix, [16,17,18], including a comparison of two steels, one being HSLA steel NIOVAL 50 and the other one being A516 Gr. 60.

2. Materials and Methods

A516 Gr. 60 steel belongs to a group of carbon structural steels mainly used for the manufacturing of pressure vessels (spherical tanks, gas tanks, liquid–gas tanks) due to its good mechanical properties at lower temperatures [14,15]. Its yield stress is min. 255 MPa, and its guaranteed impact toughness is at −40 °C is 41 kJ/m2. Plates with a thickness of 15 mm were available for experimental tests which were a part of the presented research. Experimental research consisted of basic material testing such as tests on chemical composition and tensile properties, as well as fracture mechanics (KIc via JIc) and fatigue crack growth rate testing.
The chemical composition of steel A516 Gr. 60 was determined and is shown in Table 1, [14]. Tensile properties are shown in Table 2 as the minimum values of strength measured on 3 specimens [14]. Table 2 also gives the mechanical properties of NIOVAL 50, for comparison purposes.
Welding was performed by the manual metal arc welding (MMAW) process, with EVB Ni electrode as the filler material, [14], using a groove prepared as shown in Figure 1. The chemical composition of the filler material is given in Table 3, whereas its mechanical properties are shown in Table 4.
The root pass (mark 1, Figure 2) and fill passes (marks 2–7, Figure 2) were made with the electrode EVB Ni, diameter 2,5 mm, while fill passes 8–9, shown in Figure 2, were made with the same electrode, diameter 3.25 mm. Preheating was also applied at 120 °C in each pass. Figure 3 shows a macrographic view of the welded joint. The microstructure of the welded joint is shown in Figure 4, Figure 5, Figure 6 and Figure 7, indicating typical ferrite–perlite bands in the BM, shown in Figure 4a, transformed into different shapes in the HAZ, shown Figure 4b, the fusion line (FL), shown in Figure 4c, and the WM, shown in Figure 4d. Microstructures were determined using SEM, with the specimen previously etched using 3% Nital solution.

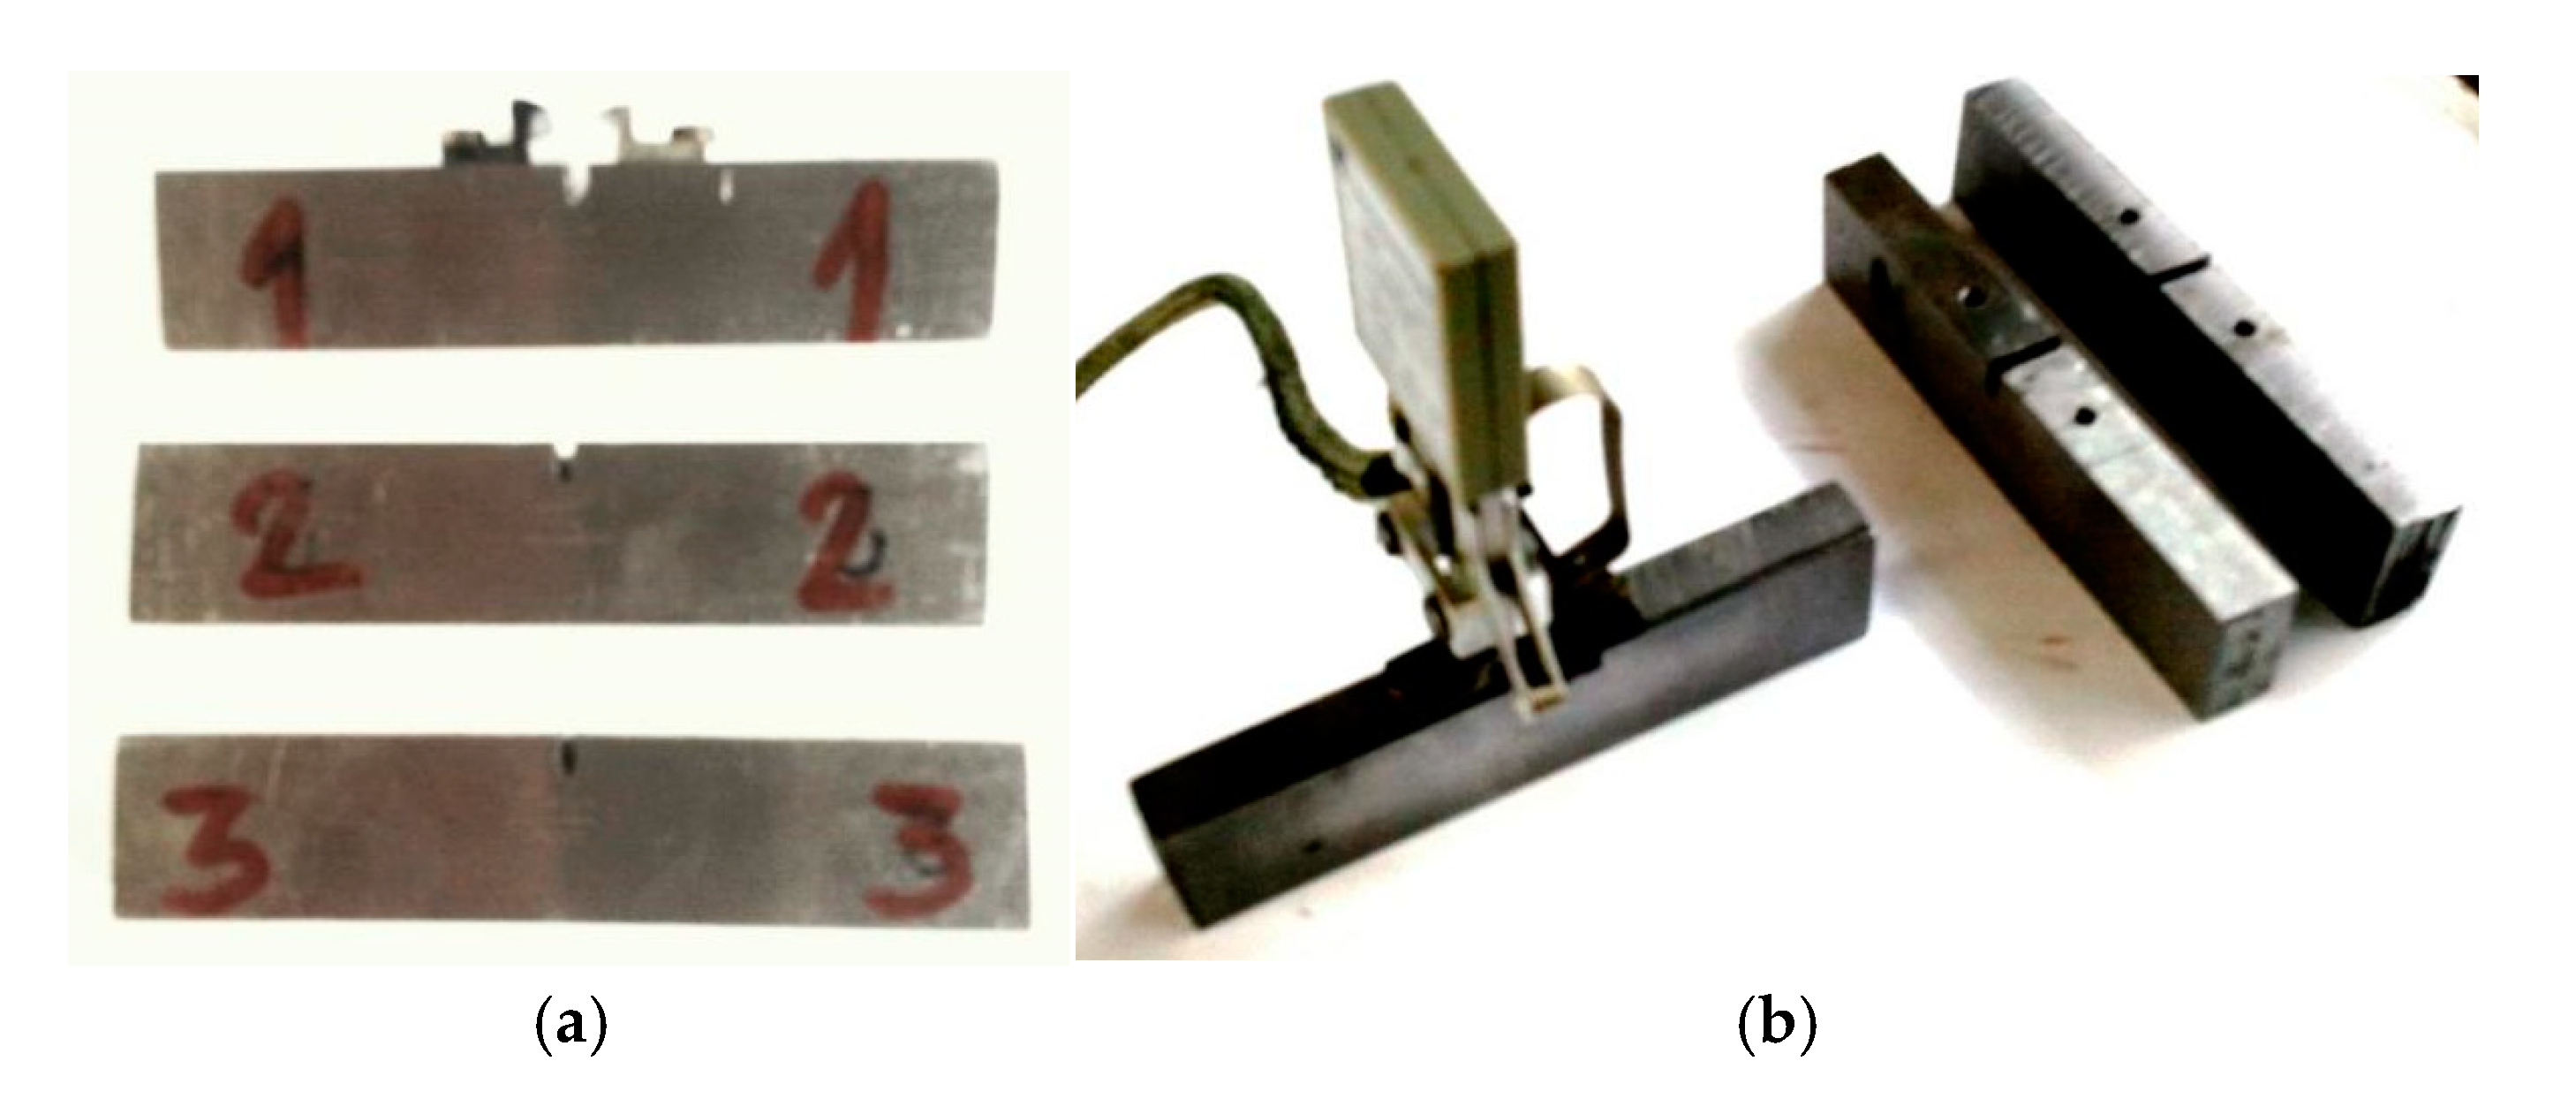
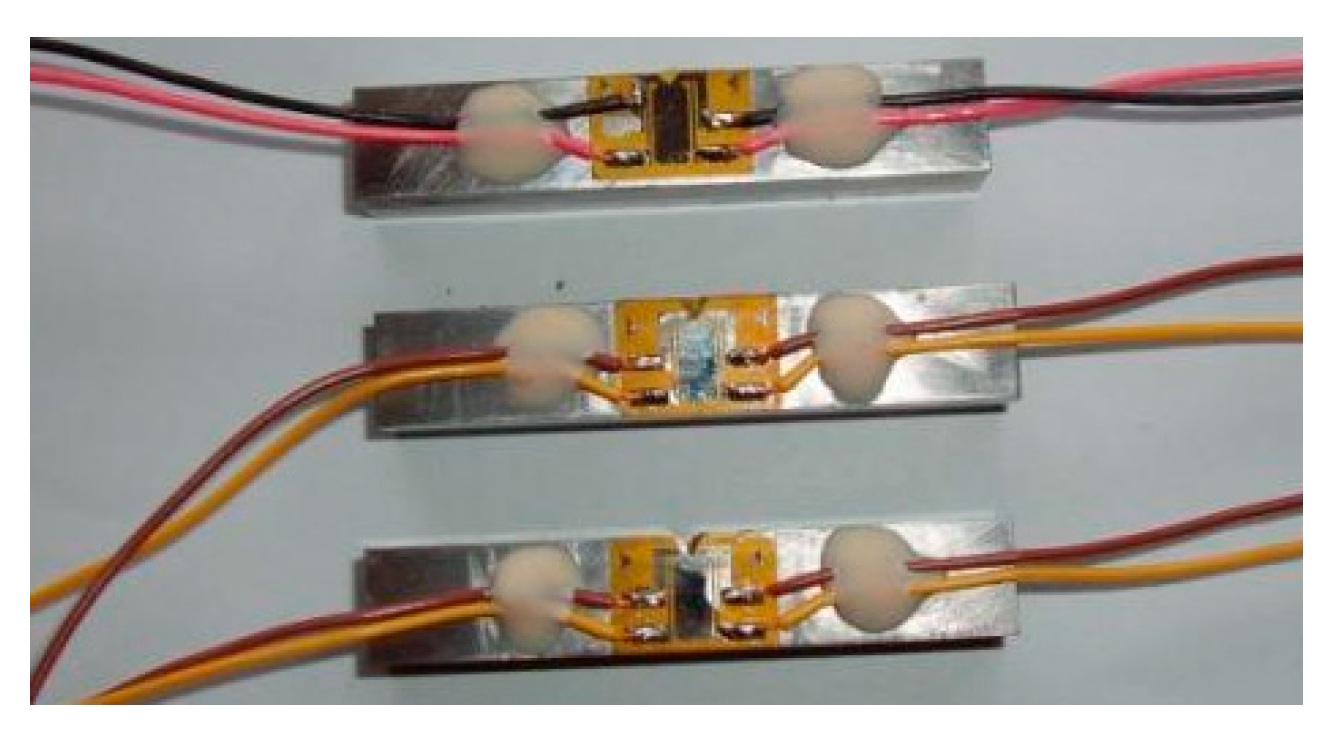
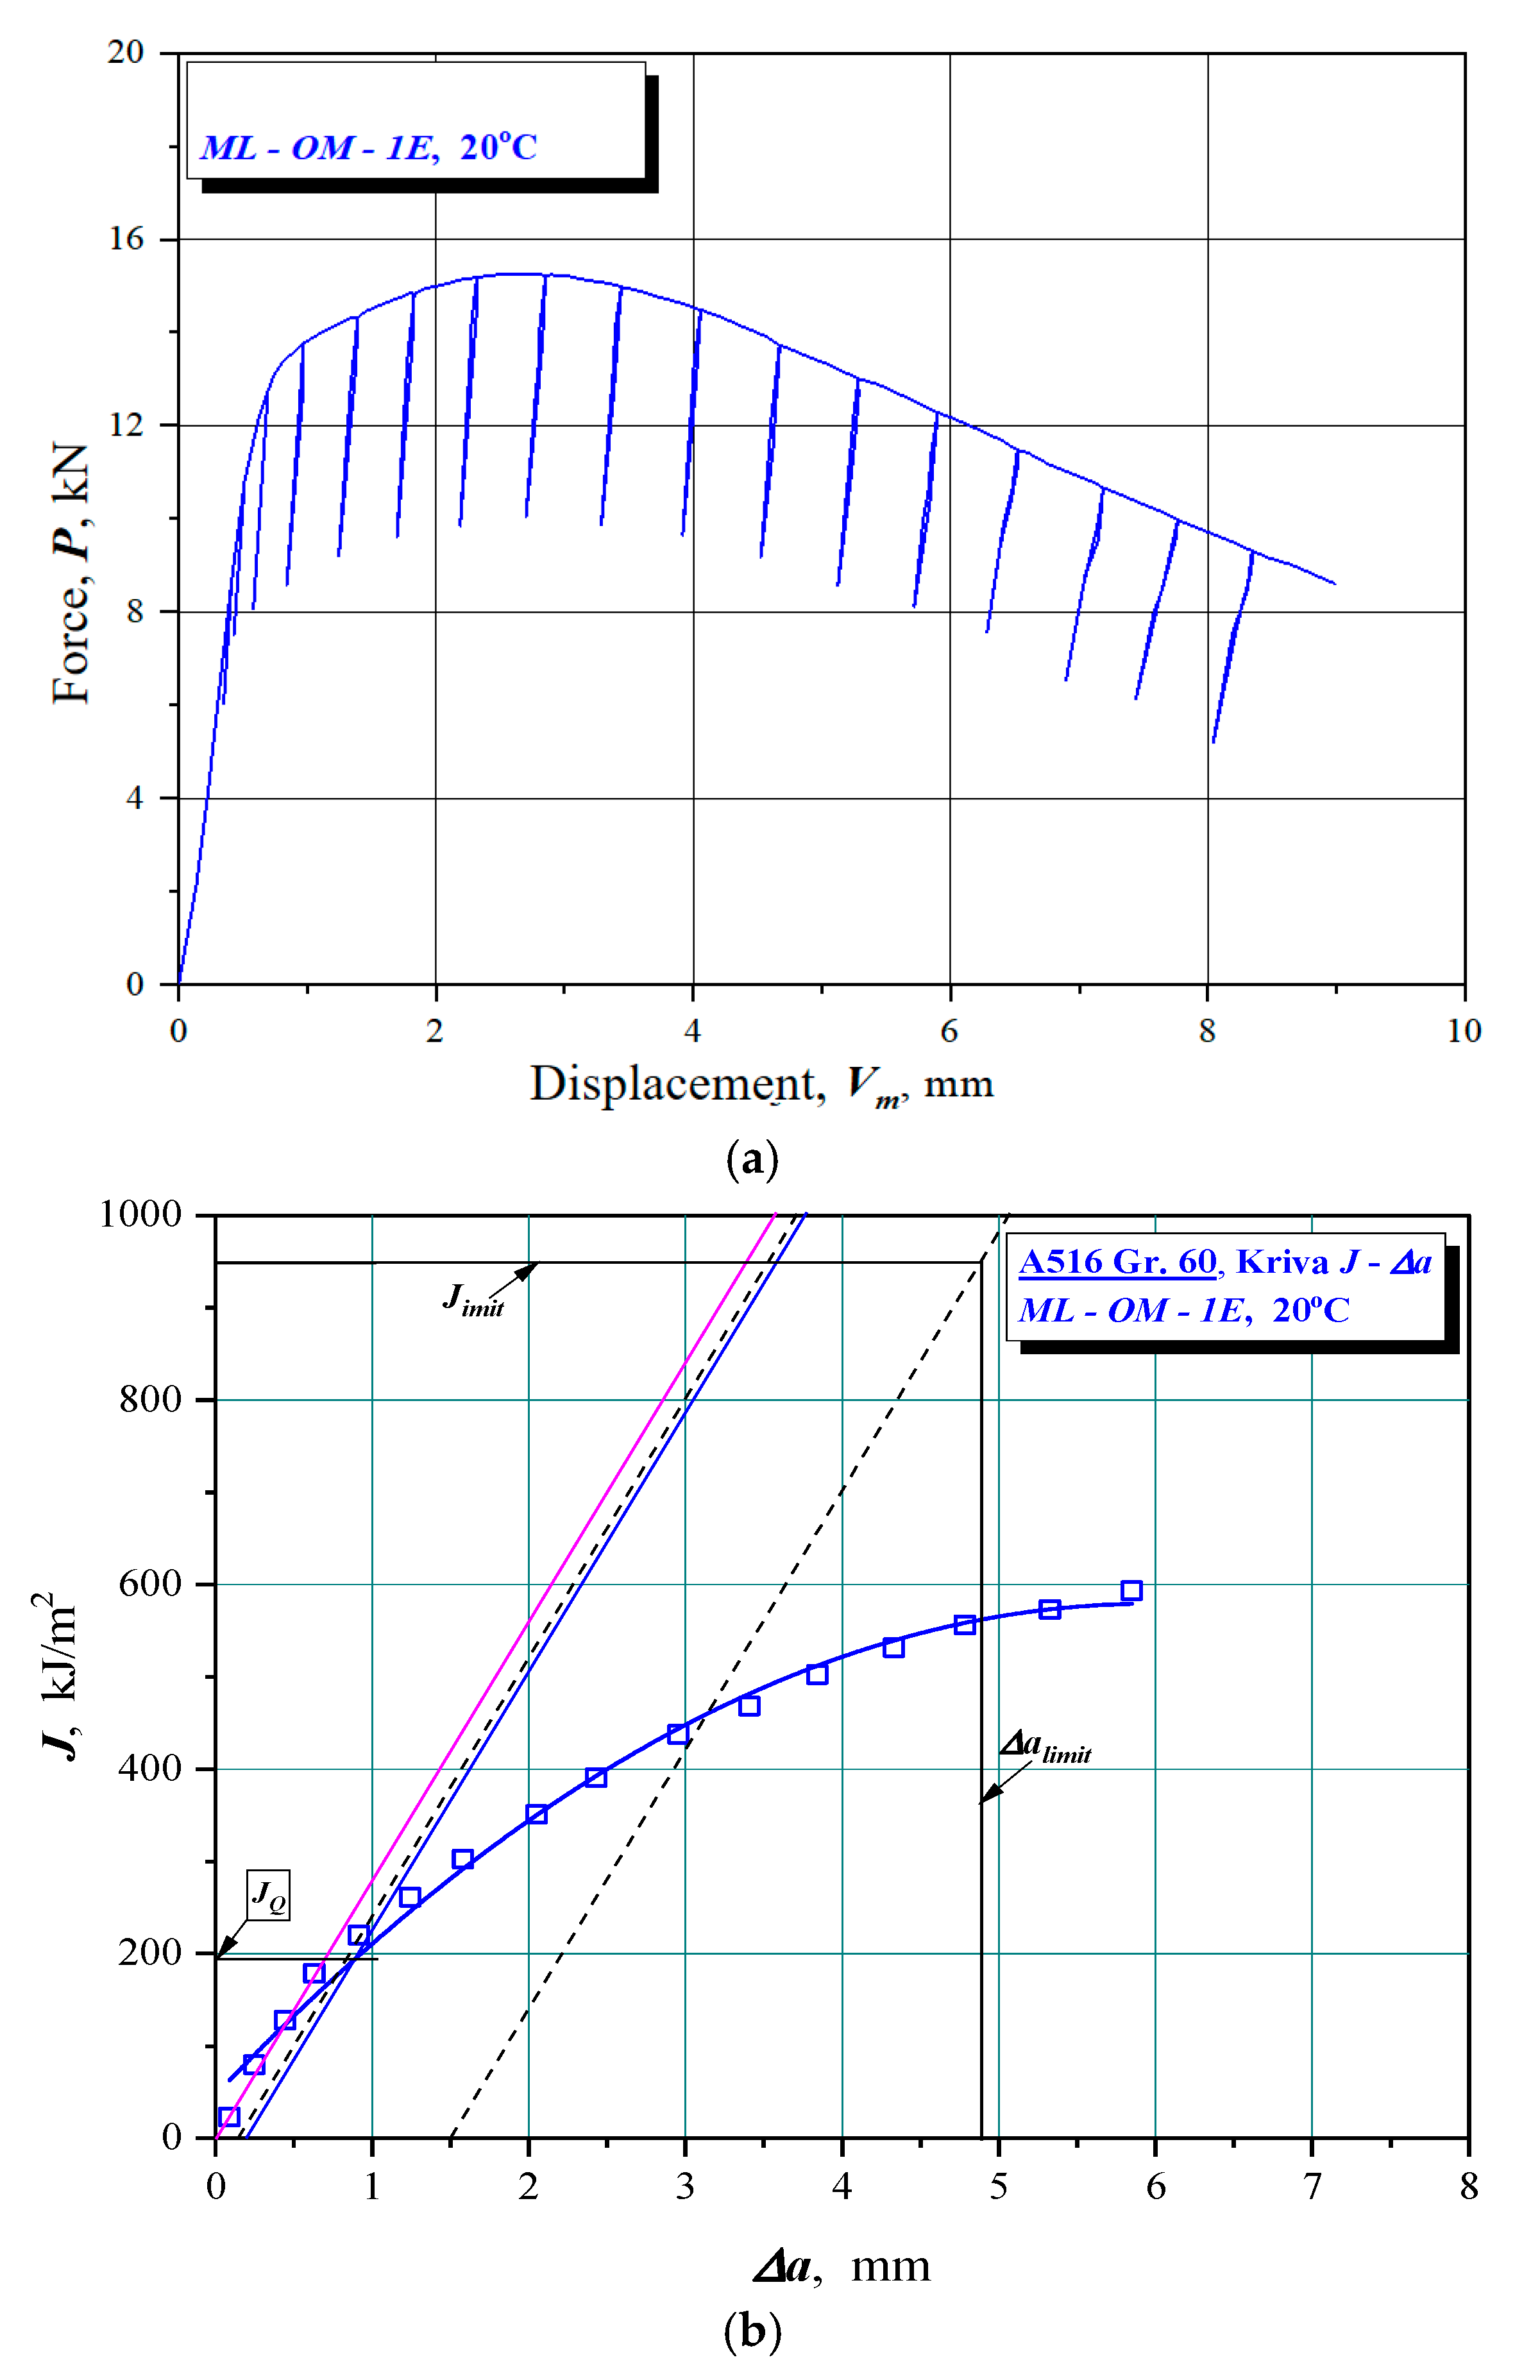
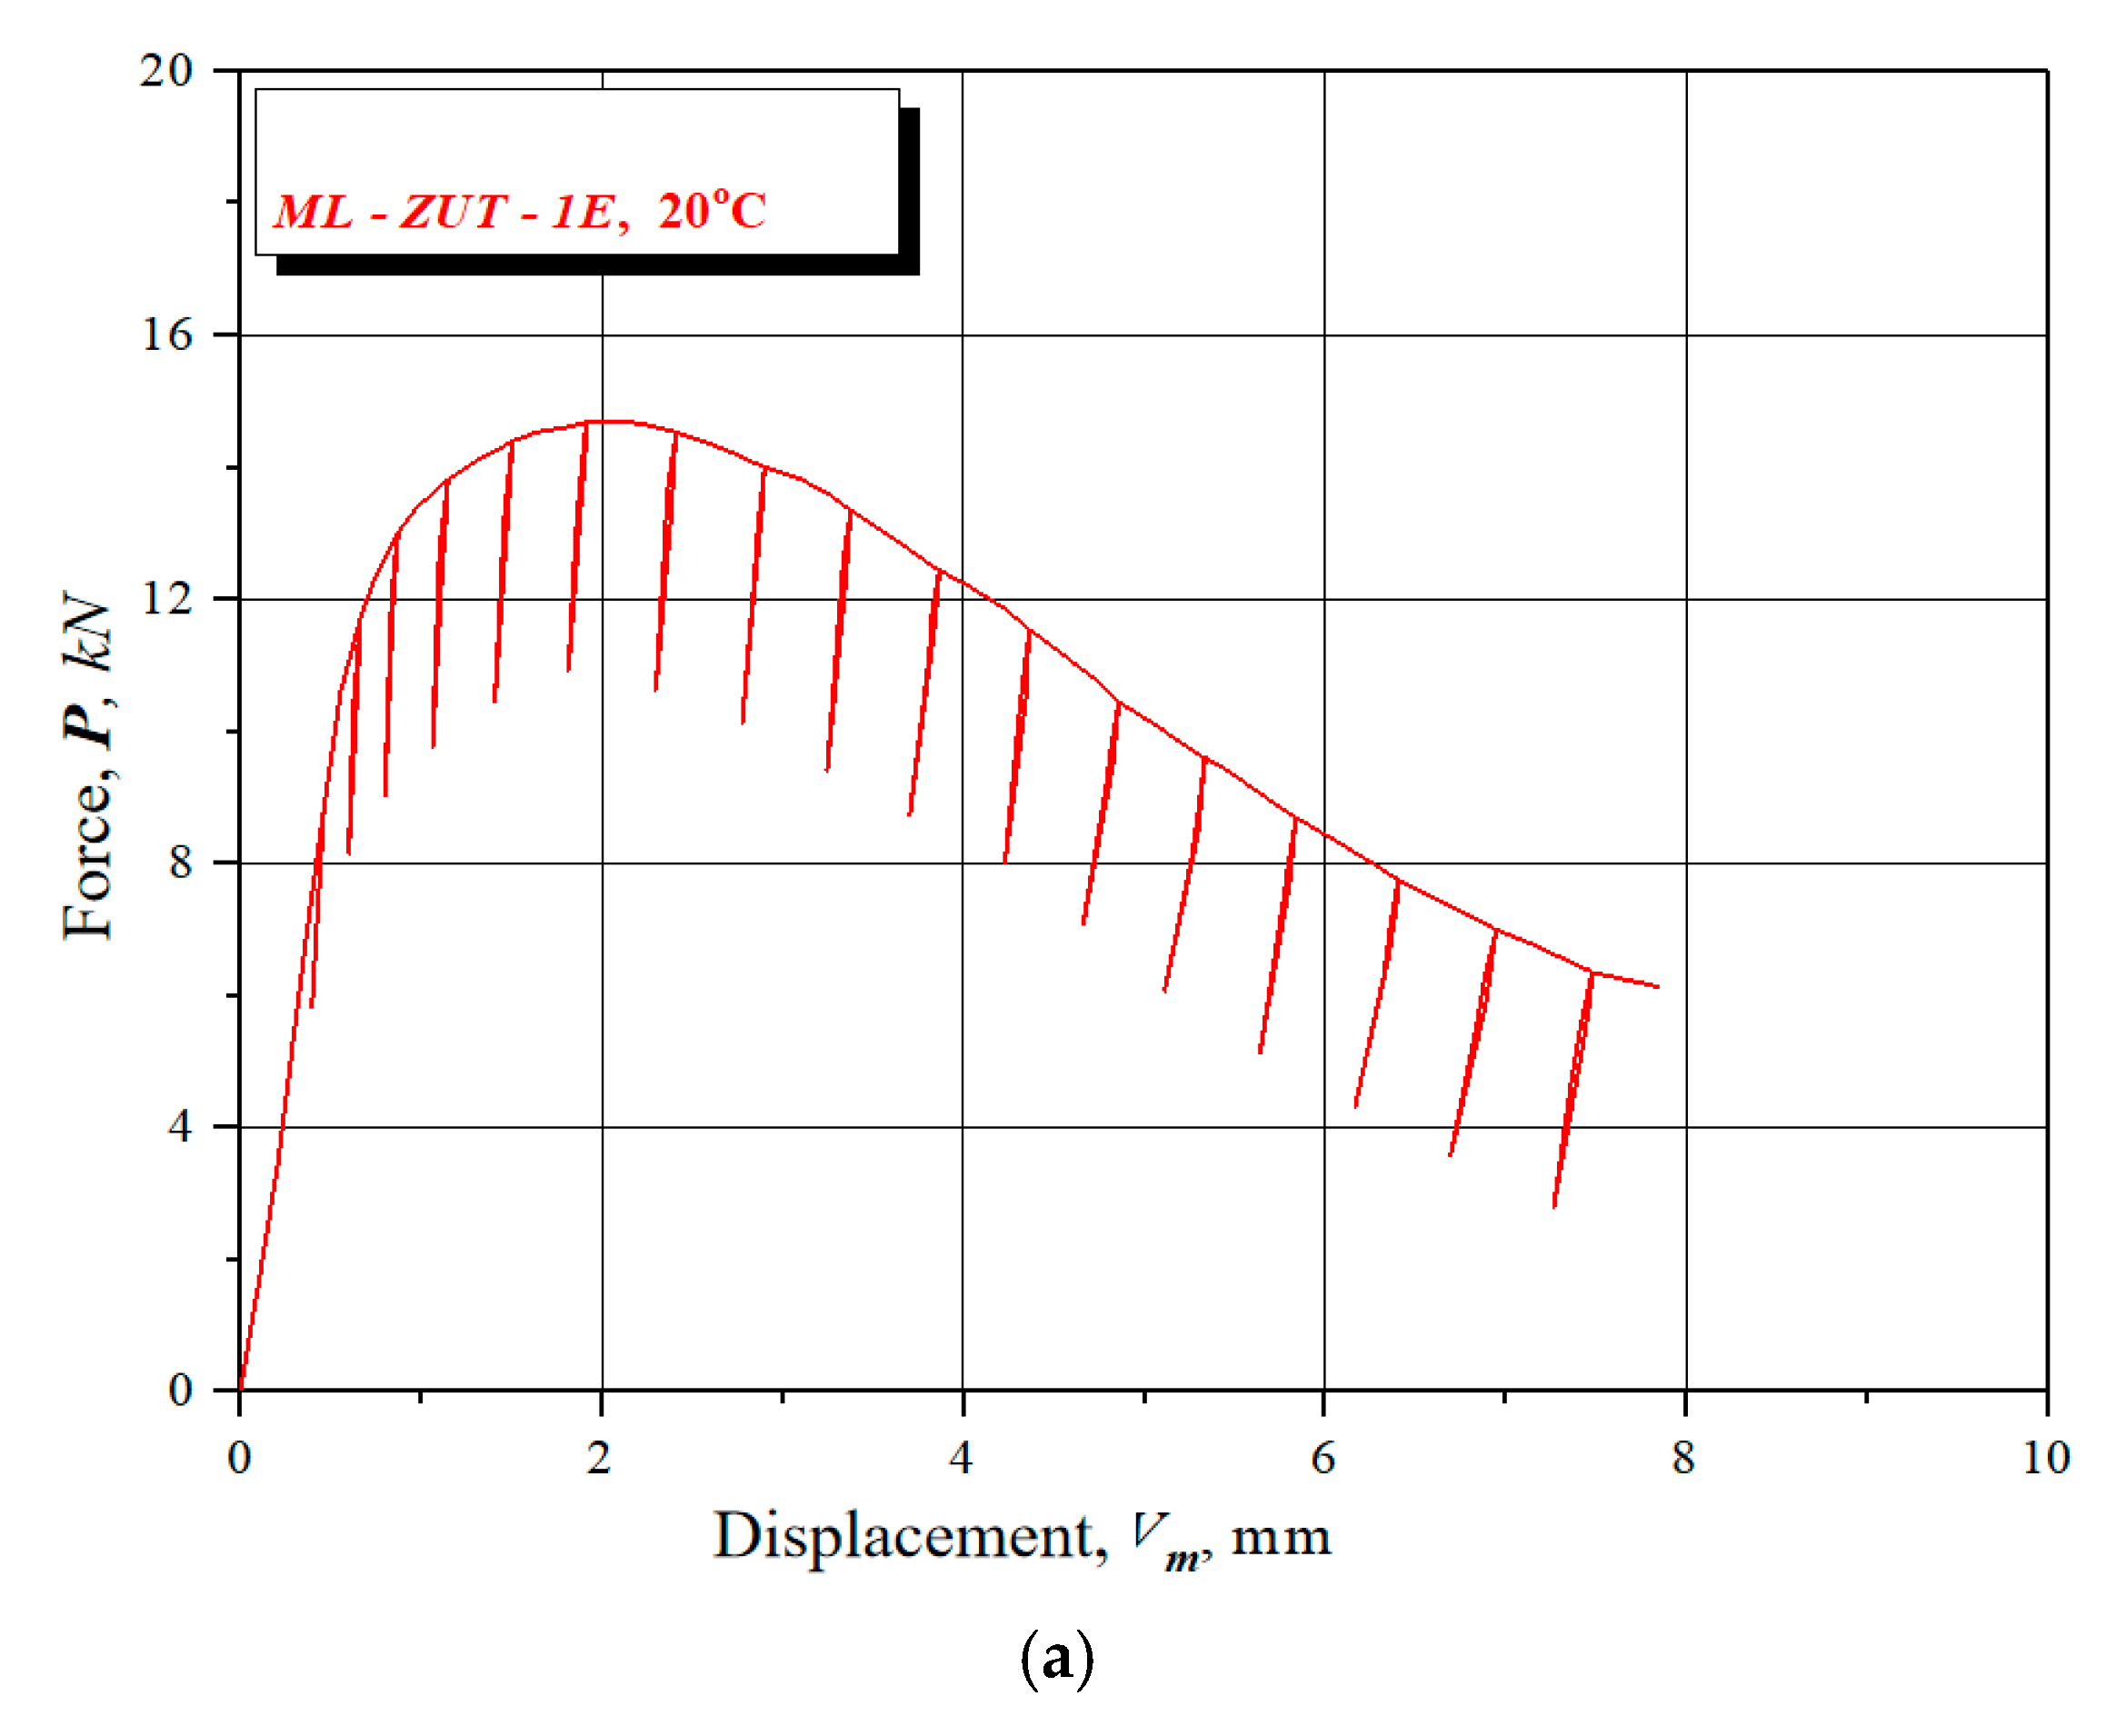
2.1. Fracture Toughness

To determine fracture toughness, KIc, standard three-point bending specimens—SE(B)—were used and their geometry was defined in accordance with ASTM E1820-20 “Standard Test Method for Measurement of Fracture Toughness” [19], as shown in Figure 5. Three groups of specimens were made, I-III, depending on the fatigue crack tip position in the welded joint, BM, WM and HAZ, respectively; see Figure 6a. Instrumentation for crack tip opening displacement (CTOD) measurement is shown in Figure 6b. Three specimens were made, since this is the minimum required for testing to ensure result accuracy and repeatability.
In the case of relatively ductile material, such as A516 Gr. 60 steel, the standard procedure includes data collection from the servohydraulic system (load cell, displacement and COD extensometer), to construct the J–Δa curve and to evaluate JIc, where J and Δa represent the J integral and increments of crack length, respectively. Values of the critical stress intensity factor (fracture toughness) in the plane strain can be calculated using Equation (1), [20,21,22,23]:
J I c = 1 ν 2 K I c 2 E
To calculate KIc, the elastic modulus E was determined by tensile tests performed on welded joint specimens at room temperature using E = 211.7 GPa; see Table 2. Now, it is possible to calculate the critical crack length value by applying the basic formula of fracture mechanics:
K I c = σ c π a c
where σc can be replaced with the yield stress, Rp0,2, to obtain its minimum value. One should notice that this as just an approximation valid for the wide plate with a central crack, since no geometry factor Y(a/W) is taken into account. Anyhow, it will be useful for comparison purposes, based on different KIc values in different welded joint zones. One should notice that linear elastic fracture mechanics is used here as a conservative approach, with inevitable plasticity as a prevention of failure.

2.2. Determining of Fatigue Crack Growth Parameters

Analysis of the stress/strain state at the fatigue crack tip based on linear–elastic fracture mechanics (LEFM) principles led to the formulation of the well-known Paris equation, which relates the fatigue crack growth rate with the stress intensity factor range at the crack tip [24]:
d a d N = C Δ K m
To evaluate material parameters C and m, ASTM E647-15e1, “Standard Test Method for Measurement of Fatigue Crack Growth Rates” [25], can be used, including the procedure for measuring of fatigue crack growth rate da/dN, along with the calculation of the stress intensity factor range, K. One common option to achieve this aim is to use standard Charpy specimens via a three-point bending method on a RUMUL FRACTOMAT device, shown in Figure 7. Similarly to the previous test, a total of three specimens were used for fatigue tests.
Prior to testing, specimens were machined and measuring tapes—foils—which were used to monitor the growth of the crack, were glued to them. RMF A-5 measuring foils with a measuring length of 5 mm were used. In order to monitor the fatigue crack growth in this manner, the FRACTOMAT crack growth registration device was used [26]. The crack growth measuring system, the FRACTOMAT, and the measuring foil work by registering the change in the electrical resistance of the foils. As the fatigue crack grows below the measuring foil, it deforms following the fatigue crack tip and provides a change in foil resistance that varies linearly with the change in crack length. The scheme of operation of the system for measuring crack growth, FRACTOMAT-measuring film, is shown in Figure 8.

2.3. Risk-Based Analysis—FAD

Steels used for welded joints are commonly not susceptible to brittle fracture, but static failure still can appear in combination with plastic collapse. Thus, a more general approach is needed, as provided by the failure analysis diagram (FAD), based on the simple yield strip model and corresponding limit curve [27,28]:
K e f f K I = σ c σ 8 π 2 ln sec π 2 σ σ c 1 / 2
where KI = σ√πa. As a final step, non-dimensional variables Sr = σ/σc and Kr = KI/KIc are defined, where Keff is replaced by fracture toughness KIc to construct the limit curve in dimensionless coordinates (Kr, Sr):
K r = S r 8 π 2 ln sec π 2 S r 1 / 2
Now, for a component under analysis, one should know the stress and stress intensity factor KI, corresponding to the loading and geometry, including a crack, to evaluate the coordinates in the FAD, if material properties are known as well (critical stress c and fracture toughness KIc). If a point is below the limit curve, a component is safe. Moreover, using the position of this point in relation to the limit curve, one can estimate the likelihood as the representative of the probability of failure and combine it with the consequence of failure to estimate the risk. The reasoning behind this approach is presented and discussed in detail in [14]. Finally, a risk matrix can be used to present the result and to provide all data needed for the decision making process, also presented in detail in [16,17,18].
A more detailed description of this approach is given in [29], as a part of the SINTAP, which is more efficient to use in the case of complex geometry.

3. Results

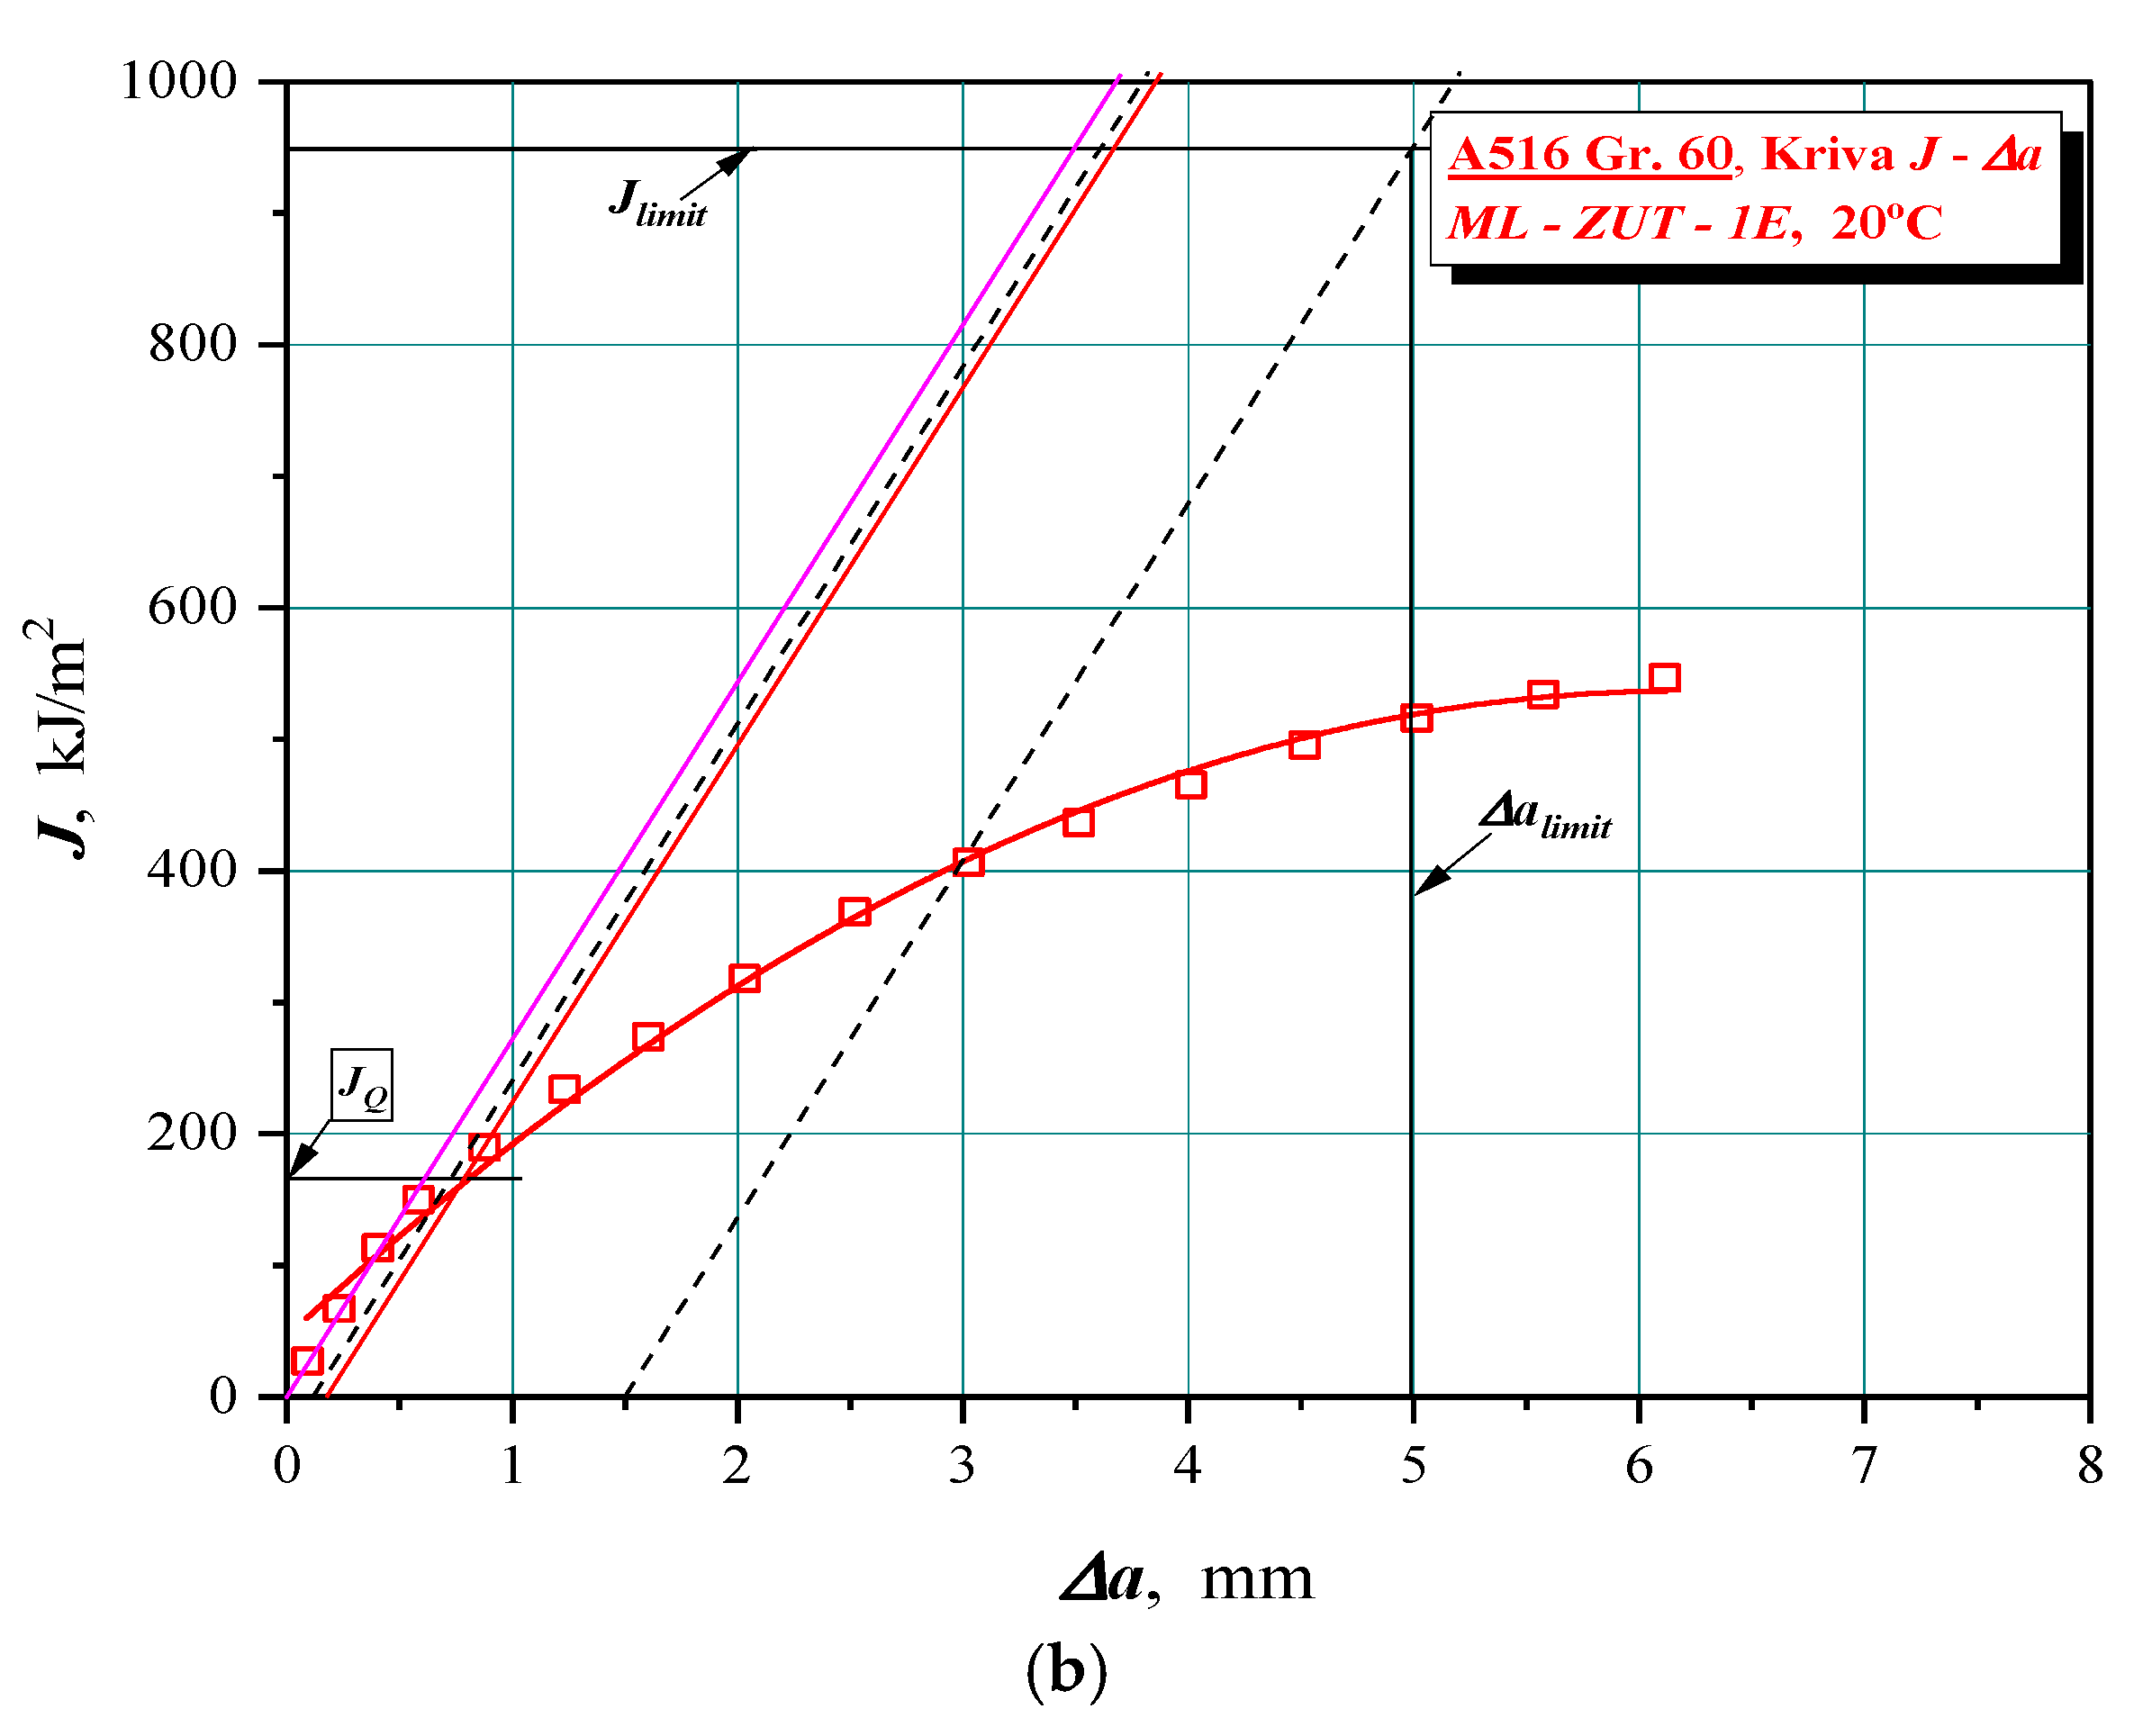
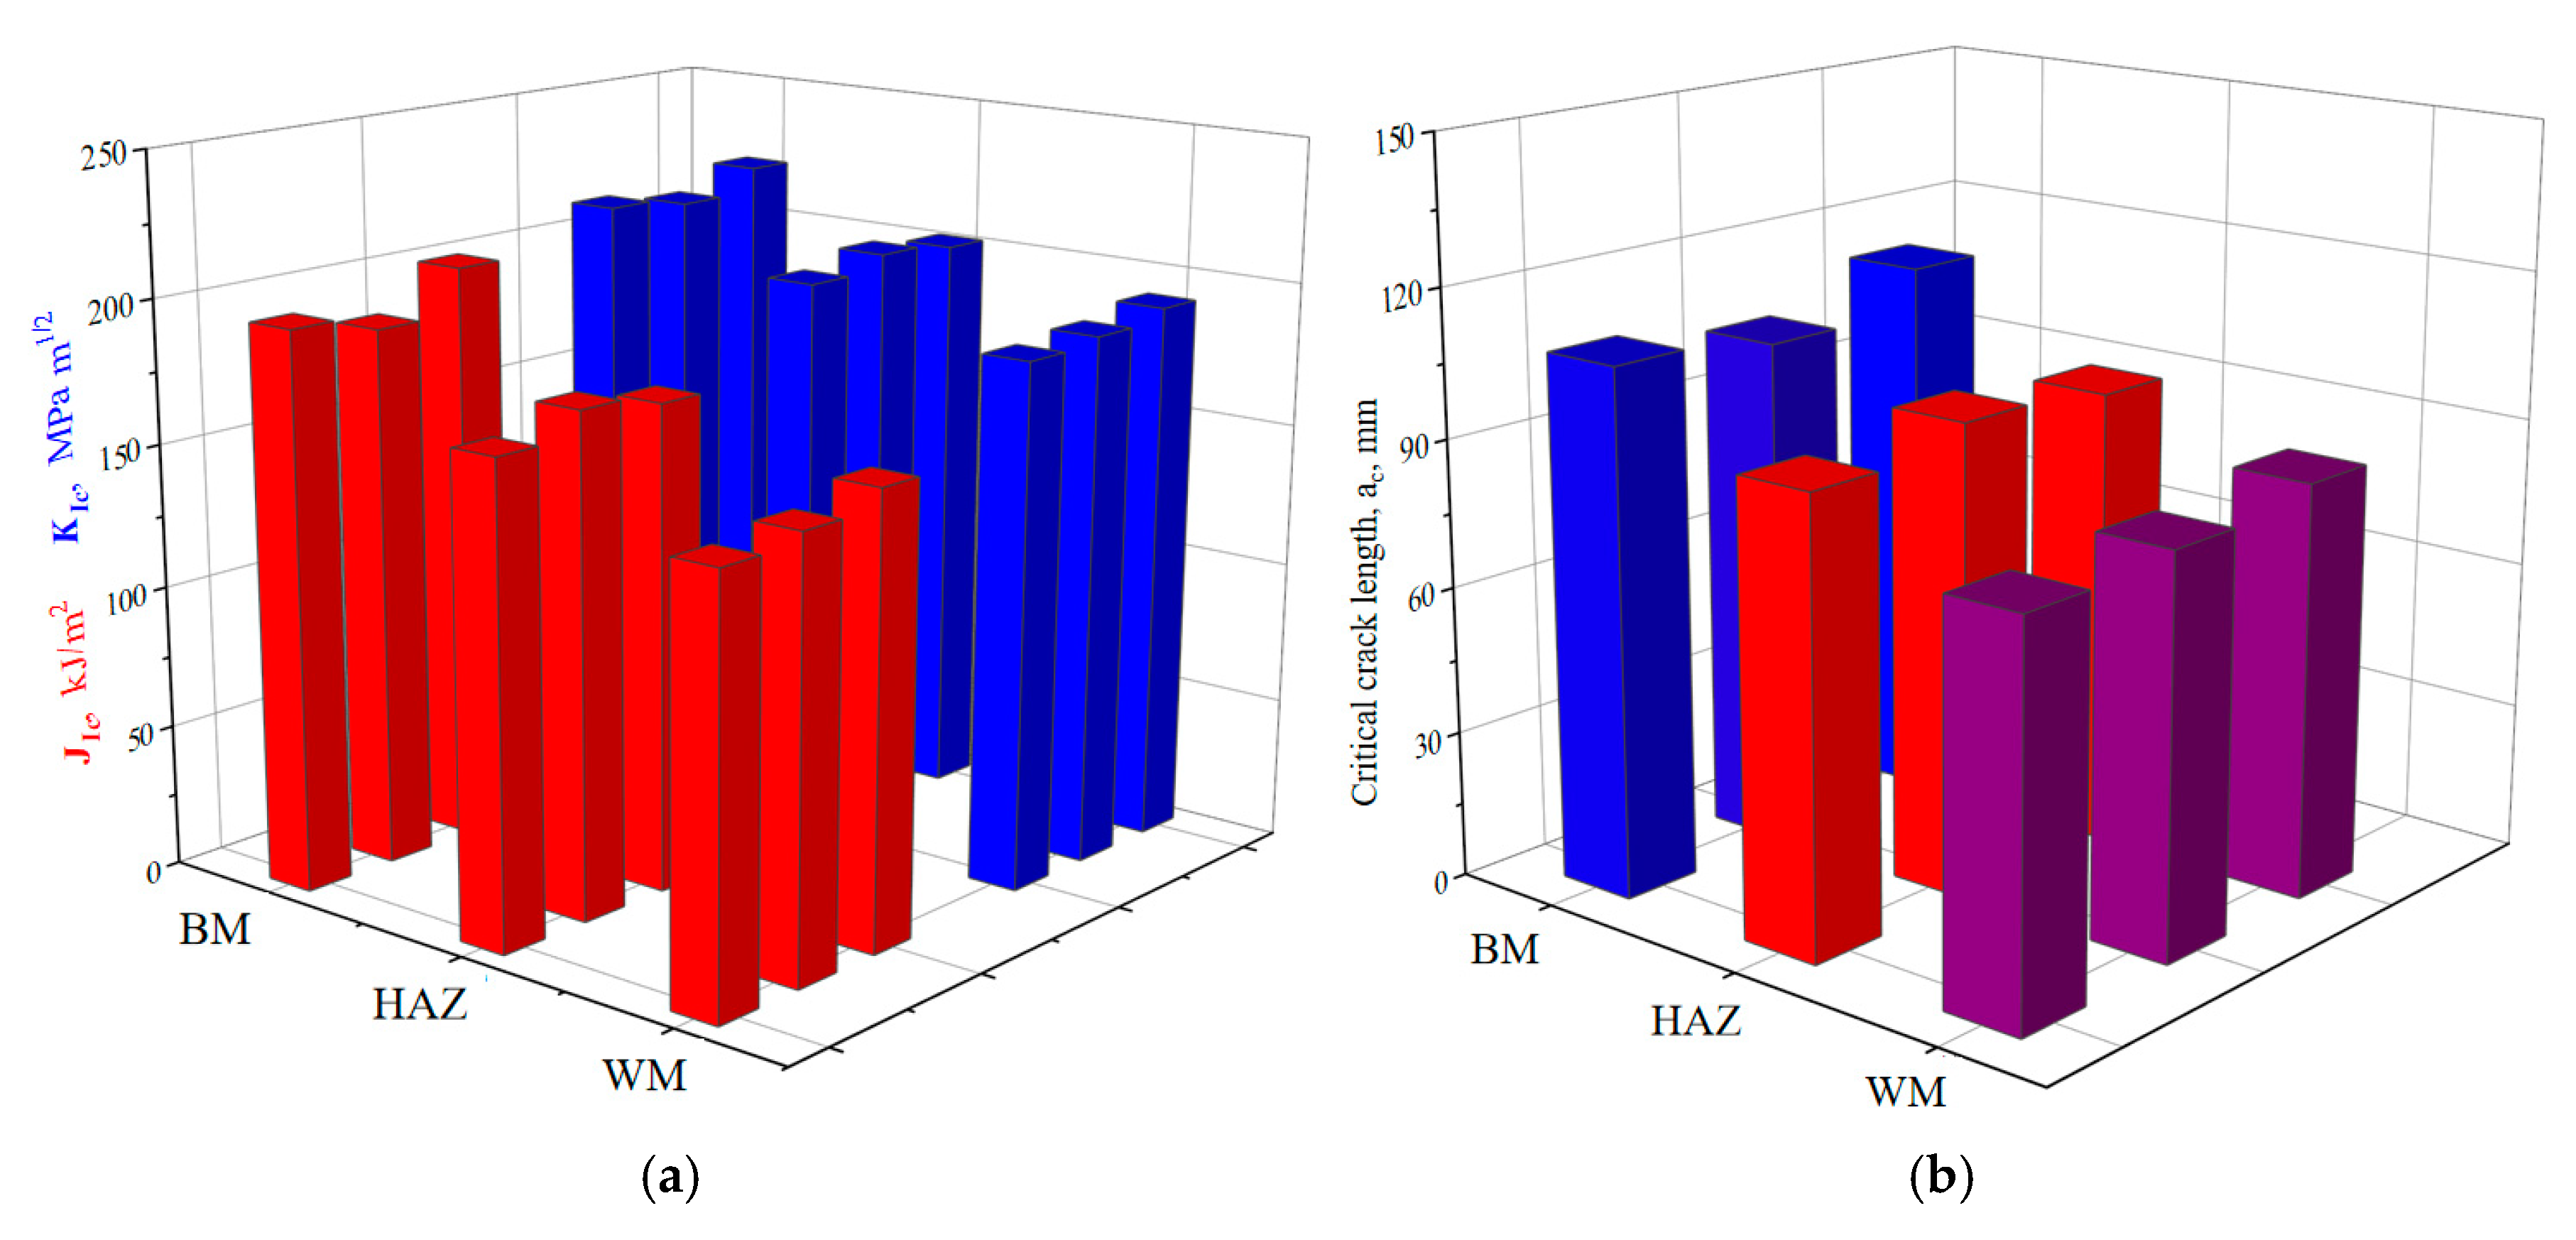
3.1. J–R Curves and Calculation of JIc and KIc

Force–displacement and J–Δa diagrams for specimens denoted as BM 1–3 (crack tip in the BM), HAZ 1–3 (crack tip in the HAZ) and WM 1–3 (crack tip in the WM) are shown in Figure 9, Figure 10 and Figure 11, respectively. In these figures, the boxes in the corner contain the designation of used specimens and the test temperature. The calculated values of KIc for specimens are shown in Table 5, as well as the critical crack length, obtained by using Equation (2).
In the J–Δa diagrams in these figures, the blue curve represents the so-called regresion line, and the dotted blue line is defined by crack length of Δa = 0.2 mm, and the point on the regression line which corresponds to JQ, and slope of this line is proportional to twice the value of yield stress. Other dotted lines are simply obtained by offsetting this line to the coordinate system origin (red) and the intersection between Jlimit and Δalimit lines.
One can see from Figure 9, Figure 10 and Figure 11 and Table 5 the typical elastic–plastic behaviour of a common structural steel welded joint, such as A516 Gr. 60, with relatively high values of fracture toughness and, consequently, high values of critical crack length. Indeed, the minimum value of fracture toughness is 185 MPa√m (specimen WM 1) and the corresponding critical crack length is 79.6 mm, which is easily detectable with standard NDT examination. Another important aspect is the relatively small difference between the maximum and minimum fracture toughness values (220.1–185.0 MPa√m), indicating the high crack resistance of the whole welded joint under static loading.
Figure 12a shows the effects of the crack tip position, in terms of welded joint regions, on the critical values of fracture mechanics parameters JIc and KIc. Figure 12b shows the same effect on the values of critical crack length.

3.2. Risk Assessment of Pressure Vessels in RHPP Bajina Basta

Pressure vessels in the Reversible Hydropower Plant (RHPP) Bajina Basta in Serbia are used as storage for compressed air under a pressure of 78 bar. They were made of HSLA steel of the old generation (Nioval 50), back in the 1980s, with a history of cracking problems in welded joints ever since 1998 [7].
Inspection and testing of pressure vessels was performed by different ultrasonic NDTs, conventional and advanced ones [30], according to EN ISO 11666 2018 [31]. Out of nine tested PVs, vessel 977 is briefly presented here (pressure p = 78 bar, thickness t = 42 mm, mean diameter D = 1958 mm). Ultrasonic testing was conducted on two vertical welded joints, and three circular welded joints. A crack-like defect, marked 2.5, was found in the central circular welded joint, with a length of 170 mm and ranging from 28 to 42 mm in depth, [18,30], far above the acceptance level [31].
To assess the structural integrity of PV 977, the FAD was used. The fracture toughness KIc for the weld metal was taken as 50 MPa√m [32]. In the case of defect 2.5 in vessel 977, the stress intensity factor for the edge surface defect (2c = 170 mm, a = 14 mm) was calculated using Equation (6):
KI = Y(a/W)(pR/2t)√πa
where Y(a/W) is the geometry factor equal to [26]
Y(a/W) = 1.12 − 0.26(a/W) + 10.52(a/W)2 − 21.66(a/W)3 + 30.31(a/W)4
for a/W = 0.33, resulting in Y(a/W) = 1.78, KI = 32.5 MPa√m and KI/KIc = 0.65.
The ratio of critical cross-section stress to critical stress (the half-sum of yield stress, 500 MPa, and tensile strength, 650 MPa, [18]) is as follows: SR = σnF = 132/575 = 0.23.
The coordinates of the point in the FAD (0.23; 0.65) are in the safe area, in Figure 13, at the level of fracture probability of approximately 0.66. The safe area is defined by the limit curve given by the following formula:
K r ( S r ) = 1 0.1 S r 2 + 0.1 S r 4 1 + 3 S r 4
In the case of A516 Gr. 60 steel, the fracture toughness KIc for the weld metal is taken as 185 MPa√m, [12], so that the ratio defining Y coordinate is KI/KIc = 0.175, whereas the ratio defining the X coordinate is SR = Sn/Sc = 132/460 = 0.29, where Sc = (360 + 560)/2 = 460 MPa.
The coordinates of the point in the FAD (0.29; 0.175) correspond to A516 Gr. 60 steel. It is also in the safe area in Figure 13 at the level of fracture probability of approximately 0.30.
Now, one can construct the risk matrix, as shown in Table 6. The consequence category of PVs in RHPP Bajina Basta is the highest one, since they can bring the whole plant down. As one can see, different steels pose different risks in the case of defect 2.5 in the analysed PV; in other words, their welded joints present a significant difference: A516 Gr. 60 is located in the medium-risk area, whereas Nioval 50 is in the very-high-risk area. Probability is determined based on the location of the point in the FAD, by dividing its distance from the origin by the distance from the origin of the point on the limit curve, which is obtained by drawing a line through the origin and the point, and finding its intersection with the curve.

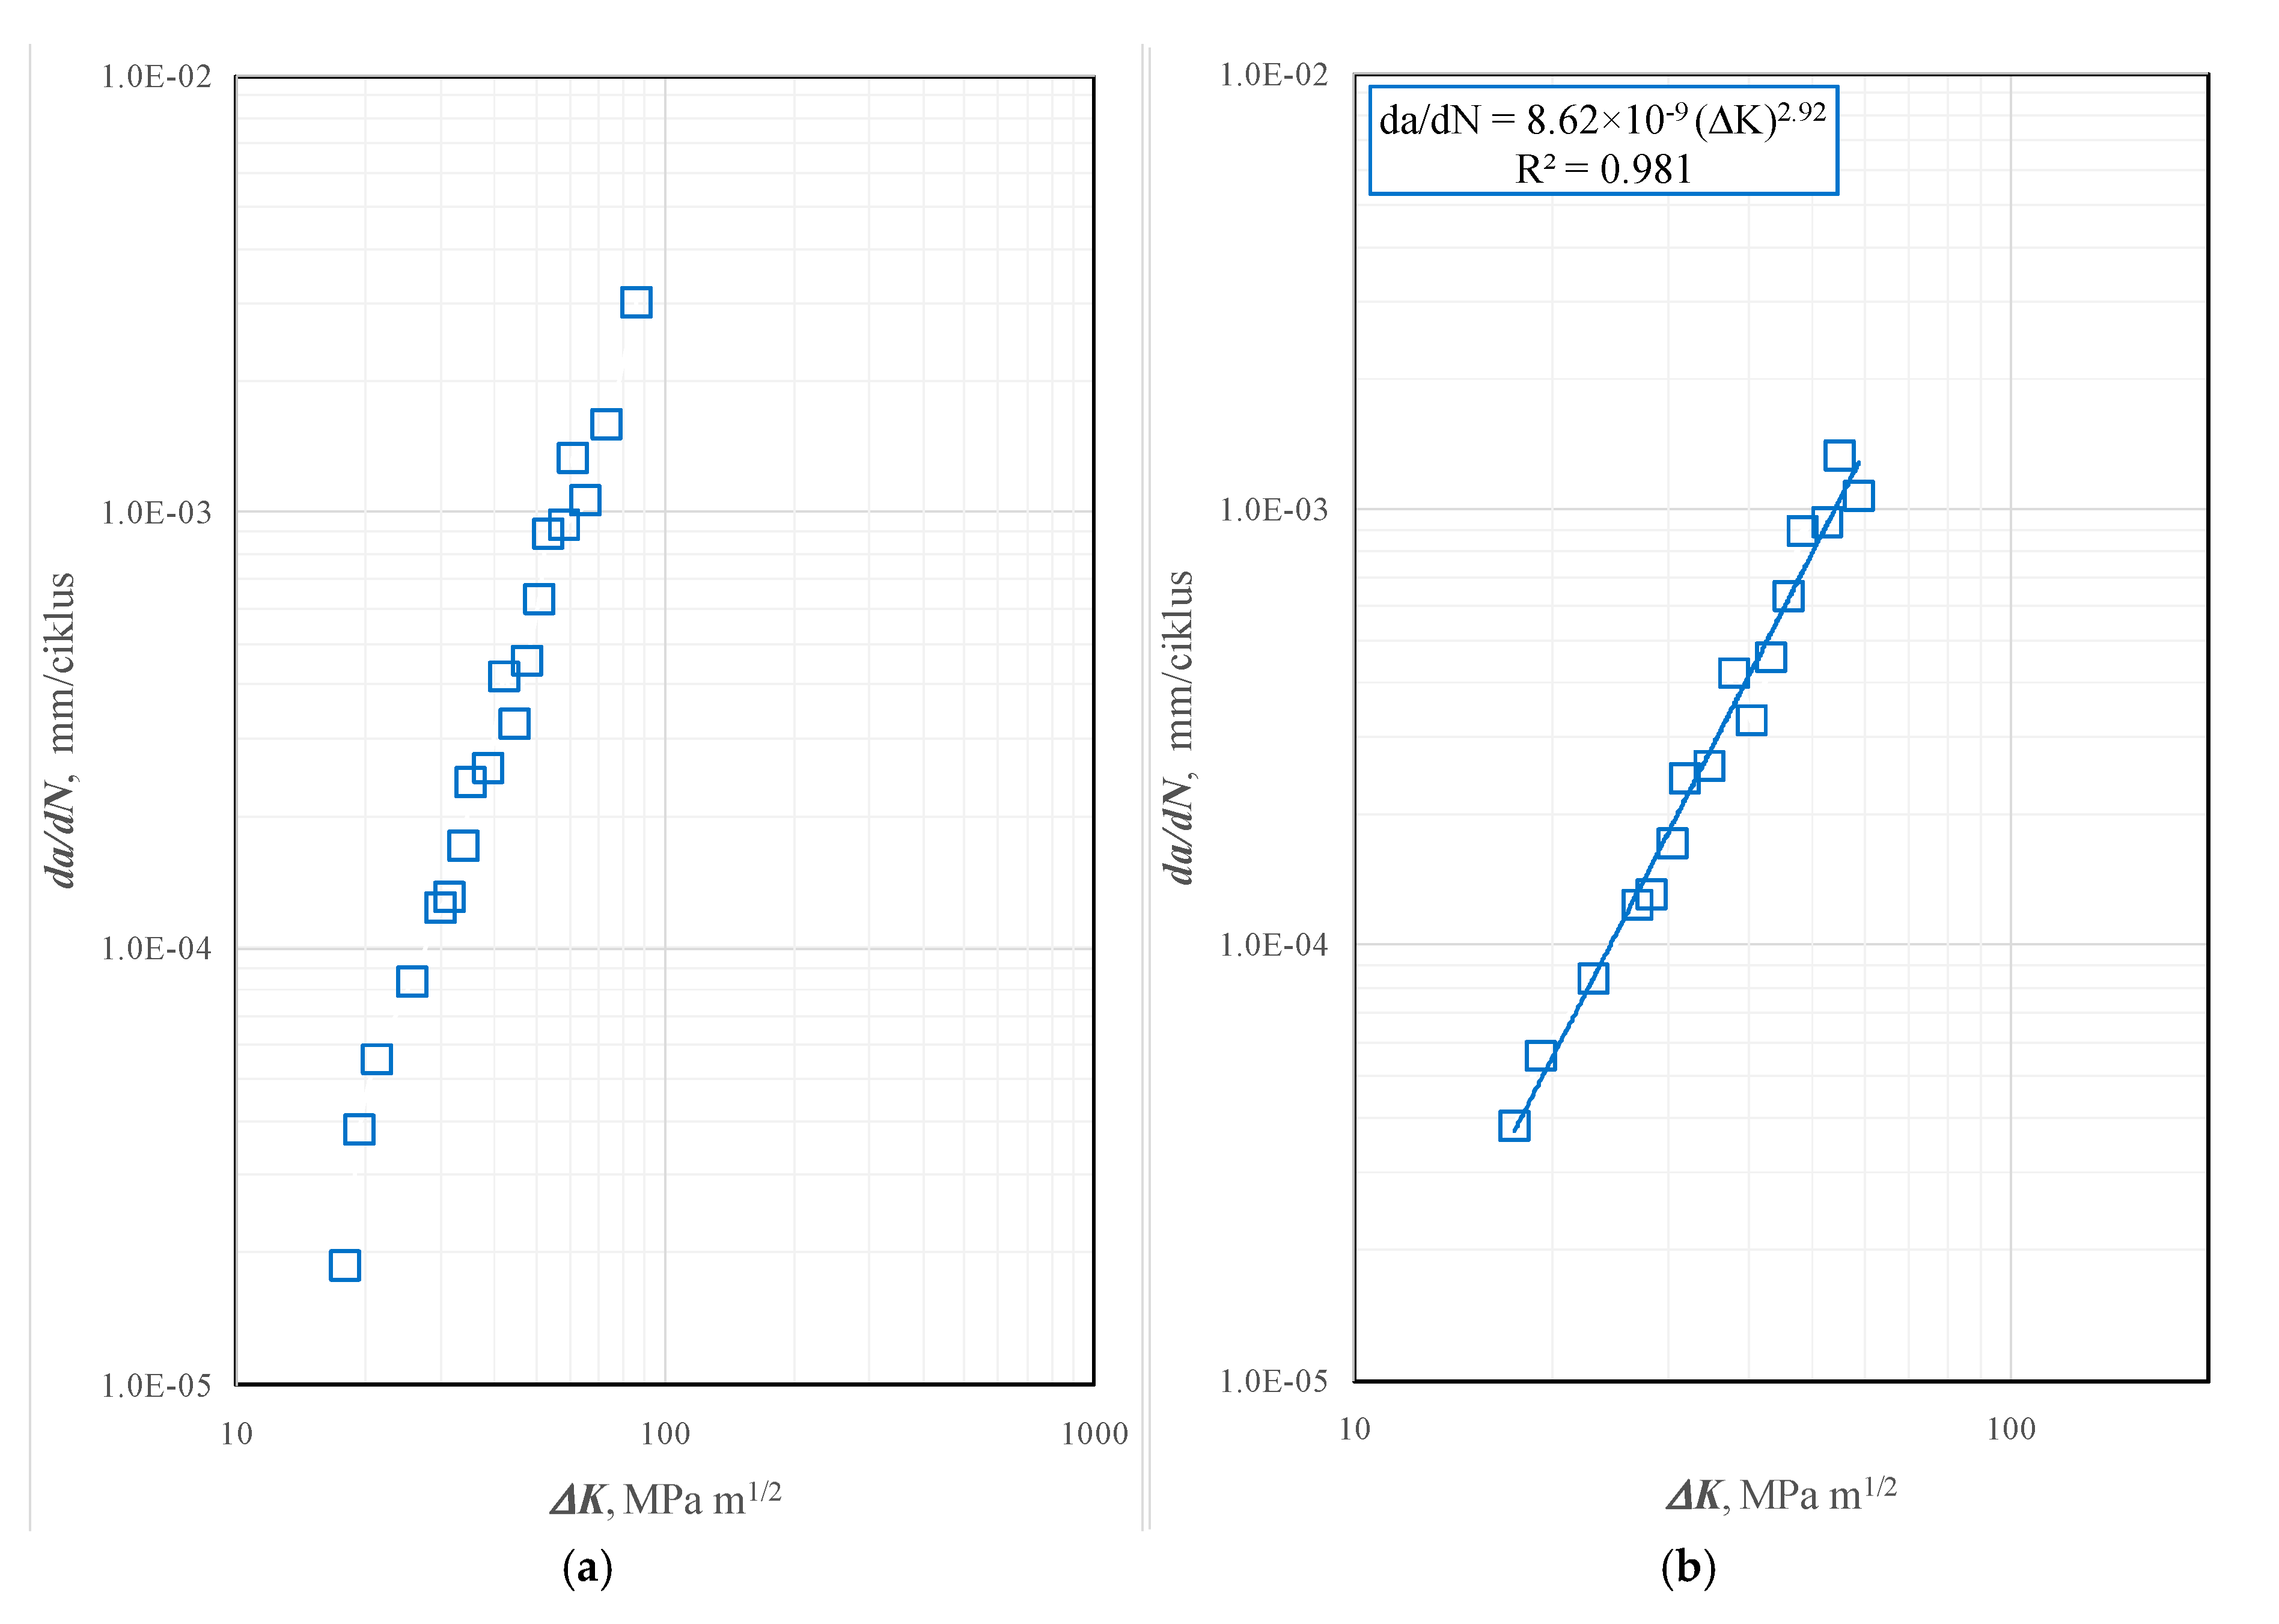
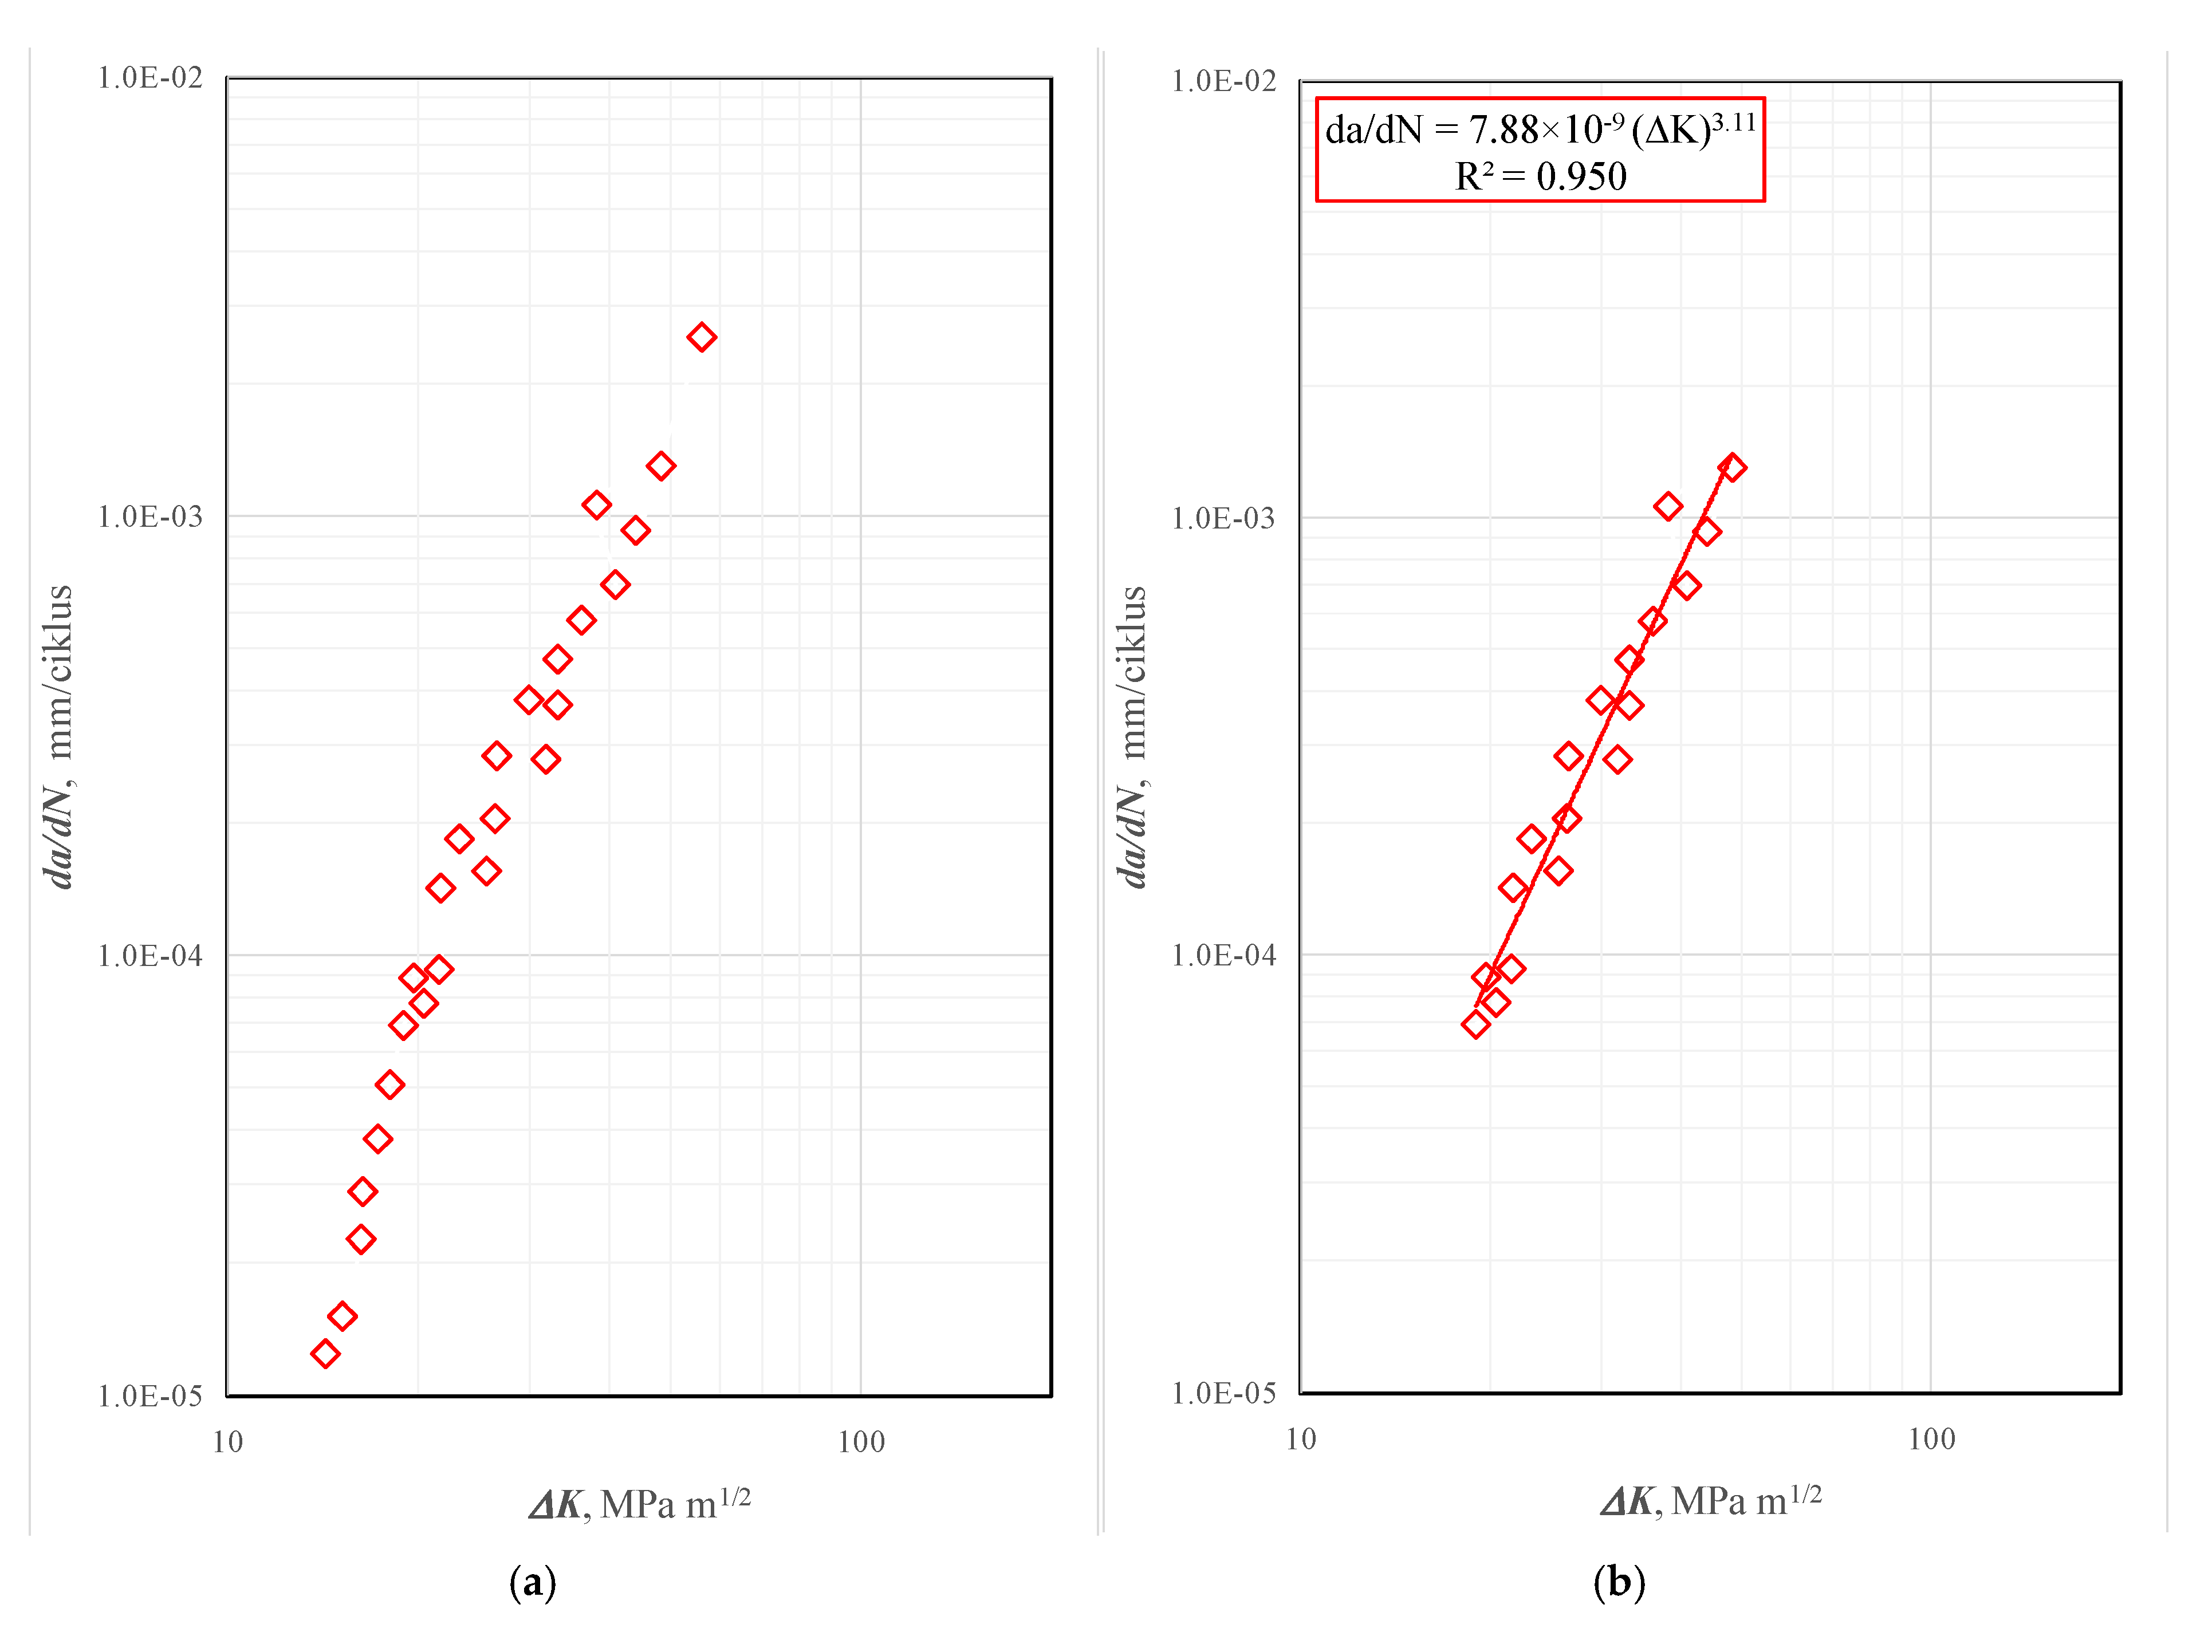
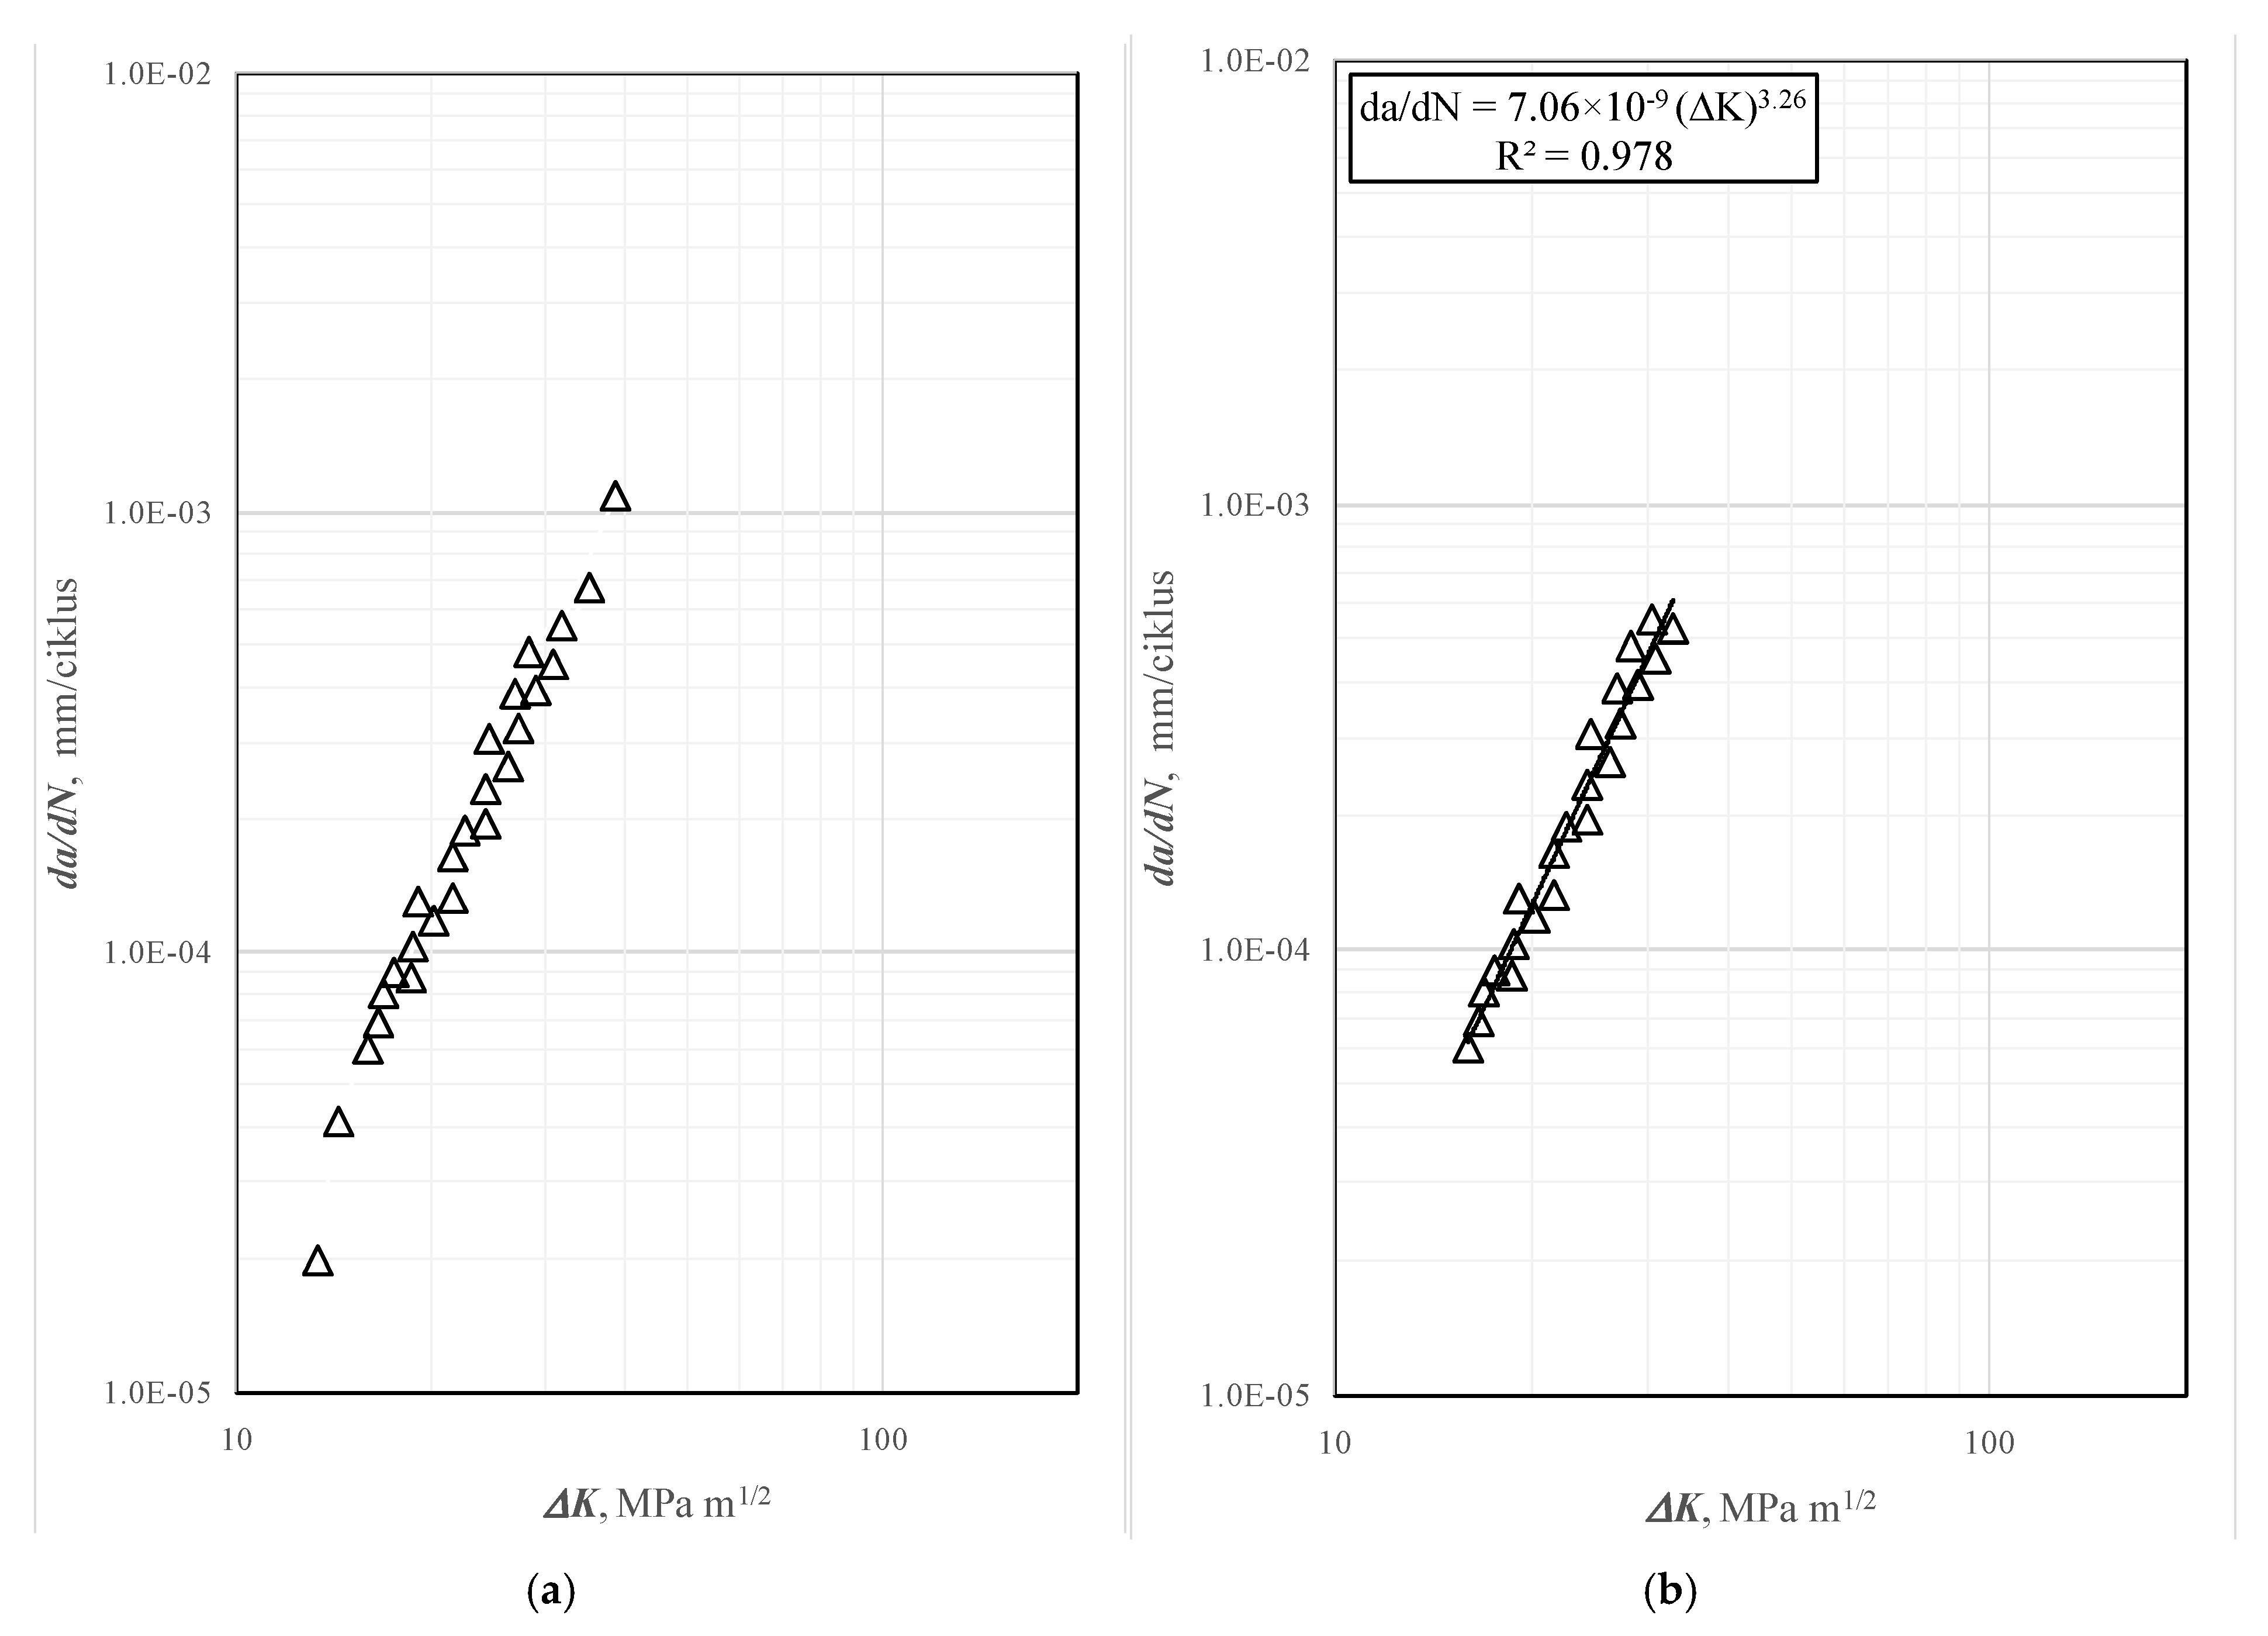
3.3. Fatigue Crack Growth (FCG)

The results of FCG testing are shown in Table 7 for specimens with crack tips in the BM, WM and HAZ, for ΔK = 30 MPa√m.
Typical da/dN-ΔK diagrams are shown in Figure 14, Figure 15 and Figure 16 for specimens BM 1, HAZ 1 and WM 1, respectively. On the left side, the whole diagram is shown, while on the right side, only a part of the diagram, used to evaluate C and m, is shown.

4. Discussion

Specimens with a crack in the parent material (PM) showed the best resistance to static crack growth. The obtained values of fracture toughness, KIc, were in the range from 211.7 to 220.1 MPa√m. Slightly lower values of KIc (up to 6%) were obtained for HAZ, from 199.1 to 203.9 MPa√m. The lowest values of KIc were in the WM 185.2 to 190.9 MPa√m range, i.e., up to 12%. Therefore, one can see that these differences are relatively small, certainly smaller than in the case of HSLA steels [32]. As a consequence, the critical crack length, ac, was the largest for PM (104 mm), medium for the HAZ (92 mm) and the lowest for the WM (80 mm); see Table 5. Once again, the differences are relatively small and the values certainly appear large. One should bear in mind that these values are given here for comparison purposes only, and are not realistic, since the geometry parameter Y(a/W) was not taken into account. More realistic values for a long crack would be around half of the thickness in depth, ac = 21 mm.
More realistic analysis is given in the following text using risk-based analysis of a pressure vessel presented in this paper. As one can see, the replacement of common carbon steel (A516 Gr. 60) with HSLA steel Nioval 50 (of the old generation, with low fracture toughness) raises the risk level from low to high; see Table 6. Therefore, the question arises as to why one should use a design based on safety factors (174/500 = 35% of YS for Nioval 50 vs. 174/360 = 49% of YS for A516 Gr. 60) when at the same time there is a raised risk of failure from low to high in the presence of cracks. In other words, what is the reason and logic for using larger safety factors when they actually increase the risk of failure in the case of a material replacement’s with a stronger one?
For the analysis of fatigue crack growth behaviour, the stress intensity factor range value of ΔK = 30 MPa√m was adopted. This value corresponds to the parts of the da/dN—ΔK diagrams which are located in the stable crack growth region, i.e., where the Paris law applies. The fatigue crack growth rate ranges from 1.12 × 10⁻⁴ mm/cycle to 1.77 × 10⁻⁴ mm/cycle for specimens with a notch in the PM. In the case of specimens with a fatigue crack tip in the HAZ, the fatigue crack growth rate is from 2.52∙× 10−4 mm/cycle to 3.09∙× 10−4 mm/cycle, meaning that fatigue crack in the HAZ grows almost twice as fast in comparison to that in the BM. The highest speed of fatigue crack growth, i.e., the worst resistance to crack propagation under the effect of variable load, was observed in specimens with a fatigue crack tip in the WM, and it ranged from 3.62∙× 10−4 mm/cycle to 4.58 × 10⁻⁴ mm/cycle, as shown in Figure 17, together with values for the HAZ and PM. Obviously, differences between different welded joint zones are much more significant in the case of amplitude loading and fatigue crack growth behaviour. Taking coefficient m = 3 (just for a comparison), one can estimate that the number of cycles in the BM would be about 8 times larger compared to HAZ and 27 times larger than in the WM. Therefore, if fatigue loading becomes important, one should carefully analyse differences in welded joint zones and calculate fatigue life as precisely as possible, either analytically [33] or by using numerical methods such as XFEM, as described in a couple of recently published papers [34,35,36].
Different microstructures in the WM, HAZ and BM, as shown and described in [14], are more sensitive to fatigue crack growth than to static loading and ductile crack growth. These differences strongly depend on the welding process and parameters, which have to be defined carefully in order to not make microstructural differences too big. In the case analysed here, microstructures are basically ferrite–perlite, with differences not being too pronounced.
With respect to the FAD and risk-based analysis, it should be noted that a simple engineering approach was used here to obtain a conservative estimate of the structural integrity of a chosen PV example. More complex analysis can be conducted in the scope of a R6 procedure [37] and SINTAP [29]. In any case, the comparison between two steels (A516 Gr. 60 and Nioval 50) revealed the important difference in the level of risk, this being much lower in the case of A 516 Gr. 60. In practical terms, this means that the safety factor when designing A516 Gr. 60 components can be lower, thereby reducing the disadvantage of having a lower yield stress.

5. Conclusions

Based on the presented results and discussion, one can conclude the following:
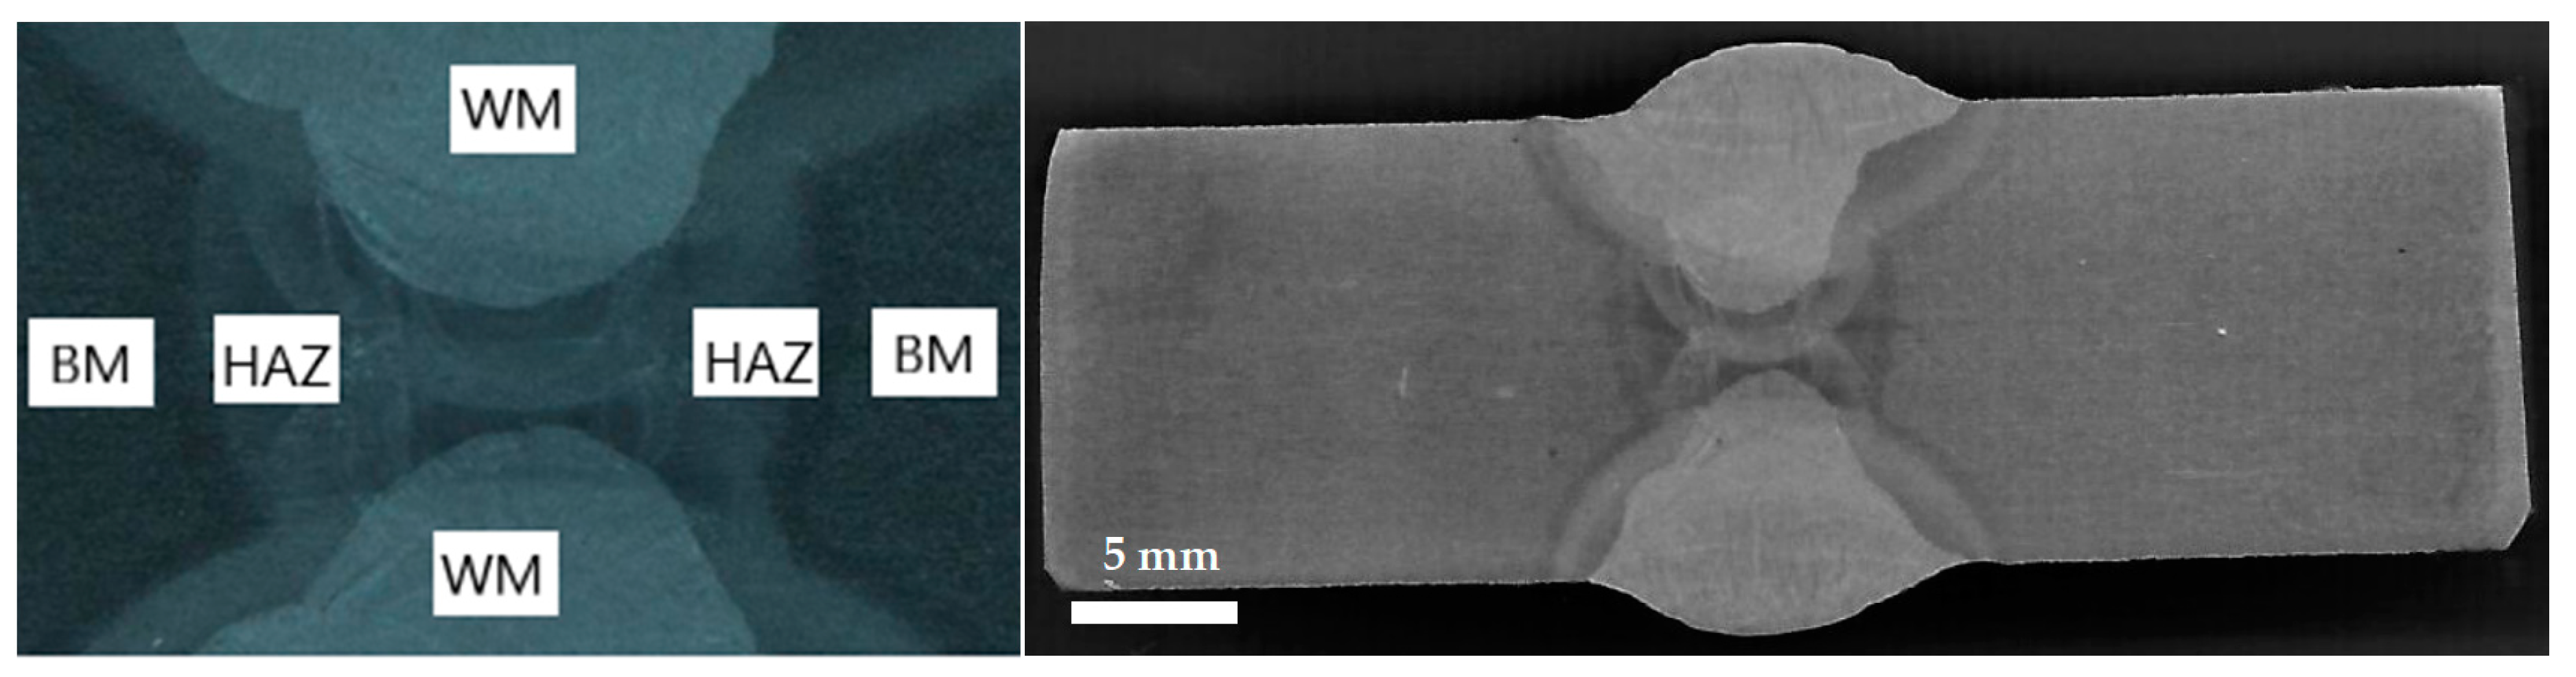
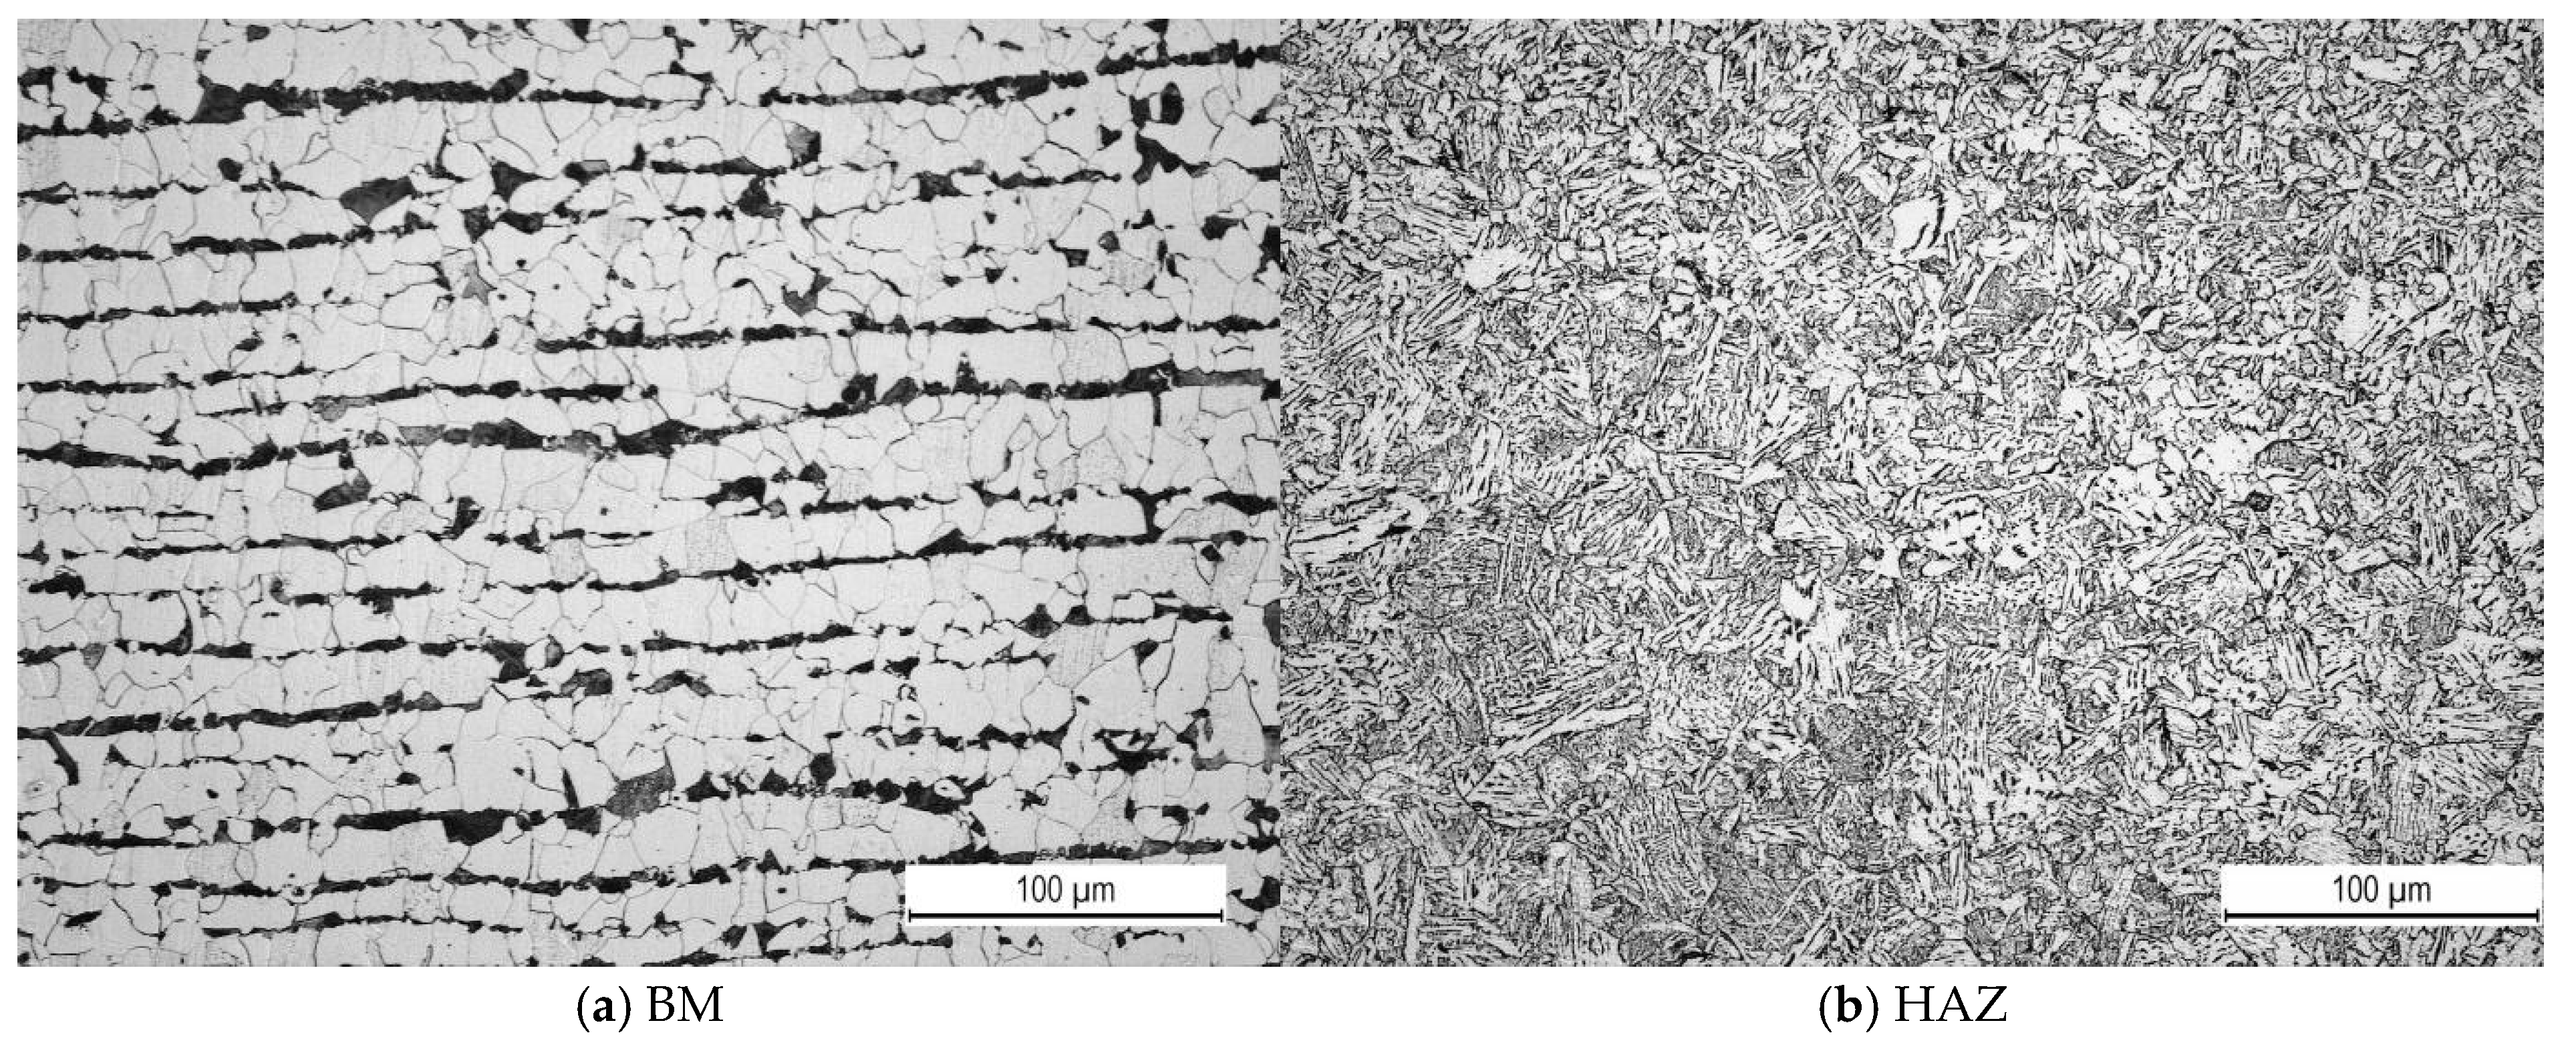
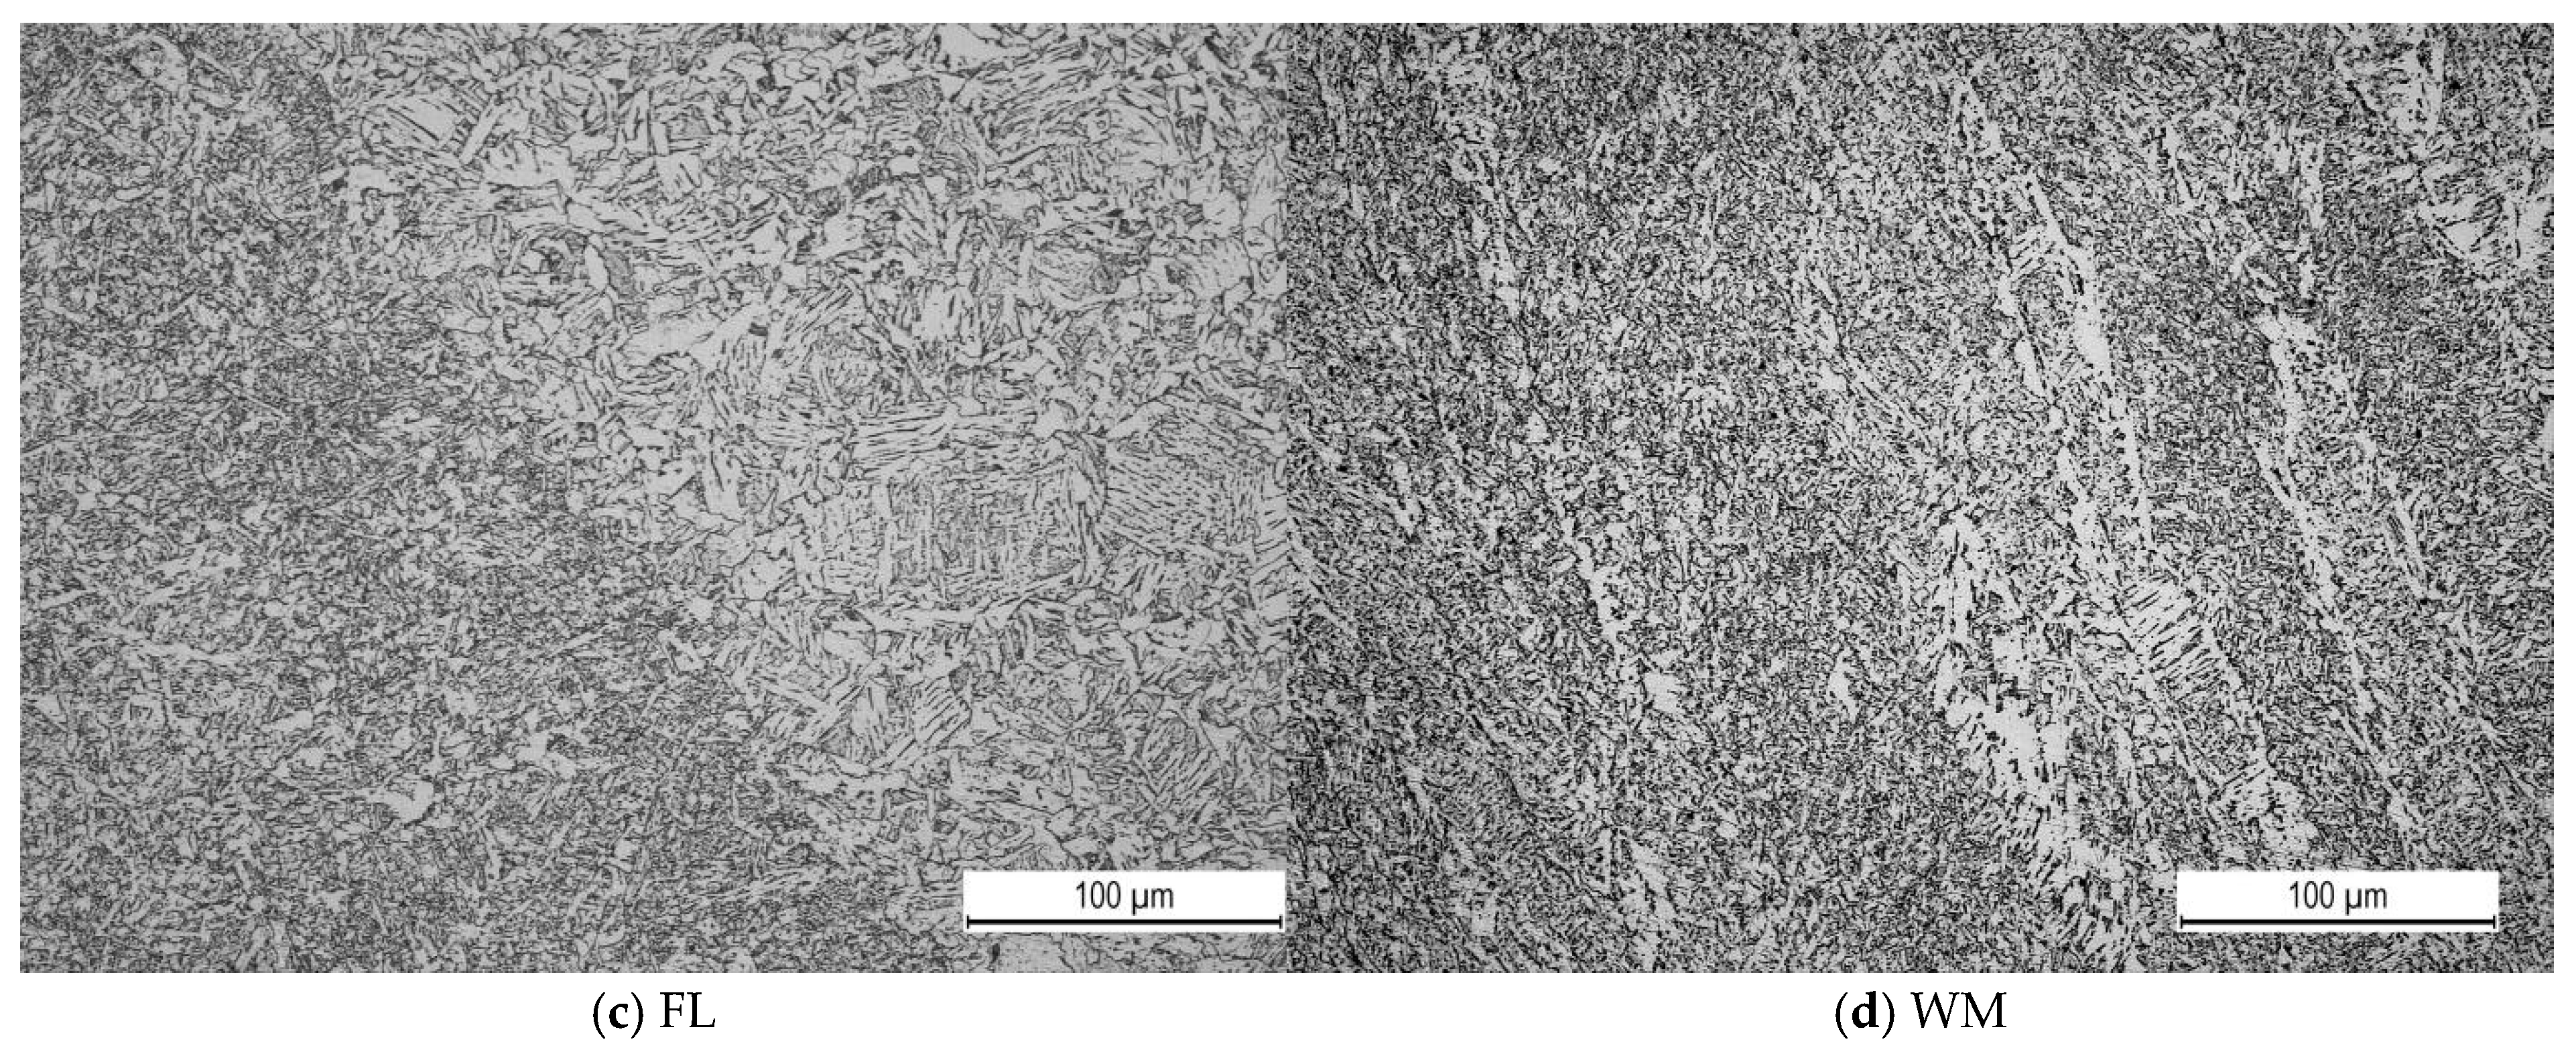
  • The heterogeneity of the welded joint microstructure of a common carbon structural steel, such as A516 Gr. 60, causes different crack growth behaviours in the BM, WM and HAZ, which are not significant for static loading, but may become important in the case of fatigue loading, since the analysis presented here showed that the crack growth rate in the least favourable region, the WM, can be 2.5 to 3.2 times greater than that in the BM.
  • The effectiveness of replacing a common carbon structural steel such as A516 Gr. 60 with HSLA steel Nioval 50 is questionable because of the low static crack resistance of the later one. This was confirmed via a risk matrix, which indicated that A516 Gr. 60 was in the low-risk zone, as opposed to Nioval 50, which was in the high-risk zone, with a much greater probability of failure. Nevertheless, modern HSLA steels not only have higher strength, but also significantly better crack resistance, including both static and fatigue resistance, due to their more favourable microstructure.
  • The risk-based procedure presented and applied here is a practical tool to assess structural integrity and is especially useful in the case of components which have been in service for a long time.
  • More advanced methods for structural integrity assessment are needed, such as SINTAP, in the case of a component with a more complex geometry, including numerical analysis of the stress state by the finite element method.

Author Contributions

Conceptualization, I.Č., A.S. and N.K.; methodology, S.S. and Z.B.; validation, I.Č., A.S. and Z.B.; formal analysis, M.J., I.Č. and N.K.; data curation, T.G.; writing—original draft preparation, A.S. and S.S.; writing—review and editing, S.S. and I.M.; visualisation, T.G.; supervision, M.J. and I.M. All authors have read and agreed to the published version of the manuscript.

Funding

This research was funded by Ministry of Education, Science and Technological Development, Republic of Serbia, grant no. 451-03-47/2024-01/200213.

Data Availability Statement

Data is unavailable due to privacy.

Acknowledgments

Authors of this paper would like to express their gratitude to the Ministry of Education, Science and Technological Development, Republic of Serbia, for supporting our work.

Conflicts of Interest

The authors declare no conflicts of interest.

References

  1. Vojvodic Tuma, J.; Sedmak, A. Analysis of the unstable fracture behaviour of a high strength low alloy steel weldment. Eng. Fract. Mech. 2004, 71, 1435–1451. [Google Scholar] [CrossRef]
  2. Sedmak, A.; Doncheva, E.; Medjo, B.; Rakin, M.; Milosevic, N.; Radu, D. Crack Size and Undermatching Effects on Fracture Behavior of a Welded Joint. Materials 2023, 16, 4858. [Google Scholar] [CrossRef] [PubMed]
  3. Aranđelović, M.; Sedmak, S.; Jovičić, R.; Perković, S.; Burzić, Z.; Radu, D.; Radaković, Z. Numerical and experimental investigations of fracture behaviour of welded joints with multiple defects. Materials 2021, 14, 4832. [Google Scholar] [CrossRef] [PubMed]
  4. Song, W.; Man, Z.; Xu, J.; Wang, X.; Liu, C.; Zhou, G.; Berto, F. Fatigue Crack Growth Behavior of Different Zones in an Overmatched Welded Joint Made with D32 Marine Structural Steel. Metals 2023, 13, 535. [Google Scholar] [CrossRef]
  5. Tomków, J.; Landowski, M.; Rogalski, G. Application possibilities of the S960 steel in underwater welded structures. Facta Univ. Ser. Mech. Eng. 2022, 20, 199–209. [Google Scholar] [CrossRef]
  6. Jahns, H.; Unglaub, J.; Müller, J.; Hensel, J.; Thiele, K. Material Behavior of High-Strength Low-Alloy Steel (HSLA) WAAM Walls in Construction. Metals 2023, 13, 589. [Google Scholar] [CrossRef]
  7. Hrivnak, I. Breakdown and repair of large spherical containers for liquefied hydrocarbon gases. Int. J. Press. Vessel. Pip. 1989, 40, 193–222. [Google Scholar] [CrossRef]
  8. Hall, A. The Effect of Welding Speed on the Properties of ASME SA516 Grade 70 Steel. Master’s Thesis, University of Saskatchewan, Saskatoon, SK, Canada, 2010. [Google Scholar]
  9. Sharma, S.; Samal, M.K. Study of effect of loading rate on fracture toughness of SA516Gr.70 steel for nuclear pressure vessel and piping in DBTT regime and evaluation of shift in reference transition temperature. Theor. Appl. Fract. Mech. 2020, 110, 102814. [Google Scholar] [CrossRef]
  10. ASTM E1921-23; Standard Test Method for Determination of Reference Temperature, T0, for Ferritic Steels in the Transition Range. ASTM: West Conshohocken, PA, USA, 2024.
  11. Coêlho, G.d.C.; Silva, A.A.; dos Santos, M.A.; Machado, J.J.M.; Tavares, J.M.R.S. Ductile Fracture Behavior of ASTM A516 Gr.70 Pressure Vessel Steel by ASTM and ISO Fracture Toughness Standards. Metals 2023, 13, 867. [Google Scholar] [CrossRef]
  12. ASTM A516/A516M-17; Standard Specification for Pressure Vessel Plates, Carbon Steel, for Moderate- and Lower-Temperature Service. ASTM: West Conshohocken, PA, USA, 2017.
  13. Ghasemi, H.; Masoudi Nejad, R.; Jalayerian Darbandi, A.; Tadi Beni, Y.; Shariati, M. Fatigue and fracture behavior of A516 steel used in thick-walled pressure vessels. Sci. Iran. B 2020, 27, 2902–2914. [Google Scholar] [CrossRef]
  14. Kostić, N.; Čamagić, I.; Sedmak, A.; Burzić, Z.; Sedmak, S. Impact toughness behaviour of A516 Gr. 60 steel welded joints. Struct. Integr. Life 2024, 24, 232–239. [Google Scholar] [CrossRef]
  15. Gupta, L.; Keskar, N.; Maji, B.C.; Singh, R.N.; Krishnan, M. Effect of Heat Treatments on the Microstructure and Mechanical Properties of SS317L/ASTM SA516 GR60 Steel Clad Plate Fabricated Through Hot Roll Bonding. Met. Mater. Trans. A 2024, 55, 4354–4372. [Google Scholar] [CrossRef]
  16. Golubović, T.; Sedmak, A.; Spasojević Brkić, V.; Kirin, S.; Rakonjac, I. Novel risk based assessment of pressure vessels integrity. Tech. Gaz. 2018, 25, 803–807. [Google Scholar]
  17. Stanojević, P.; Jovanović, A.; Kirin, S.; Misita, M.; Orlić, B.; Eremić, S. Some achievements in RBIM implementation according to RIMAP approach. Struct. Integr. Life 2015, 15, 79–84. [Google Scholar]
  18. Jeremic, L.; Sedmak, A.; Milovanović, N.; Milošević, N. Assessment of structural integrity of pressure vessel for compressed air. Struct. Integr. Life 2021, 21, 3–6. [Google Scholar]
  19. ASTM E1820-20; Standard Test Method for Measurement of Fracture Toughness. ASTM International: West Conshohocken, PA, USA, 2019.
  20. Bhushan, A.; Panda, S.K. Experimental and computational correlation of fracture parameters KIc, JIc, and GIc for unimodular and bimodular graphite components. J. Nucl. Mater. 2018, 503, 205–225. [Google Scholar] [CrossRef]
  21. Sadananda, K.; Nani Babu, M.; Vasudevan, A.K. A review of fatigue crack growth resistance in the short crack growth regime. Mater. Sci. Eng. A 2019, 754, 674–701. [Google Scholar] [CrossRef]
  22. Pugno, N.; Ciavarella, M.; Cornetti, P.; Carpinteri, A. A generalized Paris’ law for fatigue crack growth. J. Mech. Phys. Solids 2006, 54, 1333–1349. [Google Scholar] [CrossRef]
  23. Schweizer, C.; Seifert, T.; Nieweg, B.; von Hartrott, P.; Riedel, H. Mechanisms and modelling of fatigue crack growth under combined low and high cycle fatigue loading. Int. J. Fatigue 2011, 33, 194–202. [Google Scholar] [CrossRef]
  24. Paris, P.; Ergodan, F. A Critical Analysis of Crack Propagation Laws. J. Basic Eng. 1963, 85, 528–533. [Google Scholar] [CrossRef]
  25. ASTME647-15e1; Standard Test Method for Measurement of Fatigue Crack Growth Rates. ASTM International: West Conshohocken, PA, USA, 2024.
  26. Available online: https://www.rumul.ch/250_products.php?lang_choose=1 (accessed on 23 August 2024).
  27. Burdekin, F.M.; Dawes, M.G. Practical use of linear elastic and yielding fracture mechanics with particular reference in pressure vessels. In Proceedings of the Institute of Mechanical Engineering Conference, London, UK, 7–10 September 1971; pp. 28–37. [Google Scholar]
  28. Anderson, T.L. Fracture Mechanics—Fundamentals and Applications, 3rd ed.; CRC Press: Boca Raton, FL, USA, 2005. [Google Scholar]
  29. Kačmarčik, J.; Hadžalić, M.; Konjatić, P. Structural integrity assessment of a mine hoist rope attachment element with a crack. Struct. Integr. Life 2021, 21, 59–64. [Google Scholar]
  30. Opačić, M. Structural Integrity Assessment of Welded Joints with Unacceptable Defects. Ph.D. Thesis, University of Belgrade, Faculty of Mechanical Engineering, Beograd, Serbia, 2023. (In Serbian). [Google Scholar]
  31. EN ISO 11666:2018; Non-Destructive Testing of Welds—Ultrasonic Testing—Acceptance Levels. ISO: Geneva, Switzerland, 2018.
  32. Gerić, K. Crack Initiation and Growth in High Strength Steel Welded Joints. Ph.D. Thesis, University of Belgrade, Beograd, Serbia, 1997. (In Serbian). [Google Scholar]
  33. Verma, V.; Nallasivam, K.; Khair, U.; Wani, F. Forecasting fatigue life of horizontally curved thin-walled box girder railway bridge exposed to cyclic high-speed train loads. Struct. Integr. Life 2023, 23, 335–342. [Google Scholar]
  34. Sedmak, A. Fatigue crack growth simulation by extended finite element method: A review of case studies. Fatigue Fract. Eng. Mater. Struct. 2024, 47, 1819–1855. [Google Scholar] [CrossRef]
  35. Rege, K.; Lemu, G.H. A review of fatigue crack propagation modelling techniques using FEM and XFEM. In Proceedings of the IOP Conference Series: Materials Science and Engineering, Stavanger, Norway, 30 November–1 December 2017; Volume 276, p. 012027. [Google Scholar] [CrossRef]
  36. Pathak, H.; Singh, A.; Vir Singh, I. Fatigue crack growth simulations of 3-D problems using XFEM. Int. J. Mech. Sci. 2013, 76, 112–131. [Google Scholar] [CrossRef]
  37. Milne, I. Failure analysis in the presence of ductile crack growth. Mater. Sci. Eng. 1979, 39, 65–79. [Google Scholar] [CrossRef]
Figure 1. Welded joint geometry.
Metals 14 01447 g001
Figure 2. Welding pass plan.
Metals 14 01447 g002
Figure 3. Macrography indicating weld metal (WM), base metal (BM) and heat affected zone (HAZ).
Metals 14 01447 g003
Figure 4. Microstructure of the welded joint made of A516 Gr. 60 steel. (a) BM, (b) HAZ, (c) FL, (d) WM.
Metals 14 01447 g004aMetals 14 01447 g004b
Figure 5. Standard SE (B) specimen (W = 30 mm).
Metals 14 01447 g005
Figure 6. (a) Standard SE(B) specimens used for fracture mechanics tests; (b) instrumentation for CTOD measurement, according to ASTM E1820-20.
Metals 14 01447 g006
Figure 7. RUMUL FRACTOMAT device and its operating scheme.
Metals 14 01447 g007
Figure 8. Specimens used in experiment.
Metals 14 01447 g008
Figure 9. (a) P—Vm and (b) J—Δa diagrams for a specimen with a crack tip in the BM.
Metals 14 01447 g009
Figure 10. (a) P—Vm and (b) J—Δa diagrams for a specimen with a crack tip in the HAZ.
Metals 14 01447 g010aMetals 14 01447 g010b
Figure 11. (a) P—Vm and (b) J—Δa diagrams for a specimen with a crack tip in the WM.
Metals 14 01447 g011
Figure 12. Welded joint; (a) fracture toughness values; (b) critical crack length.
Metals 14 01447 g012
Figure 13. Failure analysis diagram for pressure vessels.
Metals 14 01447 g013
Figure 14. The da/dN—K diagram for specimen BM 1. (a) whole diagram, (b) a detailed view of the relevant portion of the diagram.
Metals 14 01447 g014
Figure 15. The da/dN—K diagram for specimen HAZ 1. (a) whole diagram, (b) a detailed view of the relevant portion of the diagram.
Metals 14 01447 g015
Figure 16. The da/dN—ΔK diagram for specimen WM 1. (a) whole diagram, (b) a detailed view of the relevant portion of the diagram.
Metals 14 01447 g016
Figure 17. Change in da/dN depending on the crack tip location in A516 Gr. 60 welded joints.
Metals 14 01447 g017
Table 1. Chemical composition—BM, [14].
Element, %wt.
CSiMnPSCuAlCrMoNiN
0.220.200.860.007<0.0010.240.0380.120.050.150.005
Table 2. Tensile properties, min. BM, [14].
MaterialUpper Yield Stress, ReH, MPaLower Yield Stress, ReL, MPaTensile Strength
Rm, MPa
Elongation A, %Elasticity Module
E, GPa
BM (A516 Gr. 60)365.9350.4483.140.8211.7
NIOVAL 5052750565022.6205.0
Table 3. Chemical composition of the filler material, EVB 50 [14].
Filler MaterialElement, %wt.
CSiMnNiPSN
EVB Ni0.070.501.401.10.0090.0110.012
Table 4. Mechanical properties of the filler material, EVB 50 [14].
Filer MaterialYield Stress
Rp0.2, MPa, min.
Tensile Strength
Rm, MPa
Elongation
A, %, min.
Impact Energy, KV, J
нa −40 °C, min.
EVB Ni460560–7202247
Table 5. Values of KIc for specimens for all three groups.
Specimen
Designation
Critical J-Integral,
JIc, kJ/m2
Fracture Toughness,
KIc, MPa√m
Critical Crack Length,
ac, mm
BM 1195.3215.1107.6
BM 2189.2211.7104.3
BM 3204.5220.1112.7
HAZ 1167.2199.092.2
HAZ 2175.4203.996.7
HAZ 3170.8201.294.1
WM 1147.8185.079.6
WM 2151.2187.181.4
WM 3157.4190.984.8
Table 6. Risk matrix for defect 2.5.
Consequence Category
1 Very Low2 Low3 Medium4 High5 very HighRisk Level
Probability Category≤0.2
very low
Very low
0.2–0.4
low
A516 Gr. 60Low
0.4–0.6
medium
Medium
0.6–0.8
high
Nioval 50High
0.8–1.0
very high
Very high
Table 7. Parameters for fatigue crack growth for specimens with notches in PM, WM and HAZ.
Crack Tip PositionCoefficient, CExponent, mda/dN, mm/cycl, for ΔK = 30 MPa√m
BM 18.62 × 10−92.921.77 × 10−4
BM 22.49 × 10−93.191.28 × 10−4
BM 33.65 × 10−82.361.12 × 10−4
HAZ 17.88 × 10−93.113.09 × 10−4
HAZ 22.84 × 10−93.362.61 × 10−4
HAZ 31.23 × 10−82.922.52 × 10−4
WM 17.06 × 10−93.264.58 × 10−4
WM 22.21 × 10−93.564.01 × 10−4
WM 33.18 × 10−104.103.62 × 10−4
Disclaimer/Publisher’s Note: The statements, opinions and data contained in all publications are solely those of the individual author(s) and contributor(s) and not of MDPI and/or the editor(s). MDPI and/or the editor(s) disclaim responsibility for any injury to people or property resulting from any ideas, methods, instructions or products referred to in the content.

