Article

A Study on the Impact Toughness of the Simulated Heat-Affected Zone in Multi-Layer and Multi-Pass Welds of 1000 MPa Grade Steel for Hydroelectric Applications

1
School of Materials Science and Engineering, Lanzhou Jiaotong University, Lanzhou 730070, China
2
College of Materials Science and Engineering, Xi’an Shiyou University, Xi’an 710065, China
*
Author to whom correspondence should be addressed.
Metals 2024, 14(12), 1455; https://doi.org/10.3390/met14121455
Submission received: 11 November 2024 / Revised: 13 December 2024 / Accepted: 16 December 2024 / Published: 19 December 2024

Abstract

:
The microstructure and impact toughness of a steel material subjected to multi-layer and multi-pass welding with varying secondary peak temperatures were investigated using welding thermal simulation. The detailed microstructures and fracture morphologies were examined by SEM, TEM, and EBSD. When the secondary peak temperature reaches 650 °C, the microstructure resembles that of a primary thermal cycle at 1300 °C, characterized by coarse grains and straight grain boundaries. As the temperature increases to 750 °C, chain-like structures of bulky M/A (martensite/austenite) constituents form at grain boundaries, widening them significantly. At 850 °C, grain boundaries become discontinuous, and large bulky M/A constituents disappear. At 1000 °C, smaller austenitic grains form granular bainite during cooling. However, at 1200 °C, grain coarsening occurs due to the significant increase in peak temperature, accompanied by a lath martensite structure at higher cooling rates. In terms of toughness, the steel exhibits better toughness at 850 °C and 1000 °C, with ductile fracture characteristics. Conversely, at 650 °C, 750 °C, and 1200 °C, the steel shows brittle fracture features. Microscopically, the fracture surfaces at these temperatures exhibit quasi-cleavage fracture characteristics. Notably, chain-like M/A constituents at grain boundaries significantly affect impact toughness and are the primary cause of toughness deterioration in the intercritical coarse-grained heat-affected zone.

1. Introduction

As a kind of clean renewable energy, hydropower plays an important role in the power system. With the large-scale development of water resources, the construction of large, super large, and even giant hydropower stations has become an inevitable trend in the development of the industry. Whether it is the requirement of a structural safety design of hydropower stations or the economic consideration of reducing the amount of steel used and the amount of engineering, higher requirements are put forward for the strength grade of steel used in hydropower pressure pipes. Hydropower 1000 MPa grade high steel has become the necessary material for ultra-high head, large diameter, and large wall thickness hydropower pressure steel pipes [1,2,3]. The welding crack sensitivity of high-strength steel is high, the problems of embrittlement, softening, and hardening of welding the heat-affected zone are prominent, and the welding joint is prone to failure [4,5,6]. The Cleuson Dixence hydroelectric power station in Switzerland has the world’s highest water head hydrogenerator set. The lower inclined section of the pressure steel pipe is welded by 1000 MPa grade high-strength steel S890QL. However, in December 2000, a serious rupture occurred in the pressure steel channel at an altitude of 1234 m, with cracks of about 9 m in length and 60 cm in width along the weld, which caused serious accident consequences in the downstream area [7,8,9].
The welding issues of pressure piping have always been a focal point of attention. During the welding thermal process, the base material adjacent to the weld seam undergoes changes in structure and properties due to the welding heat, which is equivalent to undergoing a brief heat treatment. The base material structure, which was refined and strengthened during the rolling process, undergoes significant coarsening and embrittlement [10,11,12], accompanied by the emergence of hard and brittle second-phase products, such as martensite/austenite (M-A) constituents, resulting in a notable decrease in impact toughness [13].
Due to the varying distances of different parts of the heat-affected zone (HAZ) from the weld seam, they undergo different thermal cycles, leading to different microstructural changes and thus different properties. As the steel strength level increases, the embrittlement and crack tendency of the HAZ become more severe, and the problems encountered are more complex than those in the weld seam, making the HAZ a potentially weak area in the welded joint [14,15,16]. Therefore, sufficient attention should be given to the HAZ.
In double-sided welding and multi-pass welding, different parts of the previously welded pass that have undergone one thermal cycle are situated at varying distances from the heat source of the subsequent pass, thus undergoing a second thermal cycle with different peak temperatures, which leads to different changes in the properties of the coarse-grained HAZ of the previous pass. In double-sided welding, these areas experience a second thermal cycle, resulting in complexity and unevenness in the microstructure, which in turn causes changes in the properties of the HAZ of the previous pass.
Due to the varying degrees of thermal influence from the welding process, the microstructure of the HAZ varies, including the coarse-grained HAZ (CGHAZ), fine-grained HAZ (FGHAZ), partially recrystallized HAZ (ICHAZ), and incompletely recrystallized coarse-grained HAZ (ICCGHAZ) [17,18,19,20].
Previous research results have shown [21,22,23] that there is a ubiquitous phenomenon of localized embrittlement in the critical coarse-grained zone during the second thermal cycle. This area with lower toughness in the welding HAZ is referred to as the locally brittle zone [24,25]. During deformation, brittle cracks are prone to initiate from the locally brittle zone and then propagate unstably [26,27,28]. Due to the different degrees of thermal influence from the welding process, the microstructure of the HAZ varies.
As a new type of pressure steel pipe material, the microstructural properties of 1000 MPa hydroelectric steel under multi-layer and multi-pass welding have not been reported. The welding methods used for ultra-high-strength steel in hydropower applications include the following. Shielded Metal Arc Welding (SMAW) is characterized by its simple and portable equipment, as well as its flexible operation, making it suitable for welding in various positions. It can be utilized for short-seam welding in maintenance and assembly work, particularly for areas that are difficult to access. Gas Metal Arc Welding (GMAW) boasts a high welding speed and deposition rate, suitable for welding in all positions. With the welding wire serving as the electrode, high-density currents can be employed, resulting in significant penetration of the base material and rapid deposition of the filler metal. Submerged Arc Welding (SAW) offers high weld quality and effective air protection through molten slag. The arc zone is primarily composed of CO2, significantly reducing the nitrogen and oxygen content in the weld metal. This method ensures high production efficiency. Due to the shortened length of the welding wire conducting electricity, both the current and current density are significantly increased, greatly enhancing the arc penetration capability and wire deposition rate. The authors have systematically studied the application of the above methods in welding ultra-high-strength steel for hydropower purposes. This paper focuses on the relevant research on SMAW, with the heat input selected as the commonly used 10 KJ/cm for this process.
Welding ultra-high-strength steel for hydropower applications is relatively challenging. Due to the increased carbon equivalent and poor crack resistance, hydrogen-induced delayed cracking is prone to occur after welding. During the welding process, softening and embrittlement may take place in the heat-affected zone, leading to inadequate joint strength. Welding ultra-high-strength steel pipes in high-altitude and high-humidity environments is particularly difficult and requires special techniques and processes to ensure welding quality.
The microstructure of actual welded joints is relatively complex. Small characteristic regions make it difficult to conduct in-depth studies on their structure and properties. Therefore, analytical calculations, computer simulations, and thermal simulations can be used to predict the microstructure in actual welded joints [29,30,31,32]. For instance, finite element methods based on the finite deformation theory and microstructure models can be established to simulate deformation processes, temperature changes, and microstructure evolution. By creating models of the temperature and stress fields during welding, predicting welding-induced residual stresses and deformations is possible. Through numerical simulations and experimental validations, the impact of different welding parameters on the performance of welded joints can be assessed. Among these methods, employing welding thermal simulation technology to replicate the thermal cycles in actual welding processes allows for the production of a series of samples that closely mimic the microstructure of various regions within the real HAZ. Thus, utilizing thermal simulation technology to study the microstructure and properties of different HAZ regions under a single welding thermal cycle is an effective experimental approach.
In this study, various methods were used to comprehensively analyze and investigate the impact of chained M-A constituents in the HAZ on impact toughness and fracture mechanisms in 1000 MPa grade hydroelectric steel-welded joints, focusing on the microstructure, impact toughness, and fracture morphology of the HAZ.

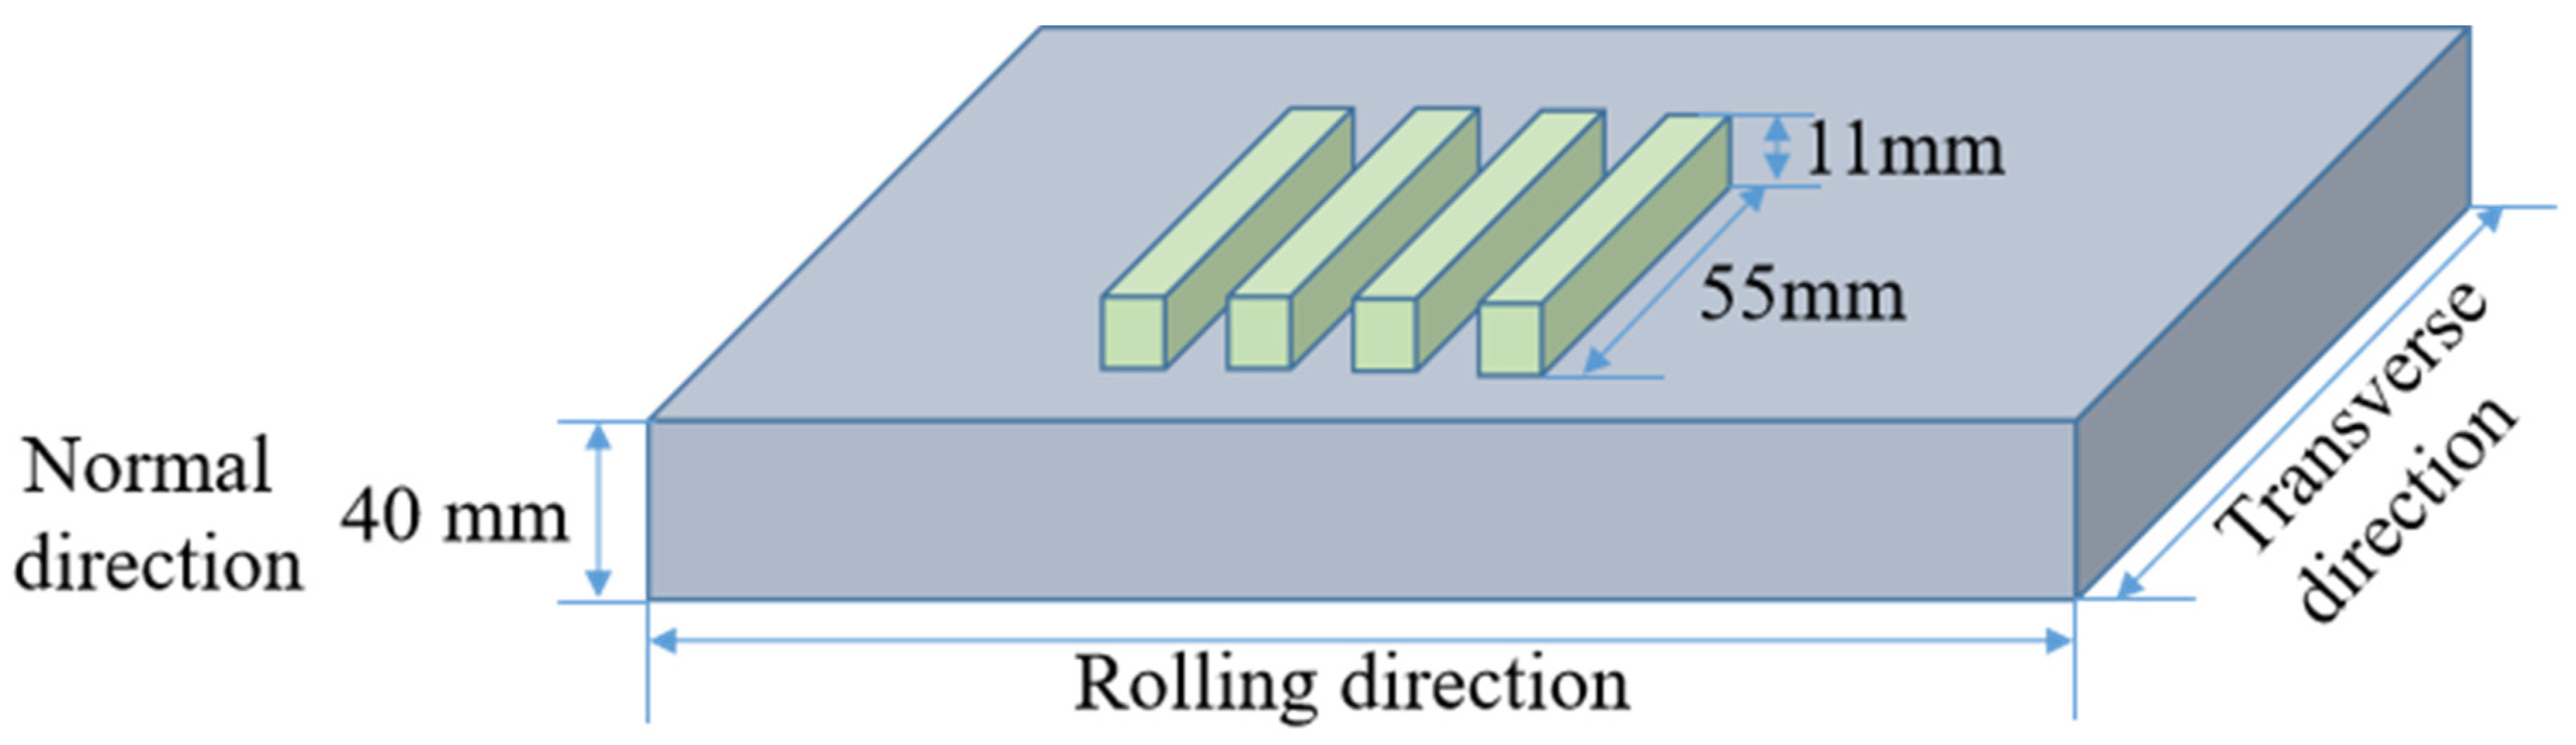
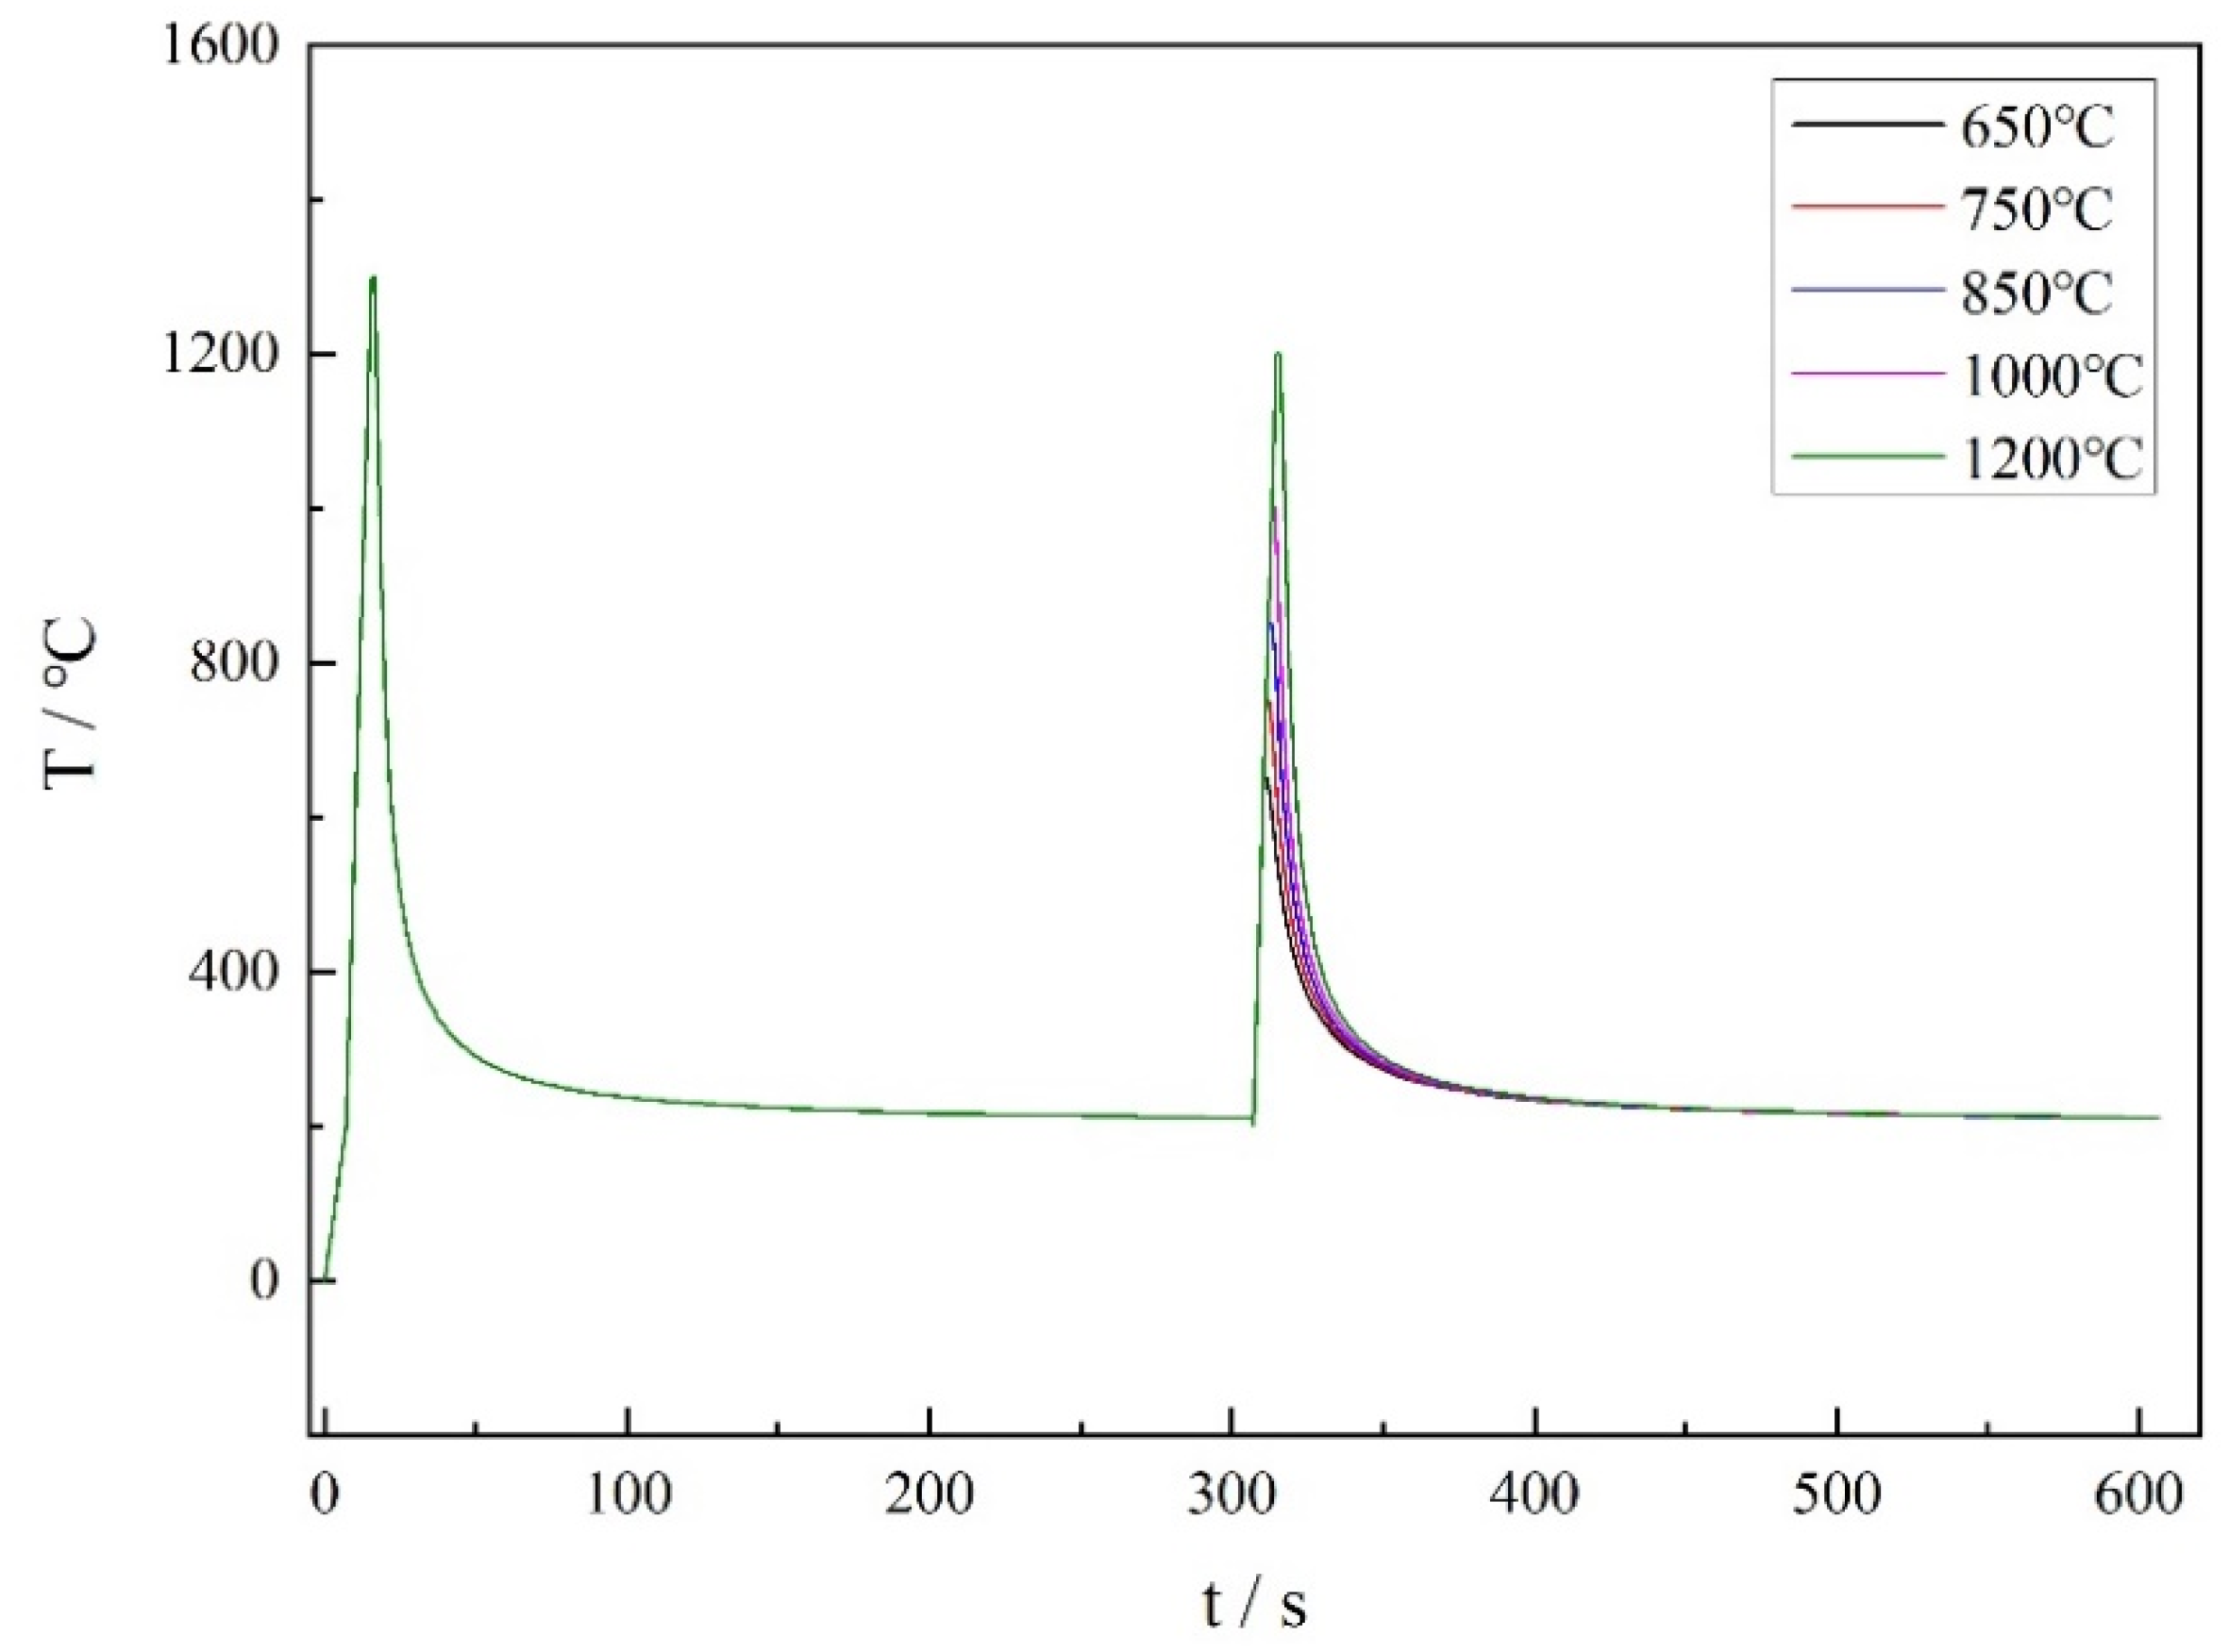
2. Materials and Methods

Experimental steel is specially developed for hydropower projects. The material used was from part of an industrially produced steel plate. The composition of the test steel used in the present study is shown in Table 1. The heat treatment state of the base metal is 860 °C quenching + 560 °C tempering. Quenching is carried out using water, with a quenching coefficient of 1.8. The tempering coefficient is 3.2, and the holding time for tempering is 40 min. After tempering, the material is removed from the furnace and cooled in the air. The critical point of the test steel is AC1 = 722 °C and AC3 = 843 °C.
The thickness of the base metal is 40 mm, and the thermal simulation sample is taken horizontally along the plate from the middle of the thickness of the plate. The length direction of the sample is perpendicular to the rolling direction of the steel plate. The size of the thermal simulation sample is 11 mm × 11 mm × 55 mm. The schematic of the sample orientation is illustrated in Figure 1. The thermal cycle parameter is shown in Table 2.
The proposed primary welding heat input is 10 KJ/cm, and the peak temperature is 1300 °C, that is, the coarse-grained region generated by the simulation of a primary thermal cycle. The secondary heat input is 10 KJ/cm and the secondary peak temperatures are 1200 °C, 1000 °C, 850 °C, 750 °C, and 650 °C, simulating the subcritical coarse crystal zone (SCGHAZ), the critical coarse crystal zone (ICCGHAZ), the over-critical coarse crystal zone (SCCGHAZ), and the unmodified coarse crystal zone (UCGHAZ), respectively. The interpass temperature is 200 °C. The thermal simulation curve is shown in Figure 2.
After the thermal simulation test, the samples were processed into standard V-notch Charpy impact samples of 10 mm × 10 mm × 55 mm according to the standard ISO 148-1:2016 [33]. The notch is opened in the uniform temperature zone at the center of the sample and along the thickness direction. The impact test is carried out on the NI500C impact test machine. The standard impact energy of the impact test machine is 300 ± 10 J, and the impact velocity of the instant pendulum is 5.0~ 5.5 m/s. The test temperature was −40 °C, and the samples were cooled in a temperature chamber. The samples were thrust off within 5 s after being removed from the test chamber.
After the impact test, a KEYENCE VHX-600E (Keyence, Osaka, Japan) ultra-depth-of-field 3D microscope, Axio Vert.A1 (Zeiss, Jena, Germany), a metallographic microscope, and TESCAN CLARA (Tescan, Brno, Czech Republic) were used, respectively. The CLARA field emission electron microscope and the NordlysMax2 (Oxford Instruments, Oxfordshire, Britain) attachment were used for SEM and EBSD observation, and the JEM-2100PLUS (JEOL, Akishima, Japan) transmission electron microscope was used to observe the tissue and fracture.
The sample preparation method was as follows. Firstly, a thin slice of approximately 300 μm thick was cut from the sample using wire electrical discharge machining. This slice was then mechanically ground to a thickness of 50–80 μm and subsequently punched into a small round disk with a diameter of 3 mm. After that, twin-jet electro-polishing was performed on the MTP-1A (Yulong Technology, Ltd., Beijing, China) instrument, with specific process parameters, including a temperature of −20 °C and a polishing voltage of 70 V. The polishing solution consisted of 10% perchloric acid in ethanol by volume.
Another piece cut from the sample was used for further EBSD observation. For samples requiring EBSD observation, after mechanical grinding and polishing, electrolytic polishing was carried out using a 20% perchloric acid solution. The electrolytic polishing voltage was set at 20 V, and the polishing duration was 30 s.

3. Results and Discussion

3.1. Microstructure of the Base Metal

The microstructure of the base metal is shown in Figure 3. The base metal structure consists of granular bainite (GB), quasi-polygonal ferrite (QF), bainite ferrite (BF) and fine granular carbides and is a typical tempered sorbite structure. The width of the bainite lath is about 0.5~1 μm, and the lath contains high-density dislocations inside. The laths are separated by low-angle grain boundaries. The M/A components are distributed in thin film form at the boundary of the bainite laths. Due to high-temperature tempering, some dislocations recovered, the uniform dislocation density decreased, the entangled dislocation formed cellular structures, the low-angle grain boundaries between the laths moved or disappeared, the boundary between the adjacent laths gradually blurred, and the M/A between the laths changed from thin film to block or granular.

3.2. Impact Property

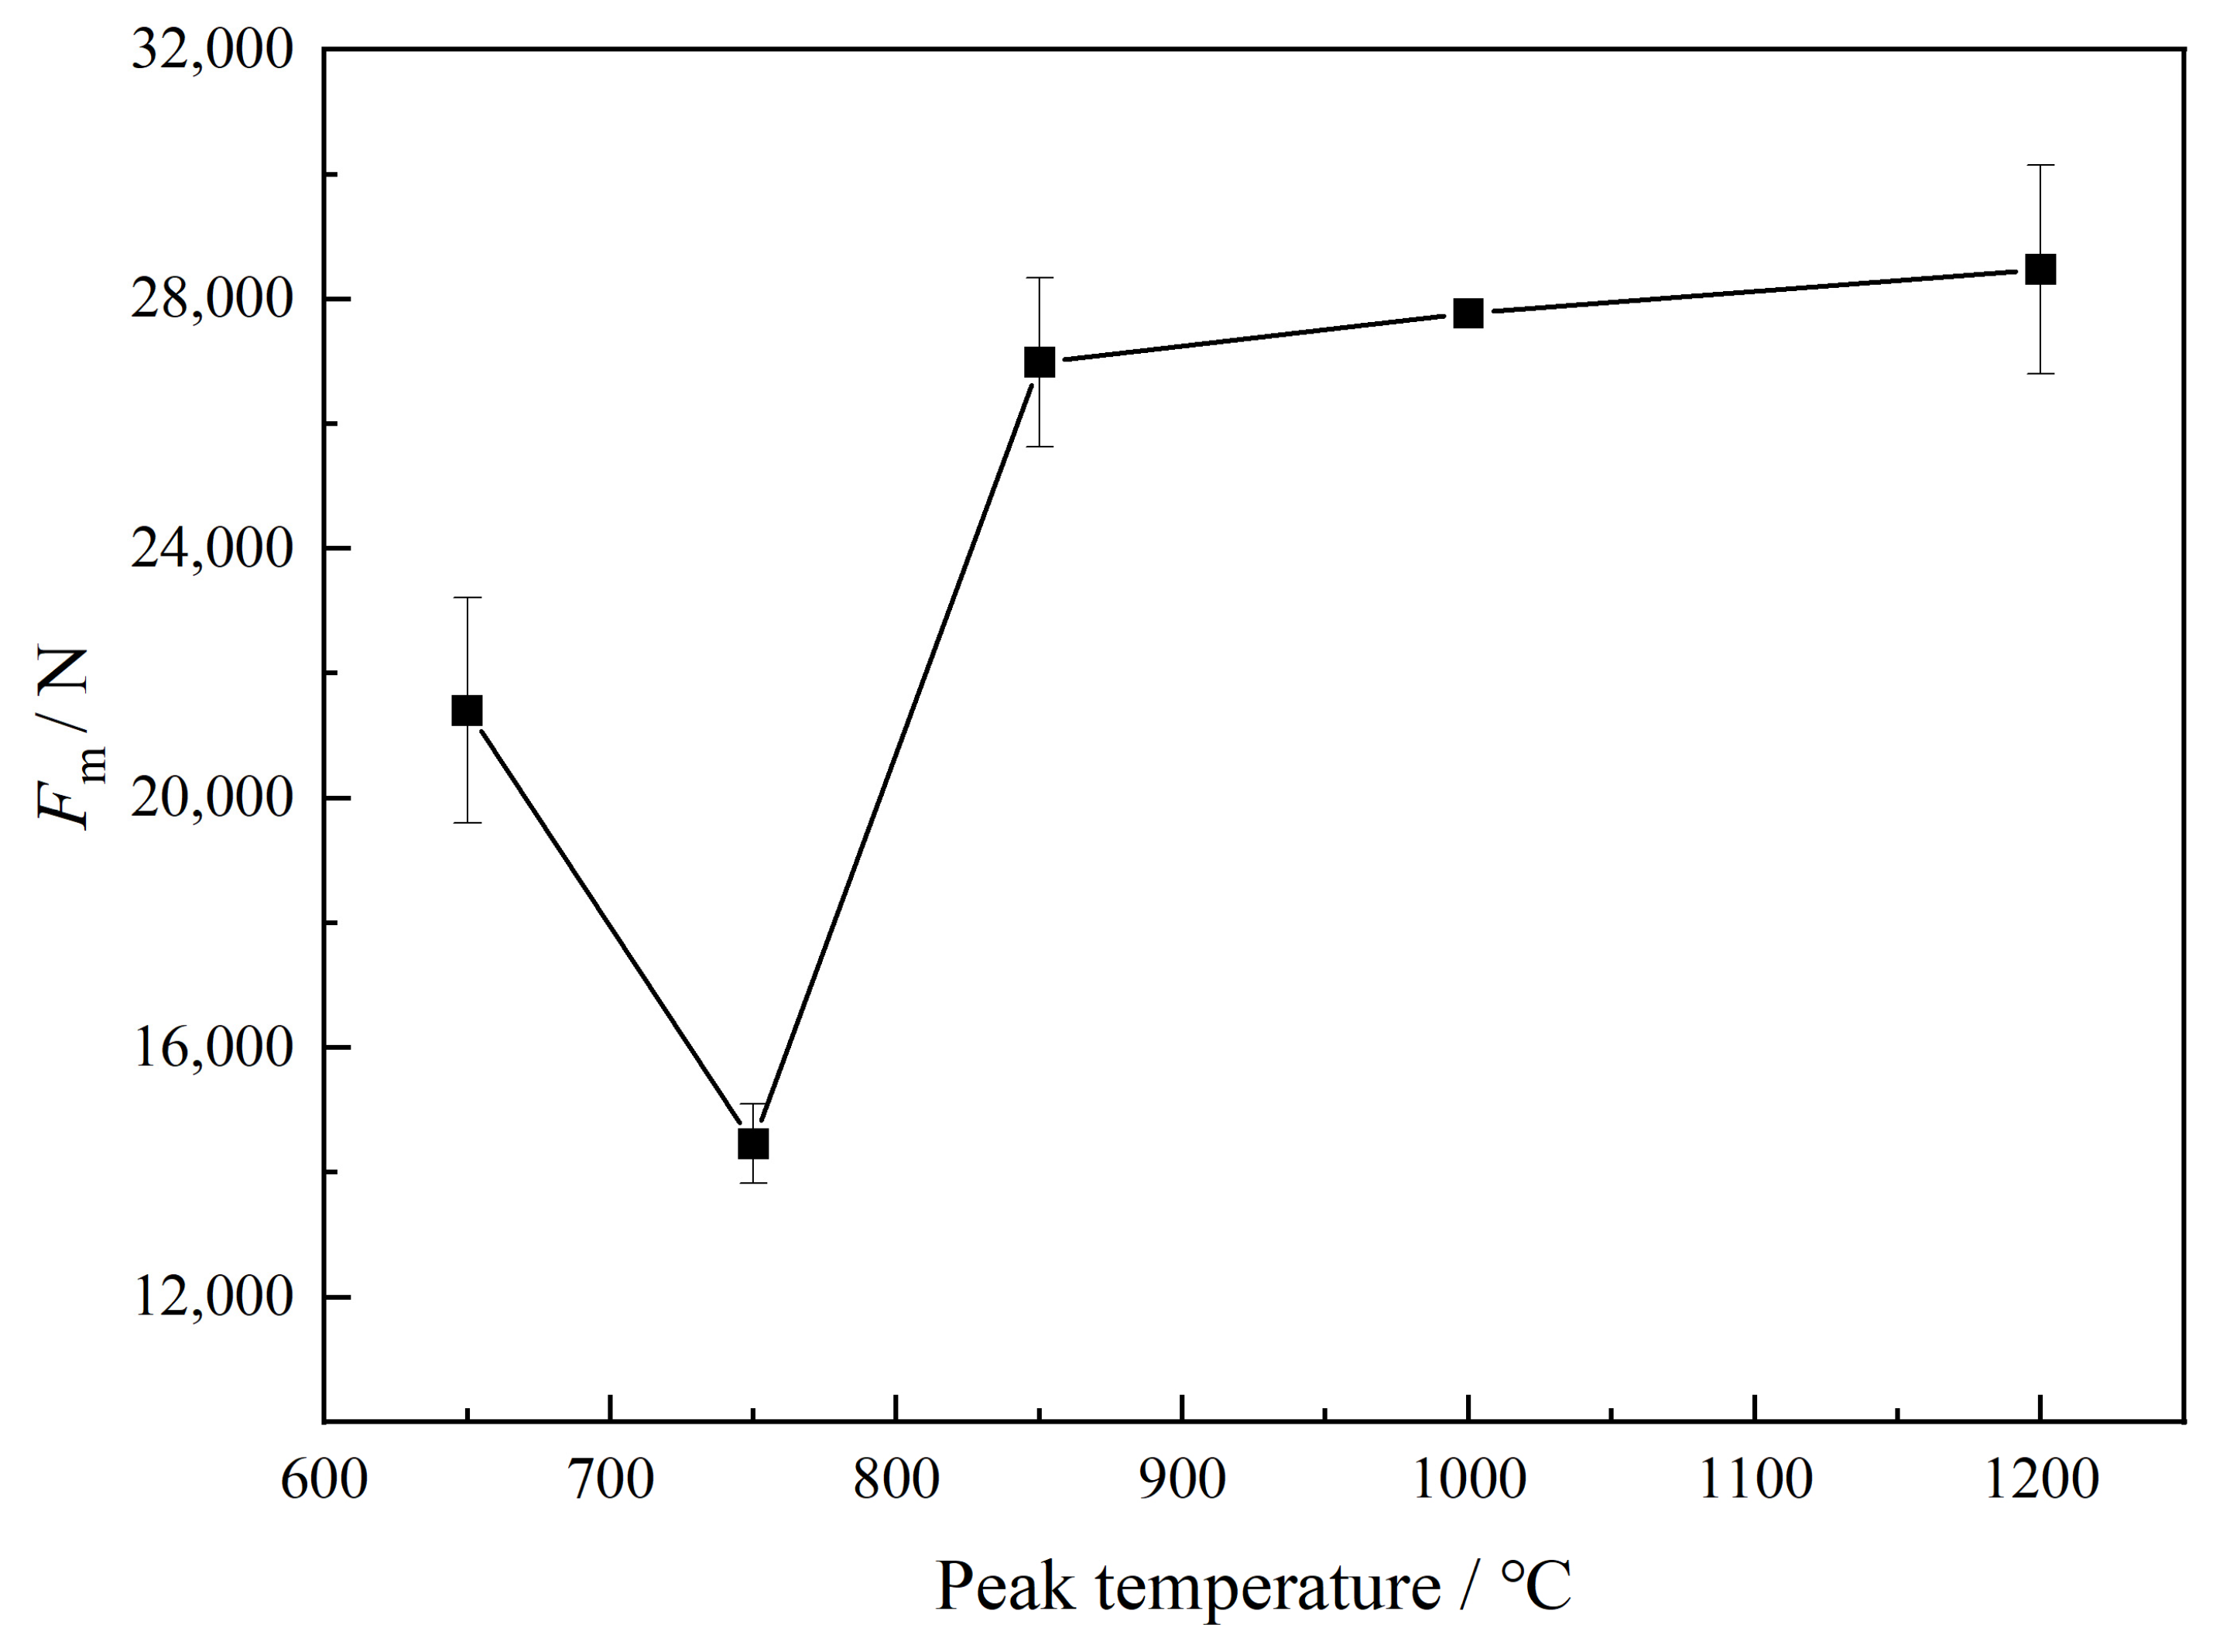
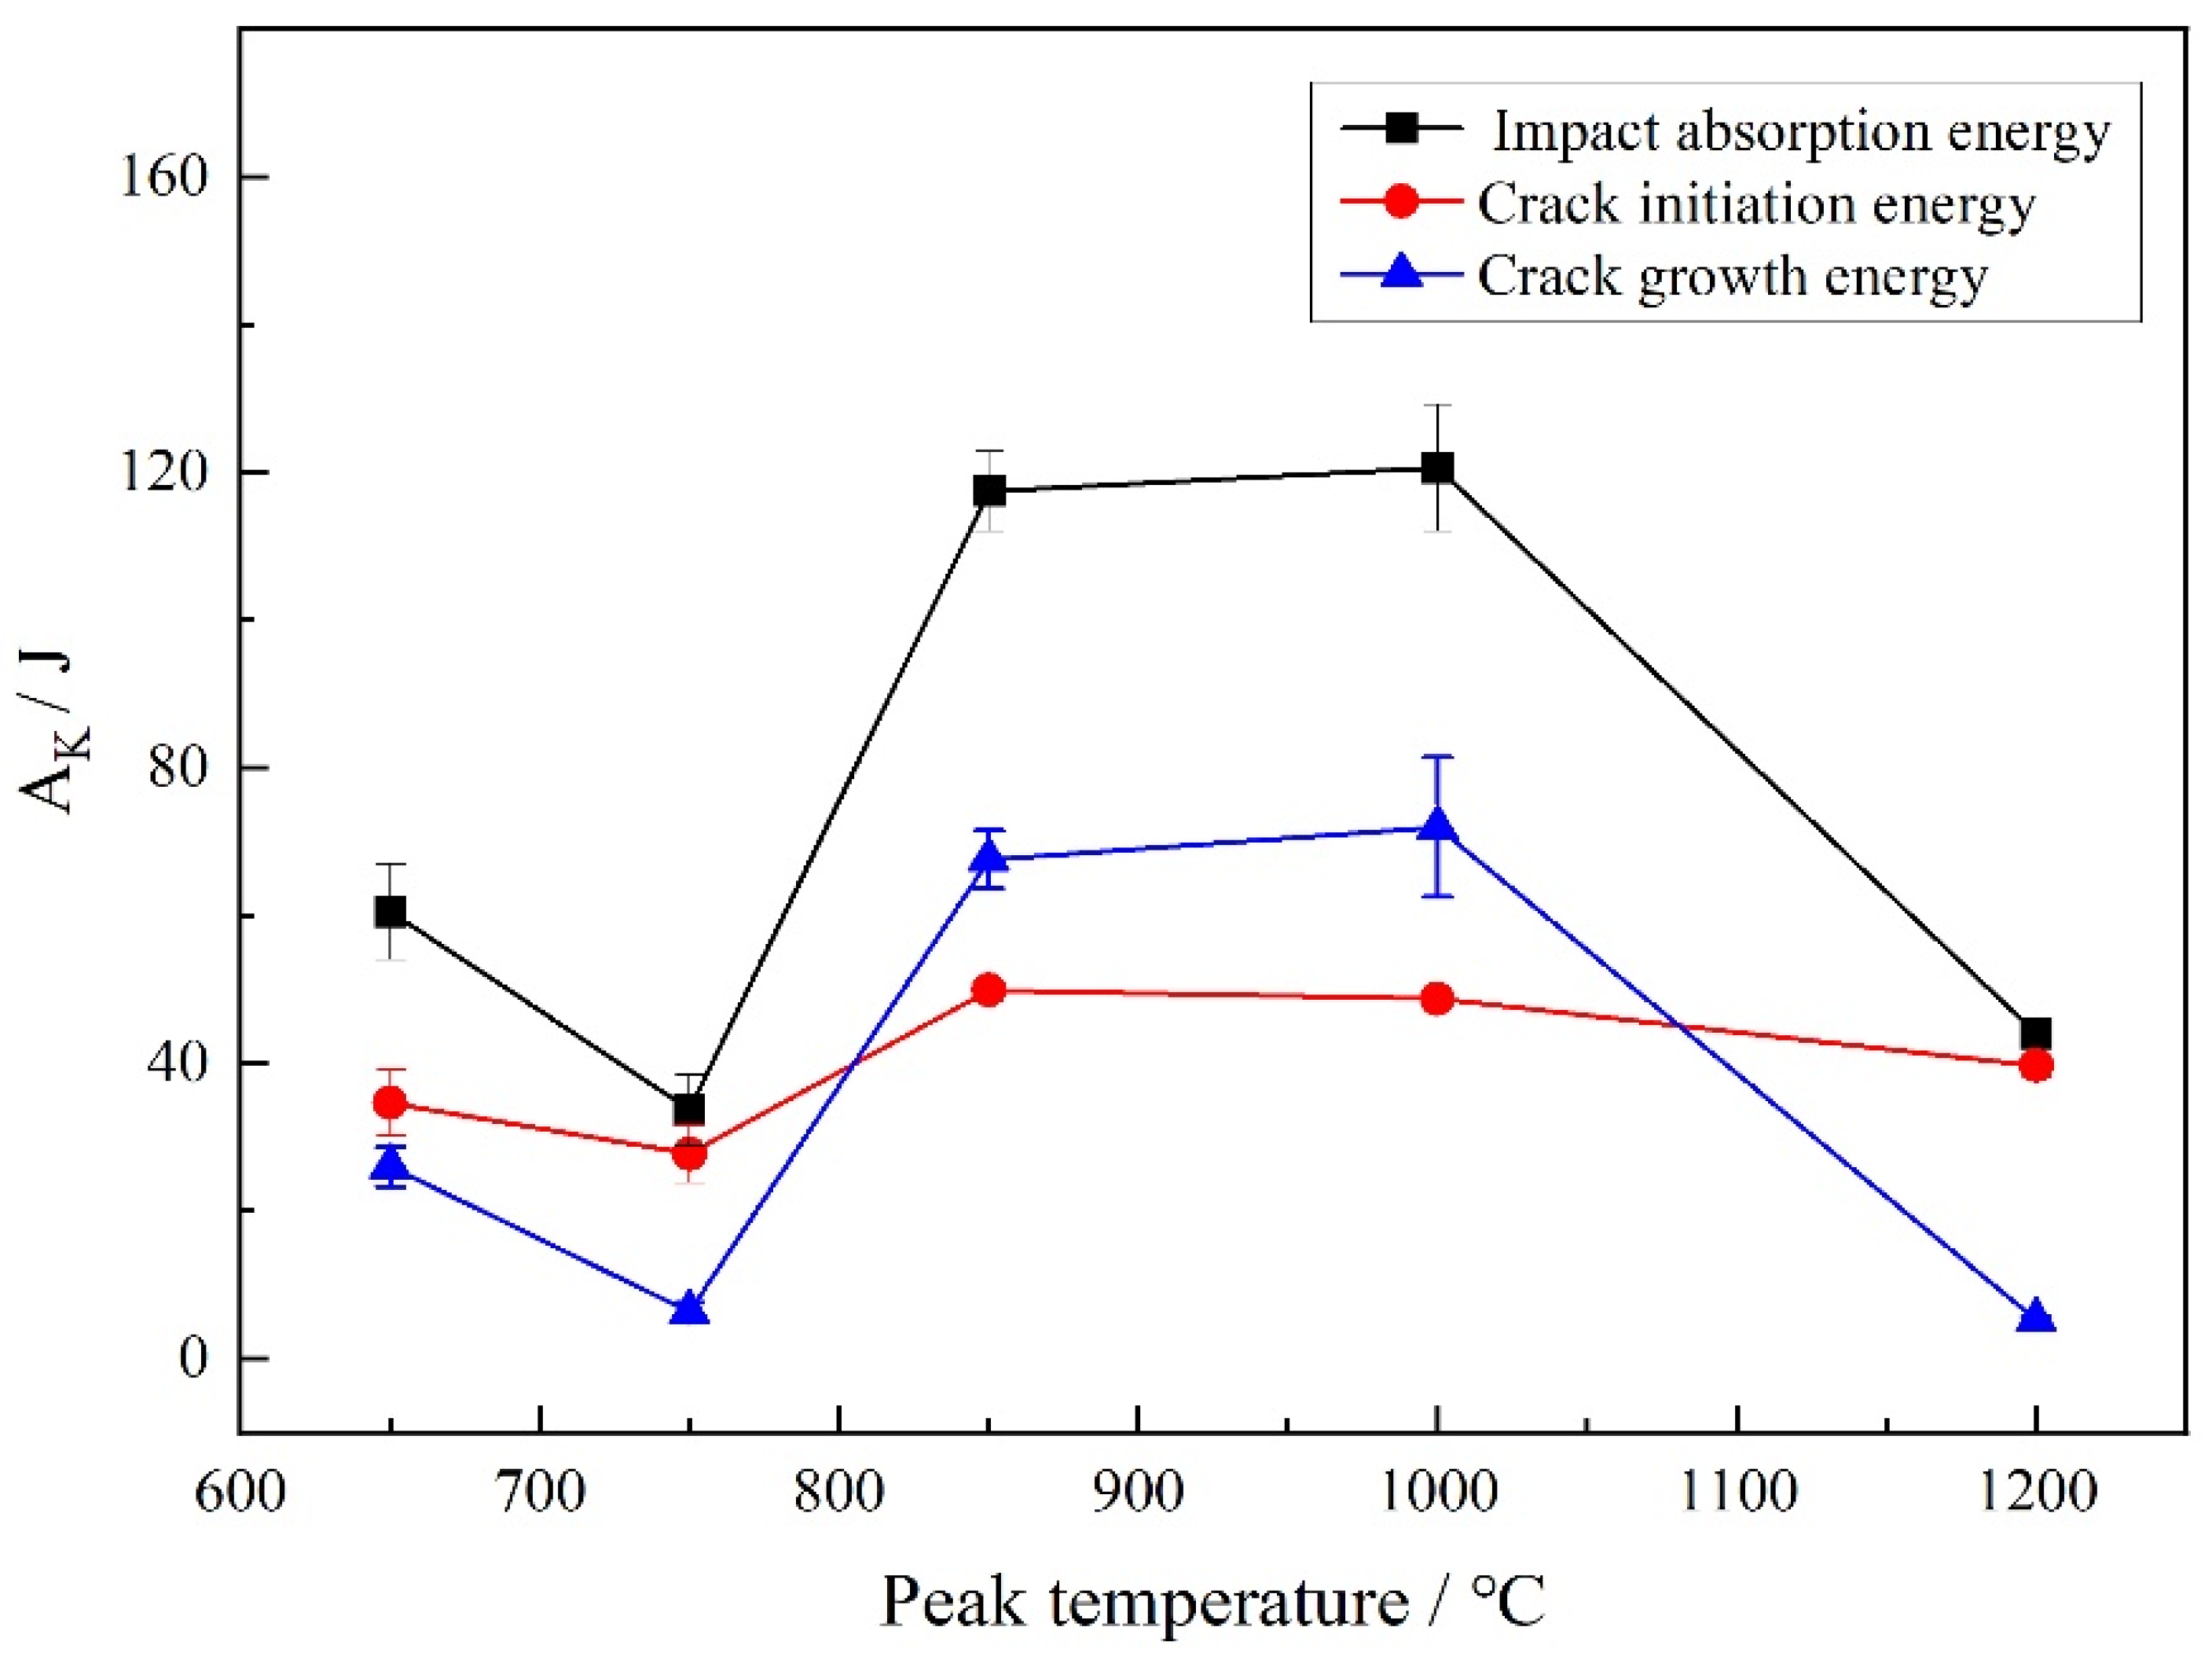
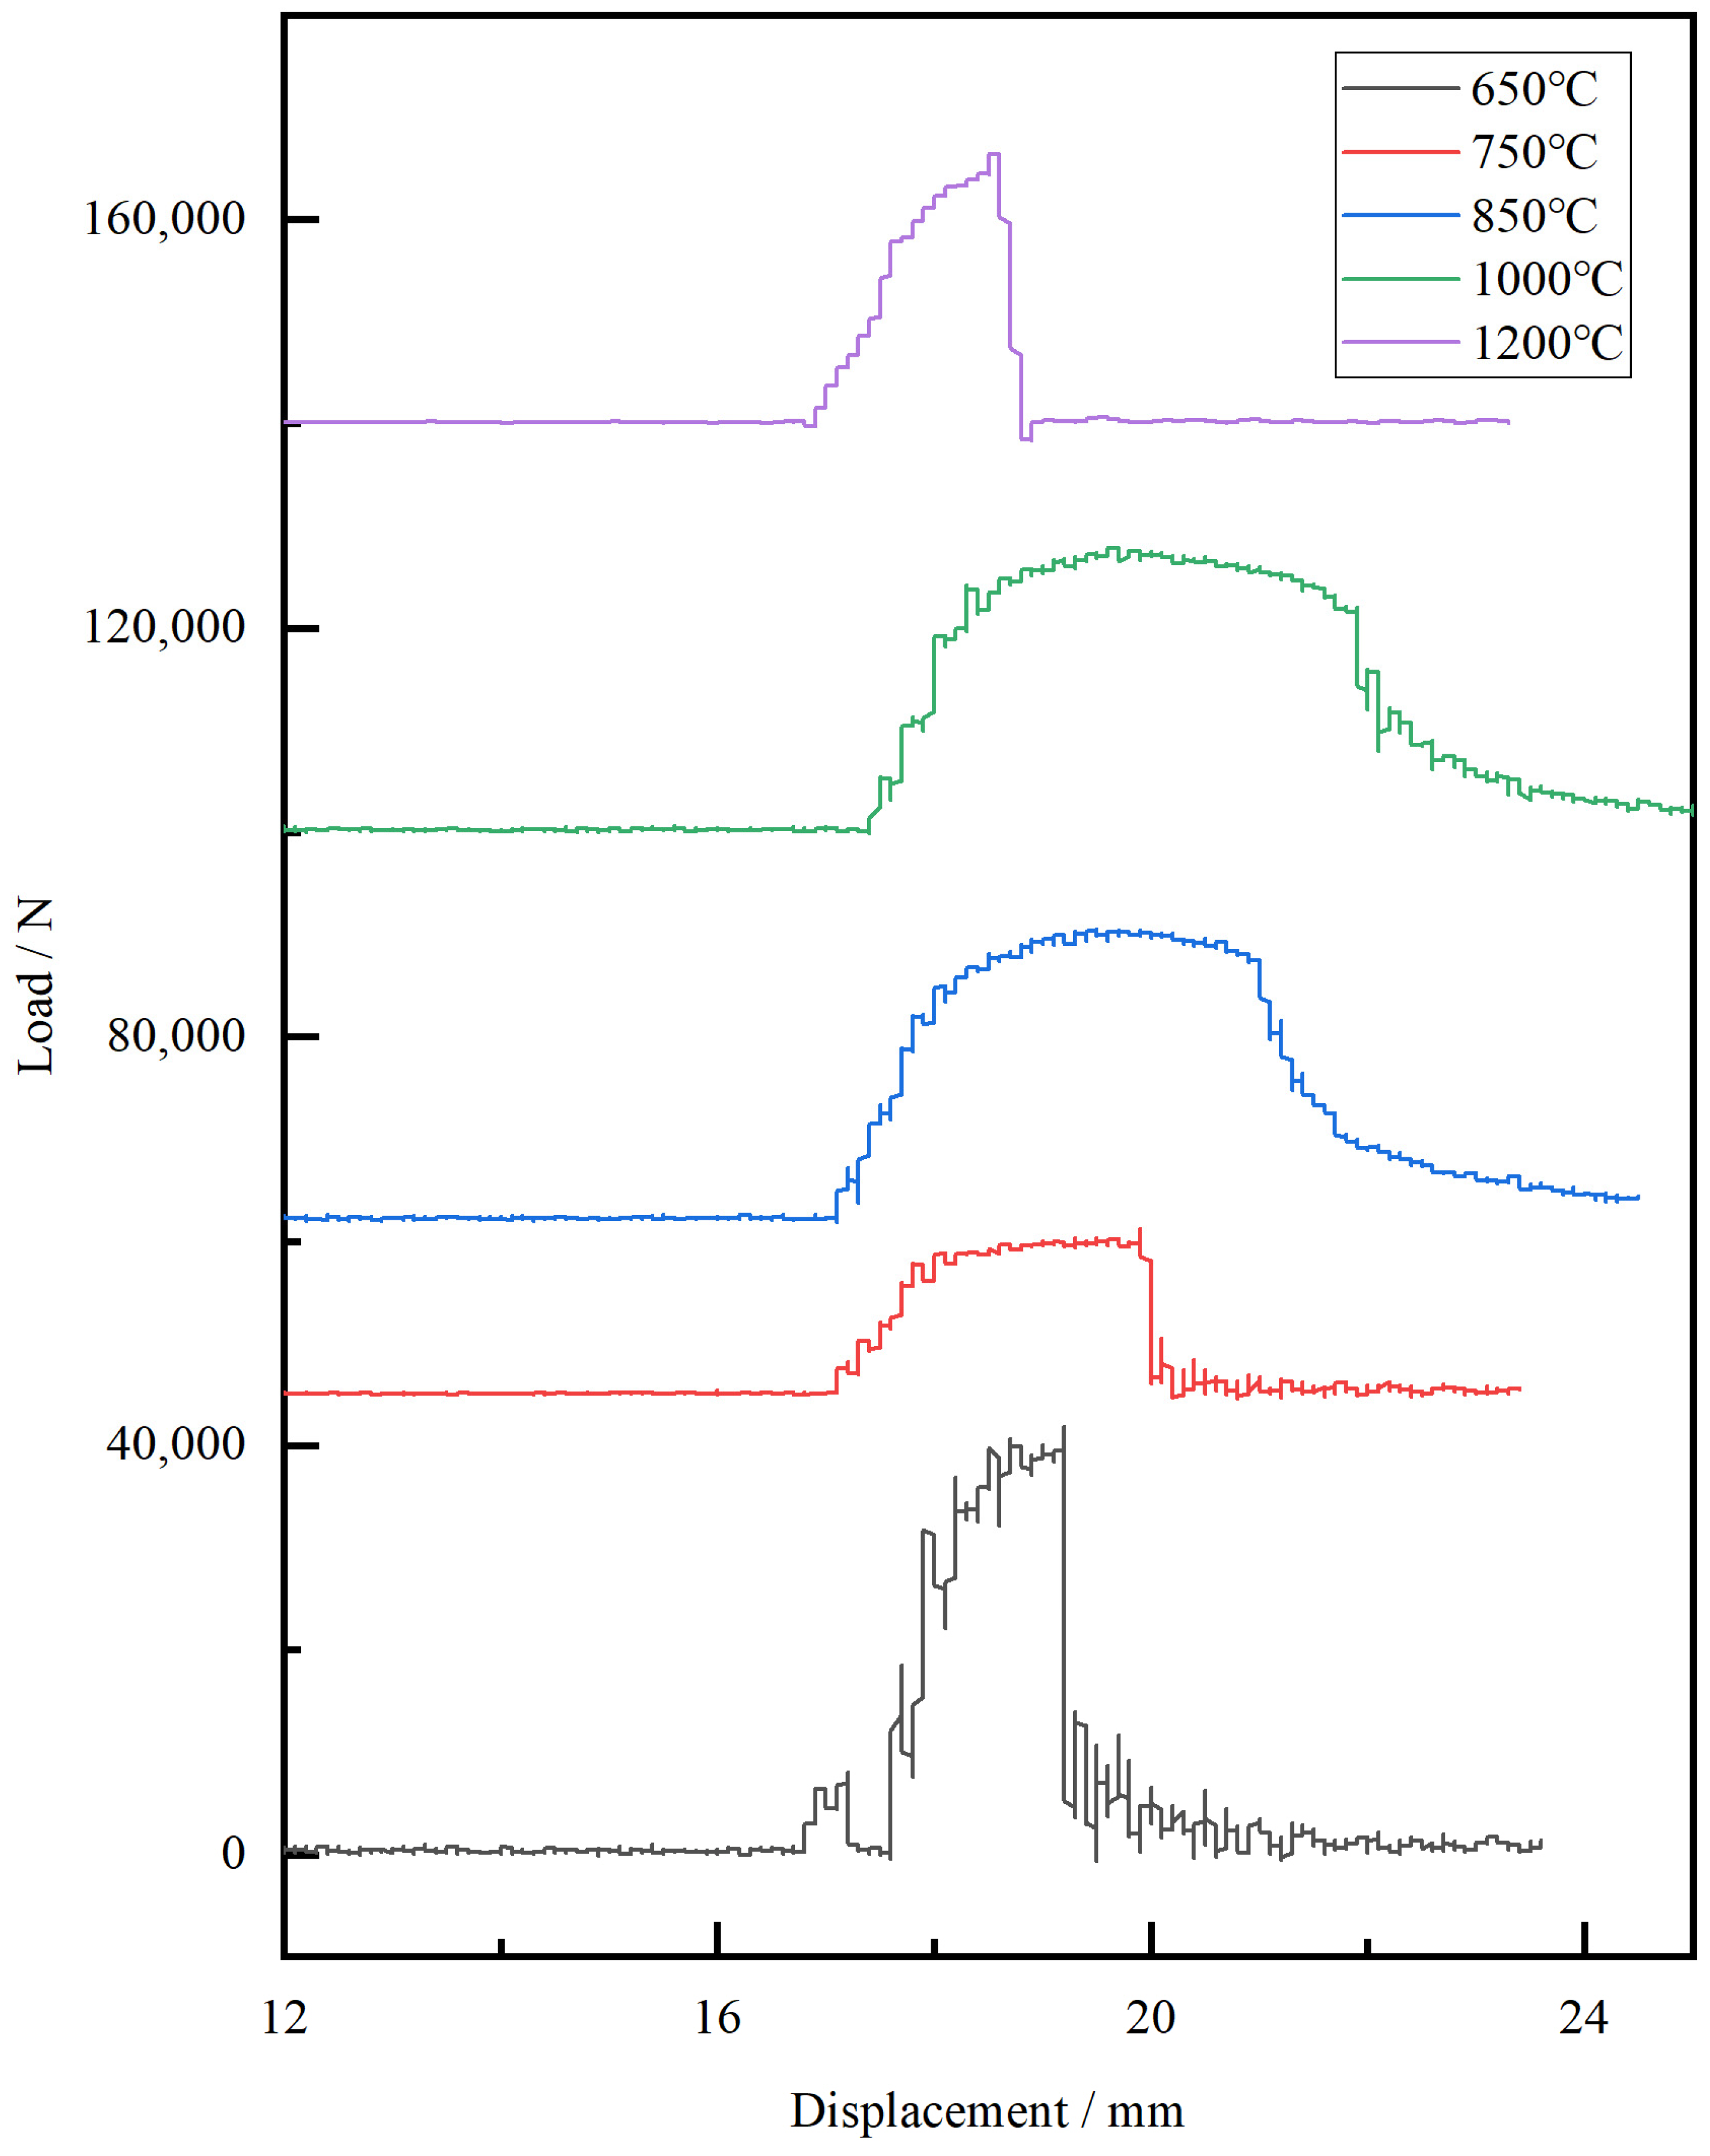
3.2.1. Oscillographic Impact Data

The Charpy impact test data at −40 °C for the tested steel after undergoing thermal cycles with different peak temperatures are presented in Figure 4, Figure 5 and Figure 6 and Table 3. It can be observed that the impact data for the several parallel samples exhibit minor fluctuations. Therefore, one sample from each group was selected for a comparison of dynamic load–displacement (Figure 6). After the impact tests, all samples underwent fracture, corresponding to the sudden drop in load shown in Figure 6.
Combining Figure 4 and Figure 6, it can be observed that when the peak temperature of the thermal cycle is 650 °C, the maximum load on the specimen reaches about 21.4 kN before crack initiation. The curve then smoothly descends, corresponding to the stable propagation of the crack, resulting in a fibrous zone on the sample. Subsequently, there is a sudden drop in load, which signifies rapid crack propagation and less energy dissipation, typically corresponding to sample fracture. The fracture surface morphology is shown in Figure 7. At a peak temperature of 750 °C, the maximum load reaches 14.5 kN, and the crack extends a certain distance before becoming unstable. At 850 °C, the maximum load rises to approximately 27.0 kN, resulting in a broader phase of stable crack propagation. As the peak temperature continues to rise, at 1000 °C, the maximum load remains at 27.7 kN, and the stable crack propagation displacement continues to increase. At 1200 °C, the maximum load is 28.4 kN, and the curve almost lacks a smooth propagation phase, corresponding to a fracture surface that is almost entirely radiating zones.
Further comparison of the impact energy absorption at different secondary peak temperatures was conducted. The average impact energy absorption of the base metal of the test steel at −40 °C is 124 J. According to Table 2, when the secondary peak temperature in the heat-affected zone (HAZ) of the weld is 650 °C, the impact energy is 60.5 ± 6.5 J, which is 50% lower than that of the base metal. At 750 °C, the impact energy absorption is 33.7 ± 4.8 J, representing a 73% reduction compared to the base metal. When the peak temperatures are 850 °C and 1000 °C, the impact energies are 117.5 ± 5.4 J and 120.65 ± 8.5 J, respectively, which are basically consistent with those of the base metal. Therefore, in the HAZ of the test steel, the material can still maintain good toughness when the secondary peak temperatures are 850 °C and 1000 °C. The trends in crack initiation energy and crack propagation energy are the same as those in impact energy absorption.

3.2.2. Impact Fracture Morphologies

Figure 7 shows the schematic diagram of the impact fracture of the test steel and the morphology of the fracture under SEM. All fracture surfaces consist of three typical zones: the fiber zone, the radiation zone, and the shear lip, labeled ①, ②, and ③, respectively. Macroscopically, the area of the fiber zone and the shear lip is huge, and the fracture surfaces exhibit plastic deformation characteristics and appear ductile in nature. At 650 °C, 750 °C, and 1200 °C, the area of the radiation zone is large, and the fracture surfaces are flat and exhibit brittle fracture characteristics macroscopically. These fracture features are consistent with the impact toughness values given previously.
Further observation of the micro-morphology of each zone on the fracture surfaces was conducted. At peak temperatures of 850 °C and 1000 °C, all three zones of the fracture surfaces are composed of dimples with similar dimple diameters, depths, and surrounding plastic deformation patterns. At 650 °C, 750 °C, and 1200 °C, the fracture surfaces display quasi-cleavage fracture characteristics, with visible “cleavage-like” facets, micropores, and tear ridges. The main morphology is flat cleavage planes, with clear river patterns visible on the small facets. The cleavage planes have similar geometric dimensions. A few dimples are distributed on the tear ridges. Cracks and pores can also be observed. According to literature reports, the larger the area of cleavage planes, the lower the impact toughness of the sample. Therefore, the fracture morphology characteristics under different conditions correspond to the impact toughness values of the steel.

4. Discussion

4.1. Microstructure Analysis of the HAZ at Different Secondary Peak Temperatures

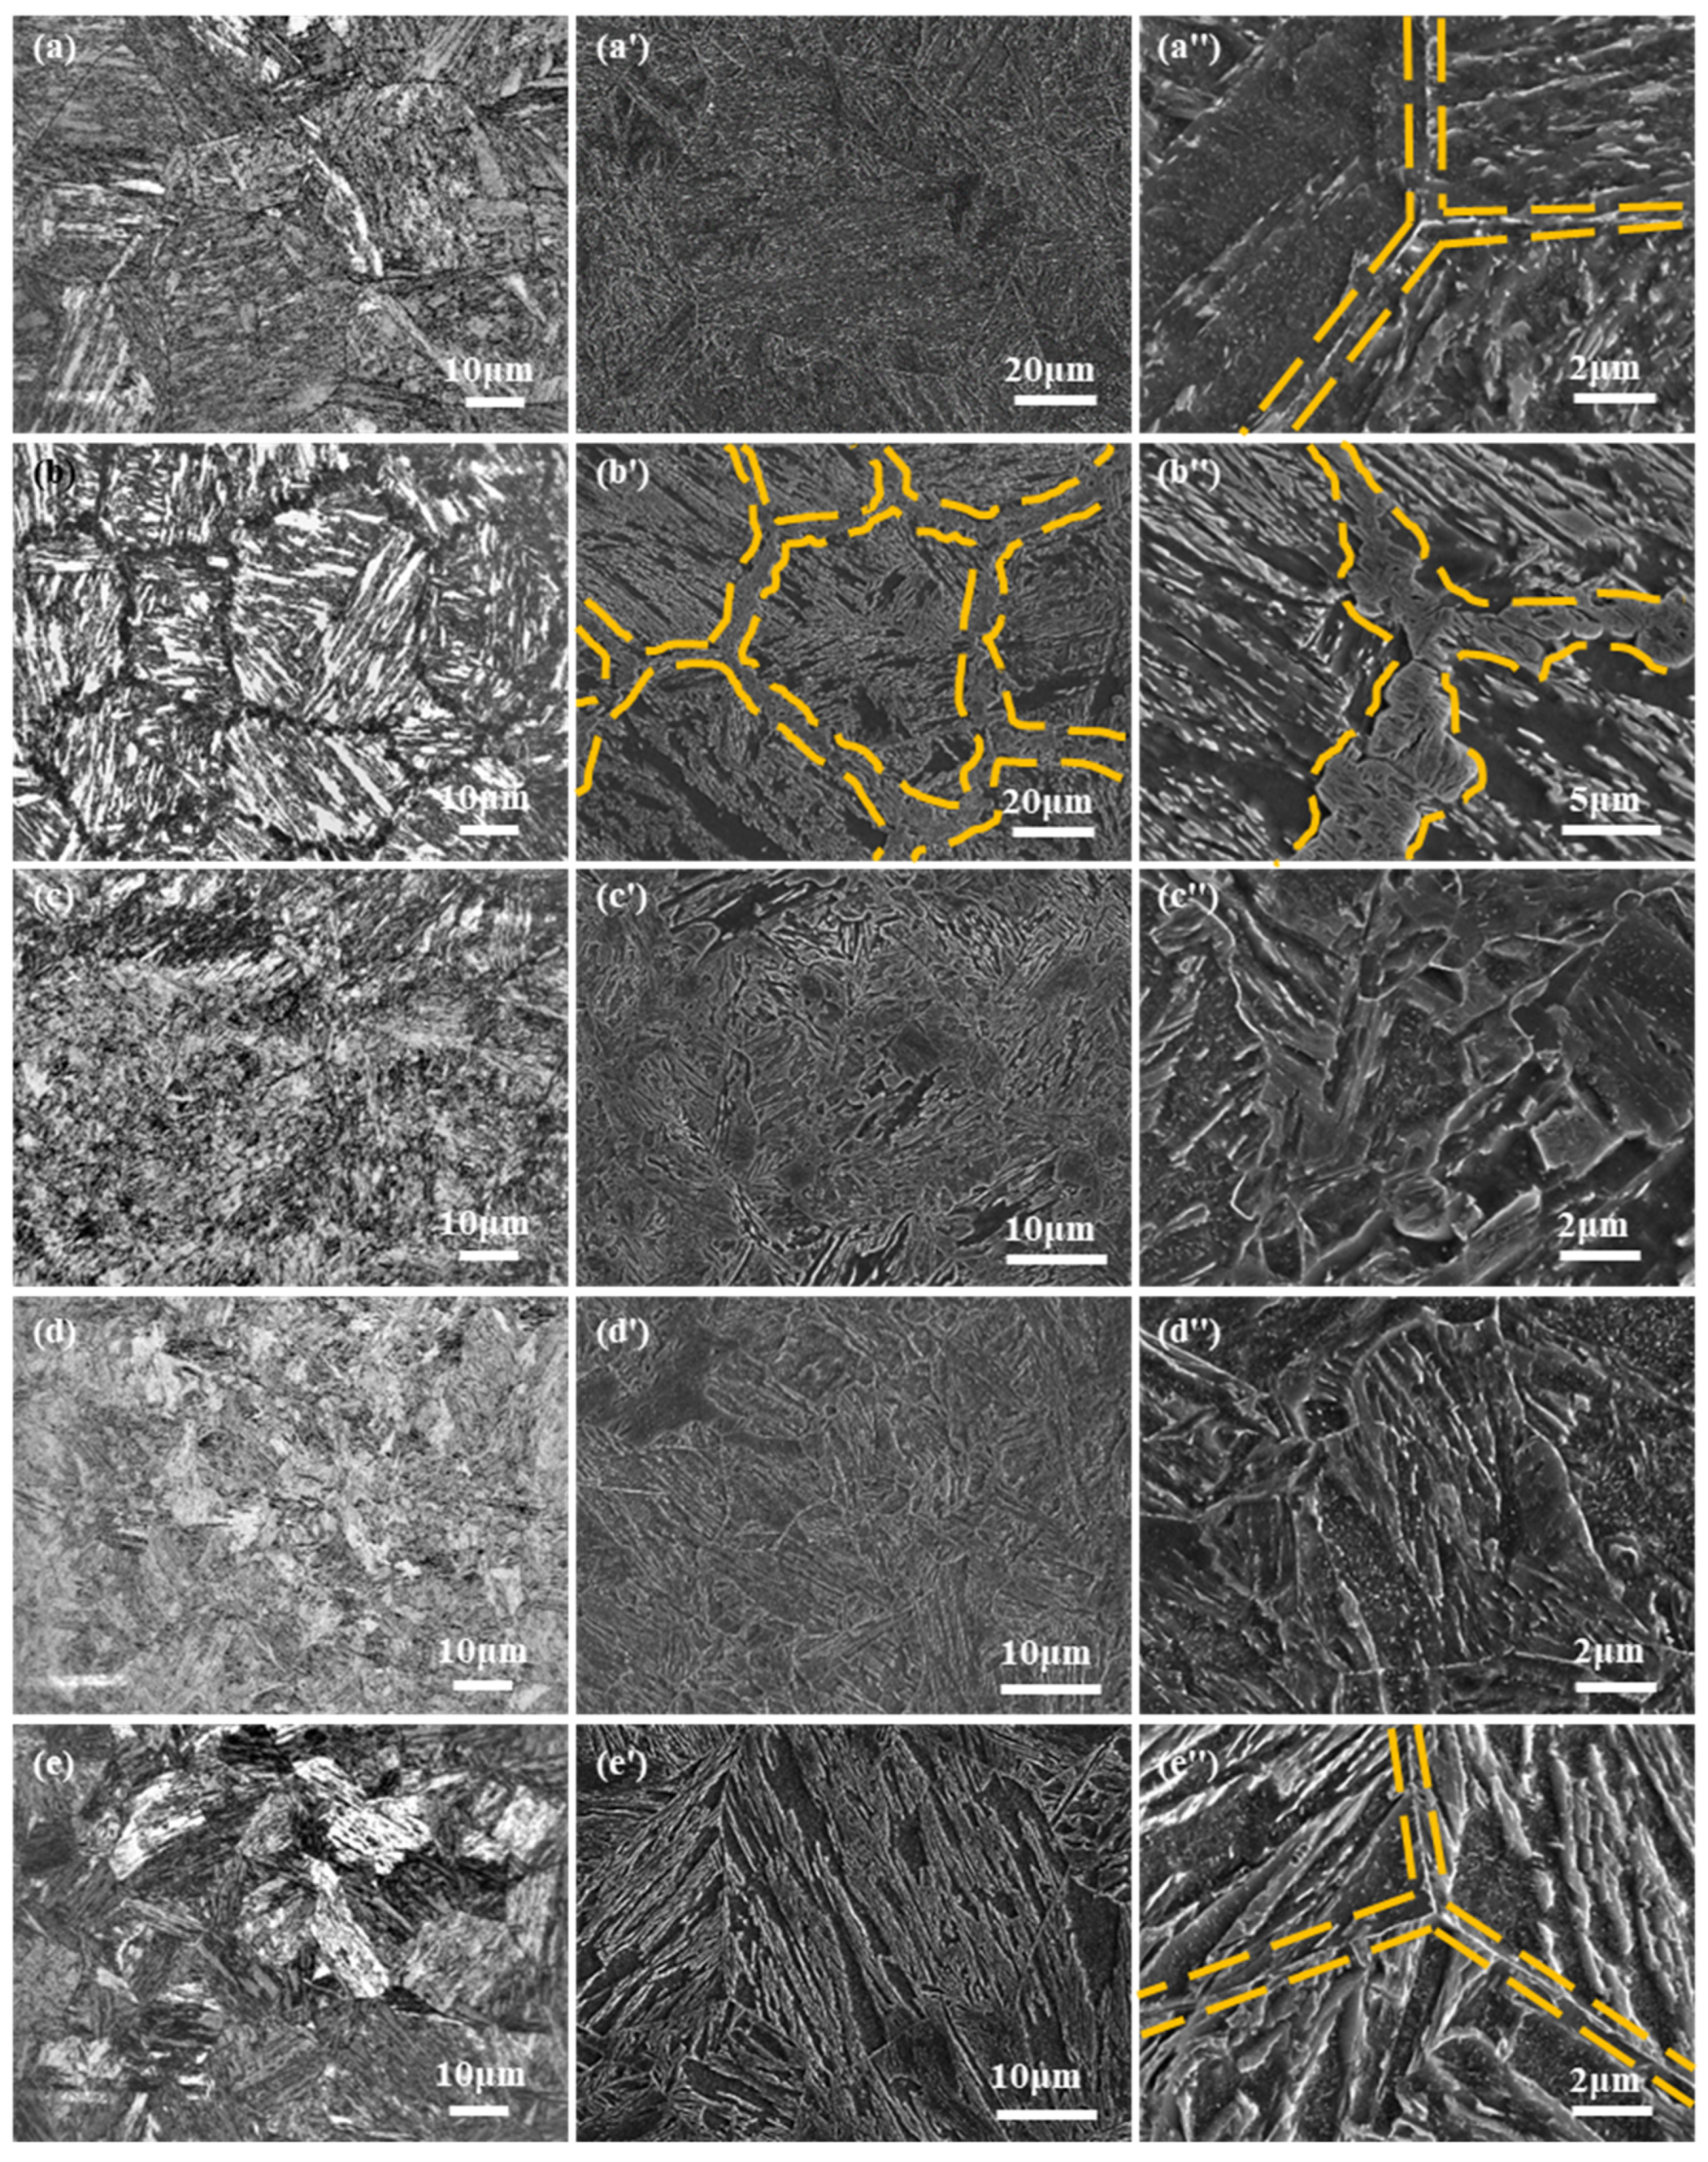
4.1.1. General Characteristics of Microstructures

After thermal cycling at different secondary peak temperatures, the microstructure of the test steel has undergone significant changes, and the type, shape, size, and distribution of the constituent phases of the microstructure are not the same and show certain regular changes, as shown in Figure 8. When the secondary peak temperature is 650 °C, the microstructure is similar to that of the primary thermal cycle at 1300 °C; the microstructure is basically unchanged, the grains are coarse, the grain boundaries are straight, the carbides are evenly distributed, and the M/A is distributed in the strip boundary. The subcritical coarse-grained zone (SCGHAZ) is formed on the basis of a coarse-grained heat-affected zone (CGHAZ) structure after a short “high temperature tempering”. The structure of the SCGHAZ basically maintains the coarse grain characteristics of the CGHAZ.
When the secondary peak temperature rises to 750 °C, the peak temperature of the secondary thermal cycle is between AC1 and AC3, and the coarse-grained zone structure formed by the primary thermal cycle cannot completely undergo austenitic phase transformation; only part of the structure can undergo austenitic phase transformation, and the structure is still dominated by coarse bainite, which is called the critical coarse-grained zone. It can be seen that compared with the subcritical coarse grain region, in addition to maintaining the coarse grain characteristics of the CGHAZ in the critical coarse grain region, M/A is not only distributed among the lath in A thin film but also formed on the protoaustenite grain boundaries in a massive form. A large number of massive M/A on the grain boundaries form a chain structure, and the grain boundary width increases significantly. The peak temperature rises to 850 °C, the grain boundaries become discontinuous, and large blocks of M/A no longer appear.
When the peak temperature is 1000 °C, the over-critical coarse crystal region is reached. In the second thermal cycle, the region is heated to more than AC3, and complete austenitization occurs, but the peak temperature has not reached the temperature of rapid grain growth and coarsening, and the obtained austenite grains are small and granular bainite structures are formed during the cooling process.
With the peak temperature rising to 1200 °C, the cooling rate increased, the grain coarsed, and the lath martensitic structure appeared.

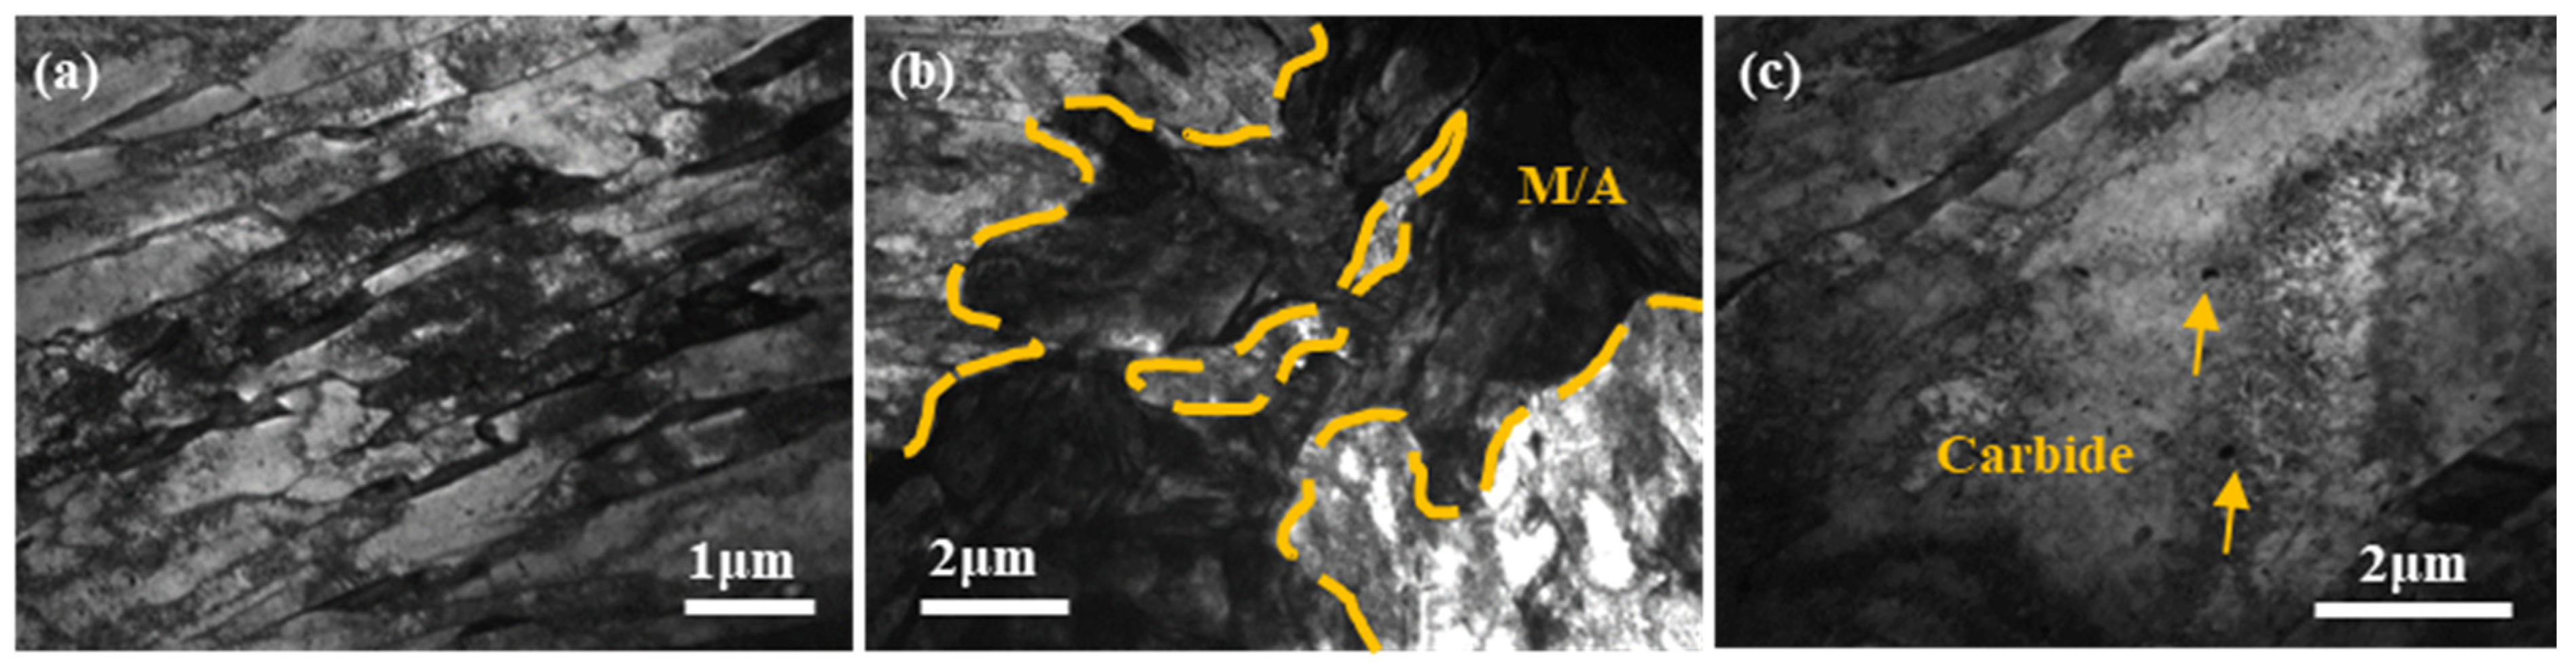
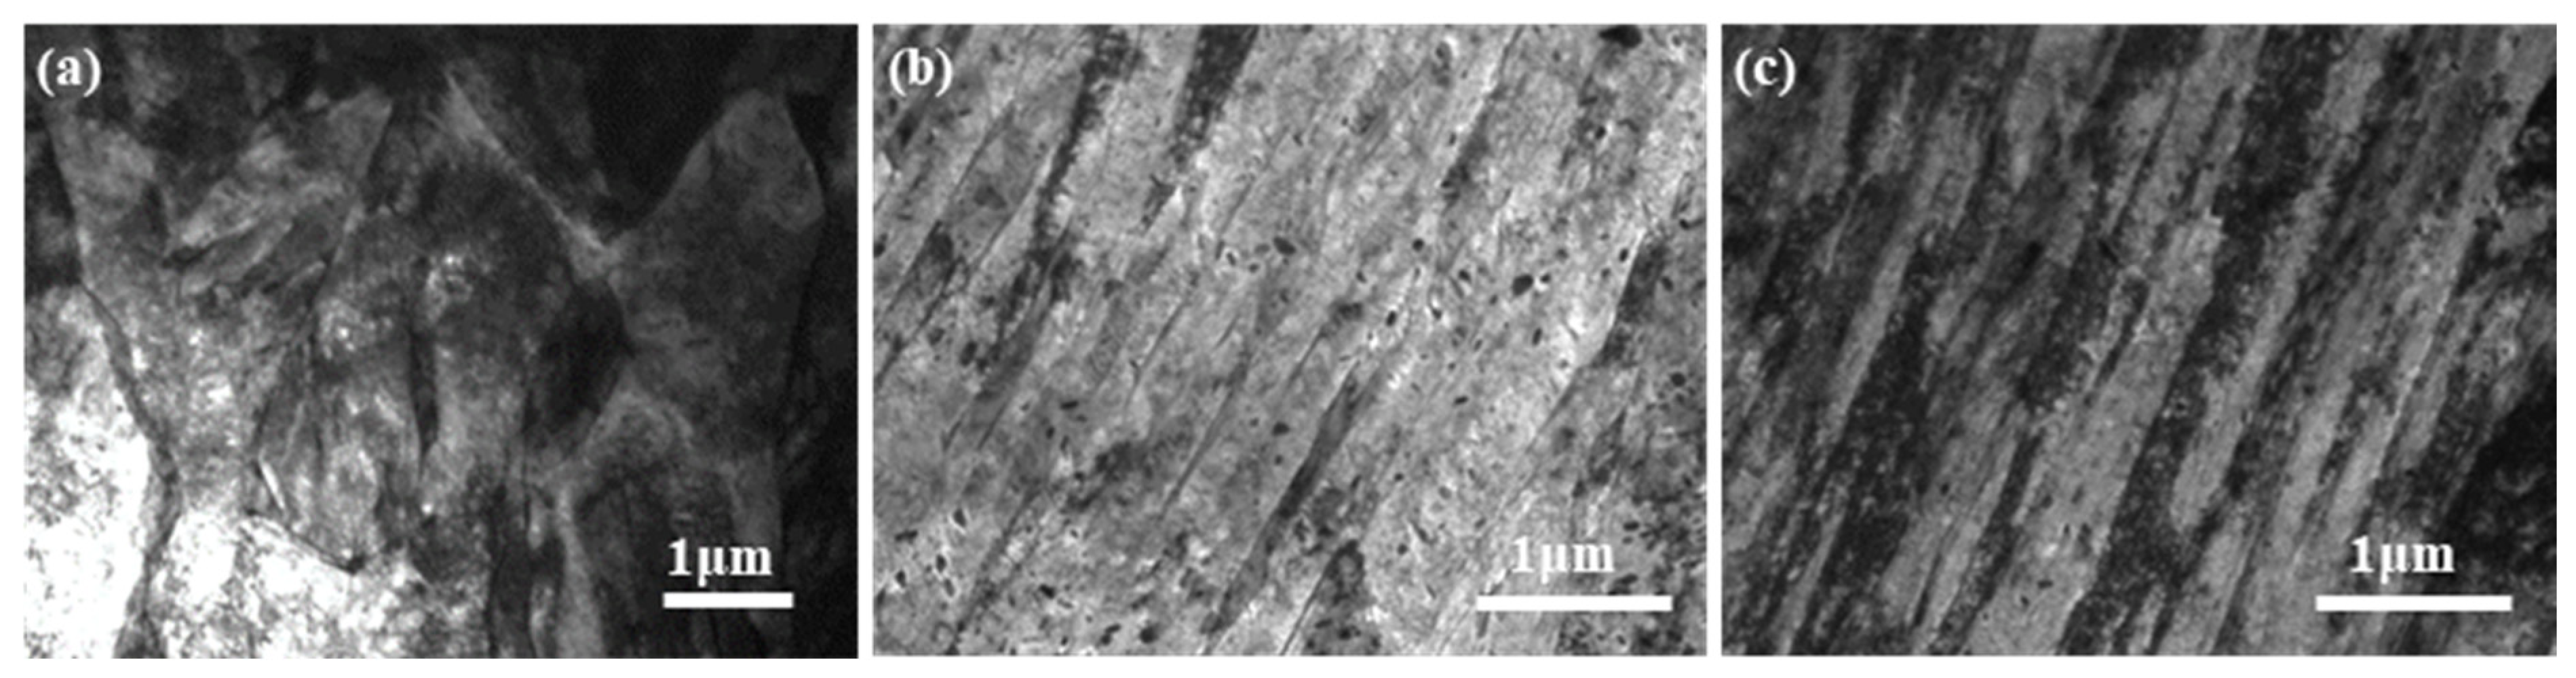
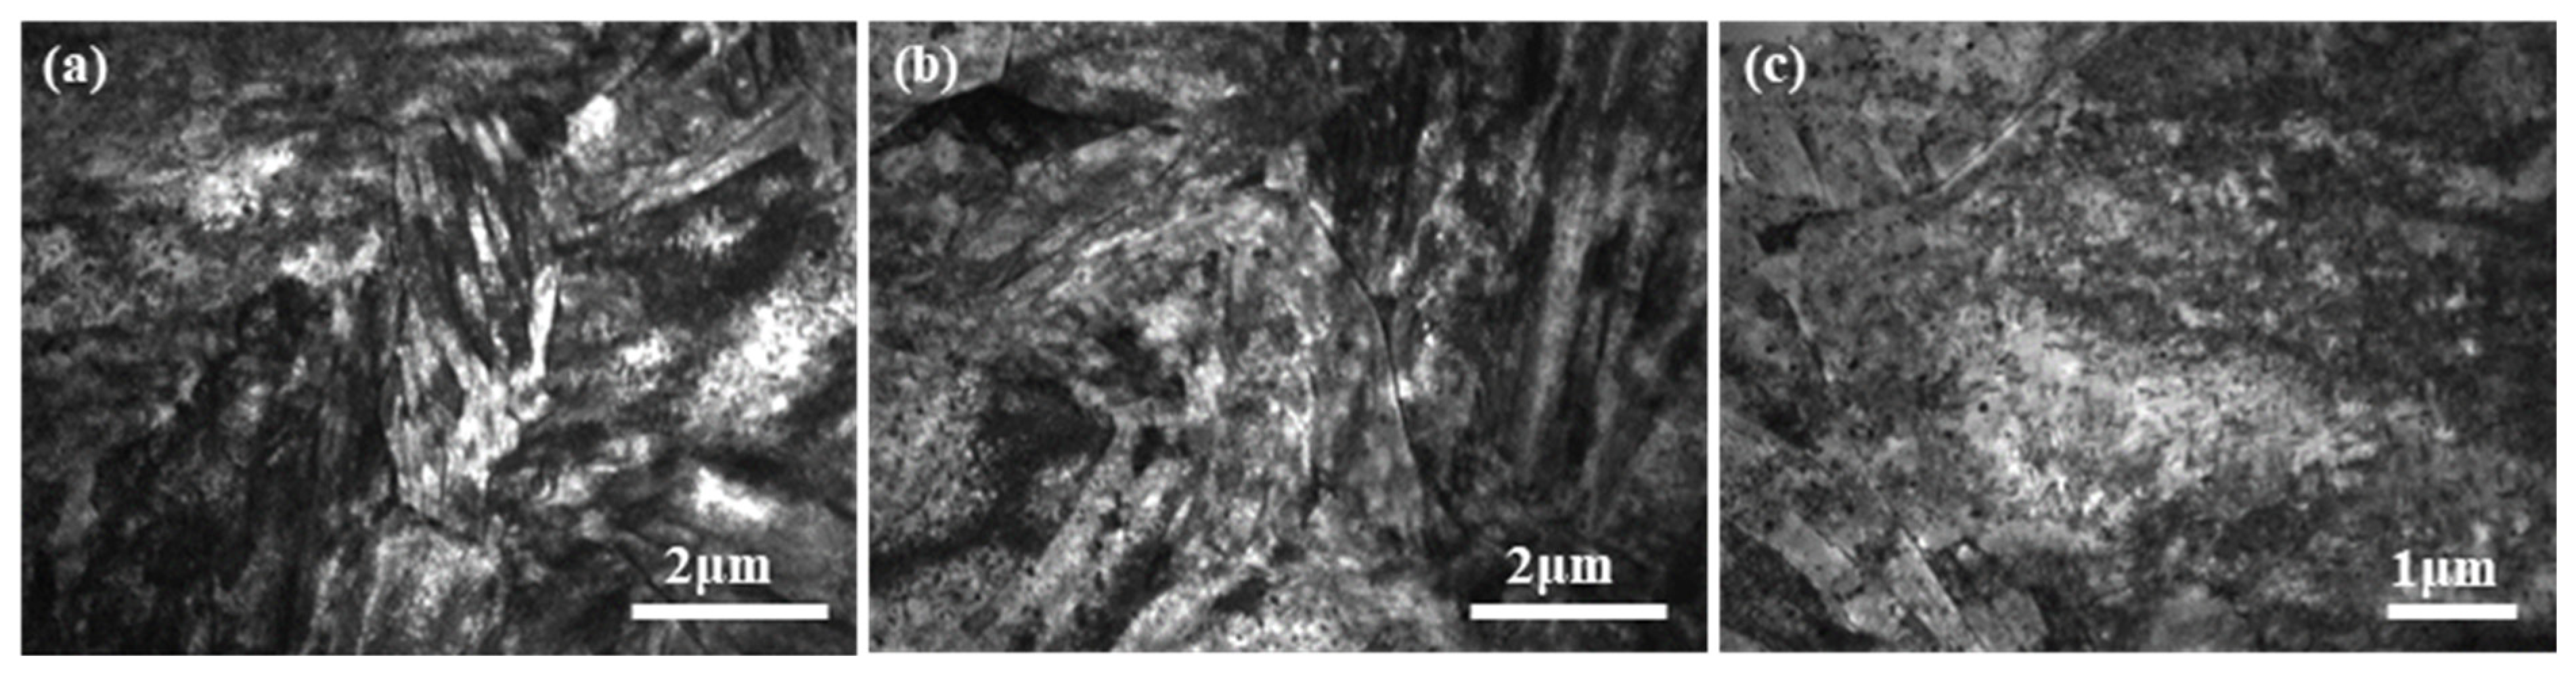
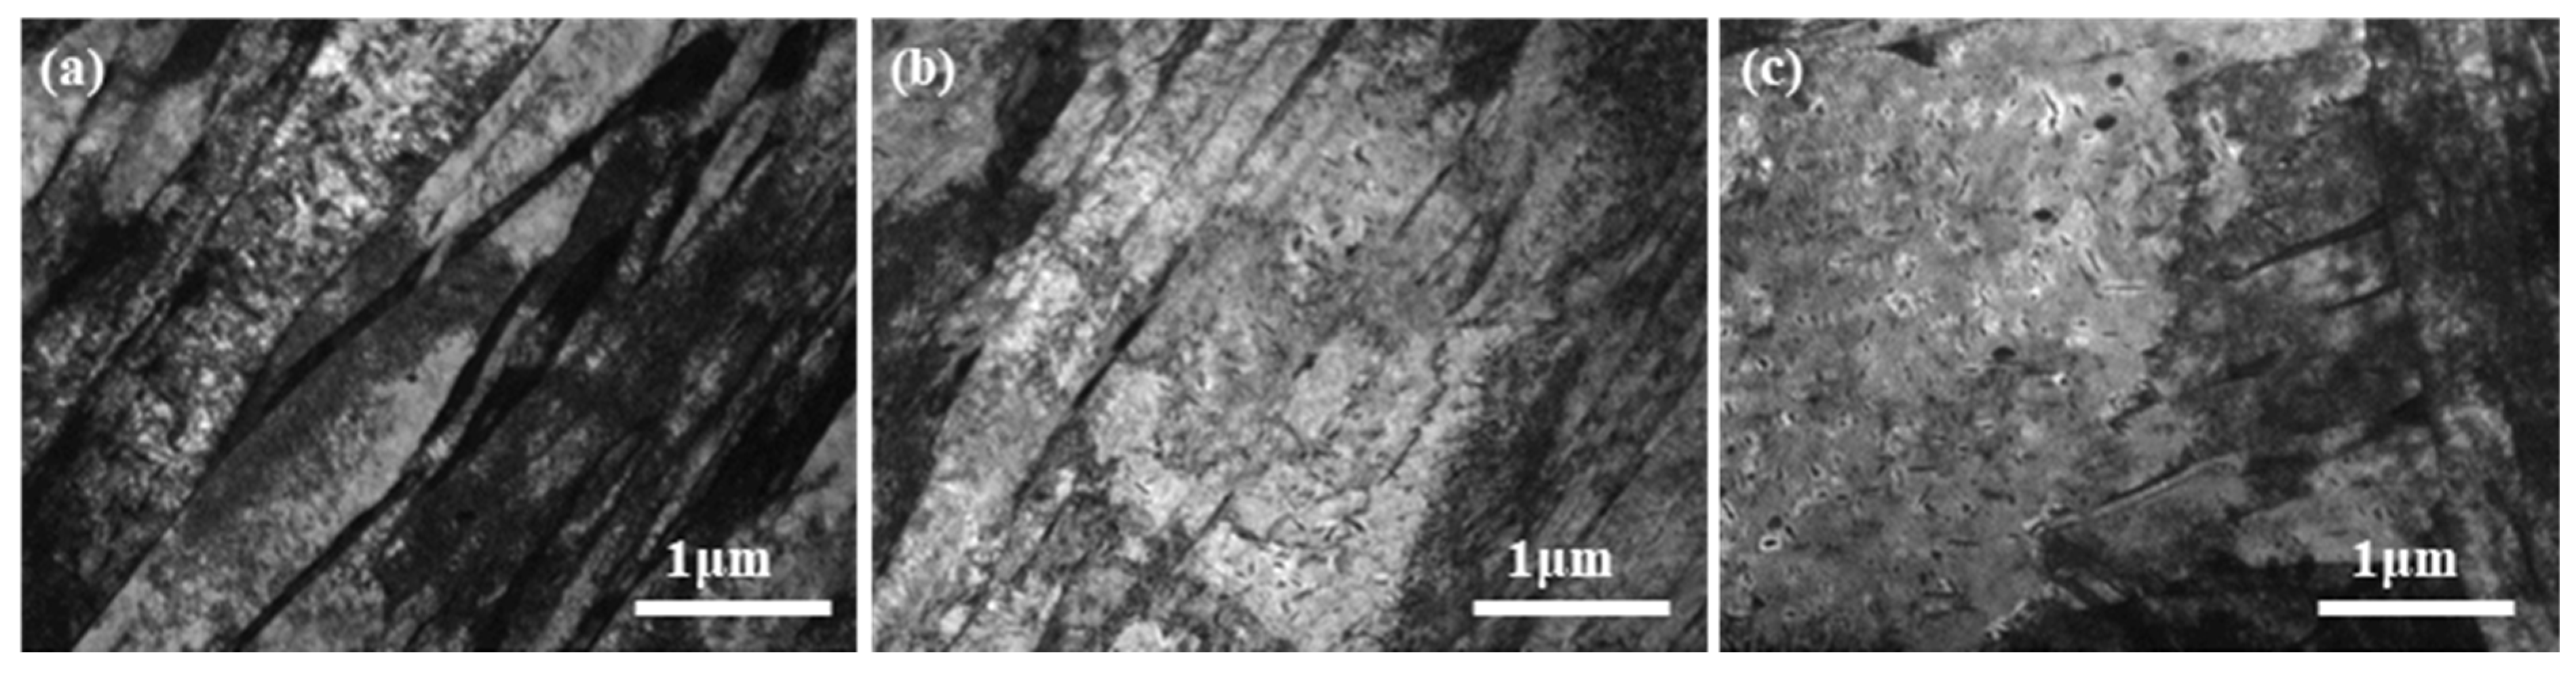
4.1.2. Fine Structure Analysis

Further observations on the fine structure of the tested steel were conducted using transmission electron microscopy, with the results presented in Figure 9, Figure 10, Figure 11, Figure 12 and Figure 13. At 650 °C, the lath bundles were elongated and slender, with widths ranging from approximately 0.5 to 1 μm. The lath boundaries were distinct, and granular M/A phases were distributed along the grain boundaries and lath boundaries. High-density dislocations were visible, accompanied by a relatively large number of carbides. When the peak temperature rose to 750 °C, compared to the subcritical coarse-grained region, the lath widths in the intercritical coarse-grained region increased slightly to about 1 μm, with clear boundaries. The M/A phases on the lath boundaries were distributed in blocky forms, with widths exceeding 5 μm. As the peak temperature continued to rise, partial recrystallization occurred in the steel at 850 °C, resulting in blurred lath edges and smaller grain sizes. When the peak temperature increased to 1000 °C and 1200 °C, the laths exhibited a multi-directional arrangement, with reduced lengths, blurred edges, and smaller grain sizes.

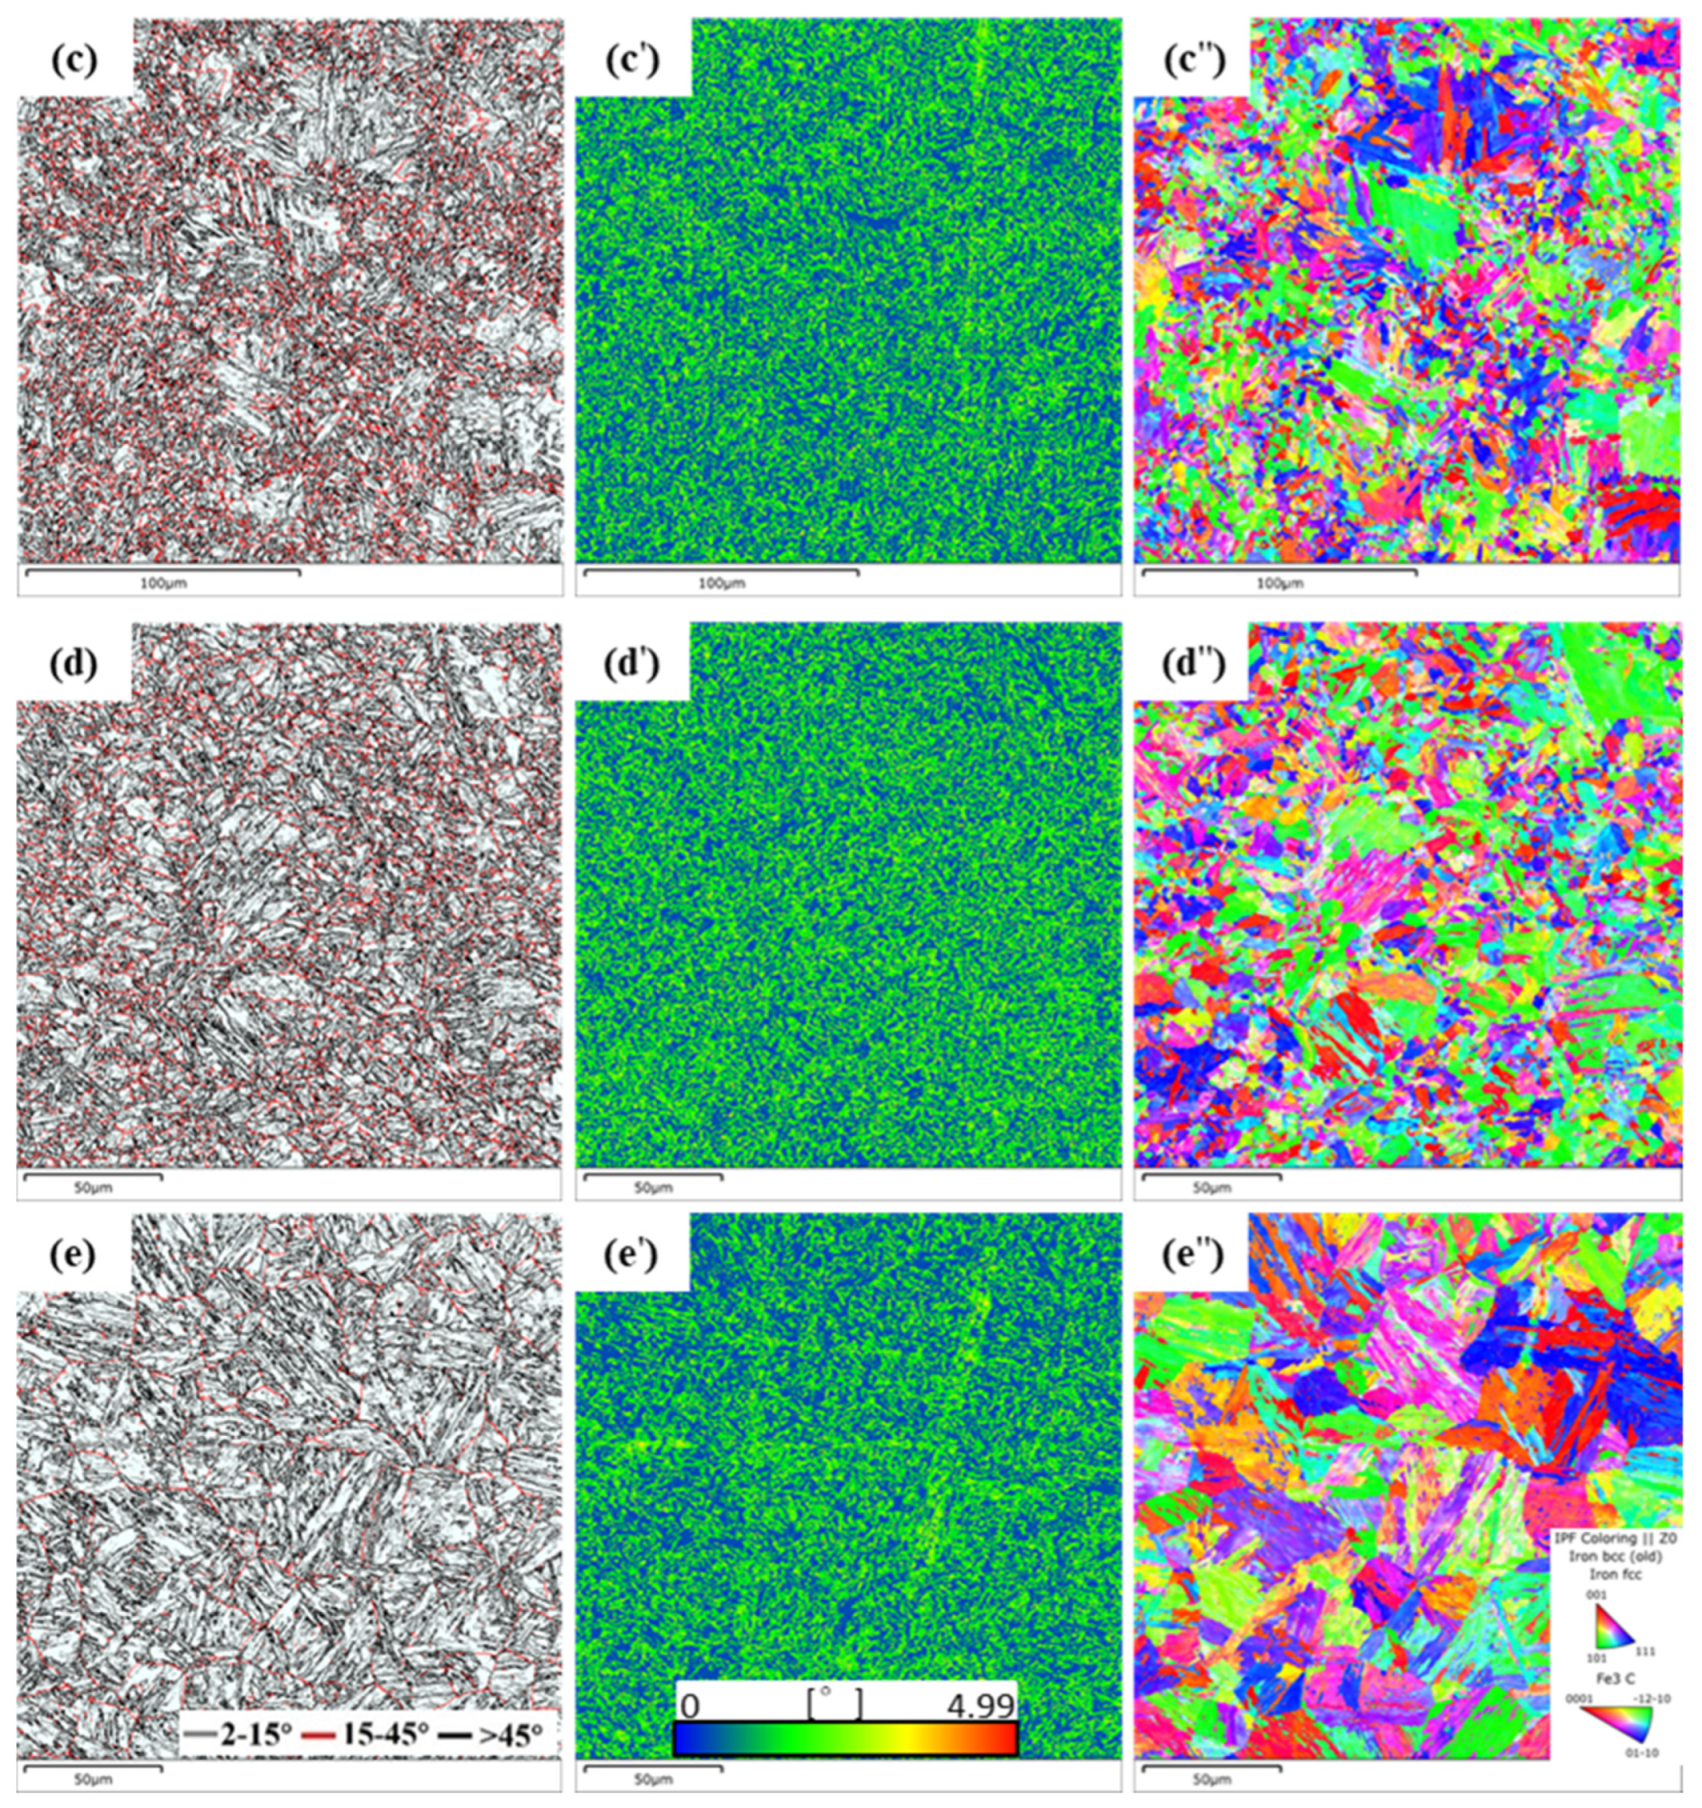
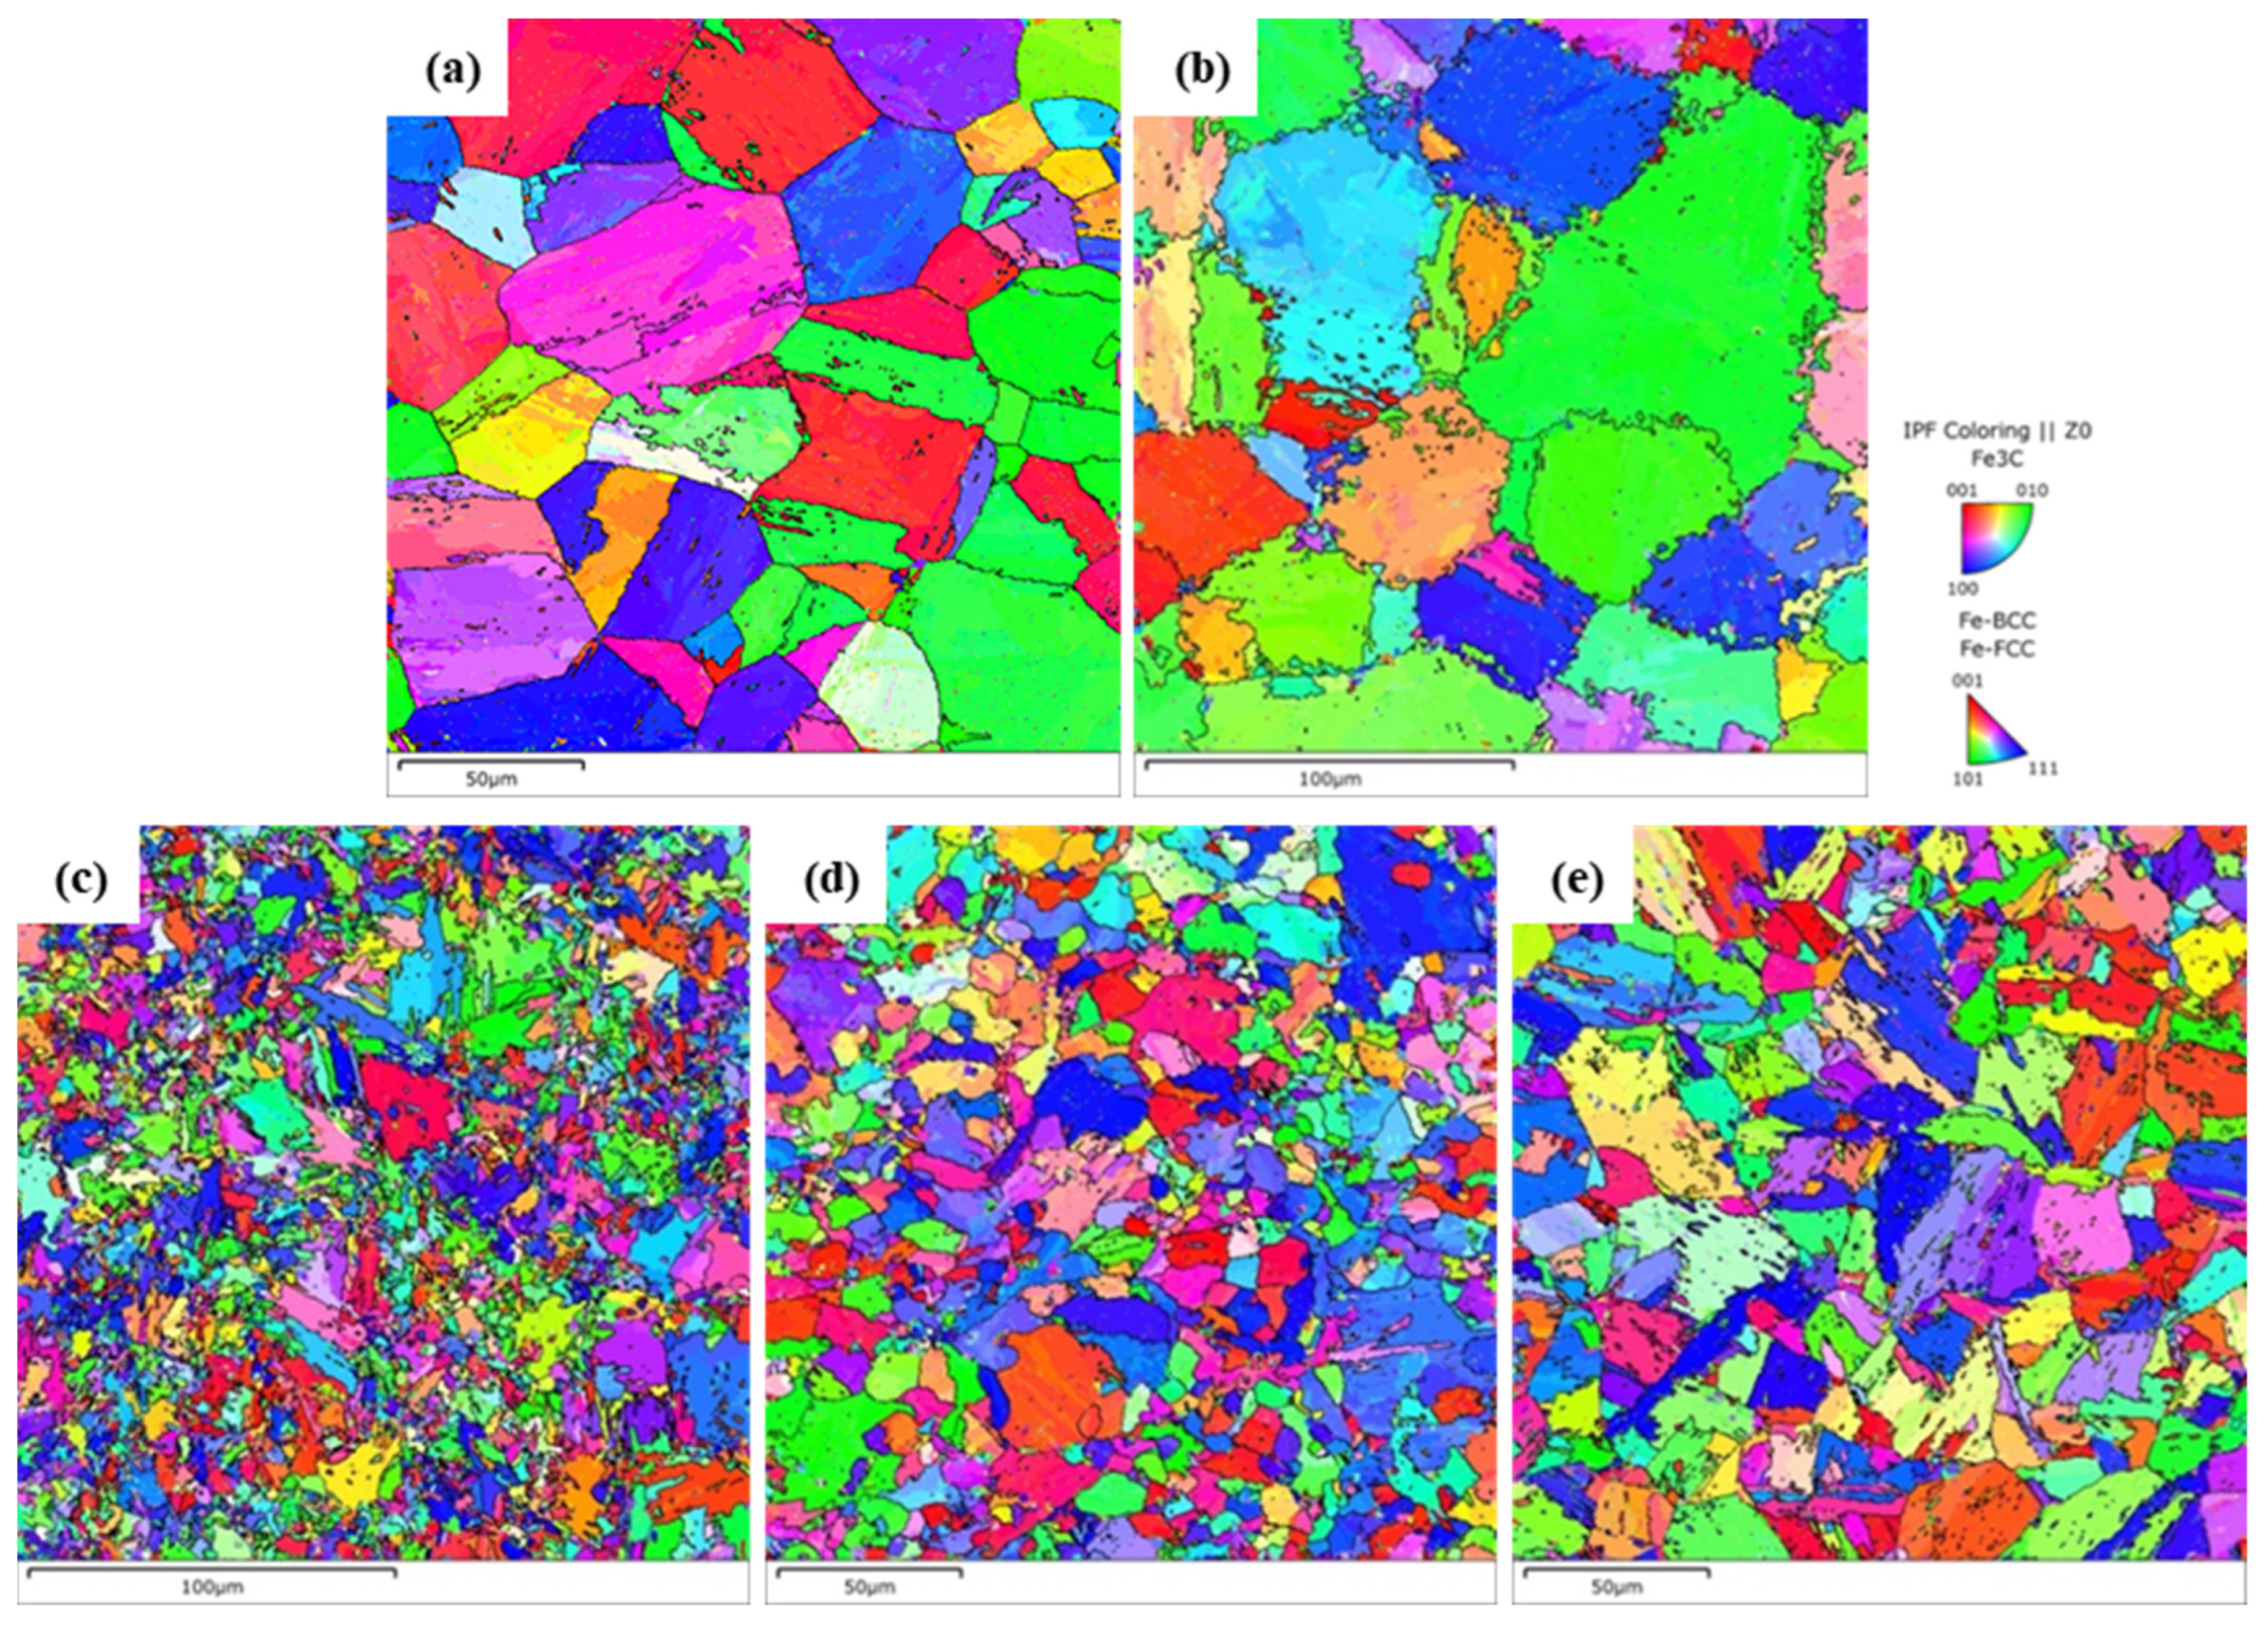
4.1.3. Crystallographic Analysis

Figure 14, Figure 15 and Figure 16 and Table 4 and Table 5 present the EBSD crystallographic analysis and statistical results of the tested steel. In these figures, gray represents misorientations between 2° and 15°, red represents misorientations between 15° and 45°, and black represents misorientations greater than 45°.
In terms of lath morphology, the laths at 650 °C and 750 °C exhibited a well-organized arrangement. As the temperature increased to 850 °C and 1000 °C, the lath length shortened, and their arrangement became more multi-directional. At 1200 °C, the lath length began to increase again.
Regarding grain size, the grain sizes at 650 °C, 750 °C, 850 °C, and 1000 °C were 16.43 μm, 16.83 μm, 6.53 μm, and 6.9 μm, respectively. It can be observed that with the occurrence of recovery and recrystallization, the grain size continued to decrease. When the peak temperature rose to 1200 °C, the grain size increased again to 14.05 μm, which was similar to that in the primary coarse-grained region. Overall, there was a trend of decreasing first and then increasing. For the proportions of grain boundaries with misorientations above 15° and 45°, they both showed a trend of first increasing and then decreasing at the five peak temperatures, with the highest proportions occurring at 850 °C, which was consistent with the smallest grain size at this temperature.
To investigate the effect of secondary peak temperature on the size of the original austenitic grains, the K-S (Kurdjumov–Sachs) relationship was employed to reconstruct the parent phase grains from the EBSD data, with the results shown in Figure 15. The results indicate that as the heat input increases, the reconstructed grain sizes are 36.89 μm, 47.22 μm, 7.64 μm, 14.05 μm, and 17.38 μm, respectively, exhibiting a trend of first decreasing and then increasing, with the smallest size occurring at 850 °C.

4.1.4. Analysis and Discussion

At a secondary peak temperature of 650 °C, the microstructure resembles the coarse-grained heat-affected zone (CGHAZ) formed during the primary thermal cycle, referred to as the subcritical coarse-grained heat-affected zone (SCGHAZ). The SCGHAZ forms on the basis of the CGHAZ microstructure after a brief “high-temperature tempering” process. The microstructure of the SCGHAZ largely retains the coarse grain characteristics of the CGHAZ. When the secondary peak temperature in the heat-affected zone (HAZ) of the weld is 650 °C, the impact energy is 60.5 ± 6.5 J, which is 50% lower than that of the base metal. When the secondary peak temperature rises to 750 °C, which falls between AC1 and AC3, the microstructure of the CGHAZ formed during the primary thermal cycle cannot fully undergo an austenitic transformation; only part of the microstructure undergoes an austenitic transformation. At this point, the microstructure is still dominated by coarse bainite, known as the intercritical coarse-grained heat-affected zone (ICGHAZ). At 750 °C, it is in the critical coarse-grained region with an impact energy absorption of 33.7 ± 4.8 J, representing a 73% reduction compared to the base metal. At a peak temperature of 1000 °C, the material enters the supercritical coarse-grained heat-affected zone (SCGHAZ), where it is heated above AC3 during the second thermal cycle, leading to complete austenitization. When the peak temperatures are 850 °C and 1000 °C, the impact energies are 117.5 ± 5.4 J and 120.65 ± 8.5 J, respectively, which are basically consistent with those of the base metal. As the peak temperature rises to 1200 °C, there is a significant increase in temperature, resulting in grain coarsening. In the HAZ of the test steel, the material can still maintain good toughness when the secondary peak temperatures are 850 °C and 1000 °C.
From the results of impact testing and the analysis of thermally simulated microstructures, it can be seen that the impact toughness is the lowest in the ICGHAZ. Numerous studies [16,34,35,36,37] have shown that impact toughness is related to the microstructure of the material, influenced by the morphology, distribution, and size of M/A constituents, the proportion of high-angle grain boundaries, and the number of second-phase particles.
The formation process of the α phase within the (α + γ) intercritical zone involves the expulsion of carbon outwards, resulting in the residual γ phase having a higher carbon content compared to the γ phase formed in the high-temperature single-phase γ region. This carbon-rich γ phase subsequently forms coarse, carbon-rich M/A constituents during the subsequent cooling process [34,35]. The chain-like M/A constituents formed at grain boundaries are large in size and rich in carbon, with a hardness significantly higher than the matrix. When subjected to external forces, stress concentration occurs at the M/A constituents, leading to grain boundary embrittlement and the deterioration of toughness in the intercritical coarse-grained heat-affected zone (ICGHAZ). The ICGHAZ formed after the secondary welding thermal cycle is generally recognized as a brittle zone. C.L. Davis et al. summarized four fracture mechanisms associated with M-A constituents, among which the second and third mechanisms are related to the continuous distribution of M-A [14,19]. When M-A constituents are closely spaced, the residual stresses generated during phase transformation overlap, and the stress fields during deformation also overlap, leading to significant stress concentration, which promotes the nucleation and unstable propagation of brittle cracks [17,38,39]. In this thesis, the tested steel exhibited a continuous distribution of M/A constituents with a certain width at grain boundaries at 750 °C. The individual M/A constituents, connected into chains, were longer and exhibited a short rod-like shape rather than a blocky shape, significantly affecting impact toughness. Therefore, although both the subcritical coarse-grained heat-affected zone (SCGHAZ) and the ICGHAZ have coarse grain structures, there is a significant difference in impact toughness between them.

5. Conclusions

(1) When the secondary peak temperature is 650 °C, the microstructure is similar to that of the tissue subjected to a primary thermal cycle at 1300 °C, characterized by coarse grains and straight grain boundaries. At 750 °C, a large number of bulky M/A constituents form chain-like structures at the grain boundaries, significantly increasing the grain boundary width. At 850 °C, the grain boundaries become discontinuous, and large bulky M/A constituents no longer appear. At 1000 °C, the austenitic grains are smaller, forming granular bainite during cooling. At 1200 °C, due to the significant increase in peak temperature, grain coarsening occurs. Meanwhile, with the increased cooling rate, the steel exhibits a lath martensite structure.
(2) When the secondary peak temperature is 850 °C and 1000 °C, the toughness is better, and the fracture surface exhibits features of plastic deformation, macroscopically appearing as ductile fractures. The fibrous zone, radial zone, and shear lip are all composed of dimples of varying sizes, with similar dimple diameters, depths, and surrounding plastic deformation patterns. At 650 °C, 750 °C, and 1200 °C, the fracture surfaces are flat and macroscopically exhibit brittle fracture characteristics. Microscopically, they all show quasi-cleavage fracture features, with visible “cleavage-like” facets, micropores, and tear ridges.
(3) The individual M/A constituents connected into chains at grain boundaries are larger in length and exhibit a short rod-like shape rather than a bulky shape, significantly affecting the impact toughness and being the main reason for the deterioration of toughness in the intercritical coarse-grained heat-affected zone.

Author Contributions

Conceptualization, Y.L. (Yuwei Li) and Y.L. (Yuanbo Li); methodology, Y.L. (Yuwei Li), Y.L. (Yuanbo Li), and J.C.; validation, Y.L. (Yuwei Li) and Y.L. (Yuanbo Li); data curation, Y.L. (Yuwei Li); formal analysis, Y.L. (Yuwei Li) and J.C.; investigation, Y.L. (Yuwei Li); supervision, Y.L. (Yuanbo Li); writing—original draft, Y.L. (Yuwei Li); writing—review and editing, Y.L. (Yuanbo Li) and J.C. All authors have read and agreed to the published version of the manuscript.

Funding

This research received no external funding.

Data Availability Statement

The data presented in this study are available on request from the corresponding author, The data are not publicly available due to privacy.

Acknowledgments

All authors thank the cooperative units and individuals who provided the hydropower 1000 MPa high-strength steel for this study.

Conflicts of Interest

The authors declare no conflicts of interest.

References

  1. Lulu, F.; Dong, Z.; Kaiming, W.; Weiwen, Q. Study on Microstructure and properties of 1000MPa grade steel plate for hydropower station. J. Phys. Conf. Ser. 2020, 1637, 012072. [Google Scholar]
  2. Li, C.; Chen, J.; Tu, X.; Han, Y. Effect of finish rolling temperature on microstructures and mechanical properties of 1000 MPa grade tempered steel plate for hydropower station. J. Manuf. Process. 2021, 67, 1–11. [Google Scholar] [CrossRef]
  3. Chen, J.; Li, S.; Chen, L.; Fang, L.; Huo, S. Controlling of reheated quenching temperature of 1000 MPa grade steel plate for hydropower station. Mater. Werkst. 2019, 50, 33–43. [Google Scholar] [CrossRef]
  4. Steimbreger, C.; Gubeljak, N.; Vuherer, T. Effect of welding processes on the fatigue behaviour of ultra-high strength steel butt-welded joints. Eng. Fract. Mech. 2022, 275, 108845. [Google Scholar] [CrossRef]
  5. Satish, S.; Sachin, M. A review on welding of high strength oil and gas pipeline steels. J. Nat. Gas Sci. Eng. 2017, 38, 203–217. [Google Scholar]
  6. Yang, Z.; Di, X.; Xing, Y.; Liu, Y.; Hu, W.; Li, C. Control strategy of reducing hydrogen enrichment in heat-affected zone during welding for ultra-high strength steels. Int. Commun. Heat Mass Transf. 2024, 159, 108228. [Google Scholar] [CrossRef]
  7. Chène, O. Welding processes for the cleuson-dixence shaft. In Proceedings of the Conference on High Strength Steels for Hydropower Plants, Takasaki, Japan, 20 July 2009. [Google Scholar]
  8. Leakage Investigations at Cleuson-Dixence. Available online: https://www.waterpowermagazine.com/features/featureleakage-investigations-at-cleuson-dixence (accessed on 10 November 2024).
  9. Hailong, C.; Xinchun, L.; Xin, W. Recent research progress on additive manufacturing of high-strength low-alloy steels: Focusing on the processing parameters, microstructures and properties. Mater. Today Commun. 2023, 36, 106616. [Google Scholar]
  10. Shang, J.; Wang, X.; Liu, Y.; Fu, Y. Proceedings of the International Seminar on Welding of High Strength Pipeline Steel; Gray, J.M., Ed.; TMS: Araxa, Brazil, 2011; p. 435. [Google Scholar]
  11. Bai, Y.; Bai, L.; Qian, G.; Sun, X.; Liu, G.; Xie, Z.; Shang, C. Crystallographic Study of Transformation Products of Heat-Affected Zone and Correlation with Properties of FH690 Heavy-Gauge Marine Steel by Multi-Pass Submerged Arc Welding. Metals 2024, 14, 1122. [Google Scholar] [CrossRef]
  12. Shang, J.; Li, D.; Nie, J.; Wu, J. Proceedings of Recent Developments in High Strength Steels for Energy Appli Cations; Deardo, A., Ed.; MS&T: Pittsburgh, PA, USA, 2012; p. 892. [Google Scholar]
  13. Wang, Z.; Wang, X.; Shang, C. Effect of Pre-Weld Heat Treatment on the Microstructure and Properties of Coarse-Grained Heat-Affected Zone of a Wind Power Steel after Simulated Welding. Metals 2024, 14, 587. [Google Scholar] [CrossRef]
  14. Sun, Q.; Li, W.; Li, T.; Gao, Q.; Wang, C.; Zhang, X. Significant influence of heat input on microstructure evolution and mechanical properties of the simulated CGHAZ in a 1000 MPa grade ultra-high strength steel. Mater. Technol. 2024, 39, 2335426. [Google Scholar] [CrossRef]
  15. Midawi, A.R.H.; Sherepenko, O.; Ramachandran, D.C.; Akbarian, S.; Shojaee, M.; Zhang, T.; Ghassemi-Armaki, H.; Worswick, M.; Biro, E. Prediction of Mechanical Properties in the Sub-Critical Heat Affected Zone of AHSS Spot Welds Using Gleeble Thermal Simulator and Hollomon-Jaffe Model. Metals 2023, 13, 1822. [Google Scholar] [CrossRef]
  16. Xueda, L.; Chengjia, S.; Changchai, H.; Yuran, F.; Jianbo, S. Influence of necklace-type M-A constituent on impact toughness and fracturemechanism in the heat affected zone of X100 pipeline steel. Acta Metall. Sin. 2016, 52, 1025–1035. [Google Scholar]
  17. Davis, L.; King, E. Cleavage initiation in the intercritically reheated coarse-grained heat-affected zone: Part I. Fractographic evidence. Metall. Mater. Trans. A 1994, 25, 563–573. [Google Scholar] [CrossRef]
  18. Mohseni, P.; Solberg, K.; Karlsen, M.; Akselsen, O.M.; Østby, E. Cleavage fracture initiation at M–A constituents in intercritically Coarse-Grained Heat-Affected Zone of a HSLA steel. Metall. Mater. Trans. A 2014, 45, 384–394. [Google Scholar] [CrossRef]
  19. Li, Y.; Baker, T. Effect of morphology of martensite–austenite phase on fracture of weld heat affected zone in vanadium and niobium microalloyed steels. Mater. Sci. Technol. 2010, 26, 1029–1040. [Google Scholar] [CrossRef]
  20. Chen, J.; Kikuta, Y.; Araki, T.; Yoneda, M.; Matsuda, Y. Micro-fracture behaviour induced by M-A constituent (Island Martensite) in simulated welding heat affected zone of HT80 high strength low alloyed steel. Acta Metall. 1984, 32, 1779–1788. [Google Scholar] [CrossRef]
  21. Sungtak, L.; Byung, C.K.; Dongil, K. Correlation of microstructure and fracture propeties in weld heat-affected zones of themo-mechanically controlled processed steels. Metall. Mater. Trans. A 1992, 23, 2803–2816. [Google Scholar]
  22. Davis, L.; King, E. Cleavage initiation in the intercritically reheated coarse-grained heat-affected zone: Part II. Failure criteria and statistical effects. Metall. Mater. Trans. A 1996, 27, 3019–3029. [Google Scholar] [CrossRef]
  23. Terada, Y.; Shinohara, Y. High strength linepipe with excellent HAZ toughness and deformability. In Seminar Forum of the X100/X120 Grade High Performance Pipe Steels; Petroleum Industry Press: Beijing, China, 2005; pp. 313–323. [Google Scholar]
  24. Xueda, L.; Chunyu, L.; Ning, C.; Xueqiang, L.; Jianbo, S. Crystallography of Reverted Austenite in the Intercritically Reheated Coarse-Grained Heat-Affected Zone of High Strength Pipeline Steel. Acta Metall. Sin. 2021, 57, 967–976. [Google Scholar]
  25. Veronica, H.; Bjørn, R.; Sørås, R.; Odd, A.; Christian, T.; Erling Østby. Local mechanical properties of intercritically reheated coarse grained heat affected zone in low alloy steel. Mater. Des. 2014, 59, 135–140. [Google Scholar]
  26. Cui, J.; Zhu, W.; Chen, Z.; Chen, L. Microstructural characteristics and impact fracture behaviors of a novel High-Strength Low-Carbon Bainitic Steel with different reheated Coarse-Grained Heat-Affected Zones. Metall. Mater. Trans. A 2020, 51, 6258–6268. [Google Scholar] [CrossRef]
  27. Lambert, A.; Drillet, J.; Gourgues, A.; Sturel, T.; Pineau, A. Microstructure of martensite–austenite constituents in heat affected zones of high strength low alloy steel welds in relation to toughness properties. Sci. Technol. Weld. Join. 2000, 5, 168–173. [Google Scholar] [CrossRef]
  28. You, Y.; Shangjia, J.; Wenjin, N.; Subramanian, S. Investigation on the microstructure and toughness of coarse grained heat affected zone in X-100 multi-phase pipeline steel with high Nb content. Mater. Sci. Eng. A 2012, 558, 692–701. [Google Scholar] [CrossRef]
  29. Cong, J.; Gao, J.; Zhou, S.; Wang, J.; Wang, N.; Lin, F. Thermodynamic coupling numerical simulation and mechanical properties analysis of TC4 laser welding. Trans. China Weld. Inst. 2024, 45, 77–88+96. [Google Scholar]
  30. Wang, C.; Han, S.; Xie, F.; Hu, L.; Deng, D. Influence of Solid-State Phase Transformation and Softening Effect on Welding Residual Stress of Ultra-High Strength Steel. Acta Metall. Sin. 2023, 59, 1613–1623. [Google Scholar]
  31. Hu, L.; Wang, Y.; Li, S.; Zhang, C.; Deng, D. Study on Computational Prediction About Microstructure and Hardness of Q345 Steel Welded Joint Based on SH-CCT Diagram. Acta Metall. Sin. 2021, 57, 1073–1086. [Google Scholar]
  32. Zhou, J.; Ma, J.; Lu, X.; Zhu, X.; Wang, J. Numerical simulation and mechanical properties of spray-assisted friction stir welding RAFM steel. Trans. China Weld. Inst. 2022, 43, 104–112+120. [Google Scholar]
  33. ISO 148-1:2016; Metallic Materials—Charpy Pendulum Impact Test—Part 1: Test Method. ISO: Geneva, Switzerland, 2016.
  34. Li, X.; Ma, X.; Subramanian, S.; Shang, C.; Misra, R. Influence of prior austenite grain size on martensite–austenite constituent and toughness in the heat affected zone of 700MPa high strength linepipe steel. Mater. Sci. Eng. A 2014, 616, 141–147. [Google Scholar] [CrossRef]
  35. You, Y.; Shang, C.; Chen, L.; Subramanian, S. Investigation on the crystallography of the transformation products of reverted austenite in intercritically reheated coarse grained heat affected zone. Mater. Des. 2013, 43, 485–491. [Google Scholar] [CrossRef]
  36. Bouyne, E.; Flower, H.; Lindley, T.; Pineau, A. Use of EBSD technique to examine microstructure and cracking in a bainitic steel. Scr. Mater. 1998, 39, 295–300. [Google Scholar] [CrossRef]
  37. Guo, A.; Misra, R.; Liu, J.; Chen, L.; He, X.; Jansto, S.J. An analysis of the microstructure of the heat-affected zone of an ultra-low carbon and niobium-bearing acicular ferrite steel using EBSD and its relationship to mechanical properties. Mater. Sci. Eng. A 2010, 527, 6440–6448. [Google Scholar] [CrossRef]
  38. André, P. Development of the Local Approach to Fracture over the Past 25 years: Theory and Applications. Int. J. Fract. 2006, 138, 139–166. [Google Scholar]
  39. Thompson, A.; Knott, J. Micromechanisms of brittle fracture. Metall. Trans. A 1993, 24, 523–534. [Google Scholar] [CrossRef]
Figure 1. The schematic of the sample orientation.
Metals 14 01455 g001
Figure 2. Thermal simulation curves at different secondary peak temperatures.
Metals 14 01455 g002
Figure 3. Microstructure of the base material: (a) OM; (b) SEM; (c) TEM.
Metals 14 01455 g003
Figure 4. The Fm values of the test steel at −40 °C under different secondary thermal cycle peak temperatures.
Metals 14 01455 g004
Figure 5. The impact absorption energy of the test steel at −40 °C under different secondary thermal cycle peak temperatures.
Metals 14 01455 g005
Figure 6. The load–displacement curves of the test steel at −40 °C under different secondary thermal cycle peak temperatures.
Metals 14 01455 g006
Figure 7. Impact fracture morphology of test steel at different peak temperatures of one thermal cycle: (a) 650 °C; (b) 750 °C; (c) 850 °C; (d) 1000 °C; (e) 1200 °C.
Metals 14 01455 g007
Figure 8. OM and SEM microstructure of steel at different peak temperatures of secondary thermal cycles: (a,a’,a”): 650 °C; (b,b’,b”): 750 °C; (c,c’,c”): 850 °C; (d,d’,d”): 1000 °C; (e,e’,e”): 1200 °C. The grain boundaries were marked with yellow lines.
Metals 14 01455 g008
Figure 9. TEM of the tested steel after a secondary thermal cycle with a peak temperature of 650 °C: (a) elongated lath bundles; (b) high-density dislocations; (c) carbides.
Metals 14 01455 g009
Figure 10. TEM of the tested steel after a secondary thermal cycle with a peak temperature of 750 °C: (a) elongated lath bundles; (b) blocky M/A at grain boundary. The outline of M/A constituent was marked with yellow line; (c) carbides.
Metals 14 01455 g010
Figure 11. TEM of the tested steel after a secondary thermal cycle with a peak temperature of 850 °C: (a) grain morphology; (b) blurred lath edges; (c) carbides.
Metals 14 01455 g011
Figure 12. TEM of the tested steel after a secondary thermal cycle with a peak temperature of 1000 °C. (a) Lath bundles arranged in multiple orientations; (b) blurred lath edges; (c) carbides.
Metals 14 01455 g012
Figure 13. TEM of the tested steel after a secondary thermal cycle with a peak temperature of 1200 °C: (a) lath morphologies; (b) carbides; (c) blurred lath edges.
Metals 14 01455 g013
Figure 14. EBSD results (GB, KAM, IPF) at different peak temperatures: (a,a’,a”): 650 °C; (b,b’,b”): 750 °C; (c,c’,c”): 850 °C; (d,d’,d”): 1000 °C; (e,e’,e”): 1200 °C.
Metals 14 01455 g014aMetals 14 01455 g014b
Figure 15. Results of parent phase grain reconstruction for the tested steel at different peak temperatures of secondary thermal cycles: (a) 650 °C; (b) 750 °C; (c) 850 °C; (d) 1000 °C; (e) 1200 °C.
Metals 14 01455 g015
Figure 16. Crystallographic analysis results of the tested steel at different peak temperatures of secondary thermal cycles: (a) grain size; (b) grain boundary misorientation; (c) grain boundary misorientation; (d) local misorientations.
Metals 14 01455 g016
Table 1. The average chemical composition of the test steel (wt. %).
CNiCrMoMnCuSiAlNbVTiBPSFe
0.112.00~2.501.00~1.500.50~1.00≤1.00≤0.20≤0.200.020.020.030.010.004<0.02<0.005Bal.
Table 2. Thermal cycling parameters.
Primary Thermal CyclingSecondary Thermal Cycle
Heating Rate/°C/sPeak Temperature/°Ct8/5/sInterpass Temperature/°CHeating Rate/°C/sPeak Temperature/°Ct8/5/s
130130052001306505
750
850
1000
1200
Table 3. The impact test results of the test steel.
Peak Temperatures/°CCrack Initiation Energy/JCrack Propagation Energy/JImpact Energy/J
65039.128.767.0
30.223.354.0
75023.85.128.9
31.77.638.5
85051.371.5122.9
48.563.7112.1
100049.062.5112.1
48.581.4129.2
120041.34.945.2
38.15.742.9
Table 4. Grain boundary angle distribution and grain size for the tested steel at different peak temperatures of secondary thermal cycles.
Peak Temperatures/°CGrain Boundary Angle Distribution of the Original Microstructure/%Original Grain Size/μmReconstructed Grain Size/μm
2°~15°15°~45°>45°
65047.04.648.416.43 ± 4.0336.89 ± 12.03
75045.67.946.516.83 ± 4.3247.22 ± 11.79
85038.915.845.36.53 ± 1.787.64 ± 2.06
100041.512.745.96.90 ± 1.8414.05 ± 3.98
120048.05.546.514.05 ± 3.7817.38 ± 4.70
Table 5. Distribution of local misorientation in the tested steel at different peak temperatures of secondary thermal cycles.
Peak Temperatures/°CLocal Misorientation/%
0°~1°1°~2°2°~3°3°~4°4°~5°
65049.840.58.31.10.2
75042.244.710.91.80.3
85048.141.39.11.30.2
100044.443.810.21.50.2
120049.241.18.41.10.2
Disclaimer/Publisher’s Note: The statements, opinions and data contained in all publications are solely those of the individual author(s) and contributor(s) and not of MDPI and/or the editor(s). MDPI and/or the editor(s) disclaim responsibility for any injury to people or property resulting from any ideas, methods, instructions or products referred to in the content.

