Abstract
Carbon nanotubes (CNTs) are considered ideal nanoscale reinforcement for the development of high-performance metal matrix composites due to their unique structure and excellent mechanical properties. However, CNTs are easy to agglomerate and have poor wettability with the aluminum matrix, resulting in unsatisfactory effects when added to the aluminum melt. In this study, Cu-coated carbon nanotubes (Cu@CNTs)-reinforced aluminum matrix composites were fabricated by high-energy ultrasonic-assisted casting. Moreover, the effects of different Cu@CNTs content on the microstructure and mechanical properties of aluminum matrix composites were explored. Meanwhile, Fluent 19.0 software was used to further explore the function of ultrasonic vibration in the melt. The results demonstrated that the mechanical properties of composite with 1.2 wt% Cu@CNTs are optimal. Compared with the matrix, the composite with 1.2 wt% Cu@CNTs displayed a 39.3% increase in yield strength, 53.5% increase in ultimate tensile strength, and 5.7% increase in elongation. The simulation results showed that the uniform dispersion of Cu@CNTs and grain refinement can be attributed to the acoustic streaming effect and cavitation effect of high-energy ultrasound. The improvement of the properties of the composites can be attributed to the grain refinement and the load-bearing effect of CNTs.
1. Introduction
In recent years, aluminum alloys, as an advanced lightweight material, have been widely used in aerospace, national defense, transportation, automotive, and other fields. However, the performance of aluminum alloys still fails to meet the requirements of higher strength parts, and thus, the development of high-strength aluminum matrix composites is particularly urgent [1,2,3,4]. CNTs, because of their distinctive structure and excellent mechanical properties, such as low density, very high strength and toughness, high Young’s modulus and tensile strength, good thermal conductivity, good electrical conductivity, etc., are considered to be ideal for nanoscale reinforcement of aluminum matrix composites [5,6,7]. Many scholars have prepared CNT-reinforced aluminum matrix composites using various methods, such as the powder metallurgy method [8], high-energy ball milling method [9], and in situ synthesis method [10]. For example, Li et al. [11] reported the preparation of CNT/Al composites by flake powder metallurgy. The elongation of 2 wt% CNT/Al composites was comparable to that of pure Al, reaching about 30%. However, the preparation process of flake powder metallurgy is extremely complicated, and the related parameters are difficult to control. Perez-Bustamante et al. [12] prepared CNT/Al composites by high-energy ball milling and cold press sintering. The results showed that the composites exhibited better wear resistance when the CNT content was 5 wt% compared with the 2024 Al matrix. He et al. [13] used chemical vapor deposition to generate CNTs in situ on the surface of aluminum powder. The Al-5wt%CNT composites produced by pressing and sintering at 490 °C show a densification of 96% and uniform dispersion of CNTs. In general, the above methods will cause some damage to the structure of CNTs to a certain extent, and the preparation process is complicated and costly, which is not suitable for industrialized mass production.
Compared with the above methods, the ultrasonic-assisted casting method has a lower preparation cost, and the process is simple and easy to operate. Liu et al. [14] prepared carbon-nanotube-reinforced magnesium matrix composites by mechanical stirring and high-intensity ultrasonic dispersion. Compared with the matrix, the yield strength (YS), ultimate tensile strength (UTS), and elongation (EI) of the AZ91D composites with 1.5% CNTs increased by 21%, 22%, and 42%, respectively. Mohammed et al. [15] prepared boron-nitride-nanotube-reinforced aluminum matrix composites by ultrasonic cavitation-assisted casting. The results showed that after ultrasonic treatment, the boron nitride nanotubes had good dispersibility in liquid aluminum and an enhanced grain refinement effect. Srinivas et al. [16] prepared multiwalled carbon nanotube (MWCNT)-reinforced aluminum matrix composites by ultrasonic-assisted stir casting. Ultrasonic treatment during the casting resulted in better dispersion of MWCNTs in the matrix and a significant increase in the hardness of the composites. The wear rate and friction coefficient of the composites were significantly reduced compared to the aluminum matrix. Studies by many scholars have shown that high-energy ultrasonic treatment can effectively add CNTs or other reinforcing materials to the metal matrix, thereby improving the mechanical properties of the matrix [14,15,16].
However, CNTs are prone to inducing strong agglomeration and entanglement during the preparation of composites due to their high surface energy, large specific surface area, and aspect ratio. Therefore, improving the wettability of CNTs with an aluminum alloy and their dispersion in the matrix has become the focus of research on CNT-reinforced aluminum matrix composites. Ding et al. [17] prepared AZ61 nanocomposites by mixing copper-coated CNTs and AZ61 powder through ball milling, vacuum hot pressing, and extrusion. When the CNT content was 0.15 vol%, the work of fracture, yield strength, compressive strength, and fracture strain of the composite were increased by 40%, 20%, 15%, and 26%, respectively, compared with the matrix. Kang et al. [18] coated a layer of highly wettable SiC on the surface of CNTs by vacuum fusion casting to improve the interfacial bonding strength between CNTs and the matrix. The SiC layer prevents the CNTs from disintegrating during the strengthening process. The tensile strength and Young’s modulus of the composites with 1.0 wt% SiC@CNTs increased by 15% and 79%, respectively. It can be seen that the wettability between CNTs and the aluminum matrix and their dispersion in the matrix can be improved by modifying the surface of CNTs.
Nevertheless, most scholars have focused on the exploration of different coating interfaces and seldom investigated the dispersion mechanism of coated CNTs in the melt. In addition, many scholars know that high-energy ultrasonic treatment can effectively improve the dispersion of the reinforced phase in the melt [15,19], but few studies have been conducted on the mechanism of ultrasound action in the melt. Therefore, it is very necessary to explore the mechanism of ultrasonic action during the casting process. Due to the invisible and untouchable nature of ultrasound, simulation software to model the distribution of the melt flow field during ultrasound was applied to explain the mechanism of ultrasound action at the macroscopic level.
In this study, Cu@CNT-reinforced aluminum matrix composites were fabricated by high-energy ultrasonic-assisted casting. Meanwhile, the effects of different Cu@CNT contents on the microstructure and mechanical properties of the composites were investigated. In addition, the flow field distribution of aluminum alloy melt during high-energy ultrasonic treatment was simulated using Fluent 19.0 software. The ultrasonic acoustic streaming effect and its dispersion mechanism were expressed from a macroscopic point of view, and the role of ultrasound in the assisted casting process was further verified. This study has important reference significance for improving the wettability between CNTs and the aluminum matrix, enhancing the dispersion of CNTs in the aluminum matrix, and preparing high-performance CNT/Al composites.
2. Materials and Methods
2.1. Original Materials
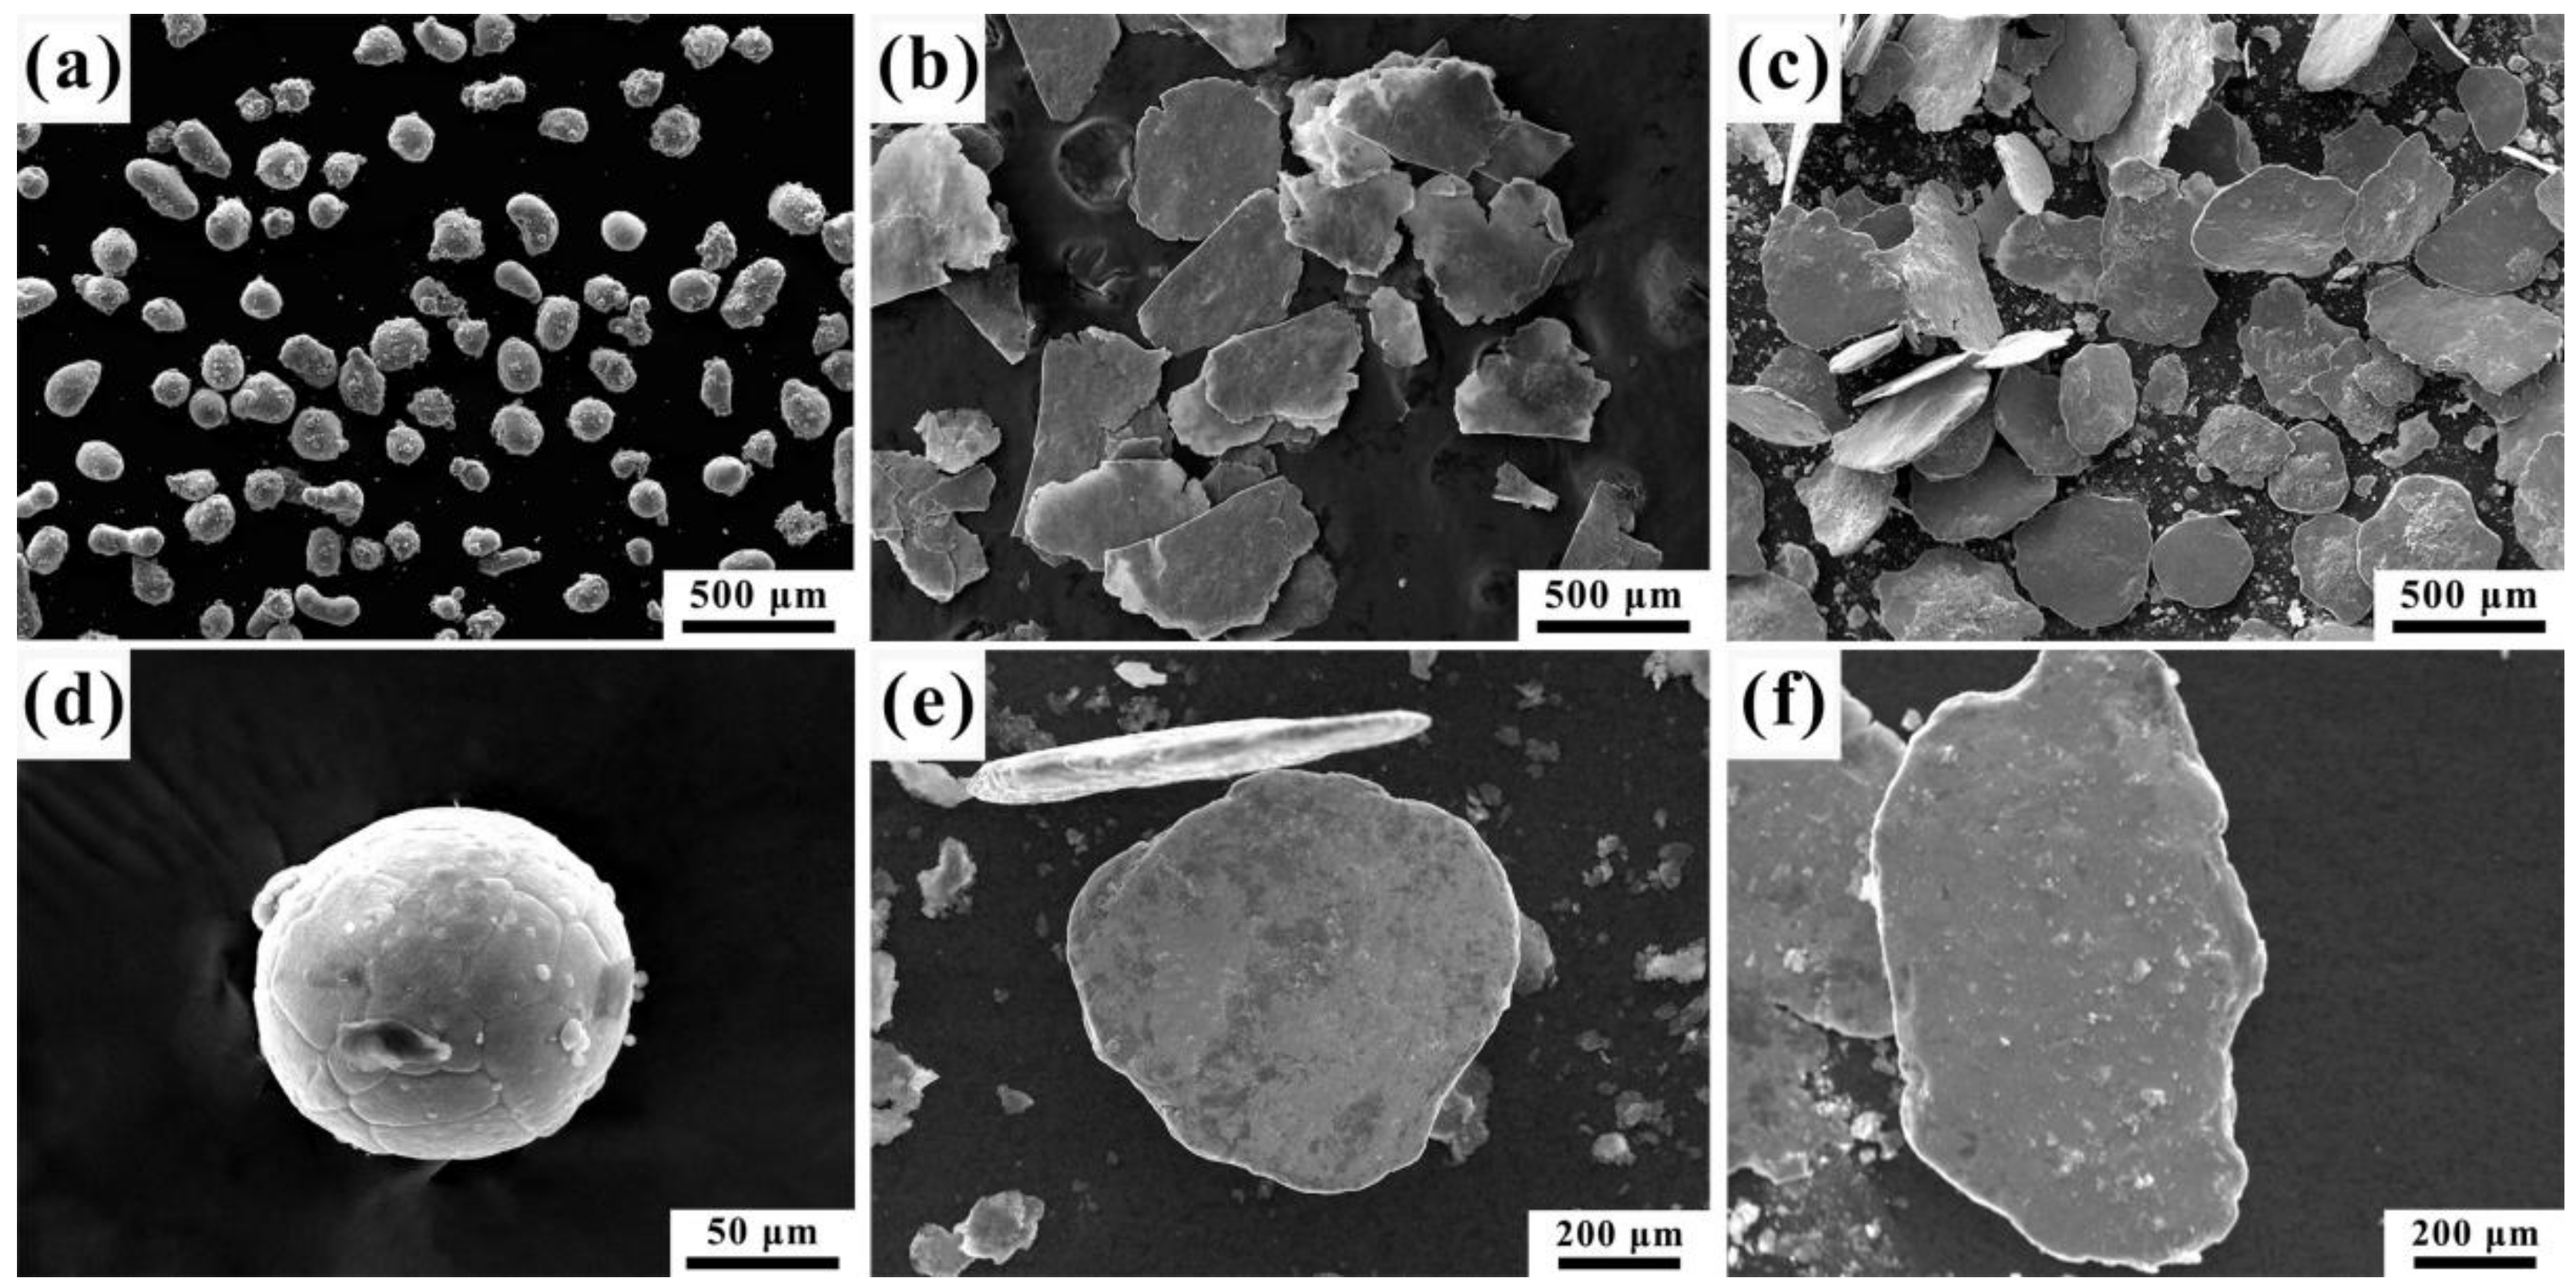
In this experiment, the matrix material was the commercial ADC12 alloy, which is an Al-Si-Cu alloy produced by Daxin Industrial (Shanghai) Co., Ltd. (Shanghai, China) The chemical composition of the alloy is determined by inductively coupled plasma atomic emission spectrometry (ICP-AES) and is shown in Table 1. High purity aluminum powder (purity ≥ 99.9%) produced by Zhejiang Yamei Nano Technology Co., Ltd. (Jiaxing, China) was used in the experiment. From the scanning electron microscopy (SEM) image in Figure 1a,d, it can be seen that the shape of the pure aluminum powder is nearly spherical, and its average diameter is about 50–100 μm.

Table 1.
Chemical composition of commercial ADC12 alloy.
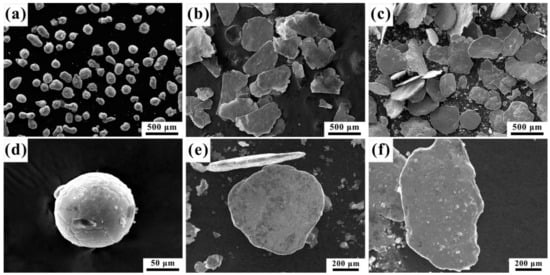
Figure 1.
SEM image of Al powder before and after ball milling: (a) spherical aluminum powder; (b) flaky aluminum powder; (c) mixed powder; (d) spherical aluminum powder high magnification morphology in (a); (e) flaky aluminum powder high magnification morphology in (b); (f) mixed powder high magnification morphology in (c).
Multiwalled carbon nanotubes produced by Jiangsu Xianfeng Nanomaterials Technology Co., Ltd. (Nanjing, China) with purity > 95%, diameter > 50 nm, and length of 0.5–2 μm were used as reinforcement. Copper sulfate pentahydrate (CuSO4·5H2O), sodium hydroxide (NaOH), ethylene glycol (EG), hydrazine hydrate (N2H4·H2O), cetyltrimethylammonium bromide (CTAB), and ethanol supplied by Sino Pharmacy Chemicals Co., Ltd. (Shanghai, China) were used as raw materials for the preparation of copper nanoparticles for coating. To overcome the problem of poor adhesion between Cu ions and CNTs, acid treatment was used to form -carboxylic and -OH functional groups on the surface of CNTs. The CNTs were placed in a 3:1 mixture of sulfuric and nitric acids and refluxed at 80 °C for 4 h [20]. The mixture was then filtered and washed several times with deionized water until the pH value was neutral, and then it was removed and set aside after drying in a vacuum drying oven for 24 h.
2.2. Experiment
2.2.1. Fabrication of Cu@CNTs
First, 0.2 g of acid-treated CNTs was added to 150 mL of EG solution, put into an ultrasonic cleaner for 1 h of ultrasonic dispersion, and then stirred by a magnetic mixer for 1 h so as to make it uniformly dispersed in the solution. Then, 0.1 mol/L of CuSO4·5H2O was added to the solution, stirred sufficiently until it was well mixed, and then 0.5 mol/L of the NaOH/EG mixed solution was added to the above solution, and the pH value of the solution was adjusted to be about 11. After stirring sufficiently, the mixed solution was poured into a three-nozzle flask, heated in an oil bath to 140 °C, and refluxed for 3 h under continuous vigorous stirring [21]. After refluxing for 3 h, the temperature of the solution was lowered to 90 °C, and 12 mL of N2H4·H2O (85 wt%) reagent was added to it and stirred sufficiently for 1 h at this temperature to allow for a full reaction to reduce the copper ions to copper monomers [22]. After the reaction was complete and the solution was cooled down to room temperature, the solution was filtered by vacuum filtration and washed several times with deionized water, then dried in a vacuum drying oven for 24 h. Subsequently, the Cu@CNT powder was obtained by grinding with a mortar and pestle.
2.2.2. Fabrication of Intermediate Alloy
In this experiment, a variable speed ball milling process was used. Firstly, 27.9 g of aluminum powder was added to the planetary ball mill and ball milled at 300 rpm for 3 h (the ratio of balls to powder was 10:1). Through the high-speed ball milling process, the spherical aluminum powder was made into a flaky aluminum powder (Figure 1e), and the surface area of the aluminum powder was increased so that the CNTs could be better adhered to the surface of the aluminum powder. The morphology of the ball milled aluminum powder was as shown in Figure 1b. From this figure, it can be seen that after high-speed ball milling, the aluminum powder had a flattened flaky structure, and its average diameter was about 500 μm, which is significantly larger than that before high-speed ball milling. Then, 2.1 g of Cu@CNTs and 27.9 g of flaky aluminum powder were added to a planetary ball mill and ball milled at 150 rpm for 2 h. Cu@CNTs were uniformly dispersed on the surface of the aluminum powder by low-speed ball milling to ensure that the tubular structure of the CNTs was not disrupted. The morphology of the mixed powder after low-speed ball milling is shown in Figure 1c, and it can be seen from Figure 1f that Cu@CNTs were uniformly dispersed on the surface of the flaky aluminum powder. In addition, a certain amount of stearic acid needed to be added to it as a stabilizer during the ball milling process to prevent the occurrence of the cold welding phenomenon, and argon gas was passed to prevent the oxidation of aluminum powder. Subsequently, the mixture powder was cold pressed at 1100 KN for 15 min to prepare the intermediate alloy, and the pressed intermediate alloy blocks were cut into small pieces for spare use.
2.2.3. Fabrication of Cu@CNTs/ADC12 Composites
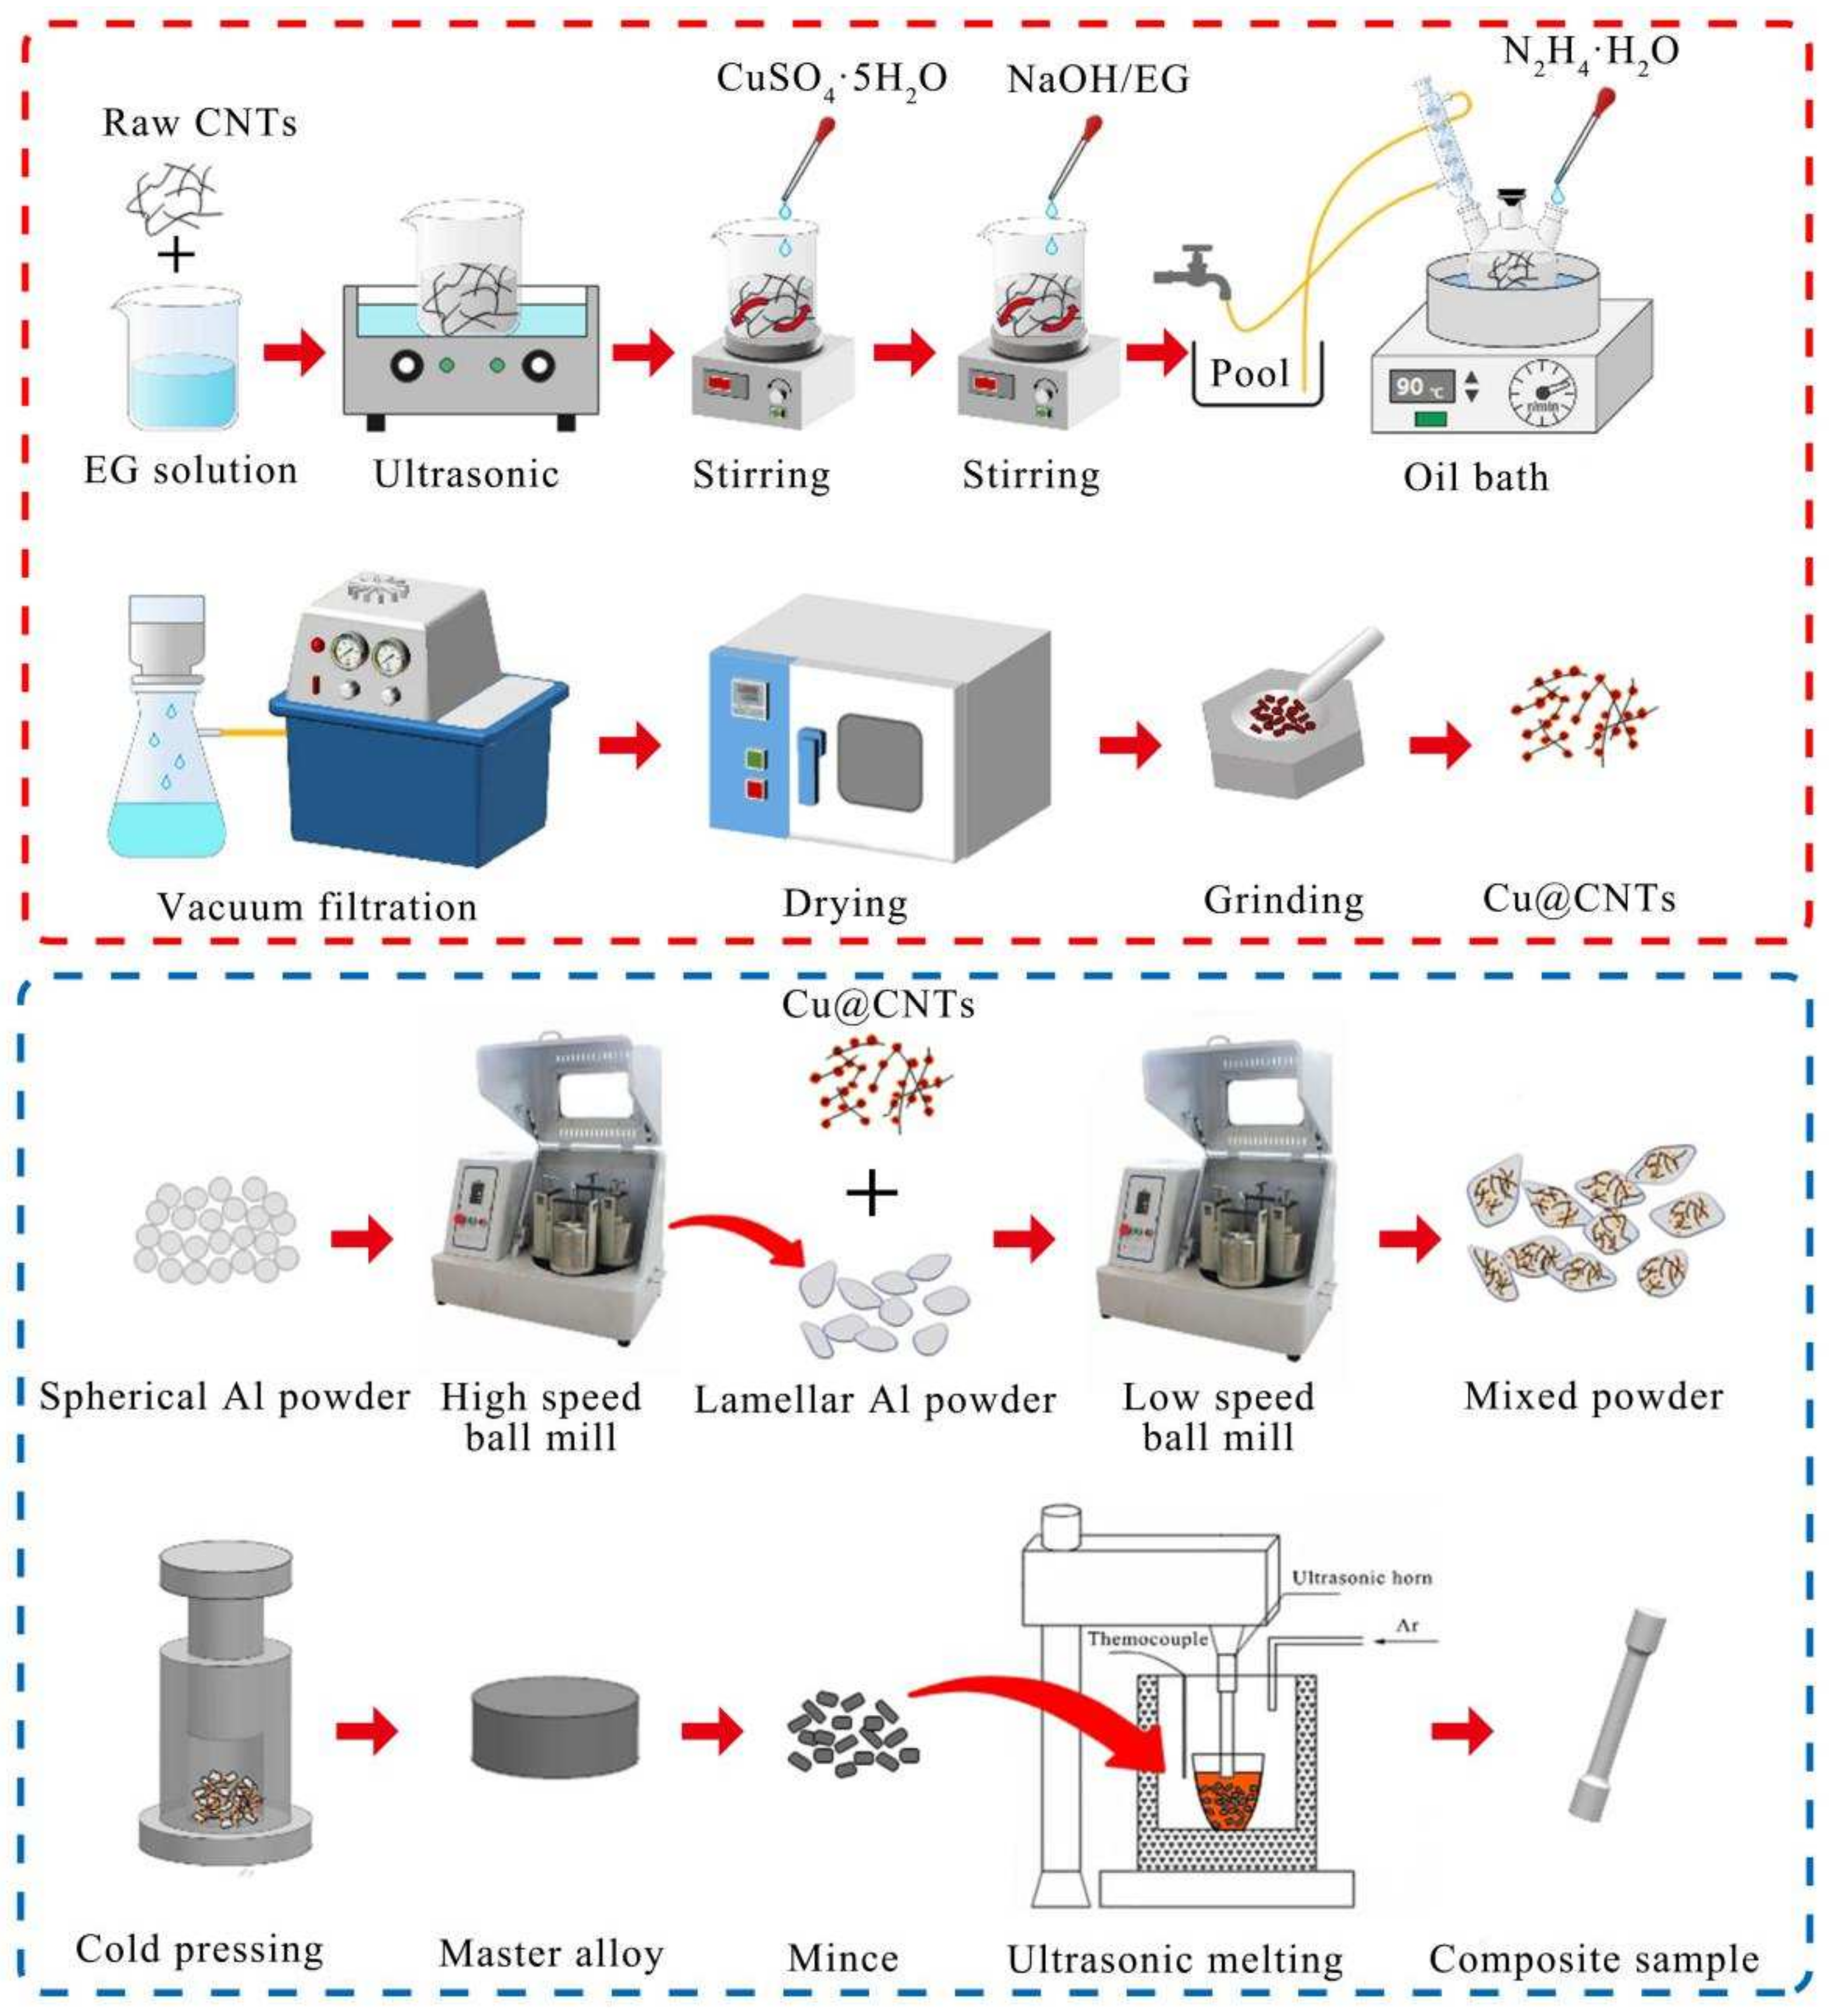
Moisture was removed from the ADC12 alloy and intermediate alloy blocks by heating at 200 °C. In each experiment, the ADC12 alloy used for casting was cut into rectangular blocks, placed in a corundum crucible, and heated in a resistance furnace to 760 °C for complete melting. Then, different contents of intermediate alloy blocks were added to the ADC12 alloy melt to obtain three different contents of Cu@CNTs/ADC12 composites. The mass of the intermediate alloy block determined the content of the Cu@CNTs. In order to ensure that the Cu@CNTs were uniformly dispersed in the melt, the intermediate alloy block was fully melted by mechanical stirring for 10 min, and then the melt was subjected to high-energy ultrasonic treatment for 10 min with an ultrasonic power of 2.1 kW [20,21]. The depth of immersion of the ultrasonic horn into the melt was 10 mm. All steps in the process were protected using an argon atmosphere. Finally, the melt was carefully slagged to remove impurities and then poured into a mold preheated to 200 °C and removed for sample making after it had cooled to room temperature. The schematic diagram of the fabrication of Cu@CNT/ADC12 composites by the chemical plating method is shown in Figure 2. The sample dimension diagram for tensile test is shown in Figure 3. The tensile tests were performed using a universal test machine (UTM5105, Zhuhai SUST Electrical Equipment Co., Ltd., Zhuhai, China) at a strain rate of 2.5 × 10⁻⁴ s−1 at room temperature. In order to avoid the contingency of experimental results, each sample in the experiment was randomly tested with 5 tensile rods, and the average value was used as the result.
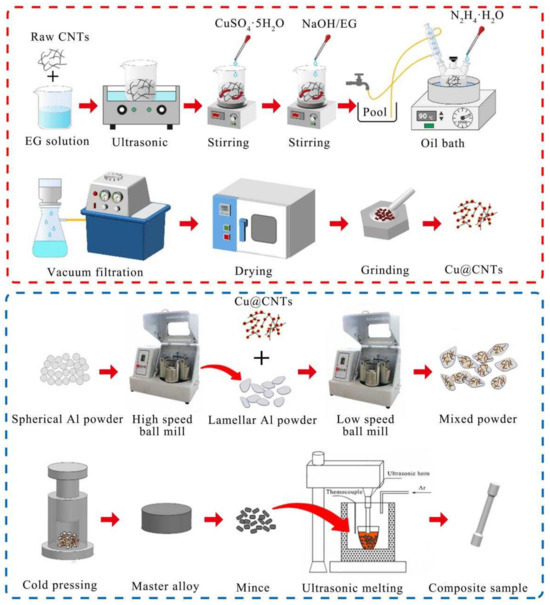
Figure 2.
Schematic diagram of the fabrication of Cu@CNT/ADC12 composites.
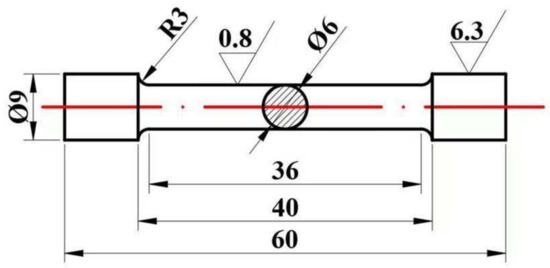
Figure 3.
The dimension diagram of the tensile specimen (mm).
3. Result
Figure 4 shows the schematic diagram for formation of Cu on the surface of CNTs. The composite reduction method can be summarized as three steps: acid treatment, coating, and reduction reaction. For Cu@CNTs, the synthesis mechanism mainly goes through the following four chemical reaction equations. First, in the whole reaction system, EG acts as both a solvent and a reducing agent [23]. EG reacts with oxygen at high temperatures to form reductive glyoxal:
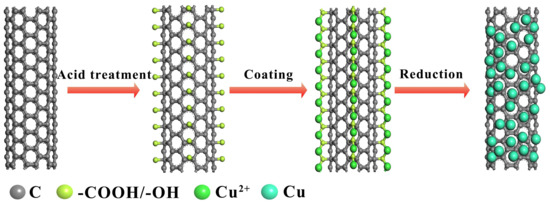
Figure 4.
Schematic diagram for formation of Cu on the surface of CNTs.
Then, the NaOH/EG solution is added to the solution so that its PH is 11:
Glyoxal can reduce Cu(OH)2 to Cu2O at high temperatures [24]:
Finally, hydrazine hydrate acts as a strong reducing agent to reduce Cu2O to Cu:
In the composite reduction method, nitrogen is produced, and these gases are precipitated to overcome the interface pressure, so it is also necessary to stir the solution to speed up the removal of bubbles.
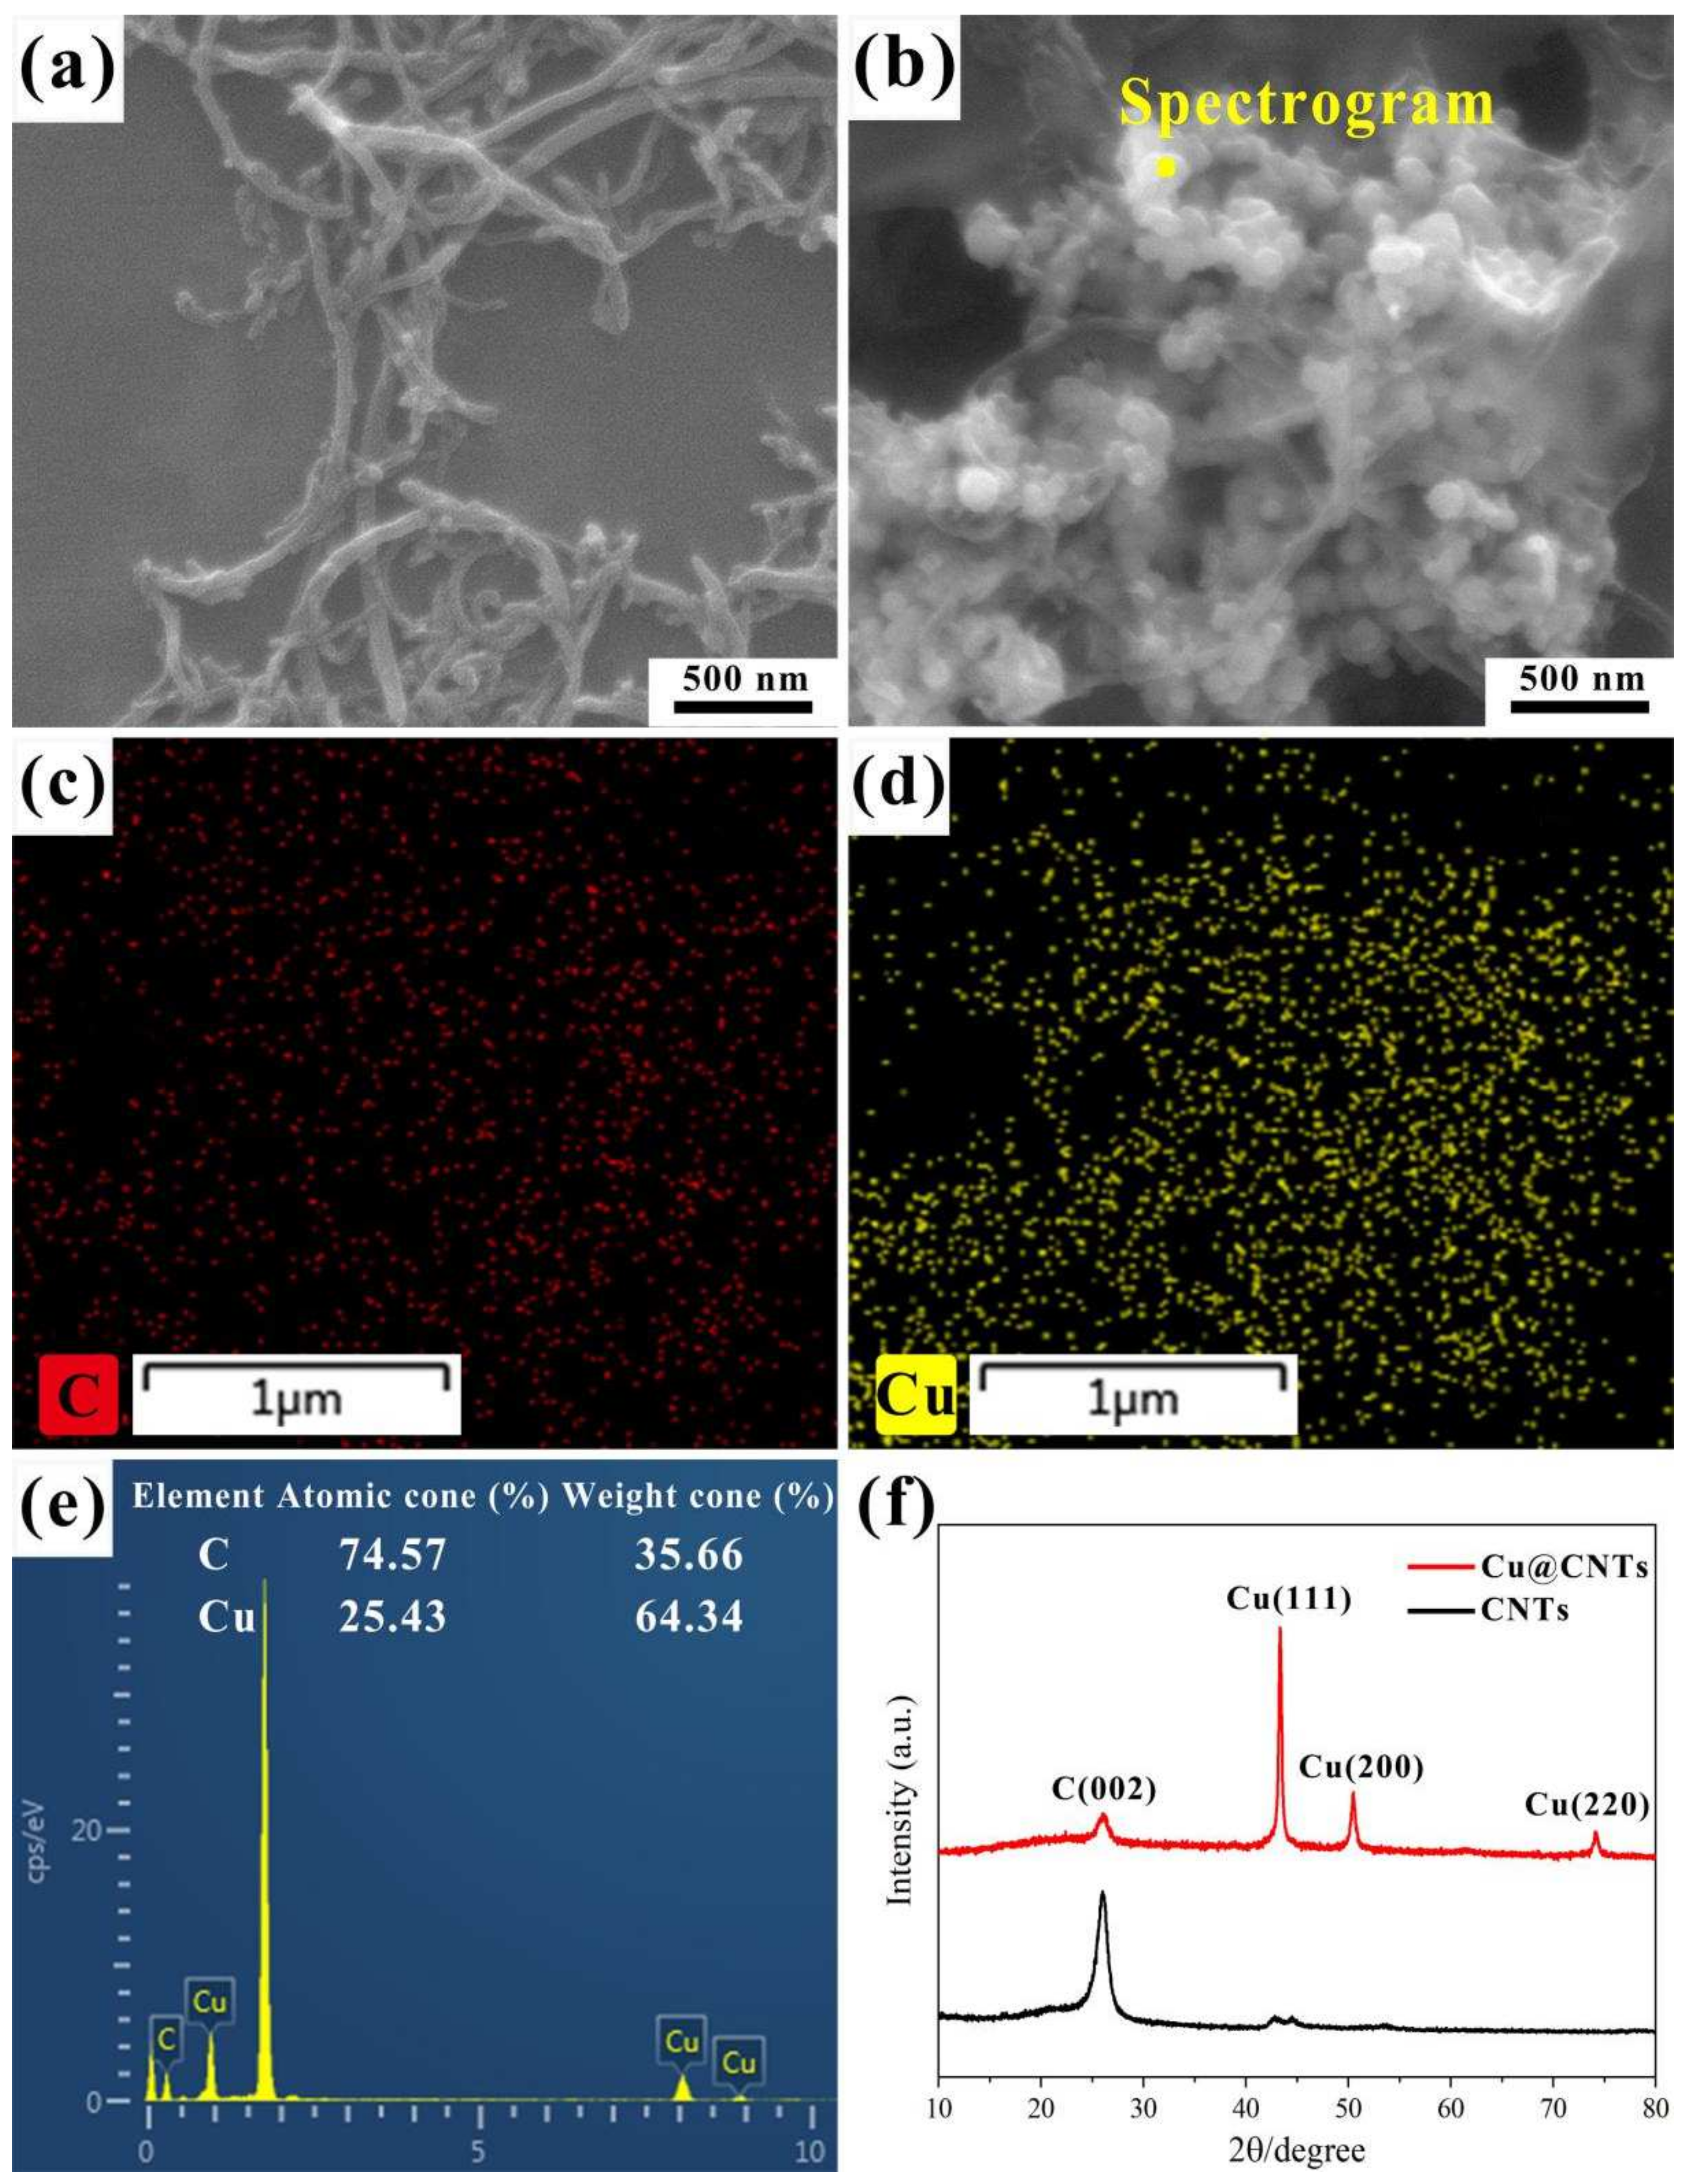
Figure 5a,b shows the microscopic morphology of CNTs and Cu@CNTs. Typical tubular CNTs with diameters ranging from 50 to 80 nm can be observed in Figure 5a. Apparently, a large number of nanoparticles were deposited on the surface of the coated CNTs, as shown in Figure 5b. Meanwhile, Figure 5c,d shows the energy-dispersive spectroscopy (EDS) scanning images of Cu@CNTs, and the results indicate that the spherical nanoparticles of Cu were uniformly coated on the surface of CNTs. In addition, we performed X-ray diffraction (XRD) analysis of CNT and Cu@CNT composite powders, as shown in Figure 5f, and the diffraction peaks of C and Cu can be observed simultaneously in the patterns of Cu@CNTs. The diffraction peaks at 2θ = 26° and 42.8° correspond to the (002) peak and (100) graphitized crystal surface of CNTs. The diffraction peaks at 2θ = 43.3°, 50.5°, and 74.1° correspond to the (111), (200), and (220) crystal planes of Cu, respectively. In the XRD patterns, no characteristic peaks of CuO and Cu2O were detected, indicating that copper ions were completely reduced to copper monomers during the fabrication of Cu@CNT reinforcements.

Figure 5.
SEM images of (a) CNTs; (b) Cu@CNTs; (c,d) corresponding element distributions of Cu@CNTs; (e) corresponding EDS result of yellow spot in (b); (f) XRD patterns of CNTs and Cu@CNTs.
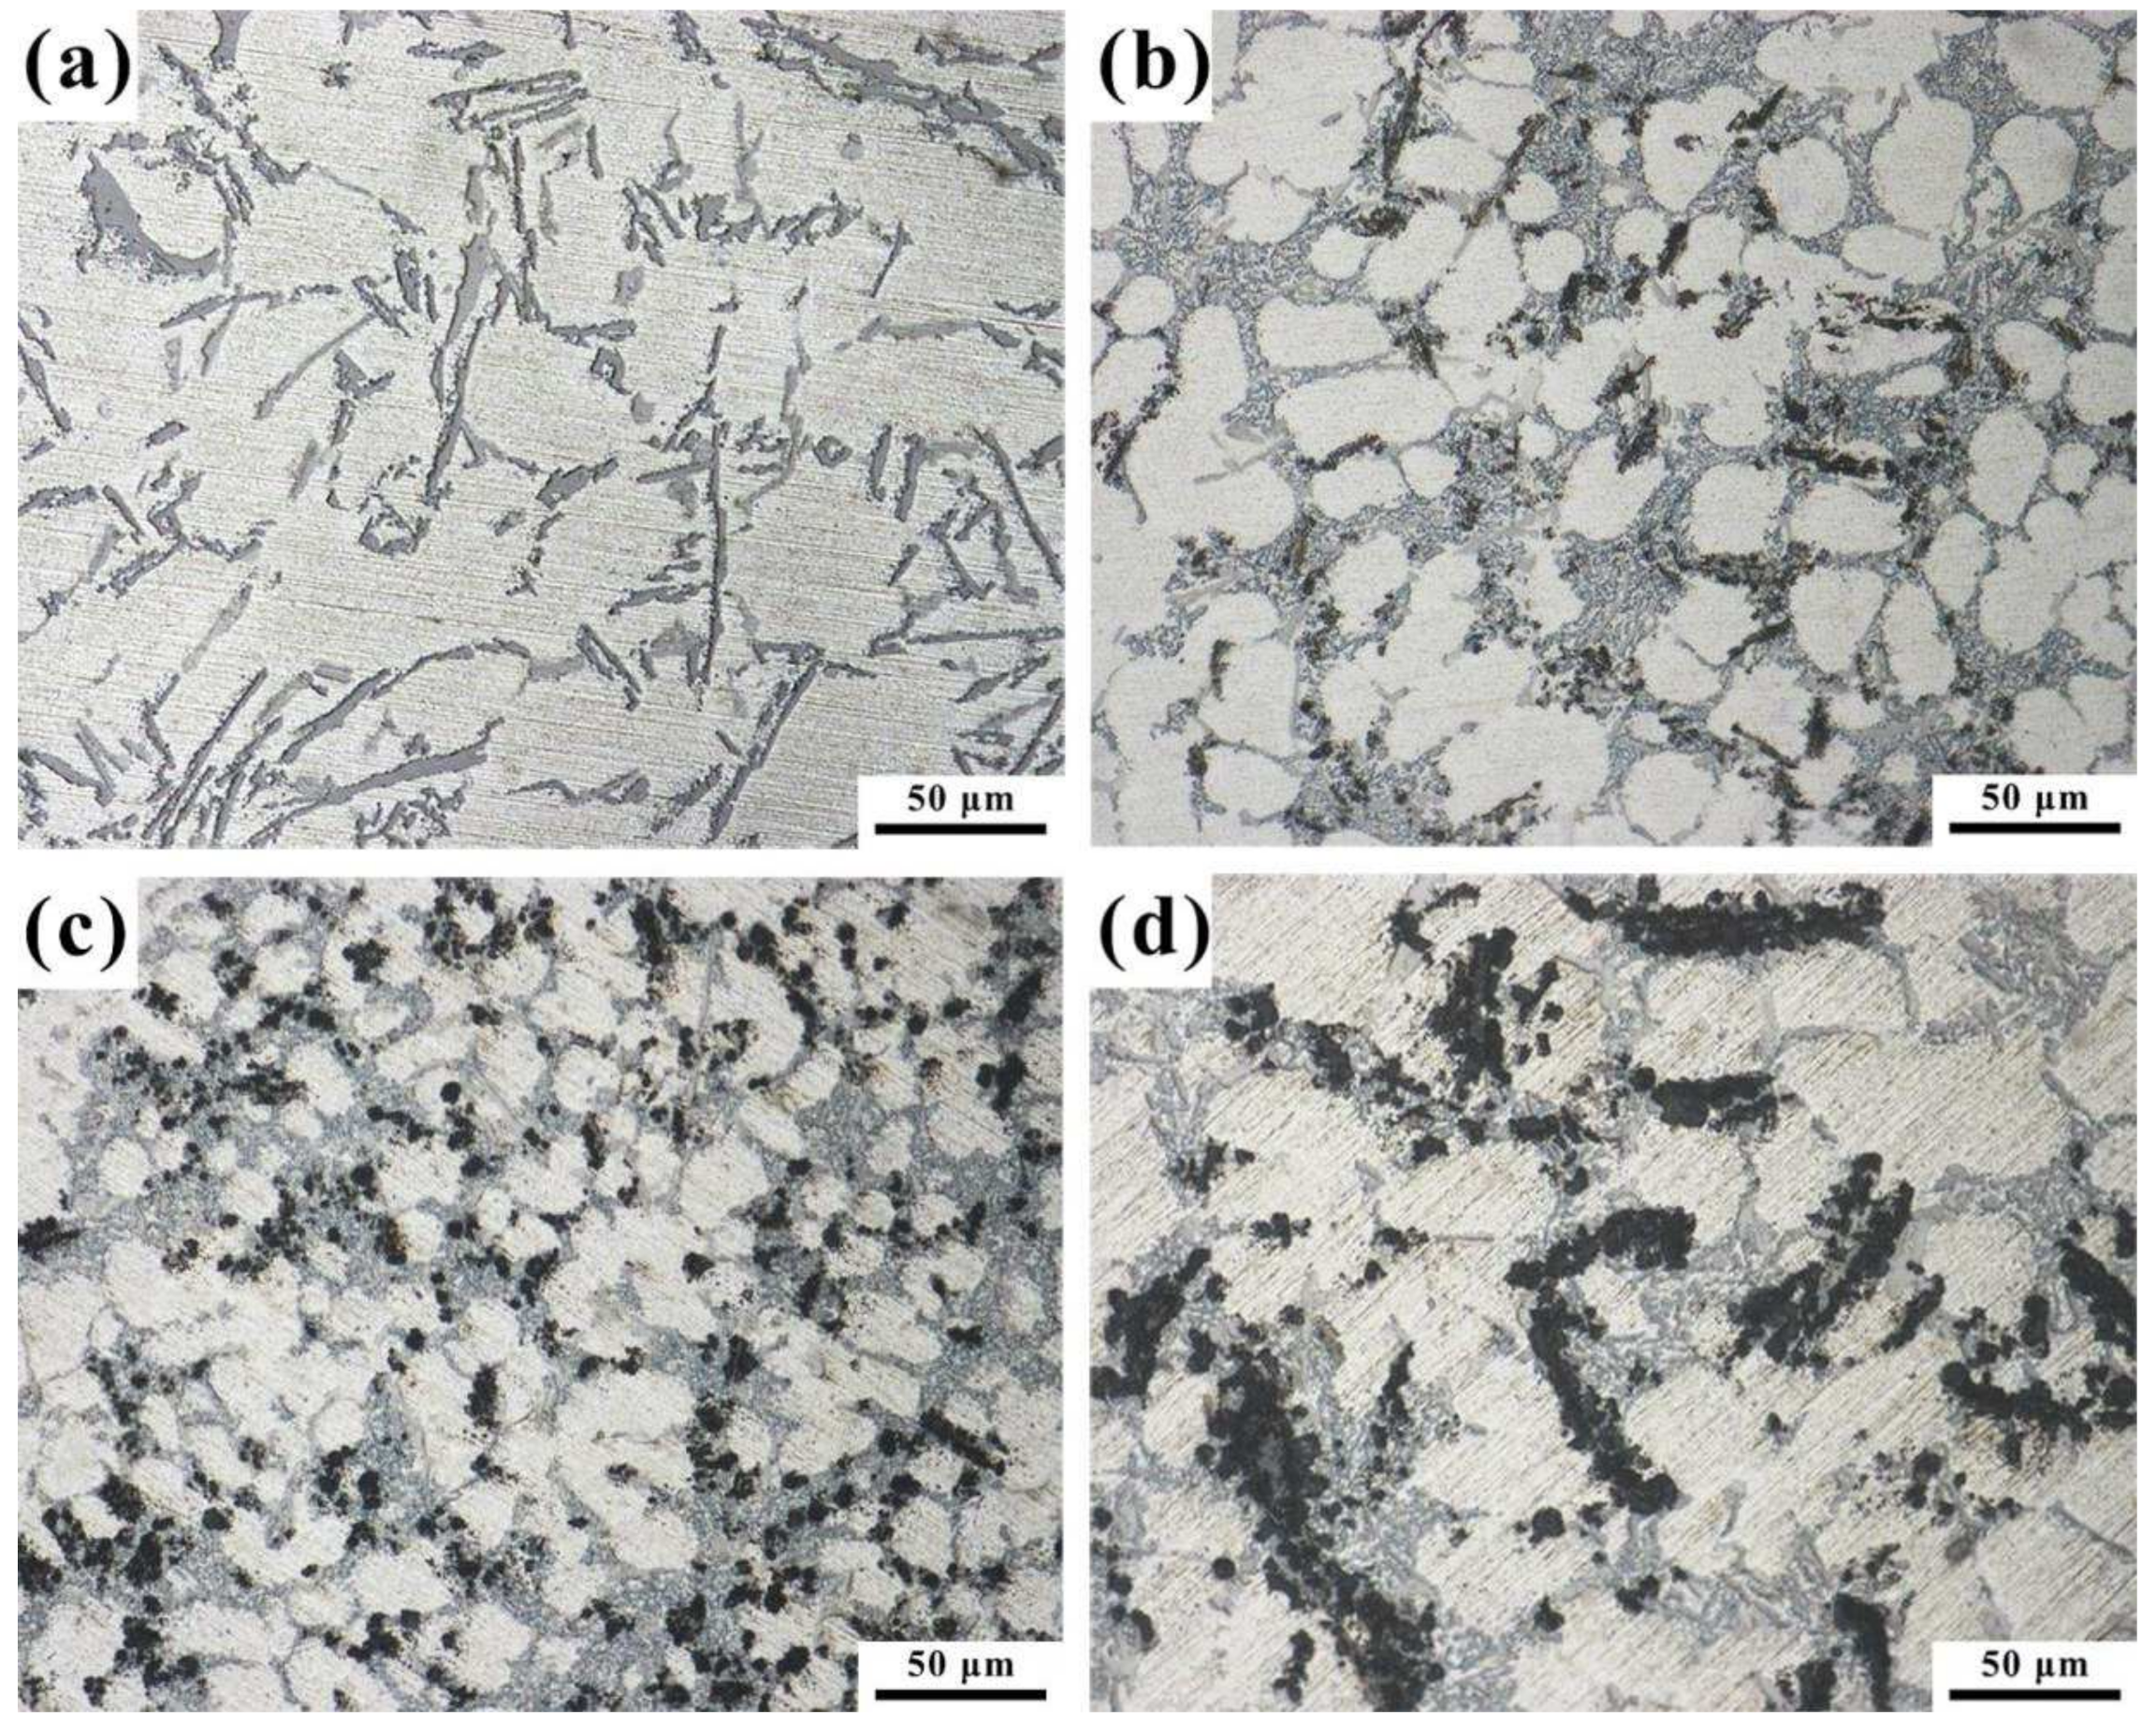
As shown in Figure 6a, the microstructure morphology of the ADC12 matrix shows that the α-Al grains were coarse and there was an obvious long needle-like Si phase, which is also the reason for the poor mechanical properties of the matrix material. From Figure 6b–d, it can be found that the average diameter of α-Al in the composite material decreased first and then increased, and the Si phase changed from long needle to point, with obvious refinement, and a small black phase can also be observed in the figure. After the subsequent detection and analysis, it can be determined that the black phase is Cu@CNTs. In Figure 6b, when the Cu@CNTs was at 0.6 wt%, the α-Al phase was refined, but this was not particularly obvious. In addition, the eutectic Si phase changed from the original long needle-like to fine granular. From Figure 6c, it can be seen that the composite with 1.2 wt% Cu@CNTs (Cu@CNT/ADC12-12 composite) had the most obvious grains refinement, the α-Al phase became fine and rounded, the Si phase was fine and granular, and the black phase was uniformly distributed in the composite. Cu@CNTs were uniformly dispersed along the grain boundaries, forming a large area grid structure, which inhibited the growth of grains and promoted the refinement of grains. Dense grain boundaries can hinder the movement of dislocations, which is beneficial to improve the mechanical properties of composites. As shown in Figure 6d, when the addition of Cu@CNTs was increased to 1.8 wt%, the α-Al phase was not further refined, and a large number of black agglomerated phases appeared. This indicates that excessive Cu@CNT addition leads to its inability to be uniformly dispersed in the composites and affects its grain refinement effect. It also affects the fine crystal strengthening and load transfer strengthening of Cu@CNTs in the composite materials, thus affecting the mechanical properties of the composites. From this, it can be preliminary stated that the microscopic morphology of the composites is the best when Cu@CNTs equals 1.2 wt%, and the grain refinement of the α-Al phase and eutectic Si phase is the most obvious compared with that of the matrix microstructure. In this time, Cu@CNTs also had the best dispersion effect in the composites.
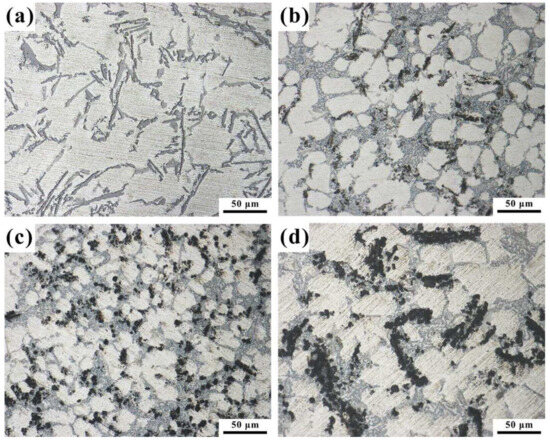
Figure 6.
Microstructure of Cu@CNT/ADC12 composites with different contents of Cu@CNTs (500×): (a) 0.0 wt%, (b) 0.6 wt%, (c) 1.2 wt%, (d) 1.8 wt%.
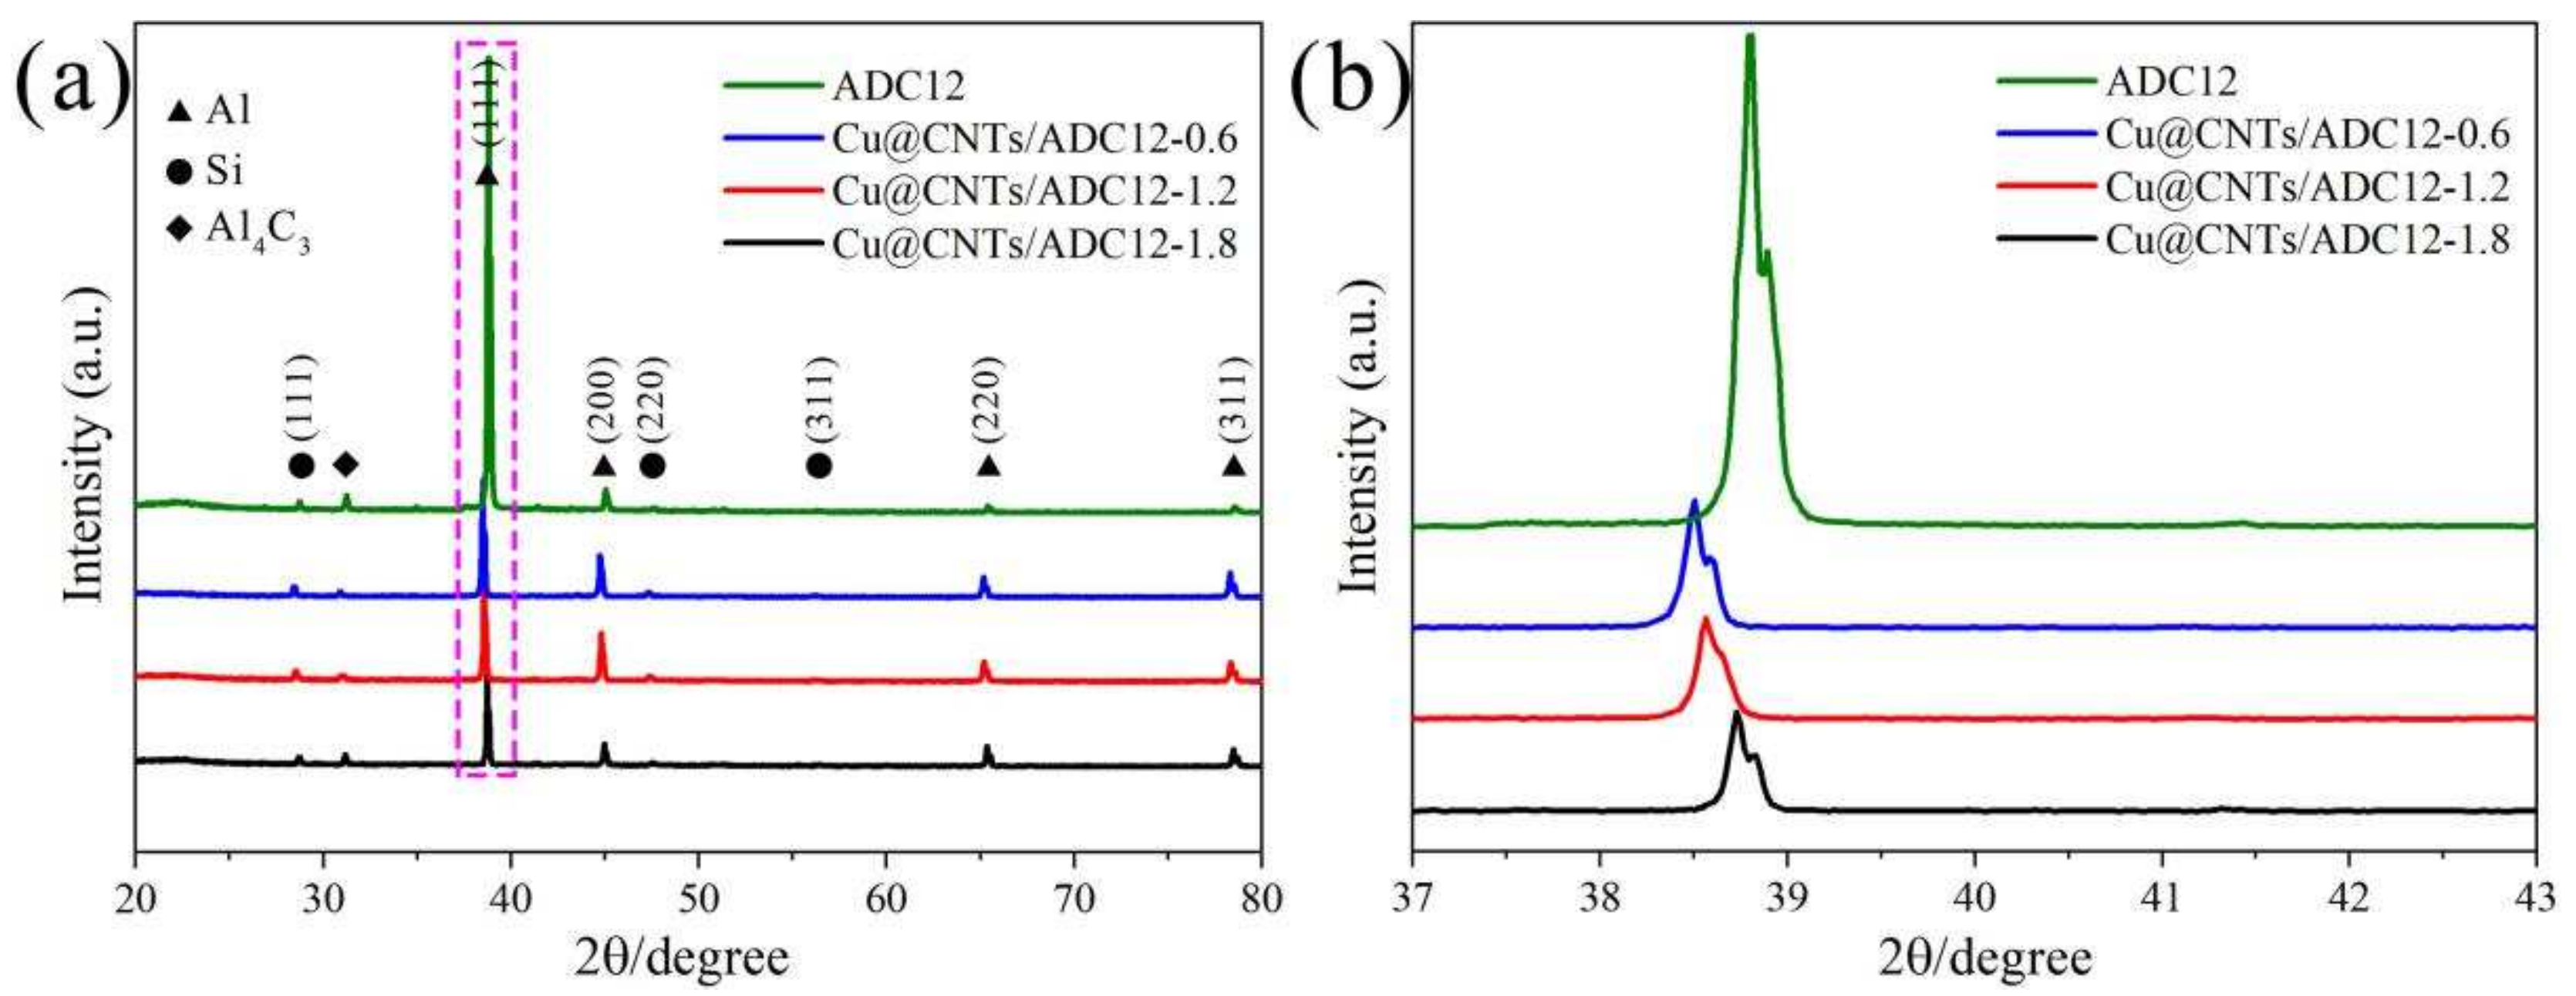
In order to verify the phase composition in the above composites, we performed XRD phase analysis of the composites. Figure 7a shows the XRD patterns of the aluminum matrix and the composites with different contents of Cu@CNTs added, and Figure 7b shows the enlarged pattern of the dashed area. The results show that all the typical diffraction peaks of Al and Si phases were detected in all four materials, but no obvious diffraction peaks of CNTs were detected at 2θ = 26°, which might be due to the fact that the content of CNTs added to the composites was too small, and no corresponding diffraction peaks were detected, as in other scholars’ studies [25,26]. In addition, as shown in Figure 7b, we found in the overlapping XRD patterns that the patterns showed an increase in the full width at half maximum (FWHM) of the diffraction peaks and a shift in the 2θ value with the increase in Cu@CNT content. These changes reflect an increase in grain refinement and lattice distortion in the α-Al and Si phases. The addition of Cu@CNTs led to grain size refinement in the α-Al and Si phases, which in turn led to an increase in lattice distortion.
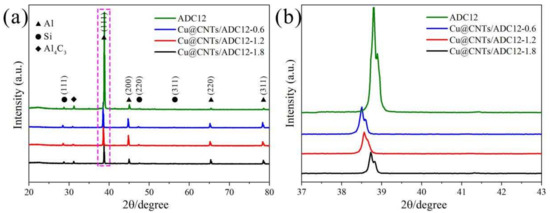
Figure 7.
(a) XRD patterns of Cu@CNT/ADC12 composites with different content of Cu@CNTs, (b) high magnification image of the dotted box in (a).
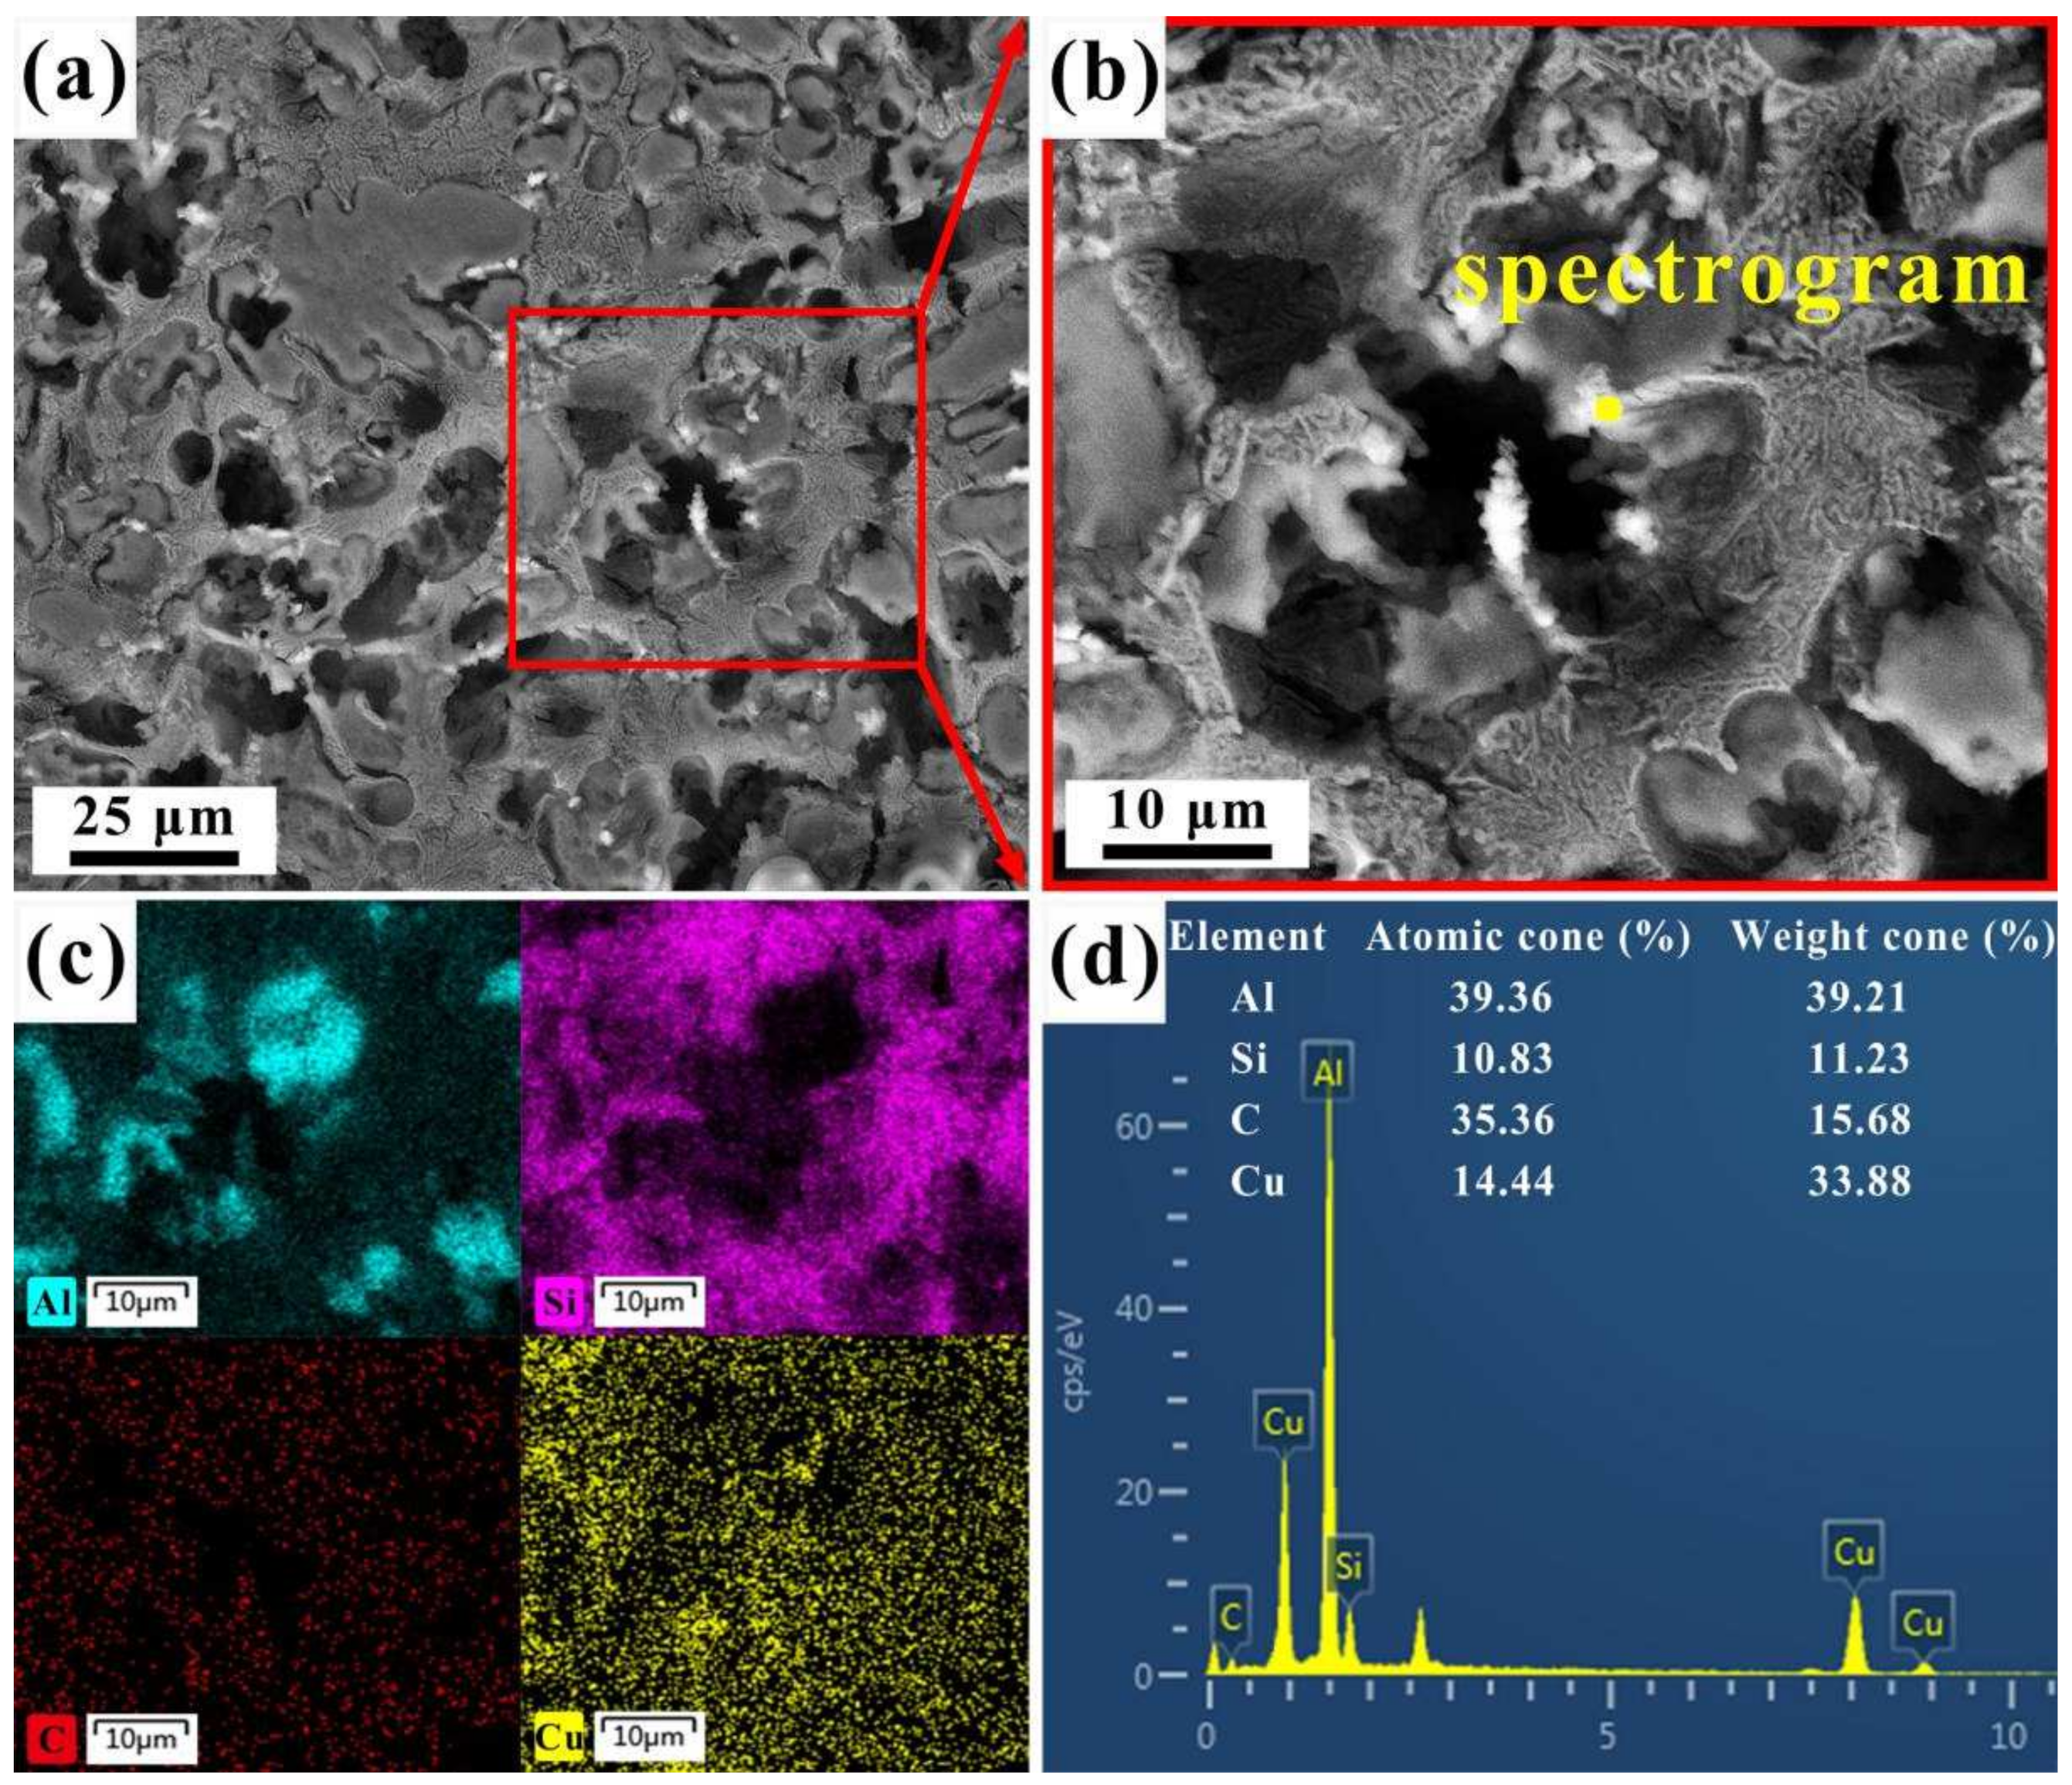
In order to further determine the composition of the black phase in the composites, they were analyzed by SEM and EDS. The SEM and EDS images of the Cu@CNT/ADC12-12 composites are presented in Figure 8. In order to better observe the internal structure of the composites, we deeply corroded the composites with 1 mol/L of concentrated hydrochloric acid before conducting SEM experiments. Figure 8a illustrates the microstructure morphology of the Cu@CNT/ADC12-1.2 composite. The black holes in the figure are pits left by deep corrosion of the sample. Figure 8b is an enlarged view of the area corresponding to the red box. Furthermore, the EDS patterns of Figure 8c reveal that the gray phase corresponds to the matrix α-Al phase, while the dense short rod-like white phase corresponds to the Si phase. Simultaneously, it can be seen that where the Cu element was detected, the C element was also detected, i.e., the bright white phases shown in the figure are Cu@CNTs. Figure 8d is the EDS spectrogram of the yellow marked points. EDS point scanning analysis showed that the main components were Al, Si, C, and Cu, which confirmed that these substances were Cu@CNTs. The results are consistent with those shown in Figure 8c. The dispersion effect of Cu@CNTs is very good, which is due to the fact that the Cu layer changed the wettability between CNTs and the Al matrix, and the cavitation effect generated by ultrasound in the casting process deepened the dispersion effect.
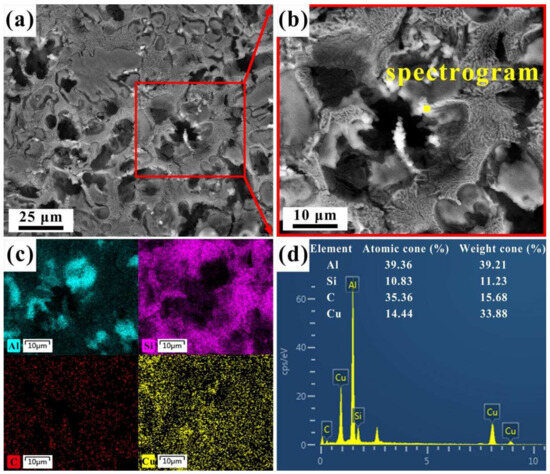
Figure 8.
(a) SEM images of depth-etched Cu@CNT/ADC12–1.2 composite, (b) high magnification of the red box in (a), (c) corresponding element distributions of Cu@CNT/ADC12–1.2 composite, (d) corresponding EDS result of yellow spot in (b).
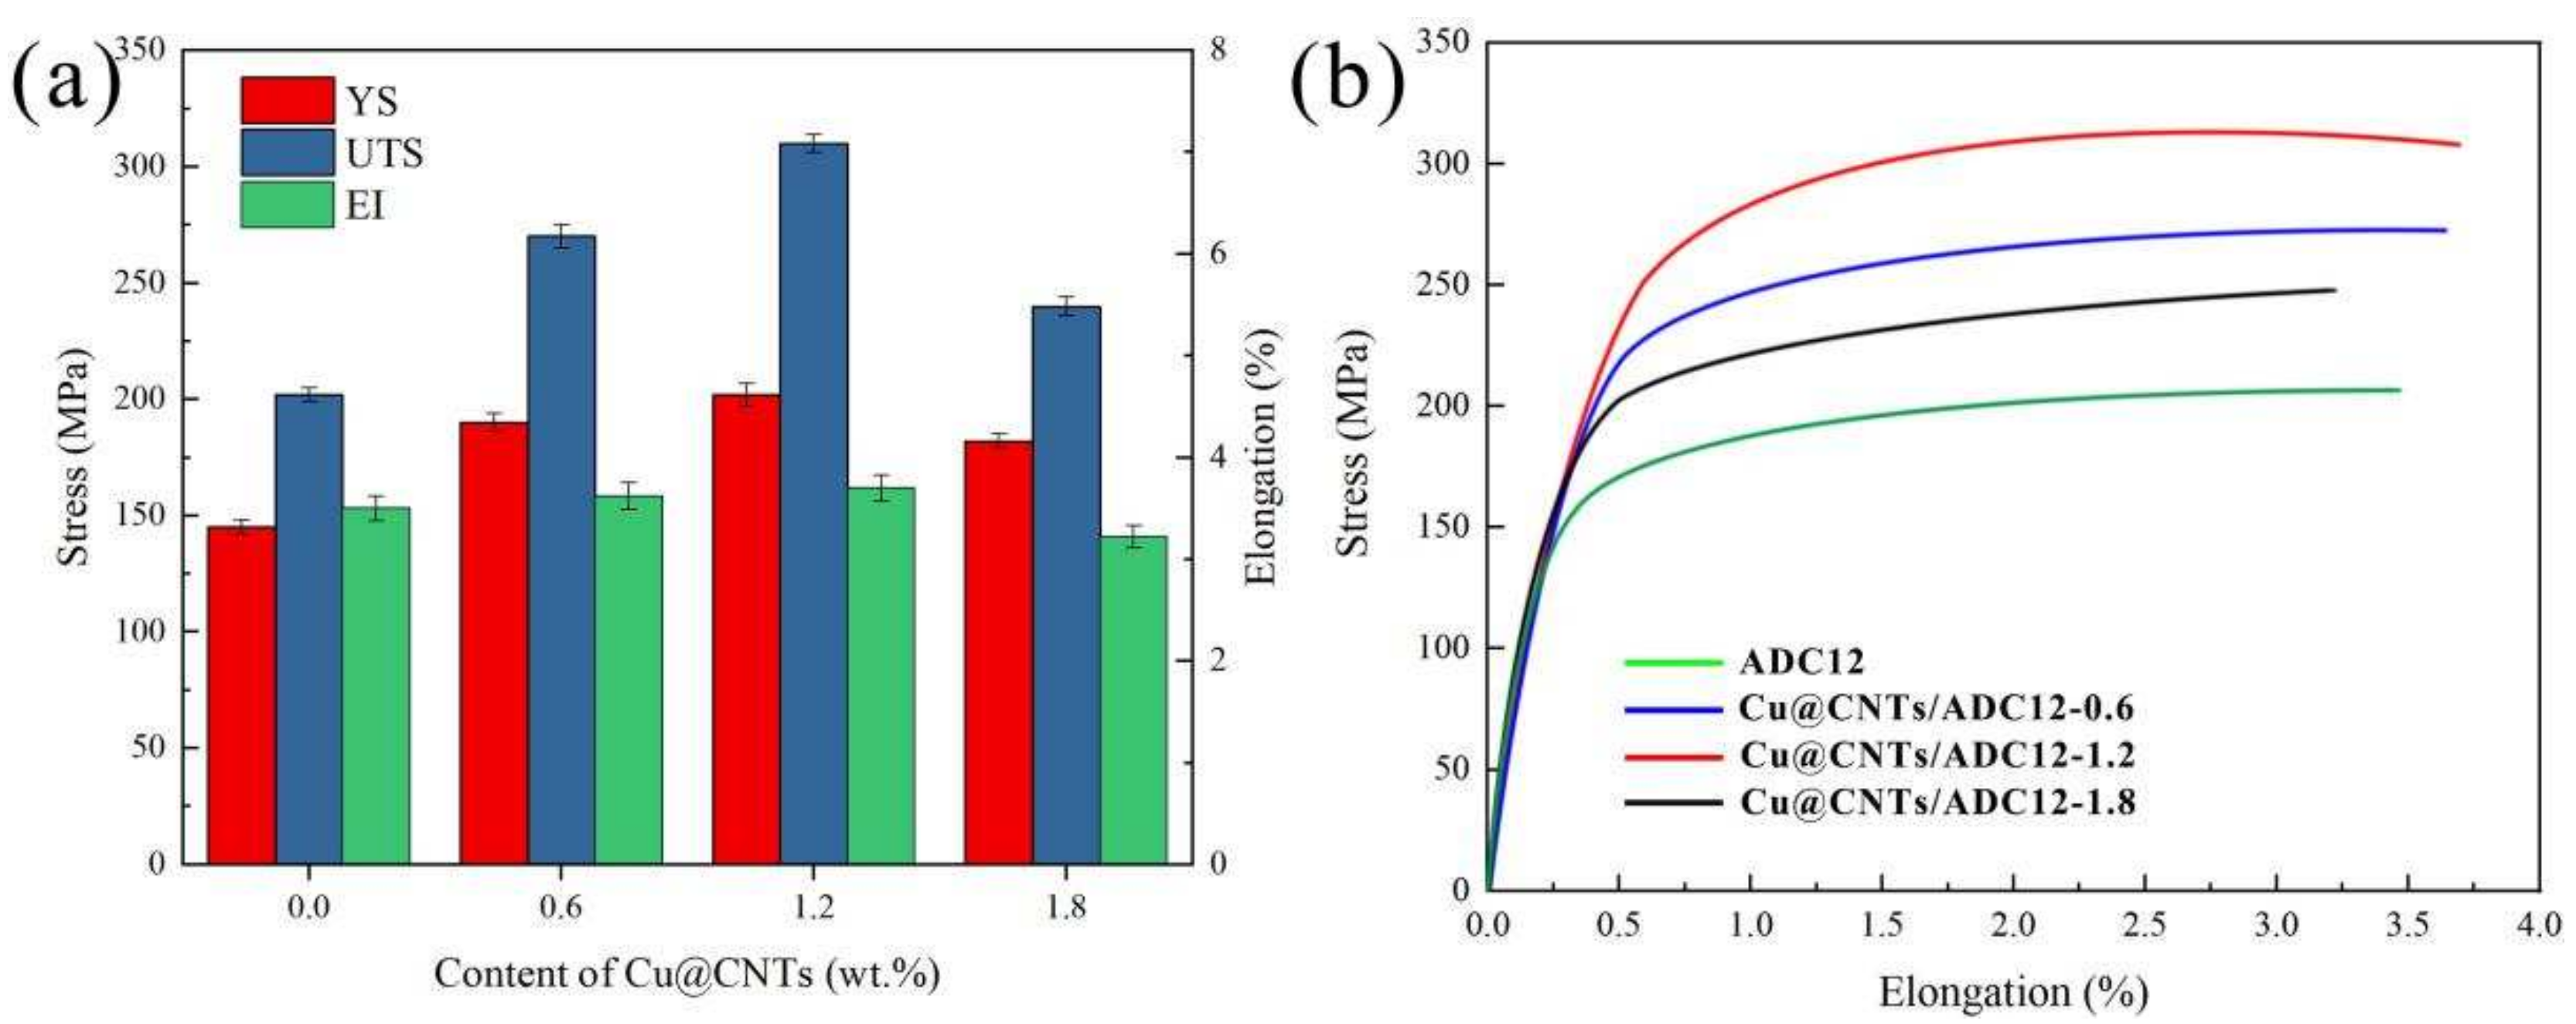
The mechanical properties of the ADC12 matrix and Cu@CNT/ADC12 composites are illustrated in Figure 9, and the data are listed in Table 2. The YS, UTS, and EI of ADC12 were 145 MPa, 202 MPa, and 3.51%, respectively. With the increase in Cu@CNT content, the YS, UTS, and EI of Cu@CNT/ADC12-0.6 reached 190 MPa, 270 MPa, and 3.62%, respectively, while those of Cu@CNT/ADC12-1.2 were 202 MPa, 310 MPa, and 3.71%, respectively. Compared with the ADC12 matrix, the Cu@CNT/ADC12-1.2 composite displayed a 39.3% increase in YS, 53.5% in UTS, and 5.7% in EI. However, when the addition of Cu@CNTs was 1.8 wt%, the YS and UTS were still higher than the original ADC12 matrix at 182 MPa and 240 MPa, respectively, but the EI was lower than the original ADC12 matrix at 3.22%. The results show that adding the appropriate amount of Cu@CNTs into the ADC12 matrix can improve the tensile properties of the matrix, but when the content of Cu@CNTs is too high, the elongation of the composite is lower than that of the matrix. This result is consistent with the previous characterization of microstructure morphology.

Figure 9.
The mechanical properties of the ADC12 matrix and Cu@CNT/ADC12 composites: (a) The yield strength, ultimate tensile strength, and elongation, (b) stress–strain curves.
Table 2.
Mechanical properties of ADC12 matrix and different Cu@CNT/ADC12 composites.
4. Ultrasonic Cavitation Model
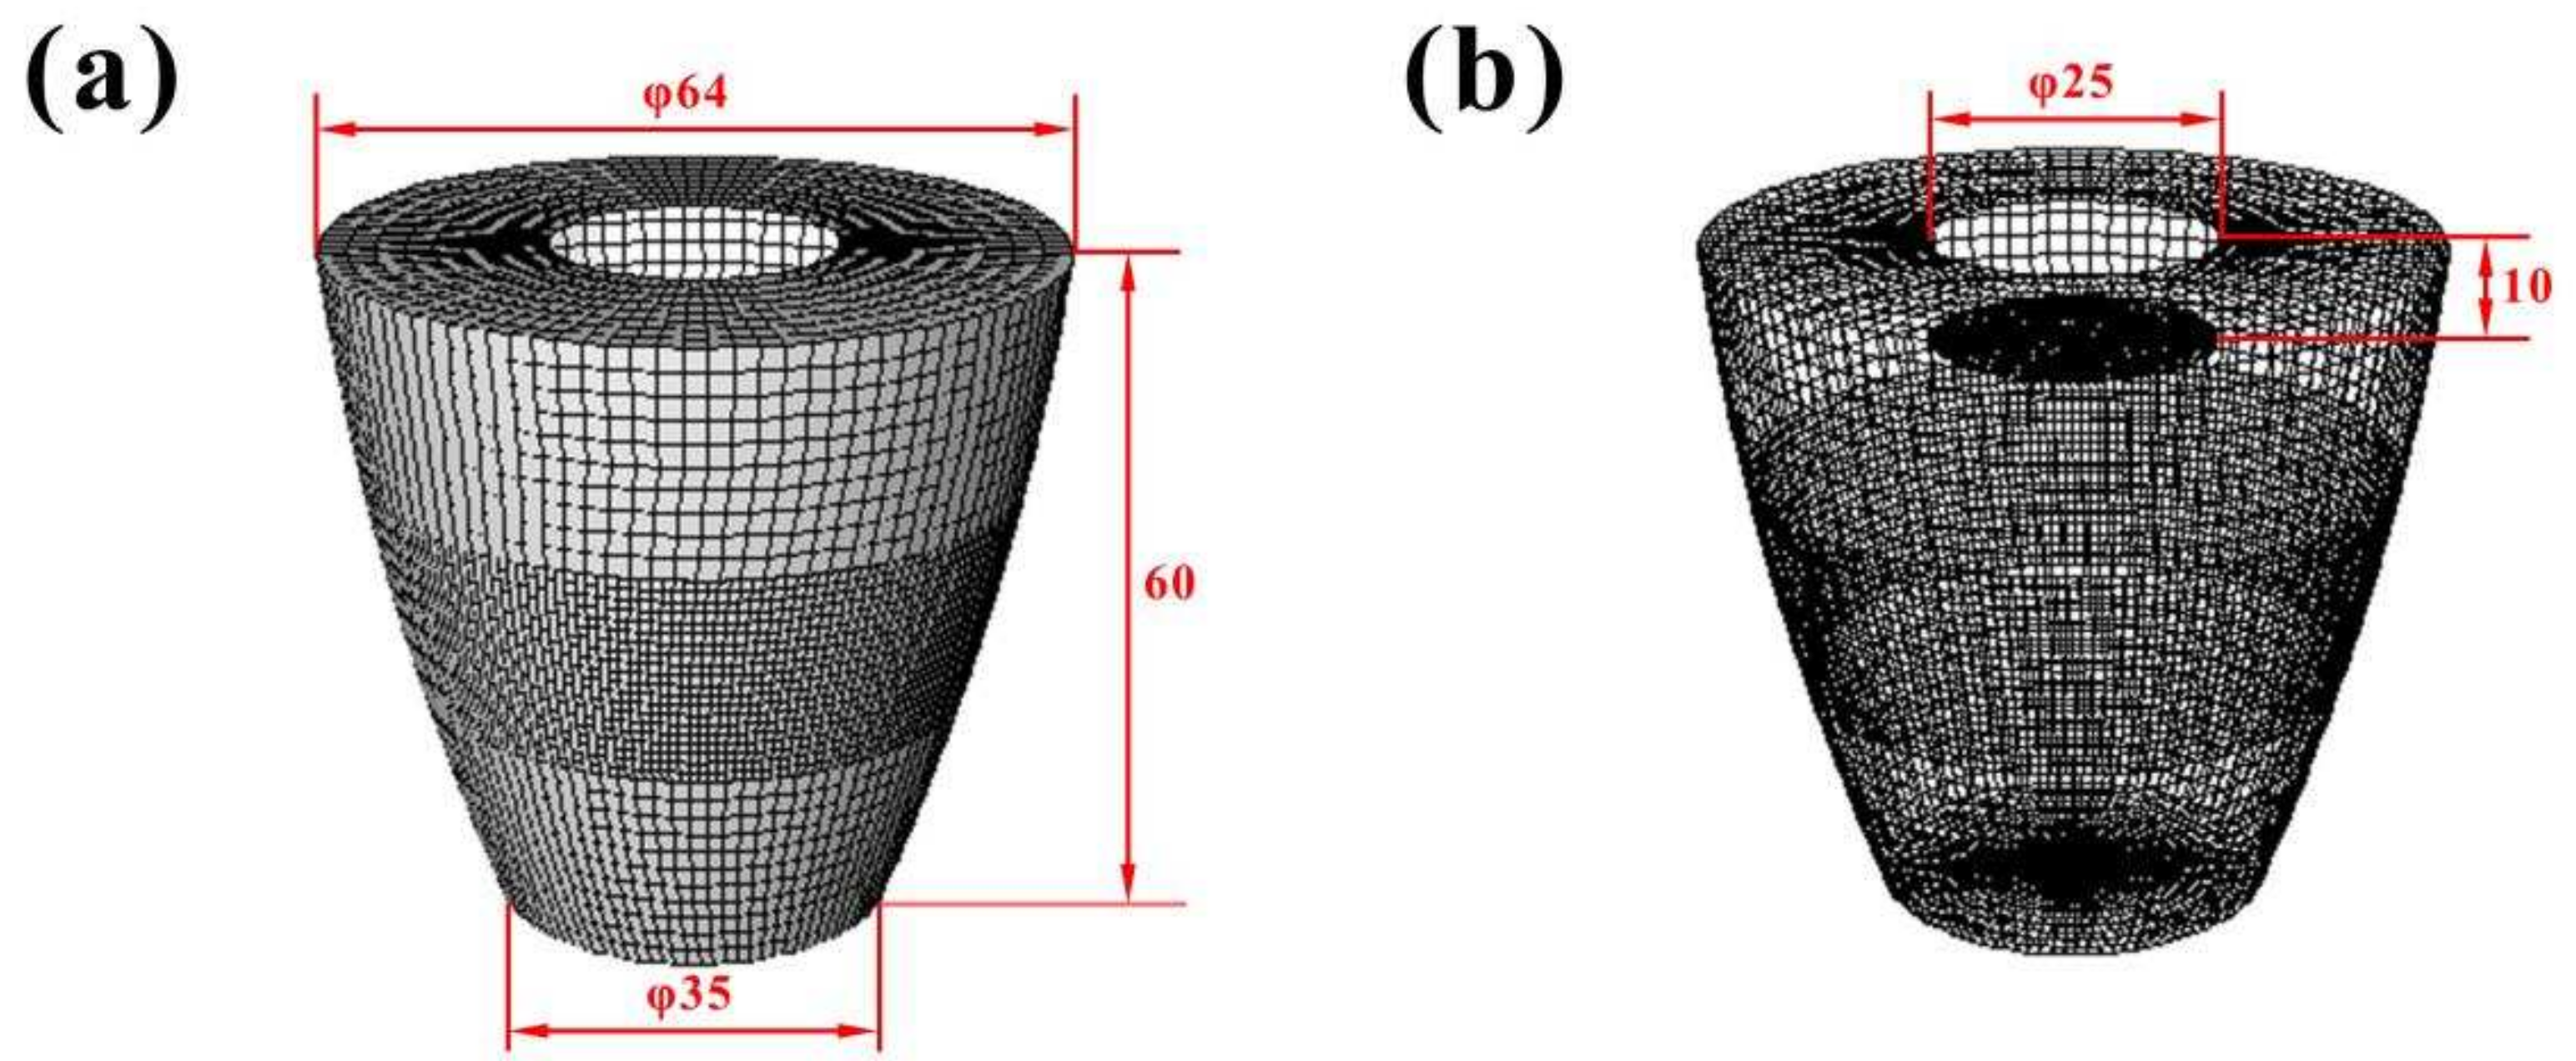
Figure 10 shows the ultrasonic cavitation model drawn by the computational fluid dynamics (CFD) module in the Fluent 19.0 software. Figure 10a shows the filled crucible model. The bottom diameter of the crucible was 35 mm, the top diameter was 64 mm, and the height was 60 mm. Figure 10b presents the hollowed-out diagram of the crucible model, from which it can be seen that the diameter of the ultrasonic probe was 25 mm, and the distance between the bottom and the liquid surface was 10 mm, which is consistent with the experimental data. The ultrasound was introduced from the bottom of the ultrasonic probe. In the model, the bottom surface of the ultrasonic horn was set as a dynamic grid, which was used as the ultrasonic vibration boundary. The wall of the crucible adopted the no slip boundary condition, the free liquid surface was the pressure inlet, and its surface pressure was set to zero. Phase 1 was the liquid phase of ADC12 matrix, and Phase 2 was the Cu@CNT enhancement phase. Cu@CNTs were added to the melt in the form of prefabricated blocks. Using the mixture multiphase flow model provided by Fluent 19.0 software, the two solid-liquid terms were regarded as a continuum passing through each other. Fluid flow followed the mass conservation equation, momentum conservation equation, and energy conservation equation.
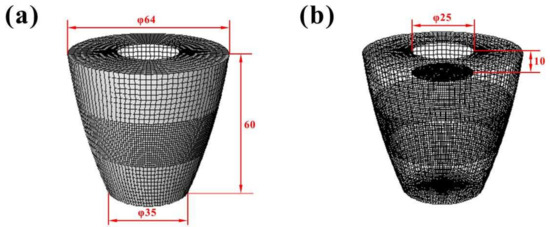
Figure 10.
Mesh division model: (a) the filled crucible model, (b) the hollowed-out diagram of the crucible model.
The continuity equation is:
The momentum equation is:
In Equations (5) and (6), ρ is the mixed density; t (s) is the time; vi,j,h is the velocity component of the x, y, and z axes; xi,j,h is the node coordinates of the x, y, and z axes; μ and μl are the viscosity coefficients of laminar flow and turbulence respectively; and gi is the gravitational component of the x axis.
The k-ε standard turbulence model was selected. The equations for turbulent kinetic energy k and turbulent dissipation rate ε are as follows [27]:
where Gk is the turbulent kinetic energy generated by the average velocity gradient; Gb is the turbulent kinetic energy generated by buoyancy; Ym is the effect of fluctuating expansion on the turbulent dissipation rate; δk is the turbulent Prandt number of the turbulent kinetic energy equation; δε is the turbulent Prandt number of the turbulent dissipation rate equation; C1ε, C2ε, and C3ε are constants; and Sk and Sε are user-defined source terms.
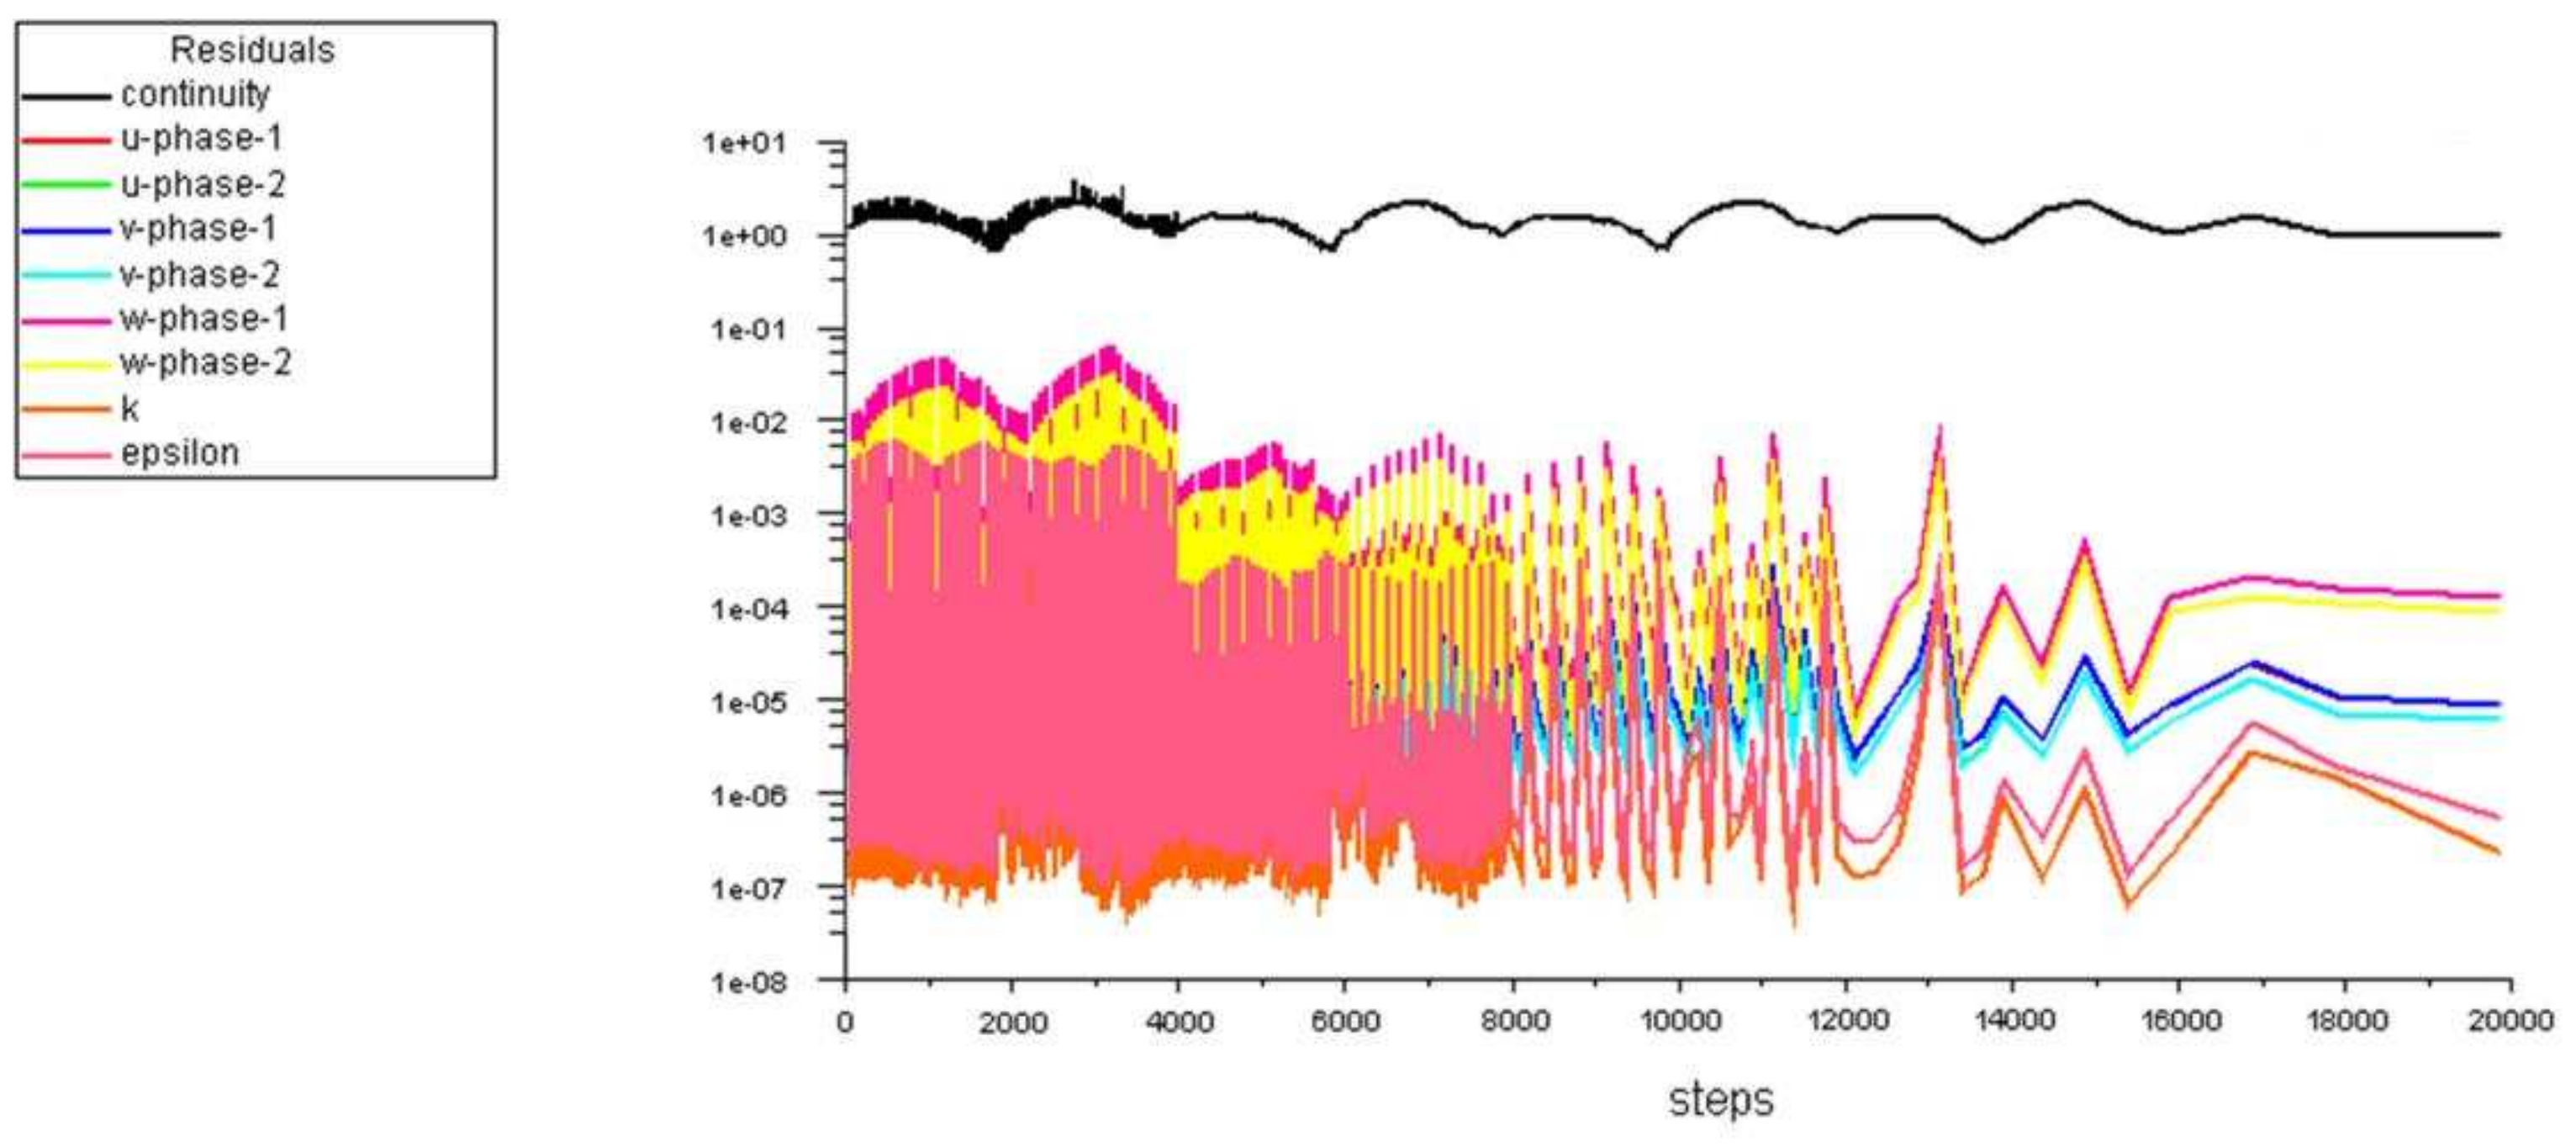
An ultrasonic wave refers to a sound wave with a frequency higher than 20 kHz, which has the advantages of good directivity, strong penetration, being easy to obtain, more concentrated sound energy, etc. The effects of ultrasonic waves in a metal melt include cavitation effects and acoustic streaming effects. In this study, the ultrasonic power and frequency were 2.1 kW and 20 kHz, respectively. In previous studies, it was found that under these parameters, the cavitation effects and acoustic streaming effects of ultrasound in melt produced the best effect [28]. The time step was set to 1 × 10⁻⁶ s, the total number of steps was 105, the pressure base solver was selected for solving, and the control equation was selected in the first-order upwind discrete format. Figure 11 shows the residual plot. The continuity of ultrasound was basically maintained at about 1, the other indicators did not diverge and tended to be stable, and the residual values were less than 1 × 10⁻⁴ s, indicating that the simulation results are reliable [29]. The different colored curves in the figure represent indicators corresponding to different compositions. The u, v, and w are respectively represented by the momentum residuals in the x, y, and z directions, the k and epsilon are respectively represented by the turbulent kinetic energy residual and turbulent dissipation rate residual.

Figure 11.
Residual plot. (Phase 1 is the ADC12 matrix phase; Phase 2 is the Cu@CNT enhancement phase; u, v, and w are respectively represented by the momentum residuals in the x, y, and z directions; and k and epsilon are respectively represented by the turbulent kinetic energy residual and turbulent dissipation rate residual.).
Figure 12 shows the velocity vector diagrams of the flow field at different time periods during the ultrasound. Figure 12a shows the velocity vector diagram of the flow field at the 100th step of the ultrasound, which indicates that the melt flowed downward with the propagation direction of the acoustic wave at the beginning of ultrasound, and that the flow occurred only in the fluid directly below the ultrasound probe. During this process, many tiny bubbles were created inside the melt. Figure 12b shows the velocity vector diagram of the flow field during the 2000th step of the ultrasound; at this time, the flow field in the melt flowed downward from the middle, reached the bottom, spread out in all directions, and exhibited the tendency of upward reflux, forming a ring-shaped closed loop. The velocity in the middle of the flow field was the largest, and arrows in different directions appear in the parts closer to the ultrasonic probe, indicating that fluid collision may have occurred here. At that time, the tiny bubbles were evenly distributed into the melt under the drive of sound flow, and some bubbles began to grow under the action of positive and negative sound pressure. Figure 12c shows the velocity vector diagram at the 10,000th step of ultrasonication; the velocity of the flow field in the melt was small. Paradoxically, in the parts closer to the ultrasonic probe, the direction of the velocity of the flow field was opposite of the direction of the propagation of the ultrasonic wave, which may have been due to the turbulence phenomenon in the flow field in the melt after ultrasonication for a period of time. At this stage, the bubble’s ability to withstand the impact reached the limit and cracked, which had a great impact on the surrounding melt, resulting in a disturbance in the direction of the melt sound flow. The fragmentation of dendrites and the dispersion of CNTs also occurred at this stage. When the ultrasonic time was long enough, as shown in Figure 12d, the direction of the flow field in the melt gradually became regular; the overall direction of the flow field in the middle of the melt was consistent with the direction of the ultrasonic wave propagation. The overall velocity of the flow field was larger, and the surrounding area of the melt still showed a tendency to diffuse in all directions and return upward. At this time, fine free crystals and dispersed CNTs were carried to various parts of the melt by acoustic flow, which also reflects the role of ultrasound on the melt. However, as can be seen from the four graphs, in the horizontal direction of the ultrasonic probe, the melt flow was small, so the ultrasound for the melt mainly lay in the region below the ultrasonic probe. To sum up, according to the ultrasound, the distribution of the flow field in the melt presented four stages: the beginning of flow, the formation of the circuit, the occurrence of turbulence, and the stability of the reflux. This is consistent with our experimental results.
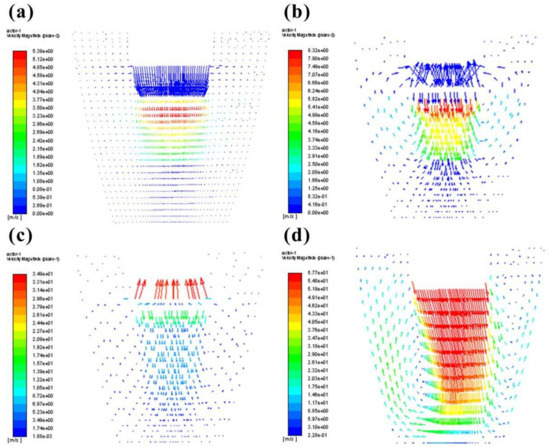
Figure 12.
Velocity vector diagram of flow field: (a) 100 steps, (b) 2000 steps, (c) 10,000 steps, (d) 20,000 steps.
5. Discussion
5.1. Mechanism of Ultrasonic Action
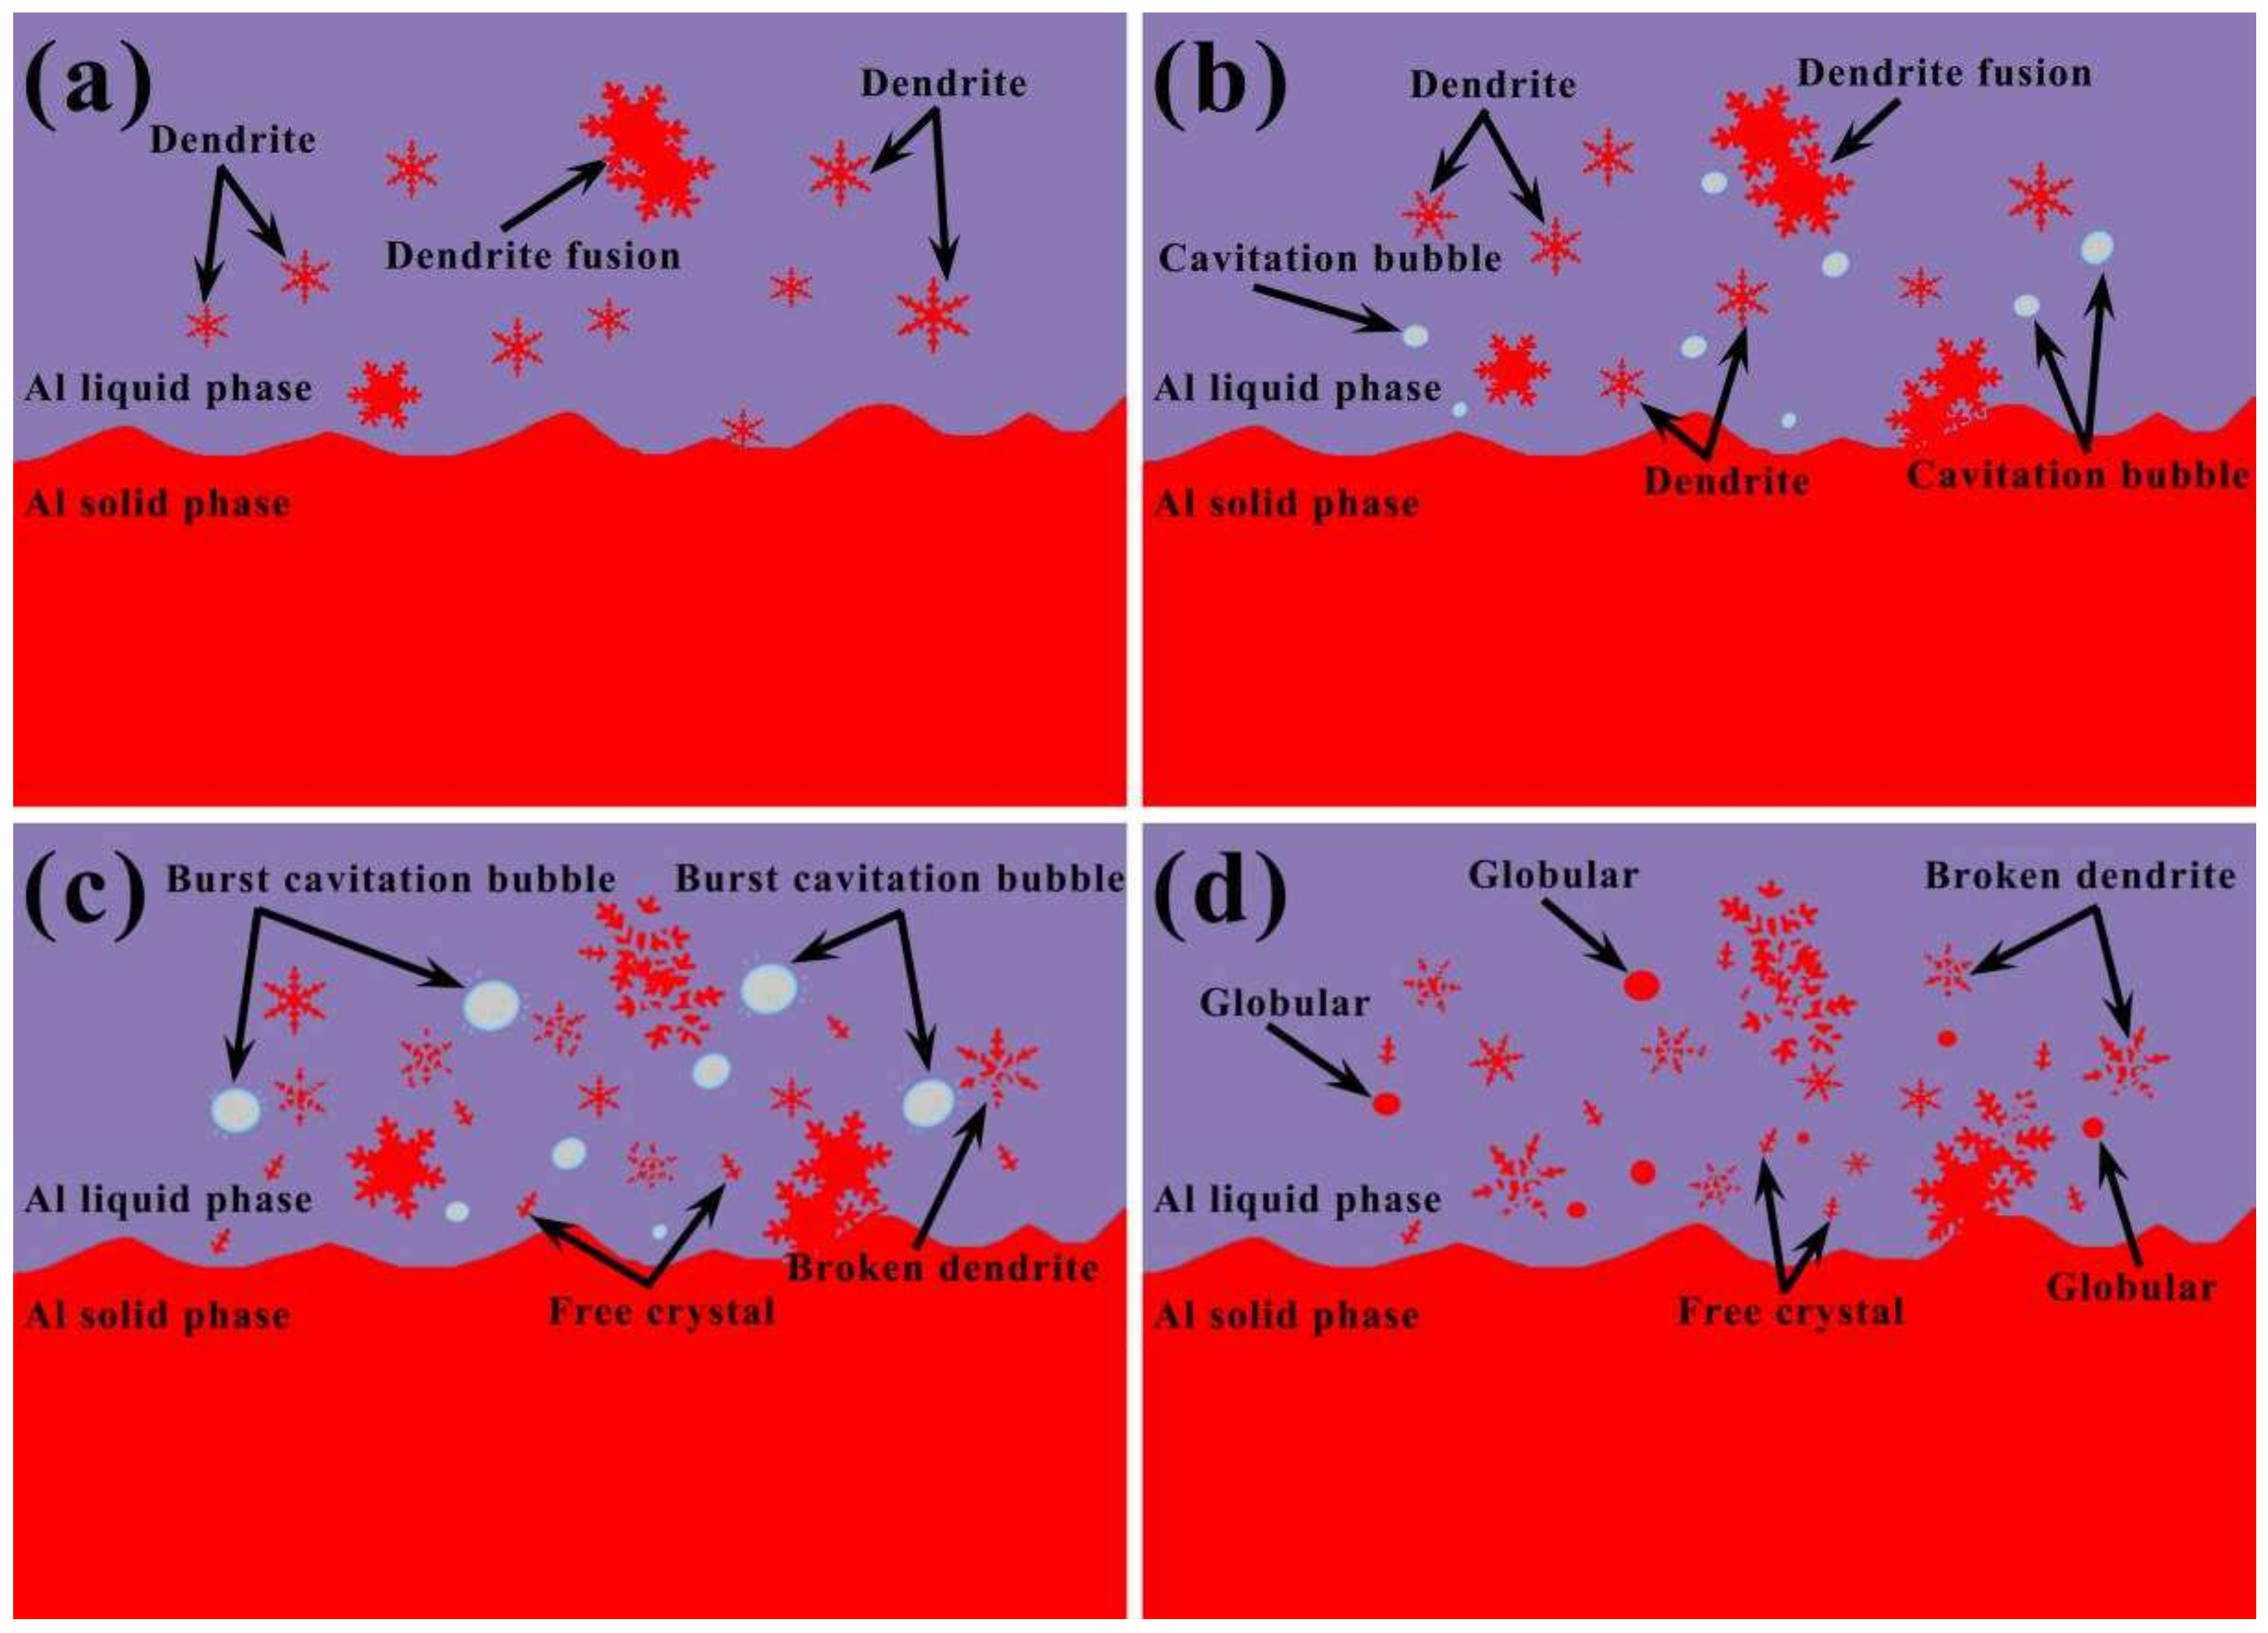
Ultrasonication can refine α-Al grains, which is mainly attributed to the cavitation effect and acoustic streaming effect induced by high-energy ultrasound in the melt. During high-energy ultrasonication, a large number of cavitation bubbles are formed in the melt. These cavitation bubbles collapse at a certain peak acoustic pressure and generate a shock wave with a short duration and high frequency. Moreover, the cavitation phenomenon is continuous, so the growing crystals are broken and shattered by the sharp impact of the shock wave. At the same time, the stirring effect of the acoustic stream can also make the dendrite broken, inhibit the growth of grains, and play the role of grain refinement [30]. In addition, the dispersion of broken dendrites and CNTs can also be attributed to acoustic streaming effects.
Before ultrasonication, with the increase in holding time, the grains continue to grow and show as dendritic, as shown in Figure 13a. As ultrasound acts on the melt, many cavitation bubbles are generated in the melt, and these cavitation bubbles grow continuously under the impact of positive and negative sound pressure until the cavitation bubbles burst. At the moment the bubbles collapse, a huge shock wave is generated, which is enough to break the dendrites around the cavitation bubbles, and the broken dendrites are carried to various parts of the melt by the acoustic stream, as shown in Figure 13b,c. In addition, the expansion and collapse of cavitation bubbles takes away a lot of heat, resulting in a rapid decrease in the temperature of the melt around them, so that a large number of crystal nuclei are formed in the melt [31]. These nuclei slowly grow in the melt, forming small and rounded grains, as shown in Figure 13d.
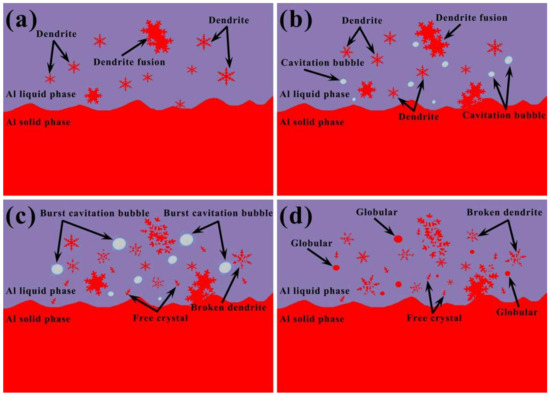
Figure 13.
The schematic diagram of the mechanism of ultrasonic action: (a) before ultrasonic vibration, (b) initiation of ultrasonic vibration, (c) duration of ultrasonic vibration, (d) after ultrasonic vibration.
5.2. Strengthening Mechanism of Cu@CNTs in the ADC12 Matrix
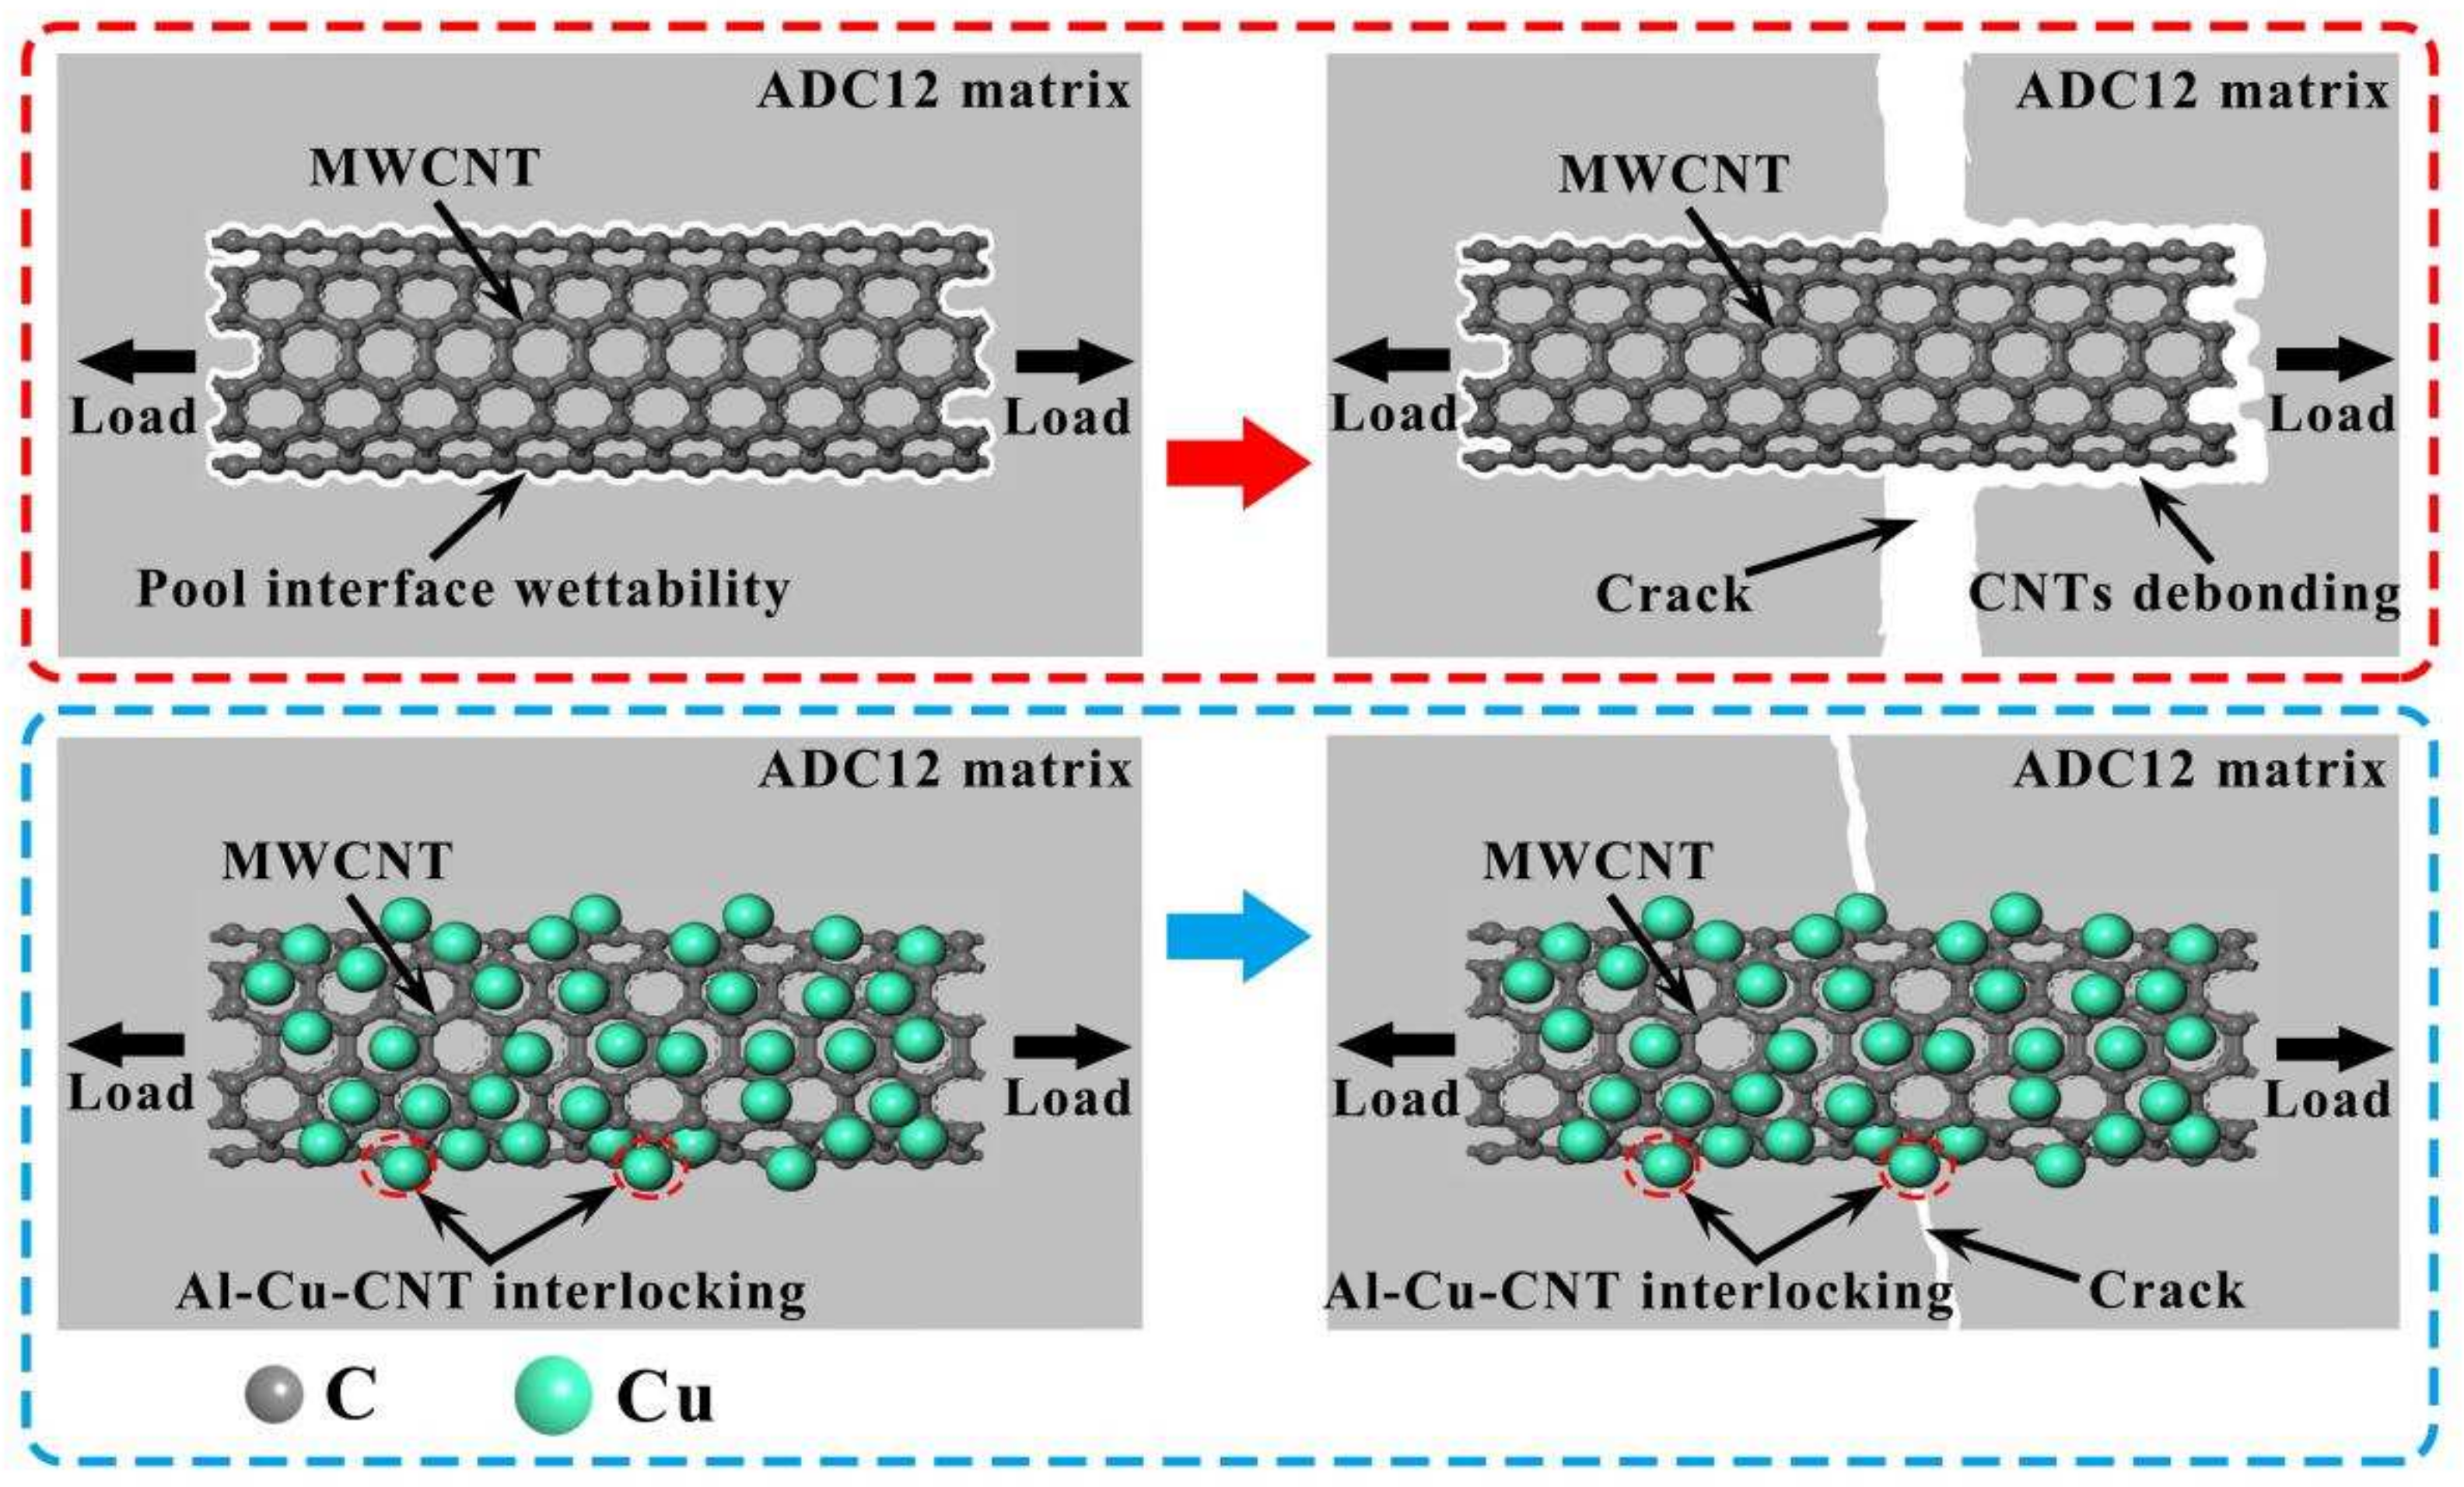
The red dashed box in Figure 14 represents the schematic diagram of the failure process of the raw CNTs. The unmodified raw CNTs have poor interfacial wettability with the ADC12 matrix due to their smooth surface and complete structure, making it difficult to establish strong connections. When the composites are subjected to tensile stress, the raw CNTs are directly stripped from the ADC12 matrix, making it difficult to exert the bearing capacity of CNTs, resulting in easy fracture of the composite under tensile stress and poor tensile properties. In addition, when there are some defects on the surface of the CNTs, they react with the aluminum matrix to form a brittle Al4C3 phase, resulting in weaker mechanical properties of the composite [32].
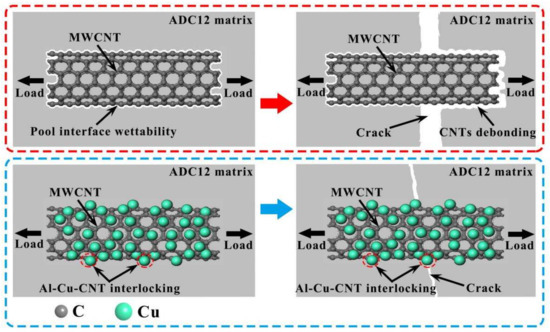
Figure 14.
The schematic diagram of strengthening mechanism of Cu@CNTs in ADC12 matrix.
The strengthening process of Cu@CNTs is shown in the blue dashed box in Figure 14. A large number of Cu nanoparticles are attached to the surface of CNTs after surface modification, which greatly improves the wettability of CNTs and the ADC12 matrix. When the composite is subjected to tensile stress, the Cu nanoparticles are simultaneously connected to the CNTs and ADC12 matrix as a bridge to form an Al-Cu-CNT interlocking structure. This can effectively transfer the load to the CNTs and prevent the composite material from premature failure during the loading process, which further achieves the strengthening and toughening effect [33,34]. In addition, Cu nanoparticles can modify the surface defects of CNTs, reduce the reactivity at the defects, and prevent the formation of a large number of brittle Al4C3 phase particles [35,36,37]. Moreover, Cu nanoparticles react with the ADC12 matrix to form Al2Cu intermetallic compounds, which reduce the interfacial energy between the CNTs and the ADC12 matrix and weaken the reaction between them [38].
6. Summary
(1) The Cu@CNT reinforcement was prepared by the composite reduction method. The Cu nanoparticles were uniformly distributed on the surface of CNTs and mostly covered the whole surface of CNTs. The Cu@CNT/ADC12 composite material was successfully prepared by high-energy ultrasonic-assisted casting. The coating of Cu nanoparticles on the surface of CNTs increased the bonding strength between CNTs and the ADC12 matrix, effectively transferring the load to the CNTs, preventing premature failure of the composite during loading and achieving further strengthening and toughening effects.
(2) With the increase in Cu@CNT content, the α-Al phase and the eutectic Si phase were obviously refined. However, when the content of Cu@CNTs exceeded a certain amount, the α-Al phase and eutectic Si phase were no longer refined, but increased. The mechanical properties of the composites also showed a tendency of increasing first and then decreasing, which was attributed to the aggregation of Cu@CNTs in the structure when adding excessive amounts of Cu@CNTs.
(3) The composite with 1.2 wt% Cu@CNTs had the best microstructure morphology and the best mechanical properties. The YS, UTS, and EI of the Cu@CNT/ADC12-1.2 composite were 202 MPa, 310 MPa, and 3.71%, respectively. Compared with the ADC12 matrix, the Cu@CNT/ADC12-1.2 composite displayed a 39.3% increase in YS, 53.5% in UTS, and 5.7% in EI. The improvement in the mechanical properties of the composites can be attributed to the grain refinement and the load-bearing effect of CNTs.
(4) The mechanism of ultrasound included two parts: the cavitation effects and acoustic streaming effect. The main function of the cavitation effect was to make the bubbles in the melt burst and produce an instantaneous impact force, which can break the massive dendritic structure and achieve the effect of grain refinement. The acoustic streaming effect induced by ultrasound further promoted the uniform dispersion of CNTs in the matrix. Under the action of acoustic streaming, the broken dendrites were evenly distributed in the solution, forming new nucleation sources and promoting nucleation.
Author Contributions
Conceptualization, X.D.; methodology, X.D.; investigation, X.D. and M.Z.; validation, X.D.; writing—original draft, X.D.; software, X.D.; visualization, M.Z.; supervision, H.Y.; funding acquisition, H.Y.; writing—review and editing, H.Y. All authors have read and agreed to the published version of the manuscript.
Funding
This research was funded by the National Natural Science Foundation of China (No. 51965040).
Institutional Review Board Statement
Not applicable.
Informed Consent Statement
Not applicable.
Data Availability Statement
The data presented in this study are available on request from the corresponding author. The data are not publicly available due to privacy.
Conflicts of Interest
The authors declare no conflicts of interest.
References
- Prakash, J.A.; Shanmughasundaram, P.; Sreelakshmy, P.S. Optimization of mechanical, tribological and machining parameters of aluminium MMC’s LM6 and ADC12. Mater. Today Proc. 2021, 37, 1996–2000. [Google Scholar] [CrossRef]
- Zhang, J.-D.; Zhang, L.; Ma, H.-Z. Effect of ZrO2 additions on the microstructure, mechanical and wear properties of ZrO2/7075 aluminium alloy composite. Mater. Today Commun. 2023, 37, 107437. [Google Scholar] [CrossRef]
- Okayasu, M.; Sahara, N.; Mayama, N. Effect of the microstructural characteristics of die-cast ADC12 alloy controlled by Na and Cu on the mechanical properties of the alloy. Mater. Sci. Eng. A 2022, 831, 142120. [Google Scholar] [CrossRef]
- Siengchin, S. A review on lightweight materials for defence applications: Present and future developments. Def. Technol. 2023, 24, 1–17. [Google Scholar] [CrossRef]
- Kuz’Min, M.; Kuz’Mina, M.; Kuz’Mina, A. Production and properties of aluminum-based composites modified with carbon nanotubes. Mater. Today Proc. 2019, 19, 1826–1830. [Google Scholar] [CrossRef]
- Liu, G.; Zhang, H.; Kan, D.; Tang, S.; Chen, Z. Experimental study on physical and mechanical properties and micro mechanism of carbon nanotubes cement-based composites. Fuller. Nanotub. Carbon Nanostruct. 2022, 30, 1252–1263. [Google Scholar] [CrossRef]
- Ouyang, Y.; Yang, Z.; Long, T.; Tian, H.; Bai, L.; Li, X.; Yuan, F. Preparation of branched Al2O3 and its synergistic effect with carbon nanotubes on the enhancement of thermal conductive and electrical insulation properties of silicone rubber composites. Mater. Today Commun. 2023, 34, 105239. [Google Scholar] [CrossRef]
- Čelko, L.; Menelaou, M.; Casas-Luna, M.; Horynová, M.; Musálek, T.; Remešová, M.; Díaz-De-La-Torre, S.; Morsi, K.; Kaiser, J. Spark plasma extrusion and the thermal barrier concept. Met. Mater. Trans. B 2019, 50, 656–665. [Google Scholar] [CrossRef]
- Chen, B.; Li, Z.; Shen, J.; Li, S.; Jia, L.; Umeda, J.; Kondoh, K.; Li, J. Mechanical properties and strain hardening behavior of aluminum matrix composites reinforced with few-walled carbon nanotubes. J. Alloys Compd. 2020, 826, 154075. [Google Scholar] [CrossRef]
- Dzidziguri, E.; Vasiliev, A.; Nalivaiko, A.Y.; Ozherelkov, D.Y.; Zakharova, N.; Shinkaryov, A.; Gromov, A. In-situ synthesis and characterization of powdery nanocomposite “carbon nanotubes/nanoalumina”. Compos. Commun. 2020, 22, 100534. [Google Scholar] [CrossRef]
- Li, N.Y.; Yang, C.; Li, C.J.; Guan, H.D.; Fang, D.; Tao, J.M.; Liu, Y.C.; Yi, J.H. Carbon nanotubes reinforced aluminum matrix composites with high elongation prepared by flake powder metallurgy. Diam. Relat. Mater. 2020, 107, 107907. [Google Scholar] [CrossRef]
- Perez-Bustamante, R.; Bueno- Escobedo, J.L.; Jimenez-Lobato, J.; Estrada-Guel, I.; Miki-Yoshida, M.; Licea-Jiménez, L.; Martínez-Sánchez, R. Wear behavior in Al2024-CNTs composites synthesized by mechanical alloying. Wear 2012, 292, 169–175. [Google Scholar] [CrossRef]
- He, C.; Zhao, N.; Shi, C.; Du, X.; Li, H.; Cui, Q. An approach to obtaining homogeneously dispersed carbon nanotubes in Al powders for preparing reinforced Al-Matrix composites. Adv. Mater. 2007, 19, 1128–1132. [Google Scholar] [CrossRef]
- Liu, S.-Y.; Gao, F.-P.; Zhang, Q.-Y.; Zhu, X.; Li, W.-Z. Fabrication of carbon nanotubes reinforced AZ91D composites by ultrasonic processing. Trans. Nonferrous Met. Soc. China 2010, 20, 1222–1227. [Google Scholar] [CrossRef]
- Mohammed, S.M.; Paul, T.; John, D.; Zhang, C.; Agarwal, A. Understanding the role of ultrasonic cavitation assisted casting of boron nitride nanotube-reinforced aluminum matrix composite. J. Mater. Res. Technol. 2023, 25, 2405–2418. [Google Scholar] [CrossRef]
- Srinivas, V.; Jayaraj, A.; Venkataramana, V.S.N.; Avinash, T.; Dhanyakanth, P. Effect of ultrasonic stir casting technique on mechanical and tribological properties of aluminium–multi-walled carbon nanotube nanocomposites. J. Bio- Tribo-Corros. 2020, 6, 30. [Google Scholar] [CrossRef]
- Ding, Y.; Jiang, H.; Wang, H.; Mao, D.; Zhang, Y.; Chen, Z.; Guo, X. Toughening and strengthening of Cu-coated carbon nanotubes reinforced AZ61 magnesium matrix nanocomposites by improving interfacial bonding. Diam. Relat. Mater. 2024, 142, 110788. [Google Scholar] [CrossRef]
- So, K.P.; Jeong, J.C.; Gil Park, J.; Park, H.K.; Choi, Y.H.; Noh, D.H.; Keum, D.H.; Jeong, H.Y.; Biswas, C.; Hong, C.H.; et al. SiC formation on carbon nanotube surface for improving wettability with aluminum. Compos. Sci. Technol. 2013, 74, 6–13. [Google Scholar] [CrossRef]
- Zhao, J.W.; Wu, S.S.; An, P.; Mao, Y.W. Preparation of semi-solid slurry of hypereutectic al-si alloy by ultrasonic vibration. Solid State Phenom. 2008, 141–143, 767–771. [Google Scholar] [CrossRef]
- Zeng, M.; Yan, H.; Li, K.; Lei, Y. Microstructure, wettability, and mechanical properties of ADC12 alloy reinforced with TiO2-coated carbon nanotubes. J. Alloys Compd. 2021, 897, 163181. [Google Scholar] [CrossRef]
- Zeng, M.; Wang, X.X.; Tan, Z.H.; Huang, X.X.; Wang, J.N. Remarkable durability of Pt–Ir alloy catalysts supported on graphitic carbon nanocages. J. Power Sources 2014, 264, 272–281. [Google Scholar] [CrossRef]
- Tang, Y.; Yang, X.; Wang, R.; Li, M. Enhancement of the mechanical properties of graphene–copper composites with graphene–nickel hybrids. Mater. Sci. Eng. A 2014, 599, 247–254. [Google Scholar] [CrossRef]
- Orel, Z.C.; Anžlovar, A.; Dražić, G.; Žigon, M. Cuprous Oxide Nanowires Prepared by an Additive-Free Polyol Process. Cryst. Growth Des. 2007, 7, 453–458. [Google Scholar] [CrossRef]
- Mishra, S.R. Ahmaruzzaman CuO and CuO-based nanocomposites: Synthesis and applications in environment and energy. Sustain. Mater. Technol. 2022, 33, 463. [Google Scholar] [CrossRef]
- Esawi, A.; Morsi, K.; Sayed, A.; Gawad, A.A.; Borah, P. Fabrication and properties of dispersed carbon nanotube–aluminum composites. Mater. Sci. Eng. A 2009, 508, 167–173. [Google Scholar] [CrossRef]
- George, R.; Kashyap, K.; Rahul, R.; Yamdagni, S. Strengthening in carbon nanotube/aluminium (CNT/Al) composites. Scr. Mater. 2005, 53, 1159–1163. [Google Scholar] [CrossRef]
- Wang, Y.; Guo, Q.; Ren, N.; Zhang, W.; Hu, S.; Zhang, Y.; Li, J.; Xia, M.; Li, J. Experimental and simulation studies of layer casting on industrial-scale Al-4.5 wt Pct Cu ingot: Effect, defect, and optimization. J. Mater. Process. Technol. 2023, 322, 118205. [Google Scholar] [CrossRef]
- Dong, X.; Wang, Y.; Xu, L.; Liu, Z.; Yan, H. Effect of high-energy ultrasound and mixed rare earths modification on microstructure of semisolid AlSi11Cu3 alloy. Int. J. Met. 2023, 17, 1191–1200. [Google Scholar] [CrossRef]
- Hedayat, A.; Davari, A. Feasibility study to increase the reactor power at natural convection mode in tehran research reactor (TRR) through a hybrid thermal-hydraulic simulation and analysis using the RELAP5 code and computational fluid dynamic (CFD) modeling by ANSYS-FLUENT. Prog. Nucl. Energy 2022, 150, 104285. [Google Scholar] [CrossRef]
- Haghayeghi, R.; Ezzatneshan, E.; Bahai, H. Grain refinement of AA5754 aluminum alloy by ultrasonic cavitation: Experimental study and numerical simulation. Met. Mater. Int. 2015, 225, 103–109. [Google Scholar] [CrossRef]
- Jian, X.; Han, Q. Formation of hypereutectic silicon particles in hypoeutectic Al-Si alloys under the influence of high-intensity ultrasonic vibration. China Foundry 2013, 10, 118. [Google Scholar] [CrossRef]
- Heydari, S.; Sajjadi, S.A.; Babakhani, A.; Eskandari, H.; Nateq, B. An investigation on the effect of Al4C3 on microstructure and mechanical properties of carbon nanotube reinforced aluminum composite. Ceram. Int. 2023, 49, 14024–14034. [Google Scholar] [CrossRef]
- Murugesan, R.; Gopal, M.; Murali, G. Effect of Cu, Ni addition on the CNTs dispersion, wear and thermal expansion behavior of Al-CNT composites by molecular mixing and mechanical alloying. Appl. Surf. Sci. 2019, 495, 143542. [Google Scholar] [CrossRef]
- Pérez-Bustamante, R.; Pérez-Bustamante, F.; Estrada-Guel, I.; Licea-Jiménez, L.; Miki-Yoshida, M.; Martínez-Sánchez, R. Effect of milling time and CNT concentration on hardness of CNT/Al2024 composites produced by mechanical alloying. Mater. Charact. 2013, 75, 13–19. [Google Scholar] [CrossRef]
- Lee, C.W.; Kim, I.H.; Lee, W.; Ko, S.H.; Jang, J.M.; Lee, T.W.; Lim, S.H.; Park, J.P.; Kim, J.D. Formation and analysis of SiC coating layer on carbon short fiber. Surf. Interface Anal. 2010, 42, 1231–1234. [Google Scholar] [CrossRef]
- Zhou, W.; Sasaki, S.; Kawasaki, A. Effective control of nanodefects in multiwalled carbon nanotubes by acid treatment. Carbon 2014, 78, 121–129. [Google Scholar] [CrossRef]
- Yuan, Q.H.; Zeng, X.S.; Wang, Y.C.; Luo, L.; Ding, Y.; Li, D.J.; Liu, Y. Microstructure and mechanical properties of Mg-4.0Zn alloy reinforced by NiO-coated CNTs. J. Mater. Sci. Technol. 2017, 33, 452–460. [Google Scholar] [CrossRef]
- Zeng, M.; Ling, Y.; Zhang, P.X.; Dong, X.J.; Li, K.; Yan, H. Improvement of interfacial interaction and mechanical properties in aluminum matrix composites reinforced with Cu-coated carbon nanotubes. Mater. Sci. Eng. A 2023, 870, 144918. [Google Scholar] [CrossRef]


Disclaimer/Publisher’s Note: The statements, opinions and data contained in all publications are solely those of the individual author(s) and contributor(s) and not of MDPI and/or the editor(s). MDPI and/or the editor(s) disclaim responsibility for any injury to people or property resulting from any ideas, methods, instructions or products referred to in the content. |
© 2024 by the authors. Licensee MDPI, Basel, Switzerland. This article is an open access article distributed under the terms and conditions of the Creative Commons Attribution (CC BY) license (https://creativecommons.org/licenses/by/4.0/).