Review

Phase Equilibrium Study of Rare Earth Oxide–Fluoride Salt System: A Review

by
Quan Zhou
1,
Jinfa Liao
1,2,*,
Chunfa Liao
1,2 and
Baojun Zhao
1,2,3
1
School of Metallurgical Engineering, Jiangxi University of Science and Technology, Ganzhou 341000, China
2
National Rare Earth Functional Materials Innovation Center, Ganzhou 341000, China
3
Sustainable Minerals Institute, The University of Queensland, Brisbane, QLD 4072, Australia
*
Author to whom correspondence should be addressed.
Metals 2024, 14(3), 314; https://doi.org/10.3390/met14030314
Submission received: 27 January 2024 / Revised: 28 February 2024 / Accepted: 4 March 2024 / Published: 7 March 2024

Abstract

:
The applications of rare earth metals and alloys are becoming increasingly widespread and there is a strong market demand. Currently, most of the production enterprises adopt the fluoride–oxide system for electrolytic preparation of rare earth metals and alloys. The solubility of rare earth oxides in molten salt directly affects the selection of operational parameters in the electrolysis process. When the added amount of RE2O3 is less than its solubility, it leads to a decreased electrolytic efficiency. Conversely, an excessive amount of oxide is prone to settle at the bottom of the electrolytic cell, impeding smooth production. The RE2O3 solubility in the fluoride salt can be represented by the phase equilibrium of the RE2O3-REF3-LiF system. The isothermal lines in the primary phase field of rare earth oxide represent the solubility of the oxide in the fluoride salt at the corresponding temperature. This paper outlines the research methods and experimental results on the phase equilibria of the RE2O3-REF3-LiF system. The characteristics and existing problems in the current phase equilibrium study are analyzed. The solubility data of RE2O3 are expressed in the forms of ternary and pseudo-binary phase diagrams of the RE2O3-REF3-LiF system, providing theoretical guidance for the establishment of an accurate and reliable rare earth electrolysis system database and the optimization of electrolytic processes.

1. Introduction

Rare earth metals and alloys are increasingly used in the field of new materials, and there is a strong market demand. Rare earth elements have unique physical and chemical properties due to their special electronic structures, such as excellent optical and electrical properties, magnetic properties, and active chemical properties. With the development of modern science and technology, REEs have become indispensable key materials for high-tech and novel functional materials [1,2].
In recent years, with the momentum of technological innovation and the ongoing revolution in global manufacturing, there have been significant changes in the consumption structure of REEs, with an increasing production of rare earth metals such as La, Ce, Nd, Pr, and Y [3,4,5]. The production of rare earth metals and alloys is an important component of the rare earth industry. Rare earth metals, being highly reactive, are usually produced from chloride or oxide raw materials using two major methods: metallothermic reduction and molten salt electrolysis. Compared with thermal reduction, molten salt electrolysis is a relatively economical method as it allows continuous production and easy control of product quality. It is currently widely used in the production of single rare earth metals, such as La, Ce, Pr, and Nd, and mixed rare earth metal alloys [6,7,8,9].
The production of rare earth metals and alloys by molten salt electrolysis can be divided into two categories: a chloride melt system and an oxide–fluoride melt system. The chloride melt system produces a large amount of generated toxic fumes such as Cl2 during the electrolysis process and has higher energy consumption, which does not comply with the low-carbon environmental concept. Moreover, the high vapor pressure of chloride melts and low metal recovery severely limit the development of chloride electrolysis, leading to the gradual elimination of this method domestically and internationally [10,11,12].
The technology for producing rare earth metals through oxide–fluoride melt system electrolysis has developed rapidly after resolving the corrosion resistance of fluoride salt on electrolytic cell materials. The electrolysis process achieves automated temperature control, feeding, and vacuum metal suction [13,14,15]. This process has stable raw materials, low pollution to the atmosphere, high current efficiency, and high rare earth recovery rate, which further promotes its technological development. After 2000, scaling up and automation of electrolytic cells have reached industrialized stable production levels [16]. The fluoride electrolysis system uses a LiF-REF3 mixture as the electrolyte (with the content of REF3 near the LiF-REF3 eutectic point) and rare earth oxide as the feed material. A small amount of RE2O3 is dissolved in the fluoride electrolyte, and is reduced to rare earth metals at the cathode, while oxygen is released at the anode, reacting with the carbon anode to form CO2 or CO. Although fluoride salts have a high melting point and strong corrosiveness, optimized electrolytic cells can avoid problems such as low metal recovery and difficulty in slag–metal separation. Moreover, they do not produce harmful chlorine gas. Therefore, most production companies currently use the oxide–fluoride electrolysis system to prepare rare earth metals [17,18].
In the process of producing rare earth metals through oxide–fluoride melt system electrolysis, REF3 and LiF form an electrolyte with a low melting point, low density, and high electrical conductivity. Under the action of electrical current, the dissolved RE2O3 is converted to rare earth metals and oxygen at the cathode and anode, respectively. As the electrolysis process progresses, the dissolved RE2O3 in the molten salt is continuously consumed, requiring continuous addition of RE2O3 to maintain a high concentration in the electrolyte [19,20,21]. When the amount of RE2O3 added to the molten salt is lower than its solubility, the electrolysis efficiency and productivity are low. Conversely, if the amount of RE2O3 added to the molten salt exceeds its solubility, the excess RE2O3, being denser than the REF3-LiF melt, tends to form deposits at the bottom of the electrolytic cell, increasing the cell resistance, affecting the metal purity, and even seriously impeding the smooth progress of production [22,23]. Therefore, the solubility of RE2O3 in the REF3-LiF-RE2O3 system provides the essential data for establishing a suitable feeding system in electrolytic production, playing an important role in improving electrolysis efficiency and maintaining the effective volume of the electrolytic cell. However, there have been significant differences in the solubility data of RE2O3 in the fluoride system, and the semi-empirical models developed based on these data have difficulty in accurately predicting the solubility of rare earth oxides [24,25].
A phase diagram is a graphical representation that quantitatively describes the states of phases in a system with respect to temperature, pressure, and composition [26]. Phase diagrams provide a visual reflection of thermodynamic information such as liquidus lines and primary crystal phases for different components in a system [27]. Pseudo-ternary and pseudo-binary phase diagrams have been widely applied in various fields such as metallic materials, ceramics, cement, refractories, and metallurgical industries. The solubility of rare earth oxides in the fluoride system is essentially the content of RE2O3 in the liquid phase saturated with the primary phase. Expressing the solubility of rare earth oxides in the fluoride system using phase diagrams not only allows the summary and comparison of the data obtained under various conditions but also enables the establishment of a thermodynamic database for the REF3-LiF-RE2O3 system based on experimental studies. The use of phase diagrams of the REF3-LiF-RE2O3 system helps in selecting appropriate compositions of molten salts (REF3:LiF) and electrolysis temperatures for molten salt electrolysis as needed. It also provides a theoretical basis for developing reasonable process routes for the production and resource recovery of rare earth metals and alloys [28,29,30,31,32,33].
In summary, the study of the phase equilibria of the rare earth oxide–fluoride melt systems is of great significance for establishing a thermodynamic database for molten salt electrolysis systems. The accurate and reliable information will be used for the optimization of the existing processes, development of new processes, and comprehensive utilization of rare earth molten salt electrolysis slags. This article provides a systematic summary and comparison of the research methods and experimental data on the phase equilibria of the RE2O3-REF3-LiF system, laying the foundation for standardized research methods and expression formats for the solubility of rare earth oxides in the fluoride system.

2. Methodology for the Phase Equilibrium Study of the RE2O3-REF3-LiF System

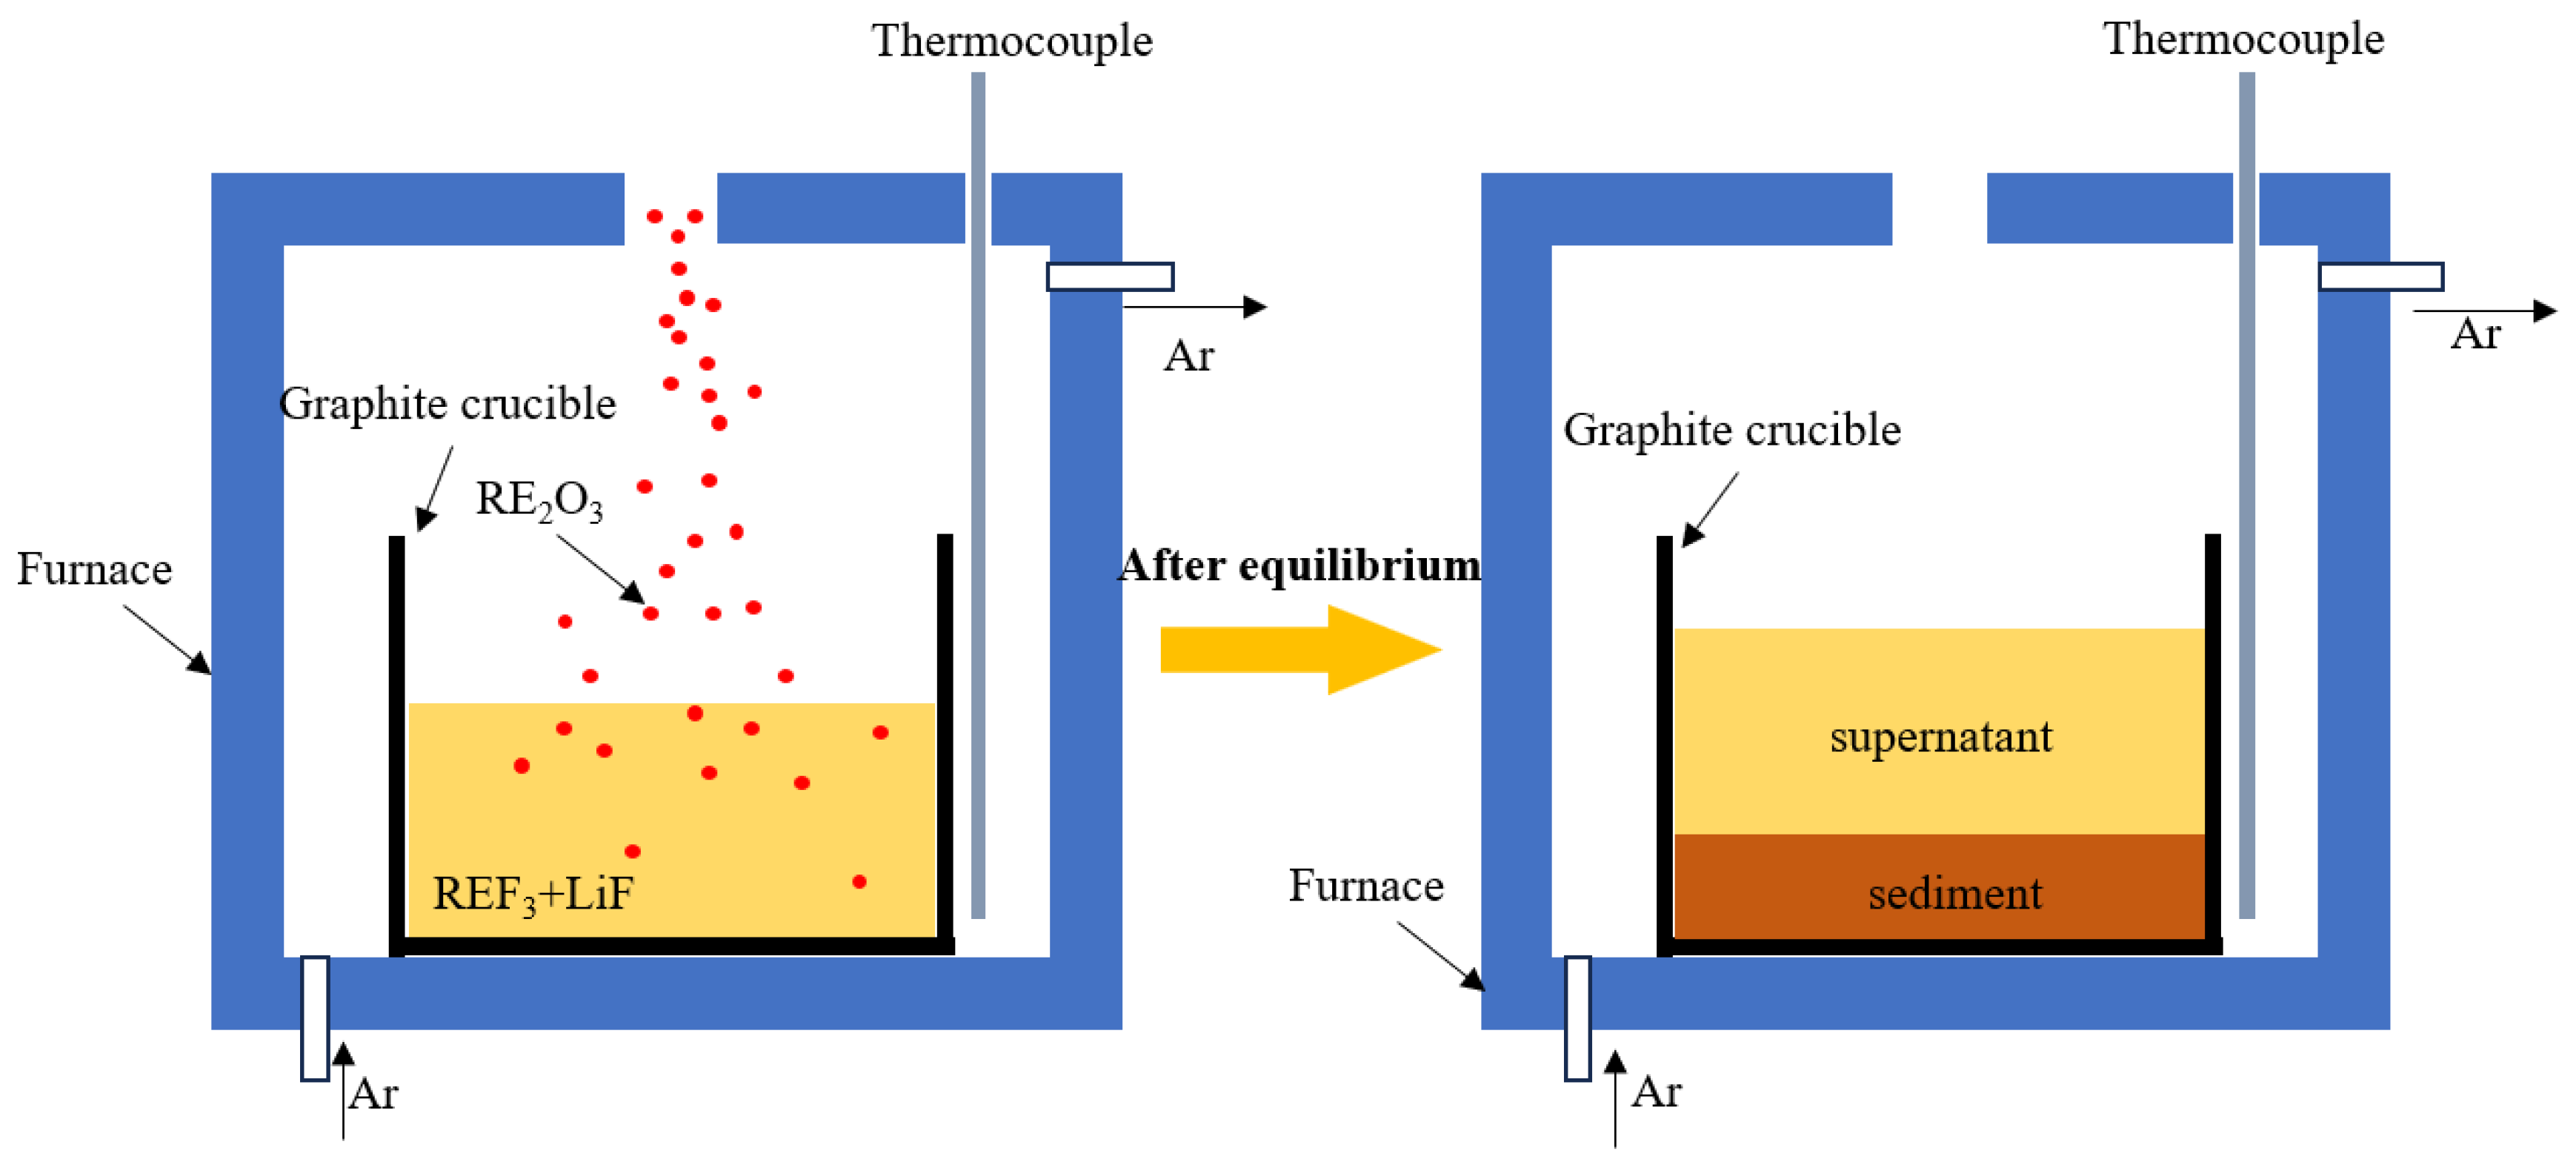
2.1. Isothermal Saturation Method

The isothermal saturation method is widely used to determine the solubility of RE2O3 in REF3+LiF molten salt at a given temperature by adding excess RE2O3 powder to a known proportion of REF3 + LiF melt and analyzing the concentration of RE2O3 in the supernatant after reaching equilibrium [34,35,36,37,38,39,40,41,42,43,44,45,46,47,48,49,50,51,52,53,54]. Figure 1 shows the schematic diagram of solubility determination using the isothermal saturation method. This method is favored due to its ease of operation and direct measurement of solubility data. However, the isothermal saturation method involves a series of issues, including equilibrium time, sampling, analysis, and side reactions.
In theory, REF3 + LiF molten salt has relatively low viscosity, and stirring is often employed during the measurement of RE2O3 solubility to accelerate the reaction. Hu et al. [39] demonstrated through experiments and calculations that, under the stirring condition of 150 r/min at 1030 °C, Nd2O3 can reach dissolution equilibrium in a 90% NdF3-9.5% LiF-0.5% RE2O3 solution within 30 min. Figure 2 illustrates the time required for Nd2O3 and La2O3 to reach saturation in the NdF3-LiF and NaF3-LiF system under different conditions, respectively. The relationships between the dissolved La2O3 and time in the %LiF-%NaF (680 °C) [46] and between the dissolved Nd2O3 and time in the %NdF3-%LiF system (800 °C) are shown in the figure. It can be clearly seen that saturation is reached in 3 h for Nd2O3 at 800 °C [35] and in 8 h for La2O3 at 680 °C [46]. This indicates that the dissolution of RE2O3 in REF3-LiF molten salt is complex.
In order to increase the dissolution rate of RE2O3, finer powders are typically added, which can result in the slow settling of undissolved oxide particles. During sampling of the supernatant, there is a possibility of inadvertently collecting and analyzing undissolved solid RE2O3, leading to a false result. Some researchers [19,37] have realized this issue and conducted X-ray diffraction (XRD) analysis of the cooled salt to confirm the presence of undissolved RE2O3 in the supernatant. However, the sensitivity of XRD is insufficient to detect undissolved RE2O3 in the supernatant. SEM observation could provide direct evidence. However, it was not used in these studies.
Most of the studies employed inductively coupled plasma (ICP) or chemical titration methods to analyze the concentration of rare earth elements in the supernatant after the equilibration, and then compared it with the initial REF3-LiF molten salt to determine the concentration of the dissolved oxide [46,47,49]. Some researchers directly analyzed the oxygen content in the supernatant and converted it to the concentration of the rare earth oxide [40]. These analytical methods assumed that there were no side reactions during the dissolution process, and that the total amount of Li and F in the molten salt remained constant. The increase in the rare earth ion concentration after the addition of oxide corresponded to its solubility. However, several studies [36,37,42] have found that, when excessive RE2O3 was added to the molten salt, the concentration of rare earth ions in the liquid phase decreased. As shown in Figure 3a,b, the concentrations of the rare earth ions at their maximum determined the solubility of the rare earth oxides. This behavior of RE3+ variation introduced significant uncertainty in the results obtained from the isothermal saturation method.

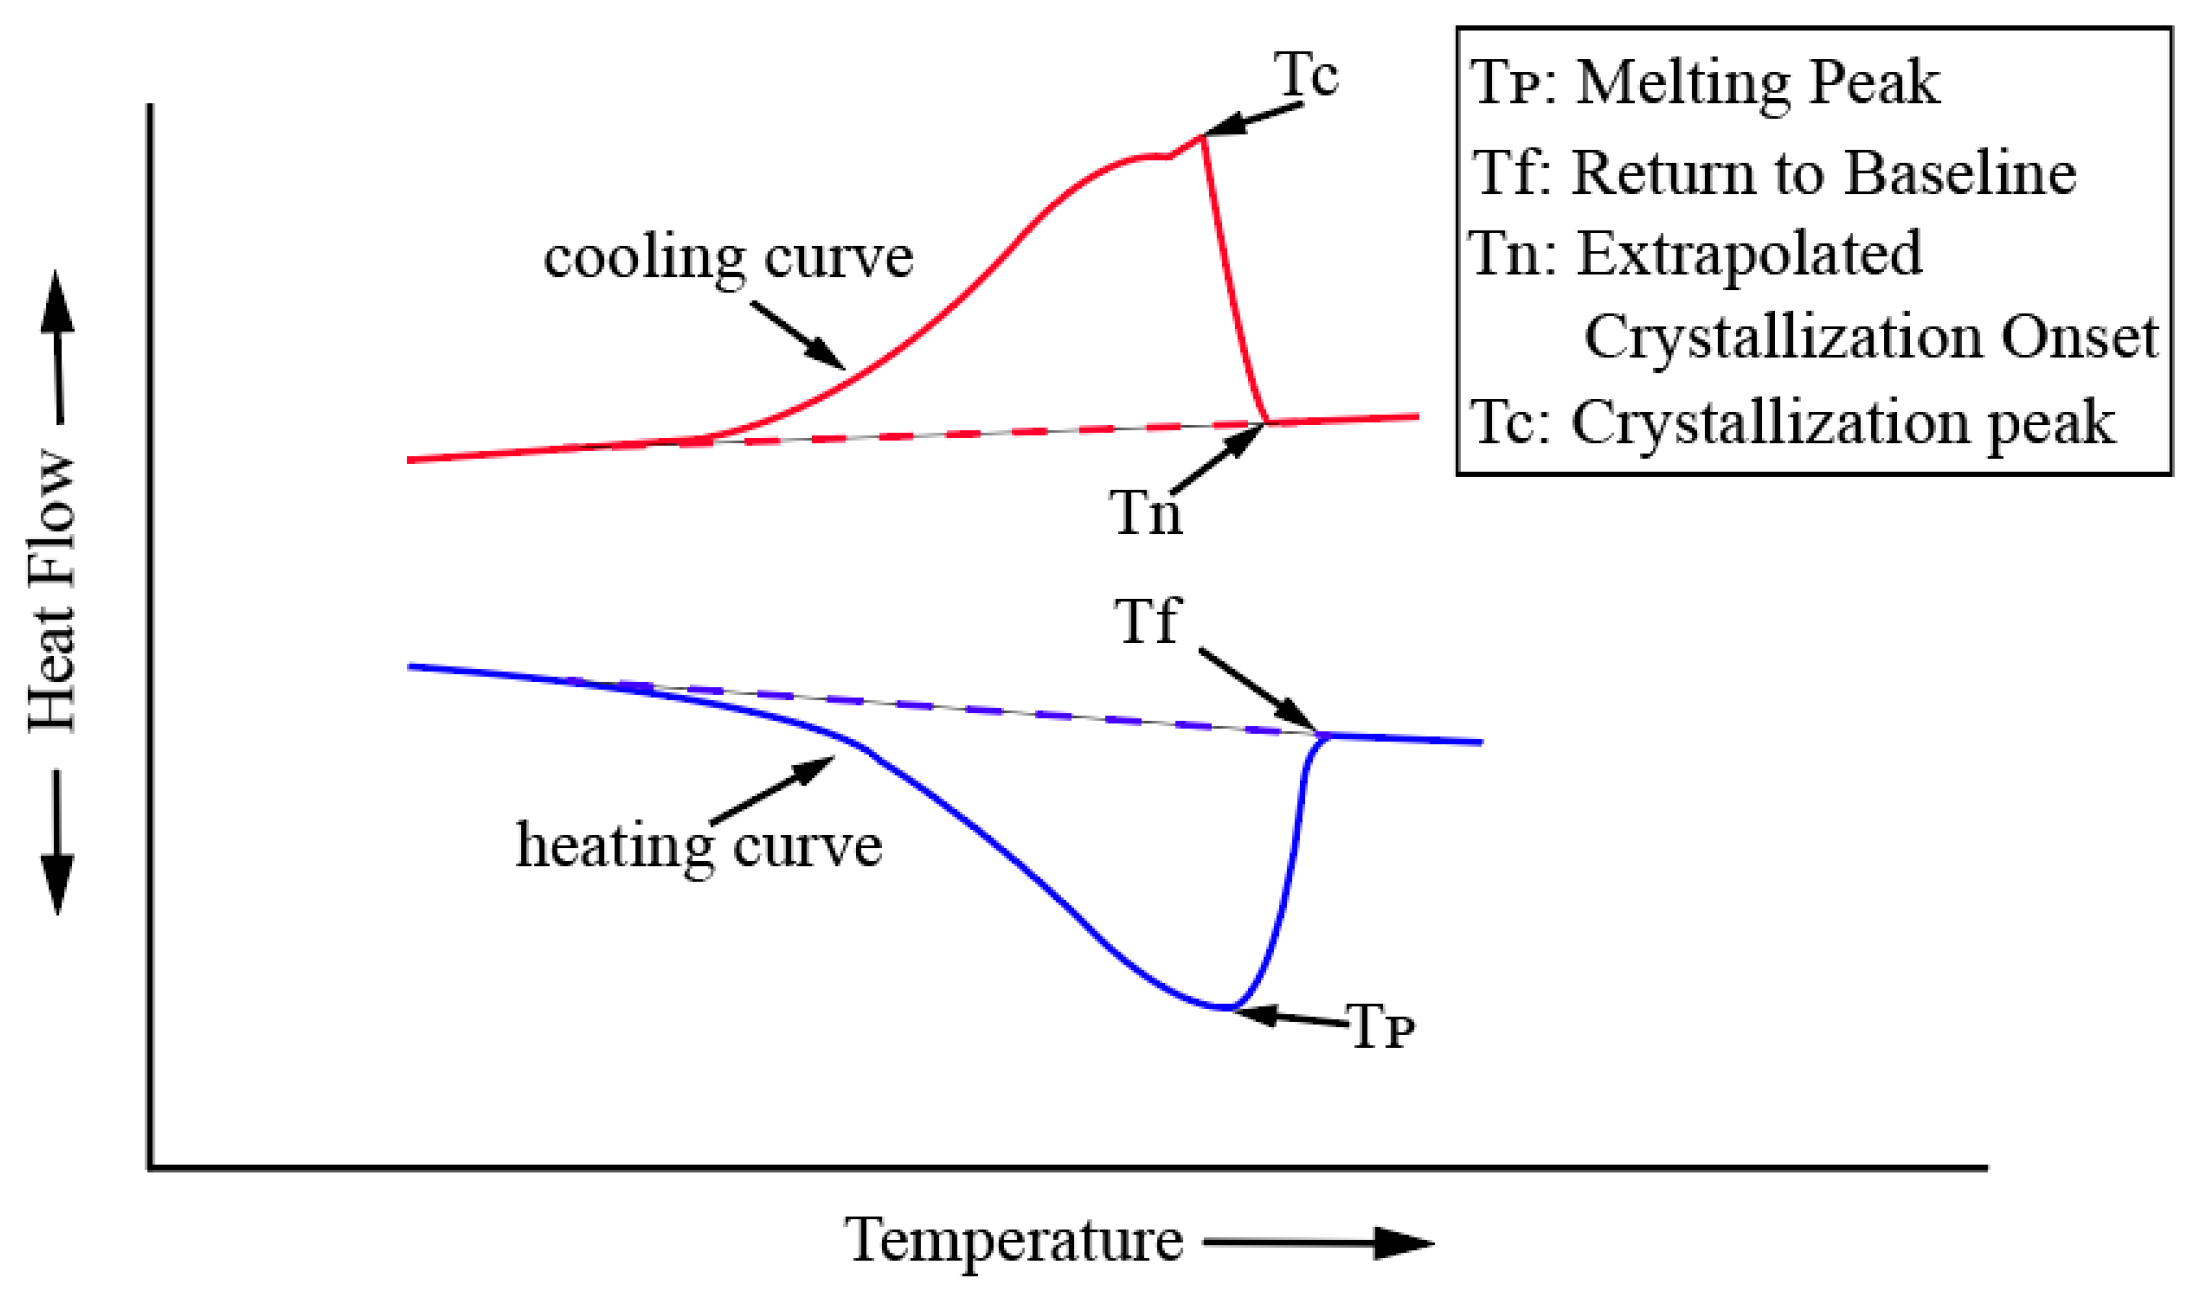
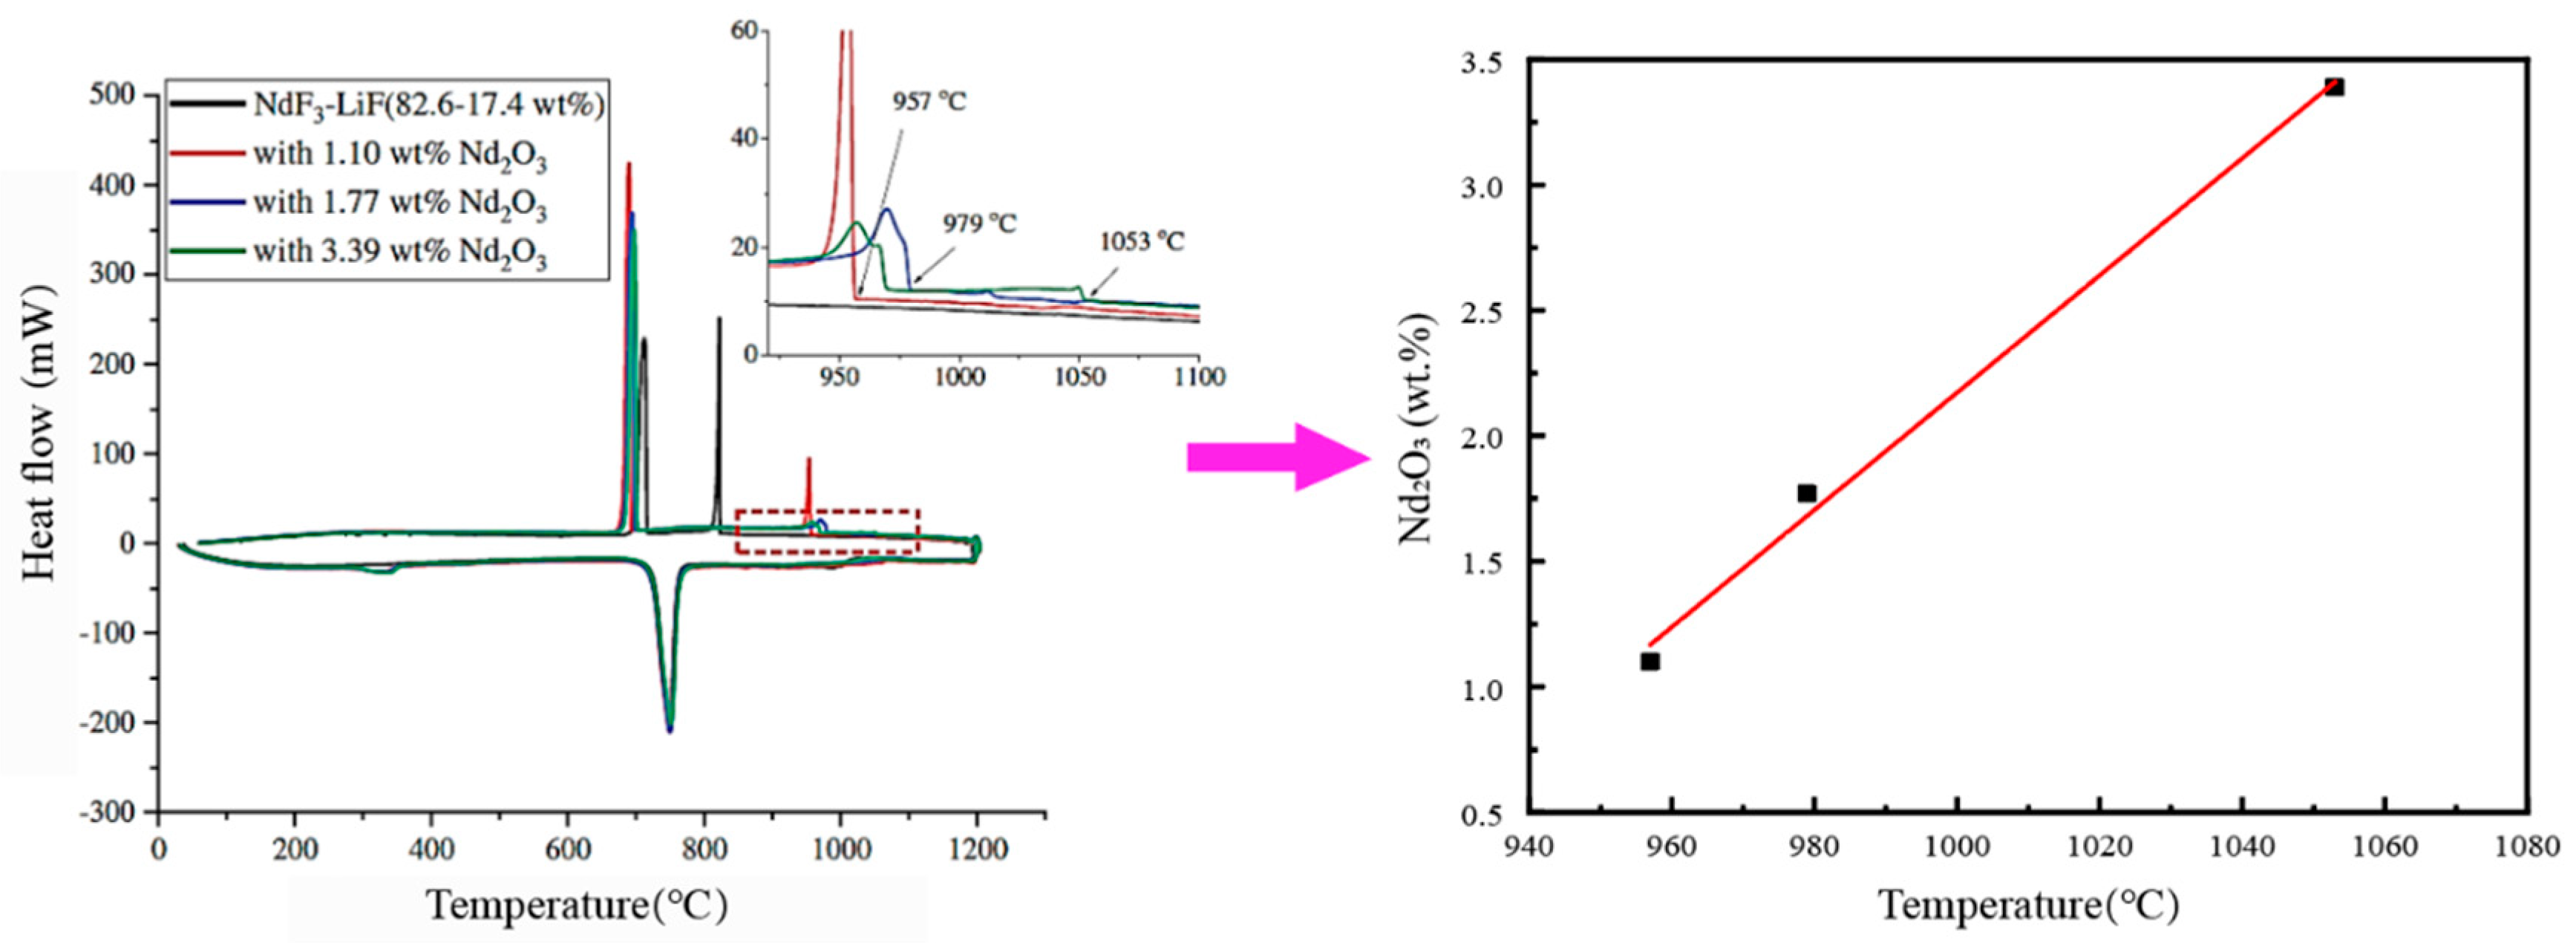
2.2. Primary Crystallization Temperature Method

The primary crystallization temperature method involves complete melting of the RE2O3-REF3-LiF mixture, followed by the determination of the crystallization temperature at which the primary phase precipitates during the cooling of the melt [55,56,57]. Figure 4 shows the classic heating and cooling curves of a certain material, where Tf represents the temperature at which complete melting occurs during heating, and Tn represents the temperature at which the primary crystalline phase begins to precipitate during cooling.
Liu et al. [55] and Zhu et al. [56] utilized the primary crystallization temperature method to measure the solubility of rare earth oxides in REF3-LiF molten salt. As shown in Figure 5, when different amounts of Nd2O3 (0, 1.10, 1.77, 3.39 wt.%) were added to NdF3-LiF molten salt (82.6–17.4 wt.%), the corresponding primary crystallization temperatures were 830, 957, 979, and 1053 °C, respectively [55].
The primary crystallization temperature of a given composition melt is its liquidus temperature. Therefore, the measurement of RE2O3 solubility in REF3-LiF molten salt using the primary crystallization temperature method can be attributed to the phase equilibrium study of the RE2O3-REF3-LiF system. As depicted in Figure 6, the primary crystallization temperature curves obtained by adding different amounts of La2O3 to 83 wt.% LaF3-17 wt.% LiF molten salt represent the pseudo-binary phase diagram of (LaF3 + LiF)-La2O3. When the La2O3 concentration is below 0.6 wt.%, the liquidus temperature of the sample decreases with increasing La2O3 concentration. When the La2O3 concentration exceeds 0.6 wt.%, the liquidus temperature of the sample increases with increasing La2O3 concentration. In other words, the solubility of La2O3 in 83 wt.% LaF3 + 17 wt.% LiF increases with increasing temperature. The (83 wt.% LaF3 + 17 wt.%)-La2O3 system has a minimum eutectic temperature of 1041 °C at a La2O3 concentration of 0.6 wt.% [56]. The pseudo-binary phase diagram of (83 wt.% NdF3 + 17 wt.%)-Nd2O3 is also present in Figure 6 for comparison. It can be concluded that the eutectic temperature is slightly higher and the eutectic point moves to higher Nd2O3 direction in the NdF3-LiF-Nd2O3 system than the LaF3-LiF-La2O3 system.
Using the primary crystallization temperature method to measure the solubility of RE2O3 in REF3-LiF molten salts allows for the correlation of this physical property with the thermodynamic data, thereby systematically establishing and understanding the relationship between melt composition and temperature. However, this method needs to overcome some limitations in order to obtain accurate results. Firstly, it is essential to ensure that the RE2O3-REF3-LiF melt is completely in the liquid phase, from which the primary crystallization temperature is determined by the thermal effect during cooling. When a large amount of sample is used for measuring the thermal effect, the sample composition can be verified after the experiment. However, the thermal effect during the primary phase crystallization is not significant, leading to an inaccurate measurement of the temperature. A DSC device may give an accurate thermal effect measurement, but the sample is small and its composition may be inaccurate. Furthermore, this method cannot directly measure the composition of the primary crystalline phase, thus is unable to obtain complete thermodynamic data.

2.3. Square Wave Voltammetry Method

Molten salt is a conductive system, and its conductivity is closely related to the composition. Chen et al. [57] and Keller [58] have determined the solubility of rare earth oxides in fluoride salts using electrochemical methods. Chen et al. [57] used square wave voltammetry to measure the solubility of Nd2O3 in the NdF3-LiF (90%:10%) molten salt system at 1100, 1150, and 1200 °C. After adding an excess amount of Nd2O3 powder to the molten NdF3-LiF (90%:10%) and stirring for 5 min, the square wave voltammetry curve was continuously measured using an electrochemical workstation. Then, a Gaussian fit was used to obtain a clearer fitting graph. The upper layer of the reacted salt was taken for XRF analysis to determine the concentration of Nd2O3 in the molten salt. Figure 7 shows the voltametric square wave graph of the NdF3-LiF (90%:10%)-Nd2O3 (5%) molten salt system at 1200 °C. As the dissolution time increases, the peak current density of the square wave voltammetry curve also increases, indicating an increase in the concentration of neodymium oxide with time. The increase in peak current density becomes insignificant after 3.5 h. Therefore, the concentration of Nd2O3 in the molten salt at 3.5 h is taken as the solubility value. Based on the standard curve of Nd2O3 concentration versus peak current density shown in Figure 7, the concentration of Nd2O3 in the molten salt can be obtained from the measured peak current density.
Square wave voltammetry allows for determining the time required for rare earth oxide to reach dissolution equilibrium and enables the measurement of the dissolution rate of oxides in a sealed system during continuous measurements. This avoids the influence of sampling and analysis on the molten salt system during the experimental process, as well as the errors generated from analyzing multiple sample components. However, when analyzing the composition of the upper layer of salt after the experiment, it is necessary to confirm that an undissolved RE2O3 solid phase is not present.
Although the reactants during the electrolysis of the RE2O3-REF3-LiF molten salt system are the dissolved RE3+ and O2− species, all studies focus on the solubility of RE2O3 in the molten salt. However, multiple studies have shown that, when RE2O3 is added to the REF3-LiF molten salt, it completely forms REOF and there is no RE2O3 phase present in the system [36,56]. Therefore, from a thermodynamic perspective, the primary crystalline phase is in equilibrium with the liquid phase of RE2O3 + REF3 + LiF is REOF rather than RE2O3. Both the isothermal saturation method and the square wave voltammetry method require the addition of excess oxide to maintain dissolution equilibrium in the molten salt. However, as shown in Figure 2 and Figure 3, when excess RE2O3 is added, the concentration of RE3+ in the molten salt decreases with increasing RE2O3 as the formation of REOF consumes the RE3+ in the melt:
RE3+ + 3F + RE2O3 → 3REOF
After reaching the solubility of RE2O3, the more RE2O3 that is added, the more solid the phase of REOF is formed, and the lower the concentrations of RE3+ and F in the molten salt. Therefore, the solubility alone cannot accurately describe the properties of the RE2O3-REF3-LiF system. Expressing the published solubility of RE2O3 in REF3 + LiF molten salt in the form of a RE2O3-REF3-LiF ternary phase diagram can represent the solubility of RE2O3 as a function of temperature and salt composition.
In summary, the experimental equipment is simple in the isothermal saturation method and is easy to operate. However, the samples taken for compositional analysis may include undissolved rare earth oxides during the sampling, which results in an overstated solubility. In addition, the solubility of the RE2O3 is usually lower than 5 wt.% and it is difficult to obtain accurate results either by RE difference or oxygen concentration. Square wave voltammetry can measure the concentration and dissolution rate of RE2O3 in molten salt continuously, which can reduce the probability of sample contamination. Furthermore, this method has been proven to be sensitive to the concentration of oxygen ions in molten salts, making the obtained data more reliable. However, this method requires complex equipment and careful data analysis, resulting in low productivity. Accurate composition analysis is also important for this technique. The initial crystallization temperature method uses differential thermal analysis to measure the temperature when the primary phase precipitates during the cooling of the melt, thus obtaining the solubility of RE2O3 at that temperature. There is no need to collect and analyze the sample in this method, which minimizes the uncertainty associated with the sampling and compositional analysis. The sample composition depends on careful preparation. The thermal effect during primary crystallization is not significant, and the measured initial crystallization temperature can be inaccurate. Therefore, this method requires careful sample preparation and thermal analysis. All these experimental techniques were developed to measure the solubility of RE2O3 in the molten salt rather than phase equilibrium study. SEM or EPMA need to be used to identify the primary phase, which is essential information for a phase equilibrium study.

3. Phase Equilibrium Studies in the RE2O3-REF3-LiF System

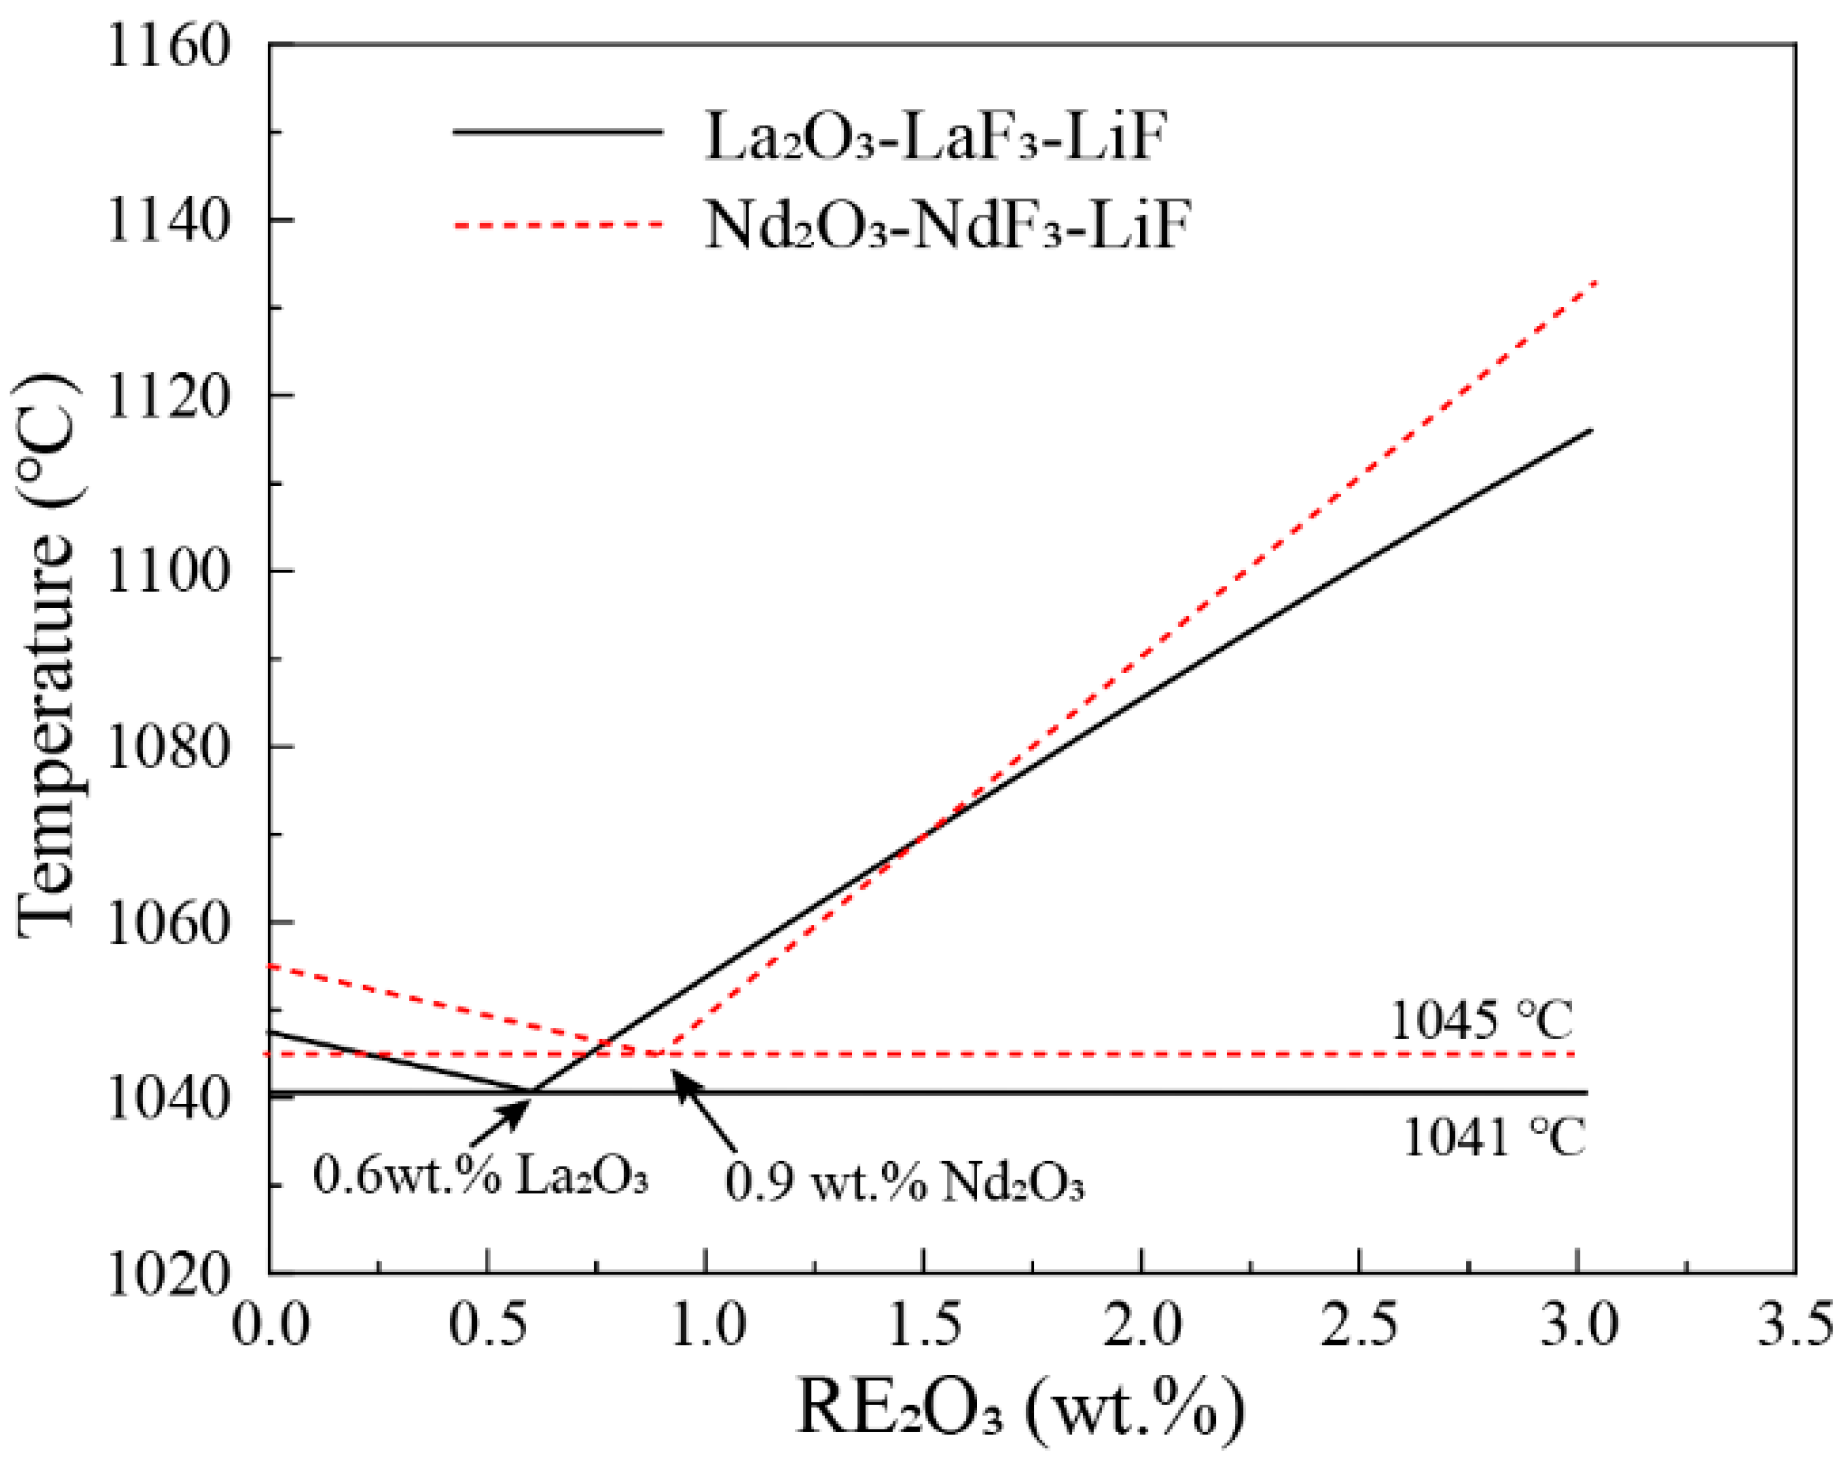
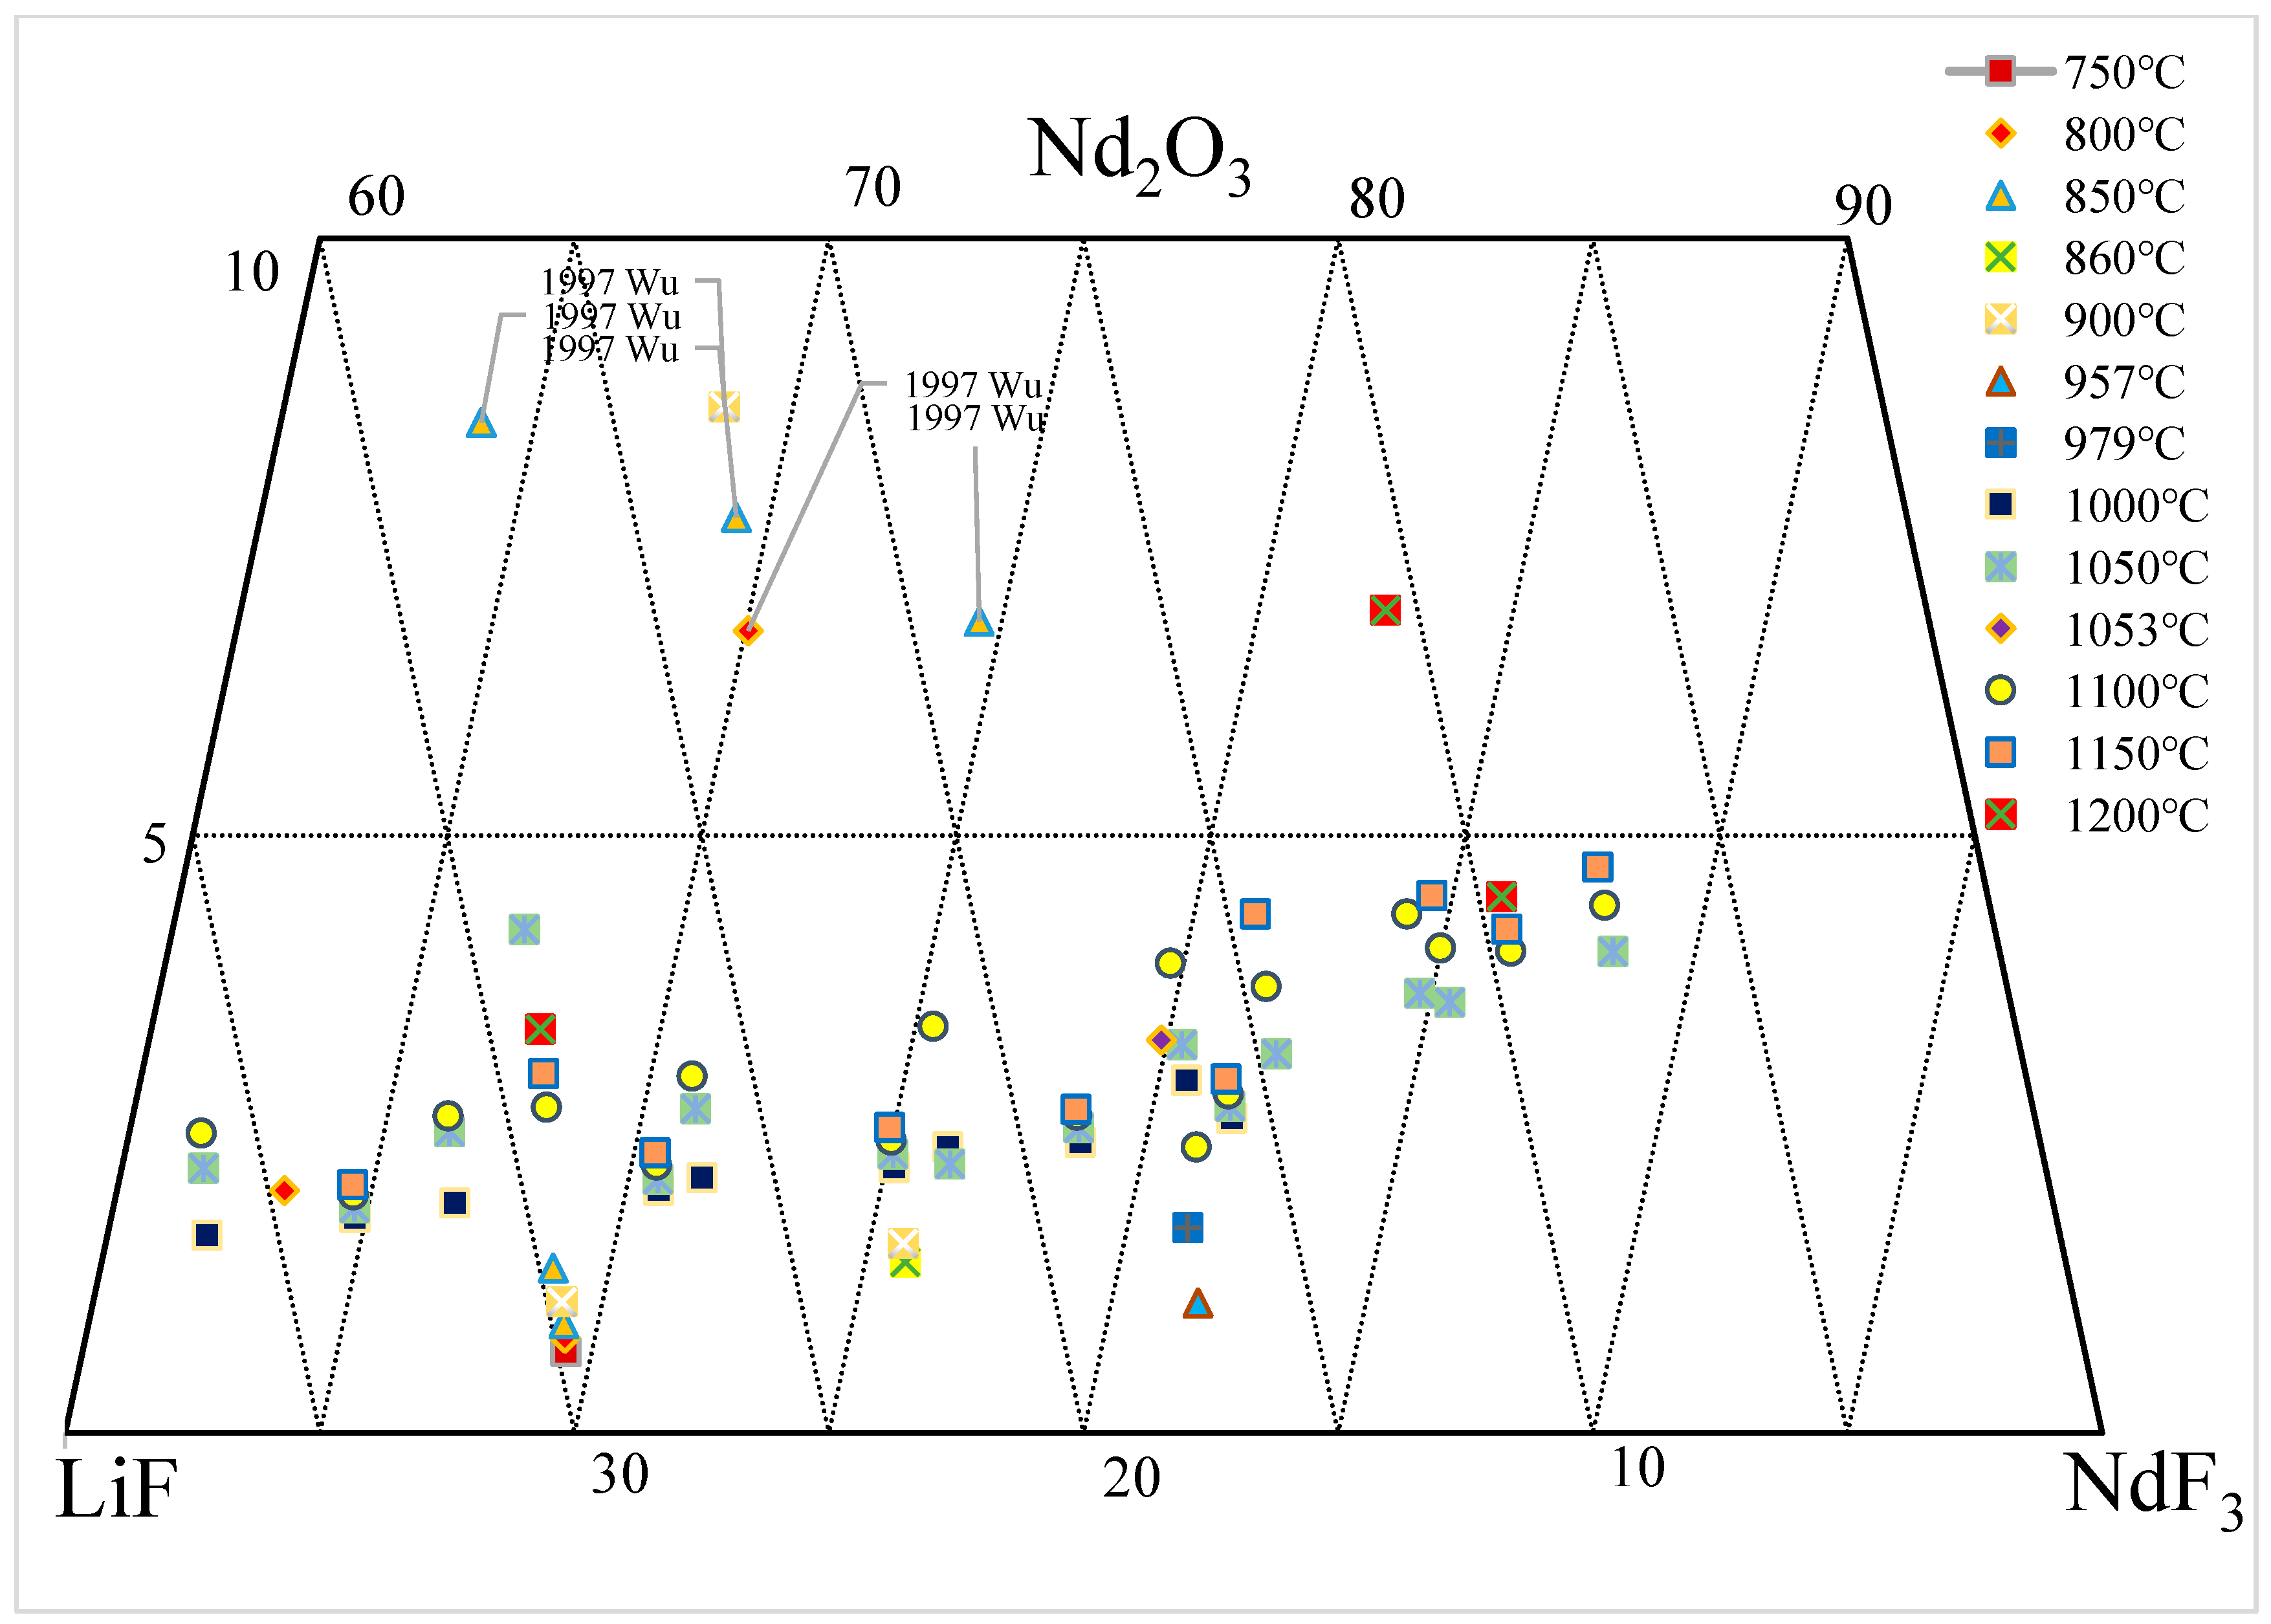
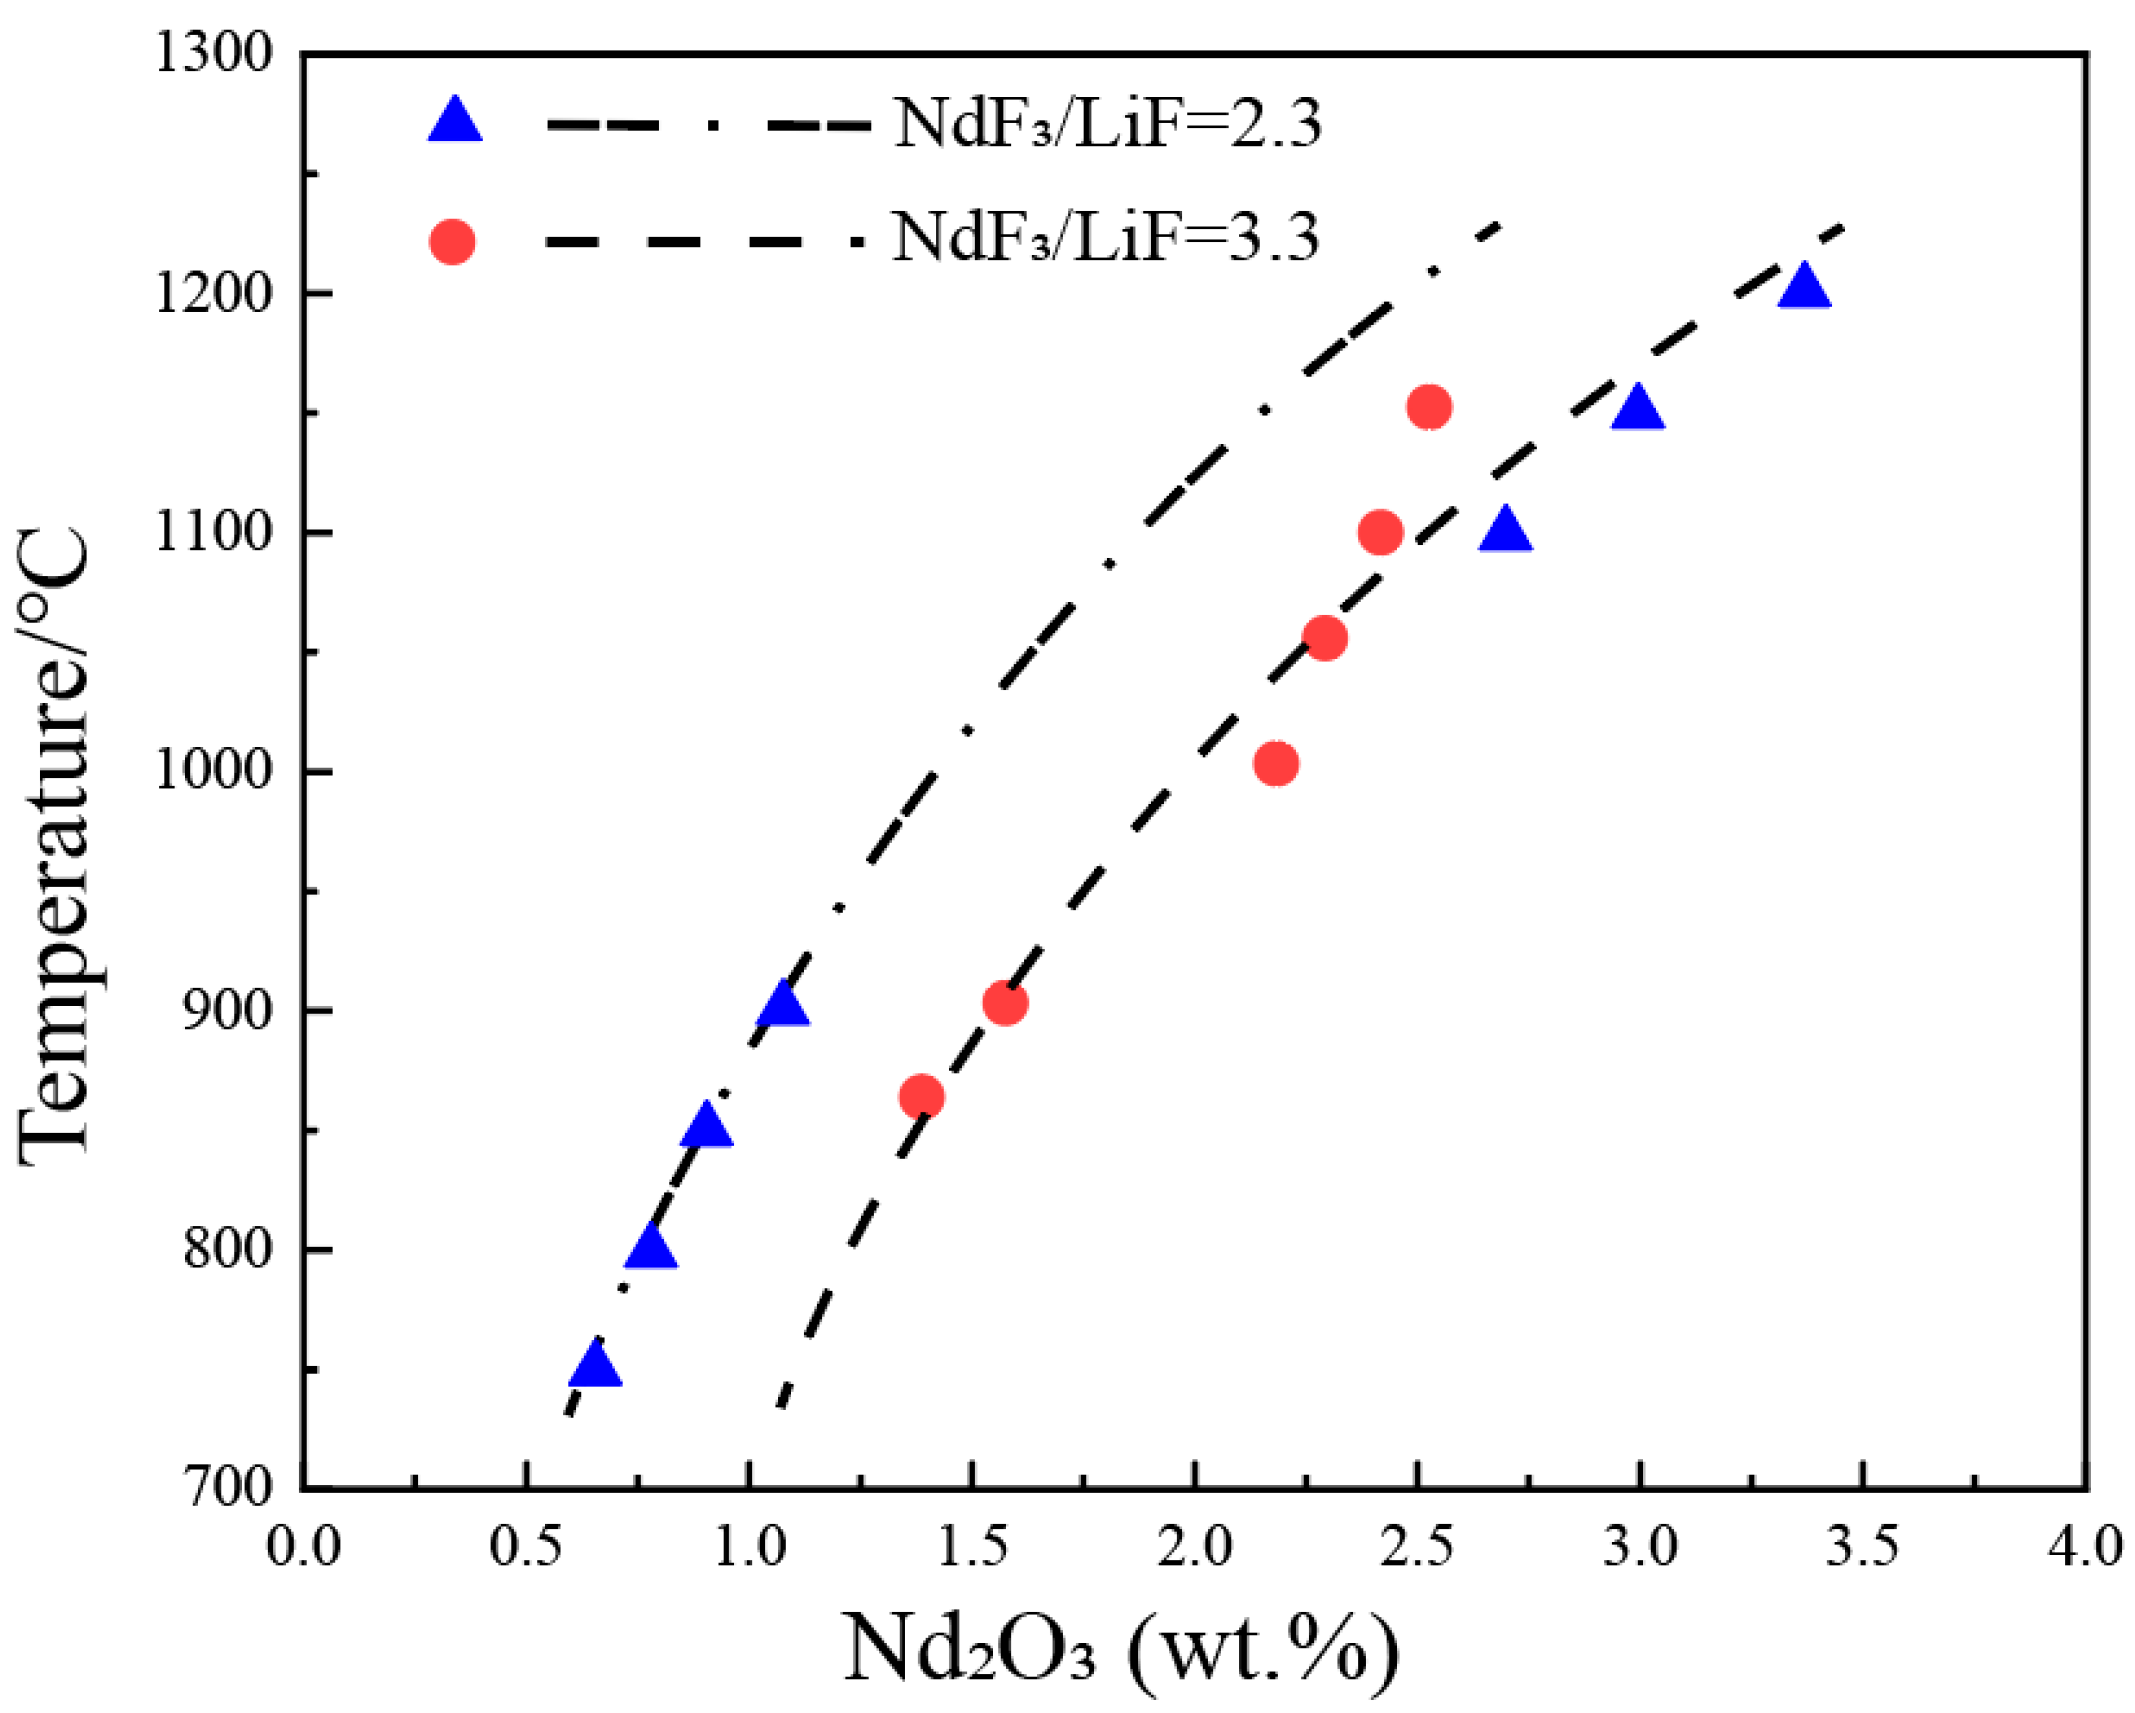
3.1. Nd2O3-NdF-LiF System

Due to the importance of neodymium–iron–boron magnetic materials, there has been an increasing amount of research on the phase equilibrium of the Nd2O3-NdF-LiF system, which is relevant to the production of neodymium through molten salt electrolysis [59,60]. Solubility data of Nd2O3 in the NdF3-LiF system reported in the literature are summarized in Table 1. Figure 8 summarizes the solubility data of Nd2O3 in the NdF3-LiF system and annotates these data in the Nd2O3-NdF-LiF ternary phase diagram. It can be observed that large amounts of experimental data have been published in the range of 750–1200 °C and 60–90 wt.% NdF3. In the liquid phase, the concentration of Nd2O3 mostly remains below 5 wt.% and increases with the temperature and percentage of NdF3. However, the solubility data published by Wu et al. [34] significantly deviate from other data, with a decrease in Nd2O3 concentration as NdF3 increases, indicating the unreliability of these data. The abundance of experimental data shown in Figure 8 indicates the importance of phase equilibrium research in the Nd2O3-NdF-LiF system, both in terms of theoretical significance and practical applications, which has attracted numerous researchers to invest substantial efforts into studying this area. However, there are significant differences and even contradictions among these experimental data [34,35,36,37,38,39,55,56,57,58,61,62], as detailed in the following two figures.
Figure 9 represents the solubility data of Nd2O3 in the NdF3-LiF molten salt at 1100 and 1150 °C, plotted on the ternary phase diagram. According to all the available literature, at the same NdF3/LiF ratio, the solubility of Nd2O3 increases with increasing temperatures, and connecting the solubility data at the same temperature should obtain a smooth liquidus line (isotherm). However, it is difficult to determine a consistent liquidus line at 1100 and 1150 °C, based on the data shown in the figure. Some data points indicate a higher solubility of Nd2O3 at 1100 °C compared with 1150 °C. The estimated 1100 and 1150 °C isotherms are shown in the figure. These contradictory data not only pose challenges for production technicians but also cannot be used for developing thermodynamic databases.
Figure 10 shows the solubility data of Nd2O3 in the NdF3-LiF system on a pseudo-binary phase diagram of Nd2O3-(NdF3 + LiF), with NdF3/LiF ratios of 2.3 and 3.3. It can be observed that the liquidus temperatures increase sharply with an increase in the concentration of Nd2O3. For every 1 wt.% increase in Nd2O3, the liquidus temperature rises by approximately 150 °C. In other words, the solubility of Nd2O3 is not sensitive to temperature, as increasing the temperature by 150 °C only results in a 1 wt.% increment in Nd2O3 solubility. The current consensus in the research is that, at the same temperature, a higher NdF3/LiF ratio leads to a greater solubility of Nd2O3. From the figure, it can be observed that at lower temperatures (800–900 °C), the solubility of Nd2O3 in NdF3/LiF = 3.3 is higher than that in NdF3/LiF = 2.3. However, at higher temperatures (1100–1150 °C), the solubility of Nd2O3 in NdF3/LiF = 3.3 is lower than that in NdF3/LiF = 2.3, indicating a significant discrepancy in the experimental data among different researchers. The dashed lines in the figure represent the estimated liquidus lines corresponding to NdF3/LiF ratios of 2.3 and 3.3, based on the experimental data.

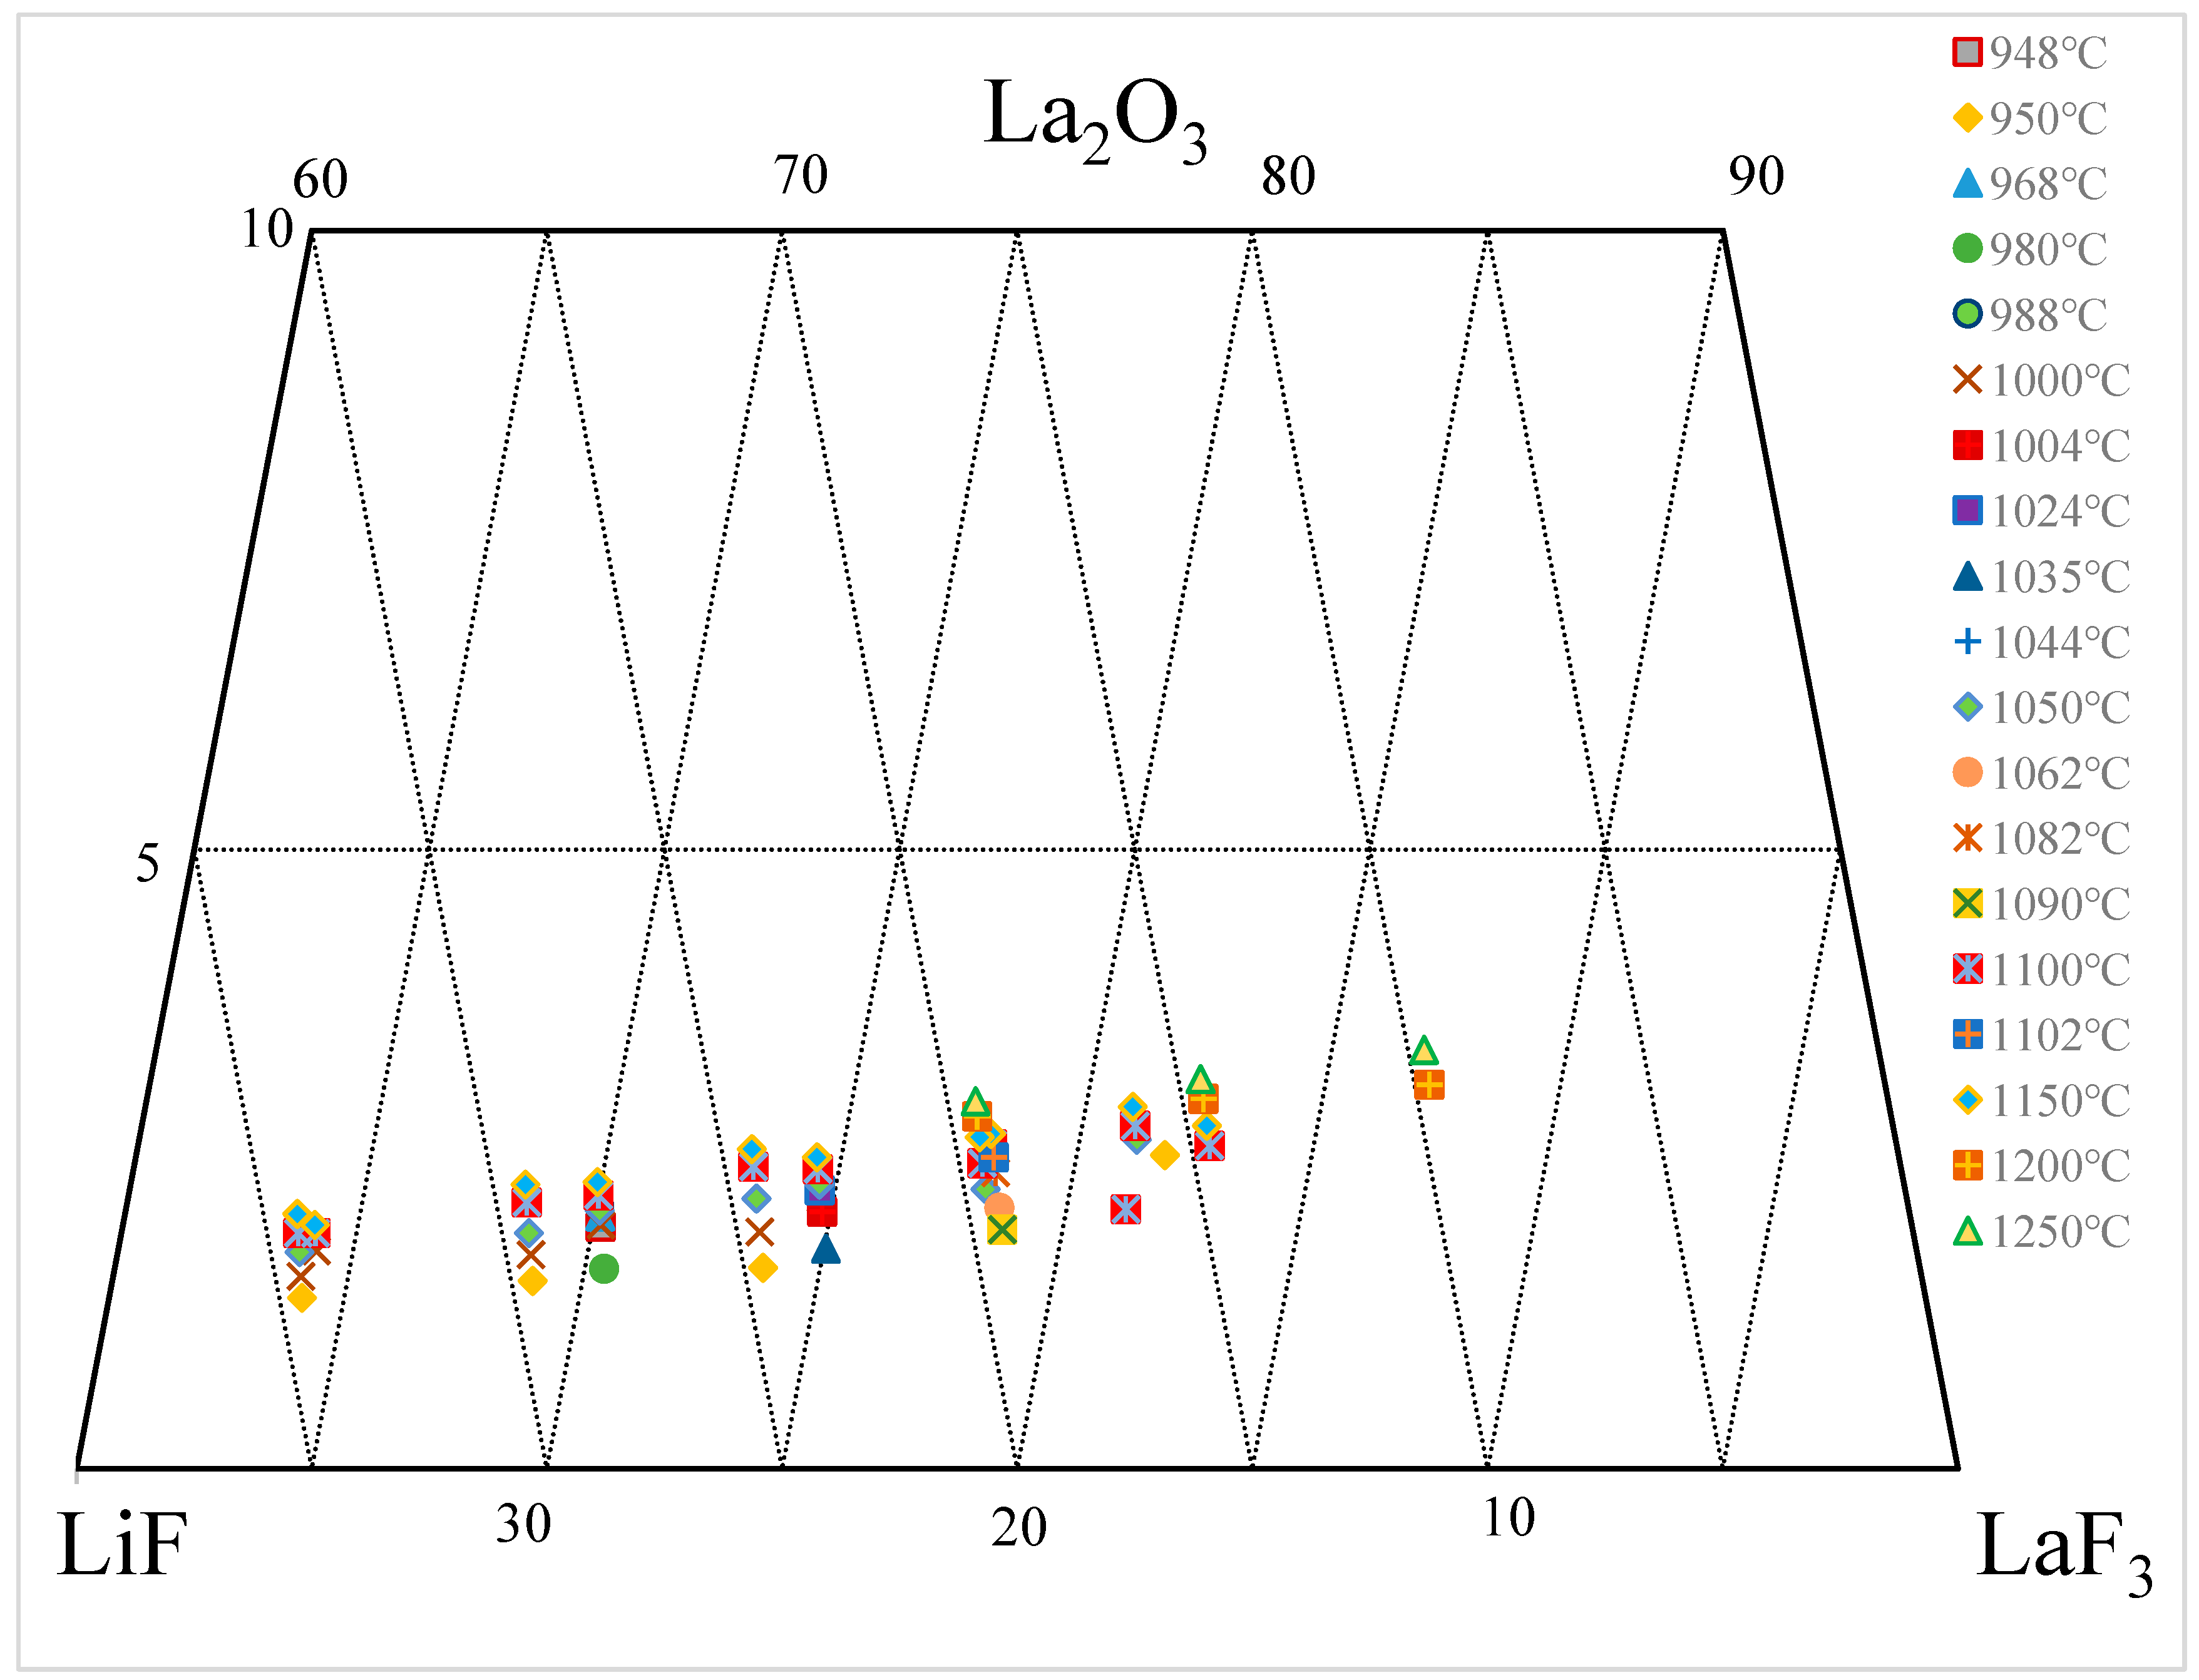
3.2. La2O3-LaF-LiF System

Figure 11 presents the solubility data of La2O3 in the LaF3-LiF system annotated on a ternary phase diagram based on the summary of the literature data shown in Table 2. Within the range of 948–1250 °C and 60–90 wt.% LaF3, the solubility of La2O3 in the LaF3-LiF system ranges from 1.3 to 3.4 wt.%. With an increase in temperature and LaF3, there is a tendency for the solubility of La2O3 to increase, but the change is not significant [36,40,41,42].
Figure 12 annotates the solubility data of La2O3 on a pseudo-binary phase diagram of La2O3-(LaF3 + LiF), with the LaF3/LiF weight ratios of 1.9 and 3.2. It can be observed that the liquidus temperature increases sharply with an increase in the concentration of La2O3. For every 1 wt.% increase in La2O3 in the melt, the liquidus temperature rises by approximately 300 °C. In other words, the solubility of La2O3 is not sensitive to temperature, as increasing the temperature by 300 °C only results in a 1 wt.% increment in La2O3 solubility. At the same temperature, a higher LaF3/LiF weight ratio leads to a greater solubility of La2O3, but scattered data make it difficult to obtain precise liquidus lines. The dashed lines in the figure represent the estimated liquidus lines corresponding to LaF3/LiF weight ratios of 1.9 and 3.2, based on the experimental data.

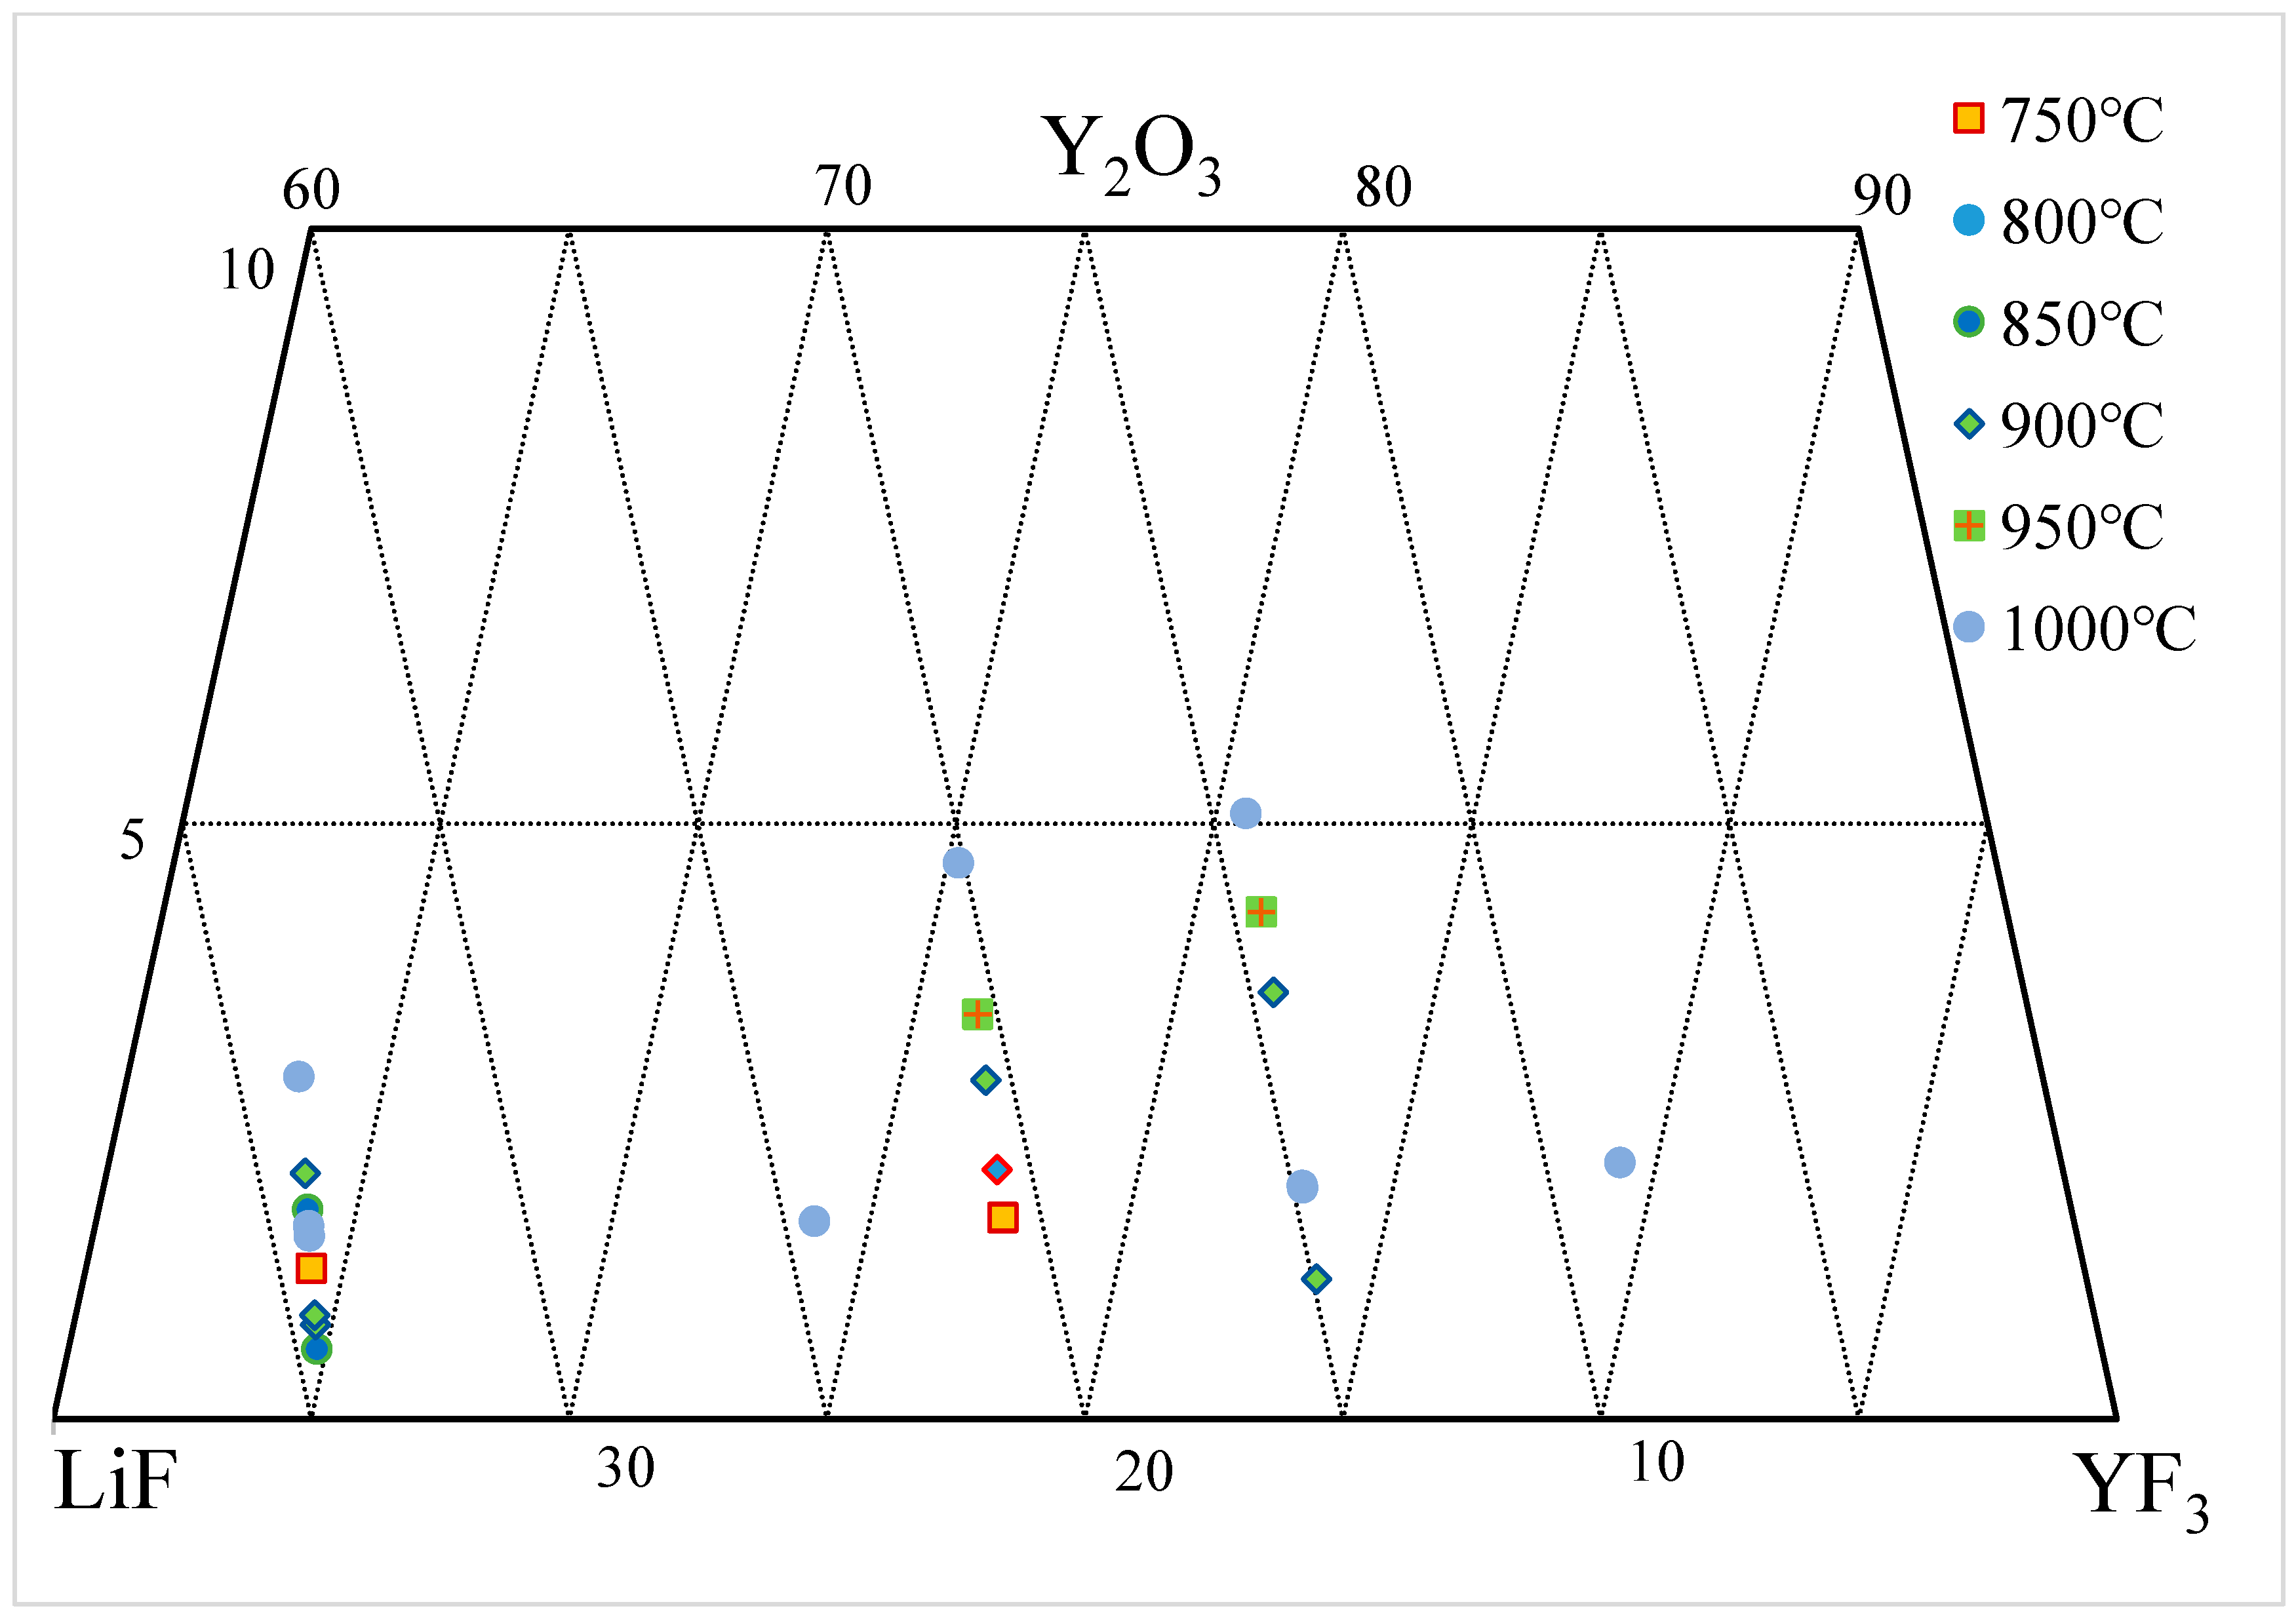
3.3. Y2O3-YF3-LiF System

Figure 13 presents the solubility data of Y2O3 in the YF3-LiF system annotated on a ternary phase diagram, and the data from the literature are summarized in Table 3 [47,63]. Within the range of 725–1009 °C and 60–90 wt.% YF3, the solubility of Y2O3 in the YF3-LiF system ranges from 0.45 to 5.09 wt.%. Data published by the same group of researchers indicate that the solubility of Y2O3 in YF3-LiF increases with temperature and YF3. However, as can be seen from the figure, there are significant differences in the data from different researchers. Figure 14 annotates partial solubility data of Y2O3 on a pseudo-binary phase diagram of Y2O3-(YF3 + LiF), with YF3/LiF weight ratios of 1.9 and 5.6. From the figure, it can be observed that the liquidus temperature increases with an increase in the concentration of Y2O3, but the extent of increase is not as significant as in the La2O3-LaF3-LiF and Nd2O3-NdF3-LiF systems. Therefore, the solubility of Y2O3 in the YF3-LiF system increases rapidly with increasing temperature. In principle, at the same temperature, a higher YF3/LiF ratio leads to a greater solubility of Y2O3, but there are significant differences in the data from the two groups of researchers in the figure. The dashed lines in the figure represent the estimated liquidus lines corresponding to the YF3/LiF weight ratios of 1.9 and 5.6, based on the experimental data.

3.4. Solubility Model of RE2O3-REF3-LiF System

High-temperature phase equilibrium experiments not only consume a significant amount of time and funding, as mentioned above, they also yield substantial variations in the data among different researchers and experimental methods, which brings confusion to the applications of these data. Various thermodynamic models, such as FactSage [64,65], MTDATA [66], and Thermo-Calc [67], have been developed to predict the thermodynamic properties of slags, molten salts, and alloys. The solubility of rare earth oxides in molten salts can theoretically be predicted using thermodynamic models. However, the construction of the core database for these thermodynamic models relies heavily on a large amount of experimental data. The lack of accurate thermodynamic data for rare earth oxide–molten salt systems currently hinders the ability of existing thermodynamic models to predict their properties, including solubility. Researchers have attempted to establish semi-empirical models [24,25] to predict the solubility of rare earth oxides in molten salts based on available experimental data. Figure 15 summarizes the solubility of various rare earth oxides in fluoride salts, where Figure 15a shows the relationship between solubility and temperature, and Figure 15b demonstrates the relationship between the logarithm of solubility and the reciprocal of temperature [25]. It can be observed that the solubility of rare earth oxides in molten salts generally increases with temperature but with significant variations among different systems. For most systems, the logarithm of solubility exhibits a linear relationship with the reciprocal of temperature.
Figure 16 illustrates the relationship between the solubility of Nd2O3 and Y2O3 and the concentration of rare earth fluoride (REF3). Within the studied concentration and temperature ranges, the solubility of the oxides increases with an increase in the concentration of REF3 in the molten salt. At higher temperatures, the solubility of rare earth oxides is more sensitive to the concentration of REF3 in the molten salt. As shown in Figure 16, the solubility data for different rare earth oxides in fluoride salts exhibit considerable variability, making it difficult to be expressed by a unified model. Guo et al. [25] proposed semi-empirical prediction models for each rare earth oxide with available solubility experimental data. For example, they developed a solubility prediction model for Nd2O3 in the NdF3-LiF-(MgF2/CaF2) system using the data from three articles [34,35,39]. The comparison between the predicted and experimental results is shown in Figure 17, with an average error of 8%. However, the error can reach 30% for low solubility cases.
As shown in Figure 8, the solubility data of Nd2O3 in the NdF3-LiF system reported in the literature are much more extensive than those used by Guo et al. [25]. Figure 18 compares the solubility calculated by Guo et al.’s model [25] with all the experimental solubility data of Nd2O3 in the NdF3-LiF system. It can be seen that the solubilities calculated by Guo et al.’s model show a big difference compared with the experimental data in low NdF3 fluoride salt.

4. Conclusions

The solubility of rare earth oxides in fluoride salt is essentially the content of RE2O3 in the liquid phase saturated with solid oxides in the REF3-LiF-RE2O3 system. This paper systematically summarizes the determination methods and solubility data of rare earth oxides in molten fluoride salt. The solubility data are expressed in the ternary phase diagrams, and a series of pseudo-binary phase diagrams are constructed to evaluate the reported data in the literature. The solubility data reported in the literature, obtained by different authors using different research methods, exhibit significant deviations. In addition, the solubility models proposed in the literature also exhibit significant deviations from experimental data.
Expressing the solubility of rare earth oxides in the fluoride salt system in the form of a phase diagram not only allows for the summarization and comparison of the data obtained under various conditions but also enables the development of a thermodynamic database for the REF3-LiF-RE2O3 system based on phase equilibrium studies. With the development of production technologies and variations of feed structures, more accurate phase equilibrium information directly related to the production of rare earth metals and alloys is required. Reliable techniques for phase diagram determination of REF3-LiF-RE2O3 need to be developed to meet the requirements. Accurate experimental data will also support the development of thermodynamic databases related to rare earth elements.

Author Contributions

Methodology, B.Z. and Q.Z.; validation, B.Z. and J.L.; formal analysis, Q.Z. and J.L.; resources, B.Z. and C.L.; data curation, Q.Z. and J.L.; writing—original draft, B.Z. and Q.Z.; writing—review and editing, J.L. and B.Z.; supervision, B.Z. and J.L.; project administration, B.Z. and C.L. All authors have read and agreed to the published version of the manuscript.

Funding

This work was supported by the National Natural Science Foundation of China (grant numbers 52174335).

Data Availability Statement

Not applicable.

Conflicts of Interest

The authors declare that they have no conflicts of interest.

References

  1. Balaram, V. Rare earth elements: A review of applications, occurrence, exploration, analysis, recycling, and environmental impact. Geosci. Front. 2019, 10, 1285. [Google Scholar] [CrossRef]
  2. Huang, X.W.; Li, H.W.; Wang, C.F.; Wang, G.Z.; Xue, X.X.; Zhang, G.C. Development Status and Research Progress in Rare Earth Industry in China. Chin. J. Rare Met. 2007, 31, 279–288. [Google Scholar]
  3. Baranovskaya, B.V.; Karpov, Y.A.; Korotkova, N.A. Actual trends in the application of rare-earth metals and their compounds in the production of magnetic and lumi-nescent materials: A review. Russ. J. Non-Ferr. Met. 2021, 62, 10. [Google Scholar] [CrossRef]
  4. Cheisson, T.; Schelter, E.J. Rare earth elements: Mendeleev’s bane, modern marvels. Science 2019, 363, 489–493. [Google Scholar] [CrossRef]
  5. Lima, I.B.D. Chapter 19—Rare Earths Industry and Eco-management: A Critical Review of Recycling and Substitutes. In Rare Earths Industry; Elsevier: Amsterdam, The Netherlands, 2015; pp. 293–304. [Google Scholar]
  6. Lima, I.B.D.; Filho, W.L. Highlights on Rare Earths. In Rare Earths Industry; Elsevier: Amsterdam, The Netherlands, 2016; pp. 395–424. [Google Scholar]
  7. Fernandez, V. Rare-earth elements market: A historical and financial perspective. Resour. Policy 2017, 53, 26–45. [Google Scholar] [CrossRef]
  8. Zepf, V. An Overview of the Usefulness and Strategic Value of Rare Earth Metals. In Rare Earths Industry; Elsevier: Amsterdam, The Netherlands, 2015; pp. 3–17. [Google Scholar]
  9. Balachandran, G. Extraction of Rare Earths for Advanced Applications, 3, Treatise on Process Metallurgy; Elsevier: Washington, DC, USA, 2014; p. 1291. [Google Scholar]
  10. Liu, T.C.; Chen, J. Extraction and separation of heavy rare earth elements: A review. May Separ. Purif. Technol. 2021, 276, 119263. [Google Scholar] [CrossRef]
  11. Traore, M.; Gong, A.; Wang, Y.; Qiu, L.; Bai, Y.; Zhao, W.; Liu, Y.; Chen, Y.; Liu, Y.; Wu, H.; et al. Research progress of rare earth separation methods and technologies. J. Rare Earths 2023, 41, 182–189. [Google Scholar] [CrossRef]
  12. Wang, W.; Liu, L.; Liu, H.Z.; Zhang, B.; Cao, Y.H.; Wang, H.L. Progress and trend of rare earth extraction technology. Conserv. Util. Miner. Resour. 2020, 40, 32. [Google Scholar]
  13. Yin, T.Q.; Xue, Y.; Yan, Y.D.; Ma, Z.C.; Ma, F.Q.; Zhang, M.L.; Wang, G.L.; Qiu, M. Recovery and separation of rare earth elements by molten salt electrolysis. Int. J. Miner. Metall. Mater. 2021, 28, 899–913. [Google Scholar] [CrossRef]
  14. Chen, Y.X. Research Progress of Preparation of Rare Earth Metals by Electrolysis in Fluoride Salt System. Chin. Rare Earth 2014, 35, 99–107. [Google Scholar]
  15. Zhu, H.M. Rare Earth Metal Production by Molten Salt Electrolysis. In Encyclopedia of Applied Electrochemistry; Springer: Berlin/Heidelberg, Germany, 2014; pp. 1765–1772. [Google Scholar]
  16. Han, W.; Li, M.; Zhang, M.L.; Yan, Y.D. Progress in preparation of rare earth metals and alloys by electrodeposition in molten salts. Rare Met. 2016, 35, 811–825. [Google Scholar] [CrossRef]
  17. Sarfo, P.; Das, A.; Young, C. Extraction and optimization of neodymium from molten fluoride electrolysis. Sep. Purif. Technol. 2021, 256, 117770. [Google Scholar] [CrossRef]
  18. Pang, S.; Yan, S.; Li, Z.; Chen, D.; Xu, L.; Zhao, B. Development on Molten Salt Electrolytic Methods and Technology for Preparing Rare Earth Metals and Alloys in China. Chin. J. Rare Met. 2011, 35, 440–450. [Google Scholar]
  19. Liu, H.; Zhang, Y.; Luan, Y.; Yu, H.; Li, D. Research Progress on Preparation of Rare Earth Metals by Molten Salt Electrolysis. Chin. Rare Earths 2021, 42, 133–143. [Google Scholar]
  20. Liu, Y.B.; Chen, G.H.; Yu, B.; Chen, X. Research Progress of Tapping Technology for Molten Salt Electrolytic Preparation of Rare Earth Metals. Chin. Rare Earths 2018, 39, 134–140. [Google Scholar]
  21. Wu, Y.F.; Ma, S.Y.; Wang, Z.F.; Bian, X.; Liu, Z.X.; Liu, Y.L. Formation Mechanism and countermeasures of nodules at furnace bottom of 15kA rare earth molten salt electrilysis cell. China Nonferrous Metall. 2023, 52, 81–87. [Google Scholar]
  22. Ji, Y.Z.; Xiao, F.X.; Sun, S.C.; Chen, J.Q.; Tu, G.F. Research Progress on Model Cell of High Current Rare Earth Reduction Cell. J. Chin. Soc. Rare Earth 2022, 40, 38–45. [Google Scholar]
  23. Guo, X.L.; Sun, Z.; Sietsma, J.; Blanpain, B.; Guo, M.X.; Yang, Y. Quantitative Study on Dissolution Behavior of Nd2O3 in Fluoride Melts. Ind. Eng. Chem. Res. 2018, 57, 1380–1388. [Google Scholar] [CrossRef] [PubMed]
  24. Guo, X.L.; Sietsma, J.; Yang, Y.X. Chapter 15-A Critical Evaluation of Solubility of Rare Earth Oxides in Molten Fluorides. In Rare Earths Industry; Elsevier: Amsterdam, The Netherlands, 2015; pp. 223–234. [Google Scholar]
  25. Guo, X.L.; Sun, Z.; Sietsma, J.; Yang, Y.X. Semiempirical Model for the Solubility of Rare Earth Oxides in Molten Fluorides. Ind. Eng. Chem. Res. 2016, 55, 4773–4781. [Google Scholar] [CrossRef]
  26. Zhao, J.C. (Ed.) Methods for Phase Diagram Determination; Elsevier: Amsterdam, The Netherlands, 2011. [Google Scholar]
  27. Thoma, R.E. Phase Diagrams of Binary and Ternary Fluoride Systems. Adv. Molten Salt Chem. 1975, 3, 275–455. [Google Scholar]
  28. Xue, J.Q.; Liu, Z.F.; Zhang, J.; Tang, C.B.; Bi, Q. Determination and Calculation of NdF3-LiF Binary System. Chin. J. Rare Met. 2014, 38, 832–838. [Google Scholar]
  29. Baek, S.; Jung, I.H. Phase diagram study and thermodynamic assessment of the Y2O3-YF3 system. J. Eur. Ceram. Soc. 2022, 42, 5079–5092. [Google Scholar] [CrossRef]
  30. Baek, S.; Jung, I.H. Phase diagram study and thermodynamic modeling of the MgO-Y2O3-MgF2-YF3 system. J. Eur. Ceram. Soc. 2023, 43, 1723–1734. [Google Scholar] [CrossRef]
  31. Kang, Z.; He, M.; Lu, G. Thermodynamic evaluation and optimization of (LiF + ReF3)(Re = La, Nd, Gd, Yb, Y, Lu) binary systems. Calphad 2023, 83, 102612. [Google Scholar] [CrossRef]
  32. Liao, C.; Fu, Z.; Que, L.; Tang, H.; Wang, X. Thermodynamic Analysis and Phase Diagram Calculation of LiF–NdF3 Based on Factsage. Soc. Sci. Res. 2022, preprints. [Google Scholar] [CrossRef]
  33. Kang, Z.; Robelin, C.; He, M.; Chartrand, P. Thermodynamic evaluation and optimization of the (KF + YF3), (KCl + YCl3) and (YF3 + YbF3) binary systems. J. Chem. Thermodyn. 2016, 98, 242–253. [Google Scholar] [CrossRef]
  34. Wu, W.Y.; Sun, J.Z.; Hai, L.; Gao, H.J. Solubility of Nd2O3 in Fluorine Salt System. Chin. Rare Rare Earths 1991, 3, 34–37. [Google Scholar]
  35. Stefanidaki, E.; Photiadis, G.M.; Kontoyannis, C.G.; Vik, A.F.; Østvold, T. Oxide solubility and Raman spectra of NdF3-LiF-KF-MgF2-Nd2O3 melts. J. Chem. Soc. Dalton Trans. 2002, 11, 2302–2307. [Google Scholar] [CrossRef]
  36. Zhu, X.P.; Sun, S.C.; Liu, C.; Tu, G.F. Solubility of RE2O3 (RE = La and Nd) in light rare earth fluoride molten salts. J. Rare Earths 2018, 36, 765–771. [Google Scholar] [CrossRef]
  37. Zhang, L.J. Study on Determination Method of Rare Earth Oxide Solubility in Rare Earth Molten Salt. Ph.D. Thesis, Northeastern University, Shenyang, China, 2018. [Google Scholar]
  38. Liu, K.R. Study on Molten Salt Properties and Electrode Process of Neodymium Electrolysis. Ph.D. Thesis, Northeastern University, Shenyang, China, 2001. [Google Scholar]
  39. Hu, X.W. Research and Application of Molten Salt Structure of NdF3-LiF-Nd2O3 Series. Ph.D. Thesis, Northeastern University, Shenyang, China, 2009. [Google Scholar]
  40. Liang, X.; Chen, S.; Hong, K.; Chen, D.; Li, Z.; Lai, Y.; Xu, J. Solubility of La2O3 in LaF3-LiF molten salt system. J. Chin. Soc. Rare Earths 2021, 39, 594–600. [Google Scholar]
  41. Xu, M.X. Study on Physicochemical Properties of Molten Salts of LaF3-LiF-La2O3 Series. Ph.D. Thesis, Northeastern University, Boston, MA, USA, 2014. [Google Scholar]
  42. Zhu, X.P. Research of Physical and Chemical Properties of LaF3-LiF-La2O3 Molten Salt System. Master’s Thesis, Northeastern University, Shenyang, China, 2012. [Google Scholar]
  43. Cai, B.Q. Preparation of Yb-Ni Master Alloy by Electrolysis of LiF-YbF3-Yb2O3 Molten Salt System and Its Mechanism. Ph.D. Thesis, Jiangxi University of Science and Technology, Ganzhou, China, 2022. [Google Scholar]
  44. Murphy, J.E.; Dysinger, D.K.; Chambers, M.F. Electrowinning Neodymium Metal from Chloride and Oxide–Fluoride Electrolytes. In Proceedings of the Technical Sessions Presented by the TMS Light Metals Committee at the 123rd TMS Annual Meeting, San Francisco, CA, USA, 1 January 1994; p. 137. [Google Scholar]
  45. Chen, J.S. Electrolytic Molten Salt Properties and Electrode Process of Rare Earth Oxides in Cheap Fluorine Salt System. Ph.D. Thesis, Northeastern University, Shenyang, China, 1999. [Google Scholar]
  46. Xiong, Z.W.; Liu, A.M.; Liu, Y.B. Dissolution Behavior of La2O3 in LiF-NaF Molten Salt System. J. Mater. Metall. 2022, 21, 167–171, 183. [Google Scholar]
  47. Wang, X.; Zeng, J.Y.; Cai, B.Q. Solubility of Y2O3 in NaF-AlF3-LiF molten salt system. Rare Met. Cem. Carbides 2020, 48, 29–32. [Google Scholar]
  48. Reddy, R.G.; Kumar, S.G. Solubility and thermodynamic properties of Y2O3 in LiF-YF3 melts. Metall. Mater. Trans. B Process Metall. Mater. Process. Sci. 1994, 25, 91–96. [Google Scholar] [CrossRef]
  49. Liao, C.F.; Sun, Q.C.; Wang, X. Study on Solubility of Yb2O3 in LiF-CaF2 Molten Salt. J. Chin. Soc. Rare Earths 2019, 37, 99–104. [Google Scholar]
  50. Du, S.L.; Wu, M.H.; Du, F.Y.; Liu, Y.M. Solubility of Rare Earth Oxides in Alkali Metal and Alkaline Earth Metal Fluoride Molten Salts. Chin. Rare Earths 1987, 2, 59–62. [Google Scholar]
  51. Porter, B.; Brown, E.A. Determination of Oxide Solubility in Molten Fluorides; U. S. Dept. of the Interior; Bureau of Mines: Washington, DC, USA, 1961.
  52. Wu, W.Y.; Zhang, J.S. Solubility of Rare Earth Oxide in LiF-BaF2-REF3 System. Non-Ferr. Min. Metall. 2000, 6, 34–36. [Google Scholar]
  53. Pshenichny, R.N.; Omelchuk, A.A. Interaction of rare-earth oxides with binary molten mixtures of zirconium and alkali metal fluorides. Russ. J. Inorg. Chem. 2012, 57, 115–119. [Google Scholar] [CrossRef]
  54. Ambrová, M.; Jurišová, J.; Danielik, V.; Gabčová, J. On the solubility of lanthanum oxide in molten alkali fluorides. J. Therm. Anal. Calorim. 2008, 91, 569–573. [Google Scholar] [CrossRef]
  55. Liu, F.Y. Fundamental Electrochemical Study on Neodymium Molten Salt Electrolysis in Fluoride Bath. Ph.D. Thesis, The Faculty and the Board of Trustees of the Colorado School of Mines, St. Golden, CO, USA, 2019. [Google Scholar]
  56. Zhu, X.P. The study on Physicochemical Properties of REF3-LiF-RE2O3 Molten Salt. Ph.D. Thesis, Northeastern University, Shenyang, China, 2012. [Google Scholar]
  57. Chen, L.Y.; Liu, S.Z.; Li, B. Study on Solubility and Dissolution Rate of Nd2O3 in NdF3-LiF Molten Salt by Square Wave Voltammetry. Chin. J. Rare Met. 2016, 40, 225–243. [Google Scholar]
  58. Keller, R.; Larimer, K.T. Electrolysis of Neodymium Oxide. Final Report for the Period August 19, 1991 through February 28, 1997; EMEC Consultants: Export, PA, USA, 1997. [Google Scholar]
  59. Abbasalizadeh, A.; Teng, L.; Seetharaman, S.; Sietsma, J.; Yang, Y. Rare Earth Extraction from NdFeB Magnets and Rare Earth Oxides Using Aluminum Chloride/Fluoride Molten Salts. Rare Earths Ind. Technol. Econ. Environ. Implic. 2016, 357–373. [Google Scholar]
  60. Yang, Y.; Walton, A.; Sheridan, R.; Güth, K.; Gauß, R.; Gutfleisch, O.; Buchert, M.; Steenari, B.M.; Gerven, V.T.; Jones, P.T.; et al. REE Recovery from End-of-Life NdFeB Permanent Magnet Scrap: A Critical Review. J. Sustain. Metall. 2017, 3, 122–149. [Google Scholar] [CrossRef]
  61. Remazeilles, C.; Gibilaro, M.; Massot, L.; Chiron, C.; Martinez, A.M.; Chamelot, P. In-situ electrochemical oxide monitoring in LiF-NdF3-Nd2O3: Application to Nd2O3 solubility determination. J. Electroanal. Chem. 2021, 893, 115334. [Google Scholar] [CrossRef]
  62. Takeda, O.; Nakano, K.; Kobayashi, F.; Lu, X.; Sato, Y.; Zhu, H. Solubilities of RE2O3 in REF3-LiF (RE = Nd, Dy) at 1473 K. J. Sustain. Metall. 2022, 8, 1498–1508. [Google Scholar] [CrossRef]
  63. Bratland, D. On the Possible Electrowinning of Yt-Al Alloys. The Solubility of Yttria and of Alumina in Molten Mixtures of Yttrium Fluoride and Lithium Fluoride. Light Met. 1976, 1, 183–201. [Google Scholar]
  64. Jung, I.V.; Ende, M. Computational thermodynamic calculations: FactSage from CALPHAD thermodynamic database to virtual process simulation. Metall. Mater. Trans. B 2020, 51, 1851–1874. [Google Scholar] [CrossRef]
  65. Bale, C.W.; Bélisle, E.; Chartrand, P.; Decterov, S.; Eriksson, G.; Gheribi, A.; Hack, K.; Jung, I.H.; Kang, Y.B.; Melançon, J.; et al. Reprint of: FactSage thermochemical software and databases, 2010–2016. Calphad 2016, 55, 1–19. [Google Scholar] [CrossRef]
  66. Davies, R.; Dinsdale, A.; Gisby, J.; Robinson, J.; Martin, S. MTDATA-thermodynamic and phase equilibrium software from the national physical laboratory. Calphad 2002, 26, 229–271. [Google Scholar] [CrossRef]
  67. Andersson, J.; Helander, T.; Höglund, L.; Shi, P.; Sundman, B. Thermo-Calc & DICTRA, computational tools for materials science. Calphad 2002, 26, 273–312. [Google Scholar]
Figure 1. Schematic diagram of solubility determination using isothermal saturation method.
Metals 14 00314 g001
Figure 2. Time required for RE2O3 to reach saturation in the REF3-LiF system [35,46].
Metals 14 00314 g002
Figure 3. Relationship between the contents of RE and the added RE2O3 in the molten salts [36]. (a) La2O3 in the 83 wt.% LaF3-17 wt.% LiF, (b) Nd2O3 in the 83 wt.% NdF3-17 wt.% LiF.
Metals 14 00314 g003
Figure 4. Heating and cooling curves of a certain material.
Metals 14 00314 g004
Figure 5. DSC results for NdF3-LiF (82.6–17.4 wt.%) and its mixtures with Nd2O3 (1.10, 1.77, 3.39 wt.% of total fluoride mass) [55].
Metals 14 00314 g005
Figure 6. Pseudo-binary phase diagrams of La2O3-83 wt.% LaF3-17 wt.% LiF and Nd2O3-83 wt.% NdF3-17 wt.% LiF [56].
Metals 14 00314 g006
Figure 7. Schematic diagram showing the square wave voltammetry method to determine solubility of Nd2O3 (5%) in the NdF3-LiF (90%:10%) salt at various times.
Metals 14 00314 g007
Figure 8. Liquidus points on the phase diagram of the NdF3-LiF-Nd2O3 system in the NdF3-rich corner (experimental data from [34,35,36,37,38,39,55,56,57,58,61,62]).
Metals 14 00314 g008
Figure 9. Liquidus points and estimated 1100 and 1150 °C isotherms on the phase diagram of NdF3-LiF-Nd2O3 system (experimental data from [36,37,38,39,57]).
Metals 14 00314 g009
Figure 10. Pseudo-binary phase diagram of NdF3-(LiF + Nd2O3) at fixed NdF3/LiF of 2.3 and 3.3 [35,36,57].
Metals 14 00314 g010
Figure 11. Liquidus points shown on the phase diagram of LaF3-LiF-La2O3 system in LaF3-rich corner (experimental data from [36,40,41,42]).
Metals 14 00314 g011
Figure 12. Pseudo-binary phase diagram of (LaF3 + LiF)-La2O3 at fixed LaF3/LiF of 1.9 and 3.2 [36,40,41].
Metals 14 00314 g012
Figure 13. Liquidus points shown on the phase diagram of YF3-LiF-Y2O3 system in YF3-rich corner.
Metals 14 00314 g013
Figure 14. Pseudo-binary phase diagram of (YF3 + LiF)-Y2O3 at fixed YF3/LiF of 1.9 and 5.6 [48,63].
Metals 14 00314 g014
Figure 15. Solubility of rare earth oxides (sREO) in fluoride melts as a function of temperature: (a) solubility vs. temperature and (b) logarithm of solubility vs. reciprocal of the temperature [25].
Metals 14 00314 g015
Figure 16. Solubility of rare earth oxides in fluoride melts as a function of REF3 content (data from Refs. [35,39,48,63]).
Metals 14 00314 g016
Figure 17. Relative error between the experimental data and the data calculated with the current model for Nd2O3 solubility [25].
Metals 14 00314 g017
Figure 18. Nd2O3 solubility in melts with different NdF3 concentration and at different temperatures (data from references [34,35,36,38,39,57,61]).
Metals 14 00314 g018
Table 1. Solubility of Nd2O3 in NdF3-LiF fluoride melts.
wt.%mol%Normalization (wt.%)T.
NdF3LiFNd2O3NdF3LiFNd2O3NdF3LiFNd2O3(°C)Ref.
58420.5415 85 0.08 57420.54800[35]
58420.7515 85 0.12 57420.74850[35]
58420.8215 85 0.13 57420.81860[35]
58420.9615 85 0.15 57420.95900[35]
63371.6818 82 0.29 62361.651000[38]
63372.2718 82 0.40 62362.211050[38]
63372.5718 82 0.45 61362.511100[38]
65352.0719 81 0.37 63352.03800[58]
66341.8320 80 0.34 65331.81000[36]
66341.9220 80 0.35 65331.881050[36]
66342.0320 80 0.37 65331.991100[36]
66342.1220 80 0.39 65332.081150[36]
68321.9622 78 0.38 67311.921000[35]
68322.5922 78 0.50 66312.521050[35]
68322.7322 78 0.53 66312.651100[35]
70309.2423 77 1.96 64288.46850[34]
70301.423 77 0.28 69301.38850[61]
70304.423 77 0.90 67294.211050[61]
70300.6823 77 0.14 69300.68750[38]
70300.823 77 0.16 69300.79800[38]
70300.9223 77 0.18 69300.91850[38]
70301.1123 77 0.22 69301.1900[38]
70302.823 77 0.57 68292.721100[57]
70303.123 77 0.63 68293.011150[57]
70303.523 77 0.71 68293.381200[57]
72282.0725 75 0.44 71272.031000[36]
72282.1725 75 0.46 71272.121050[36]
72282.2925 75 0.48 70272.241100[36]
72282.425 75 0.51 70272.341150[36]
73272.1826 74 0.47 71262.141000[38]
73272.7926 74 0.60 71262.711050[38]
73273.0826 74 0.67 71262.991100[38]
75257.228 72 1.69 70236.72800[34]
75258.328 72 1.96 69237.66850[34]
75259.428 72 2.24 69238.59900[34]
77231.4530 70 0.34 76231.43860[35]
77231.6130 70 0.38 76231.58900[35]
77232.2730 70 0.54 75232.221000[36]
77232.3930 70 0.57 75232.331050[36]
77232.5130 70 0.60 75232.451100[36]
77232.6230 70 0.63 75232.551150[36]
78222.4531 69 0.60 76212.391000[38]
78222.331 69 0.56 76222.251050[38]
78223.5231 69 0.87 75213.41100[38]
80207.2934 66 1.95 75196.79850[34]
81192.4935 65 0.66 79192.431000[36]
81192.6235 65 0.70 79192.551050[36]
81192.7335 65 0.73 79192.661100[36]
81192.7835 65 0.74 79192.71150[36]
83171.139 61 0.31 82171.09957[55]
83171.7539 61 0.49 81171.72979[55]
83173.439 61 0.97 80173.291053[55]
83173.0439 61 0.86 81162.951000[38]
83173.3639 61 0.96 80163.251050[38]
83172.4539 61 0.69 81172.391100[37]
83174.0939 61 1.17 80163.931100[38]
84162.740 60 0.79 82162.631000[36]
84162.8140 60 0.82 82162.731050[36]
84162.9240 60 0.86 81162.841100[36]
84163.0540 60 0.90 81162.961150[36]
85153.2842 58 1.00 82153.181050[39]
85153.8842 58 1.18 82153.741100[39]
85154.5442 58 1.39 81144.341150[39]
88123.8249 51 1.29 85123.681050[38]
88124.5449 51 1.54 84114.341100[38]
88.511.53.7450 50 1.29 85113.611050[39]
88.511.54.2350 50 1.46 85114.061100[39]
88.511.54.7150 50 1.63 85114.51150[39]
88.511.57.451 49 2.66 82116.891200[62]
90104.254 46 1.54 86104.031100[57]
90104.454 46 1.61 86104.211150[57]
90104.754 46 1.73 86104.491200[57]
9284.260 40 1.67 8884.031050[39]
9284.6260 40 1.84 8884.421100[39]
9284.9760 40 1.99 8884.731150[39]
Table 2. Solubility of La2O3 in LaF3-LiF fluoride melts.
wt.%mol%Normalization (wt.%)T.
LaF3LiFLa2O3LaF3LiFLa2O3LaF3LiFLa2O3(°C)Ref.
65351.420 80 0.26 64351.38950[40]
65351.5820 80 0.29 6434S1000[40]
65351.7820 80 0.33 64341.751050[40]
65351.9420 80 0.36 64341.91100[40]
65352.120 80 0.39 64342.061150[40]
65351.7920 80 0.33 64341.761000[36]
65351.8720 80 0.35 64341.841050[36]
65351.9420 80 0.36 64341.91100[36]
65352.0120 80 0.37 64341.971150[36]
70301.5424 76 0.32 69301.52950[40]
70301.7624 76 0.36 69291.731000[40]
70301.9424 76 0.40 69291.91050[40]
70302.224 76 0.45 68292.151100[40]
70302.3524 76 0.49 68292.31150[40]
72281.9925 75 0.43 70281.95948[41]
72282.0825 75 0.45 70282.04968[41]
72281.6425 75 0.35 70281.61980[42]
72282.1725 75 0.47 70282.12988[41]
72282.0125 75 0.43 70281.971000[36]
72282.1325 75 0.46 70282.091050[36]
72282.2625 75 0.49 70282.211100[36]
72282.3725 75 0.51 70282.321150[36]
75251.6528 72 0.38 74251.62950[40]
75251.9528 72 0.45 74251.911000[40]
75252.2328 72 0.52 73242.181050[40]
75252.528 72 0.58 73242.441100[40]
75252.6528 72 0.62 73242.581150[40]
76242.2330 70 0.53 75232.181000[36]
76242.1230 70 0.50 75232.081004[41]
76242.330 70 0.55 75232.251024[41]
76241.8130 70 0.43 75231.781035[42]
76242.3630 70 0.56 75232.311044[41]
76242.3530 70 0.56 75232.31050[36]
76242.4830 70 0.59 75232.421100[36]
76242.5830 70 0.62 74232.521150[36]
80202.3135 65 0.61 78202.261050[40]
80202.5335 65 0.67 78202.471100[40]
80202.7535 65 0.73 78192.681150[40]
80202.9335 65 0.78 78192.851200[40]
80203.0635 65 0.82 78192.971250[40]
80202.5635 65 0.68 78192.51050[36]
80202.1535 65 0.57 79192.11062[41]
80202.4535 65 0.65 78192.391082[41]
80201.9735 65 0.52 79191.931090[36]
80202.6935 65 0.71 78192.621100[36]
80202.5835 65 0.69 78192.521102[41]
80202.7835 65 0.74 78192.71150[36]
83172.1439 61 0.62 81172.11100[37]
83172.7339 61 0.79 81162.661050[36]
83172.8539 61 0.83 81162.771100[36]
83173.0139 61 0.88 81162.921150[36]
85152.6843 57 0.83 83152.611100[40]
85152.8543 57 0.88 83152.771150[40]
85153.0843 57 0.96 82152.991200[40]
85153.2543 57 1.01 82153.151250[40]
90103.254 46 1.19 87103.11200[40]
90103.554 46 1.30 87103.381250[40]
Table 3. Solubility of Y2O3 in YF3-LiF fluoride melts.
wt.%mol%Normalization (wt.%)T.
YF3LiFY2O3YF3LiFY2O3YF3LiFY2O3(°C)Ref.
58421.1720 80 0.26 58411.16725[48]
58421.2520 80 0.28 58411.23750[48]
58421.4820 80 0.33 58411.46800[48]
58421.8720 80 0.42 57411.84875[48]
58422.0920 80 0.47 57412.05920[48]
58422.3520 80 0.53 57412.3950[48]
58422.8720 80 0.65 57402.791000[48]
65351.2825 75 0.32 64341.26750[48]
65350.4525 75 0.11 65350.45810[63]
65351.6325 75 0.41 64341.6825[48]
65350.525 75 0.12 65350.5831[63]
65351.7925 75 0.45 64341.76850[48]
65350.5925 75 0.15 65350.59850[63]
65350.825 75 0.20 65350.79882[63]
65350.825 75 0.20 65350.79900[63]
65352.1125 75 0.53 64342.07900[48]
65350.8825 75 0.22 65340.87900[63]
65351.6525 75 0.41 64341.621000[63]
65352.9625 75 0.75 63342.871000[48]
65351.6525 75 0.41 64341.621000[63]
75251.6935 65 0.51 74241.661000[63]
79211.7240 60 0.57 78211.69750[48]
79212.1440 60 0.71 77212.1800[48]
79212.2640 60 0.75 77212.21825[48]
79212.9340 60 0.98 77202.85900[48]
79213.5240 60 1.18 76203.4950[48]
79214.940 60 1.66 75204.671000[48]
85153.7250 50 1.45 82153.59900[48]
85151.1950 50 0.46 84151.18900[63]
85151.4150 50 0.54 84151.39929[63]
85151.5150 50 0.58 84151.49943[63]
85154.4550 50 1.75 81144.26950[48]
85151.6150 50 0.62 84151.58964[63]
85151.7850 50 0.69 83151.75974[63]
85151.8850 50 0.73 83151.85988[63]
85155.3650 50 2.11 81145.091000[48]
85151.9850 50 0.77 83151.941000[63]
8515250 50 0.77 83151.961000[63]
85152.0950 50 0.81 83152.051009[63]
9192.264 36 1.02 8992.151000[63]
Disclaimer/Publisher’s Note: The statements, opinions and data contained in all publications are solely those of the individual author(s) and contributor(s) and not of MDPI and/or the editor(s). MDPI and/or the editor(s) disclaim responsibility for any injury to people or property resulting from any ideas, methods, instructions or products referred to in the content.

