Abstract
High-nitrogen austenitic steel (HNS) cold-rolled with a reduction rate of 25% was subjected to an investigation of the effect of annealing temperature on microstructural evolution, tensile properties and the variation in fracture surface morphology. In cold-rolled HNS, matrix recovery occurred at an annealing temperature of 600 °C, and recrystallization was locally initiated at an annealing temperature of 800 °C. The 0.2% offset yield strength (0.2% YS) and ultimate tensile strength (UTS) were almost constant up to an annealing temperature of 500 °C, and these values gradually decreased above the annealing temperature of 600 °C, while a sharp reduction in the percentage reduction in area (RA) occurred at the annealing temperatures of 600 and 700 °C due to Cr2N precipitation along the grain and twin boundaries. The ratio of 0.2% offset yield strength to ultimate tensile strength (0.2% YS/UTS) remained constant until matrix recovery took place; however, once recrystallization occurred, the ratio decreased significantly. Furthermore, the variation in the morphology of Cr2N along the grain boundaries in the annealing temperature range from 600 to 800 °C influenced the intergranular fracture morphology, resulting in a transition from dimple to ledge and back to dimple.
1. Introduction
High-nitrogen austenitic steel (HNS) is known for its excellent properties at room temperature, including a balance of strength and ductility, resistance to localized corrosion and erosion and excellent work hardenability [,,,], which is attributed to its low stacking fault energy [,,]. To stabilize the austenite structure up to room temperature, manganese and nitrogen were added to the steel, and the expensive nickel element added in conventional austenitic stainless steel was removed []. Consequently, HNS, which can offer competitive prices and excellent properties, can be produced for a diverse range of engineering applications, including retaining rings for power generation, non-magnetic drill collars for the oil and gas industry and materials for medical applications [,].
It is known that the precipitate of nitrides, carbides and sigma phases during the annealing process at elevated temperatures can reduce the material’s ductility and corrosion resistance [,,,,,,]. Recently, Takaki et al. investigated the time–temperature–precipitation (TTP) and tensile properties of HNS (18Cr-18Mn-2Mo-0.9N) []. They observed different evolution behaviors of the precipitations in three different temperature ranges, and the Cr2N precipitate was dominant above 800 °C, which is consistent with the degradation of tensile properties. Feng et al. studied TTP behavior in the temperature range from 700 to 950 °C in HNS (18Cr-12Mn-0.48N) []. In their study, the Cr2N precipitate morphology transformed from intergranular to lamellar Cr2N of the cellular type, and the nose temperature of Cr2N precipitation in the TTP diagram was approximately 800 °C. Hong et al. studied the effects of hot working on the microstructural evolution of HNS [,]. They observed dynamic recrystallization at temperatures over 900 °C and the degradation in toughness due to carbides precipitated on the grain boundary at temperatures below 850 °C. Although the TTP behavior, microstructural evolution and mechanical properties of Cr2N in the as-quenched state during hot working have been studied in HNS, little research has been carried out on the effect of cold working on the microstructural evolution, the variation in nose temperature of Cr2N precipitation and the influence of the variation in Cr2N morphology on fracture surface morphology.
Therefore, the purpose of this paper is to investigate the effects of annealing temperatures on Cr2N precipitation behavior and the recrystallization of the steel cold-rolled with a reduction rate of 25% and to investigate the correlation between the variation in Cr2N morphology and the variation in fracture surface morphology. In addition, this paper discussed the relationship between the microstructural characteristics and the change in tensile properties.
2. Experimental Procedure
The chemical composition of the HNS examined in this study is listed in Table 1. The phase diagram of HNS is shown in Figure 1, which was calculated using JMatPro software (Version 12) based on Thermotech Fe data. M2X particles can be precipitated below an annealing temperature of 950 °C. An 80 kg ingot was produced using the pressurized vacuum induction melting (PVIM) method. The ingot was then forged into a square bar of T 60 mm × W 120 mm × L 800 mm in the temperature range from 950 to 1200 °C. Afterward, the billet underwent a solid-solution heat treatment at 1100 °C for 3 h, followed by water quenching. A square block of T60 × W120 × L20 mm was cut from the billet and tested for its microstructure and mechanical properties in the as-quenched state. Additionally, the billet was machined into a square plate of W 100 mm × L 150 mm × T 13 mm, which experienced a cold-rolling reduction rate (plate thickness reduction ratio of the final thickness to the initial thickness) of 25% at room temperature. The cold-rolled specimens were subsequently annealed in an air environment at a temperature range from 300 to 900 °C at a heating rate of 50 °C/h, held for 5 h and then air-cooled to room temperature.

Table 1.
Chemical composition of high-nitrogen austenitic steel (HNS).
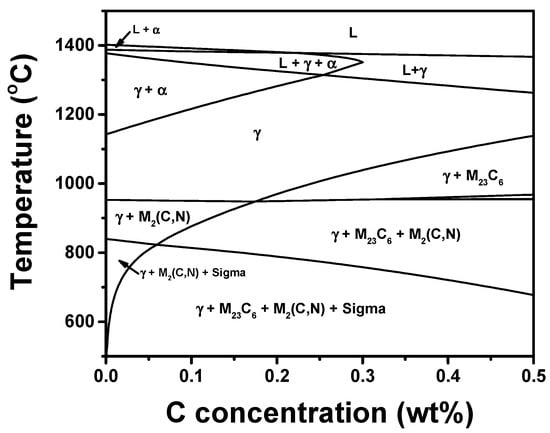
Figure 1.
Phase diagram of the investigated HNS.
The microstructures of the as-quenched, as-cold-rolled and annealed specimens were examined using an optical microscope (OM, ZEISS Axioplan, Jena, Germany) and a scanning electron microscope (SEM, HITACHI S-3400N, Tokyo, Japan and FE-SEM, CZ/MIRA I LMH, Brno, Czech Republic). The specimens were mechanically polished, followed by chemical etching with a Glyceregia reagent (40%HCl+10%HNO3+30%Glycerol) (30 mL hydrochloric acid, 20 mL glycerin, and 10 mL nitric acid), all conducted at room temperature. The phases of as-quenched and as-cold-rolled specimens were identified using X-ray diffraction (XRD, Rigaku D2500, Tokyo, Japan). Vickers hardness of the annealed specimens was measured with a load of 5 kgf. The specimens for the tensile test were prepared according to ASTM A370/ASME SA-370 and were subjected to a constant strain rate of 2 × 10⁻³ s−1 (Instron Co., Instron 5585, Norwood, MA, USA). After the tensile test at room temperature, the fracture surface was observed with a scanning electron microscope (SEM, HITACHI S-3400N), while precipitates along the grain and twin boundaries were observed using a scanning transmission electron microscope (STEM, JEM-2100F, JEOL, Tokyo, Japan) operating at an accelerating voltage of 200 kV and using a beam spot size with a 0.2 nm diameter.
3. Experimental Results
3.1. Microstructures
The specimen, which was water-quenched after solid-solution heat treatment at 1100 °C for 3 h, consisted of a complete austenite structure, as shown in the optical micrograph and XRD analysis in Figure 2a and 2c, respectively. A few grains showed annealing twins, and no precipitate was observed on the grain boundaries. The average grain size was about 147 μm. Figure 2b exhibited the microstructure of the specimen cold-rolled with a reduction rate of 25%, showing a slip band inside the grains. XRD analysis of the cold-rolled specimen, as shown in Figure 2c, also indicated that the austenite structure was stably present. However, two different behaviors in the XRD pattern were observed after the cold-rolling reduction rate of 25%. Firstly, diffraction peak broadening was observed at each Miller index. Secondly, the Miller indices showing second peak intensity shifted from the (220) plane to the (200) plane after cold-rolling. The observed diffraction peak broadening in the cold-rolled specimen could be attributed to the strain effect within the matrix, resulting from an increased dislocation density caused by cold-rolling. The degree of diffraction peak broadening was quantitatively evaluated by measuring the full width at half maximum (FWHM), as shown in Figure 2d. All planes exhibited the broadening of FWHM except the (220) plane. Integrated intensity at each peak position is shown in Figure 2e. After the cold-rolling, the integrated intensity of the (220) plane decreased, while the integrated intensity of the (200) plane increased. The comparable FWHM values for the (220) plane before and after cold-rolling combined with the reduction in the integrated intensity for the (220) plane and the increase in the (200) plane imply that the (200) plane becomes the preferred orientation as a result of the cold-rolling.
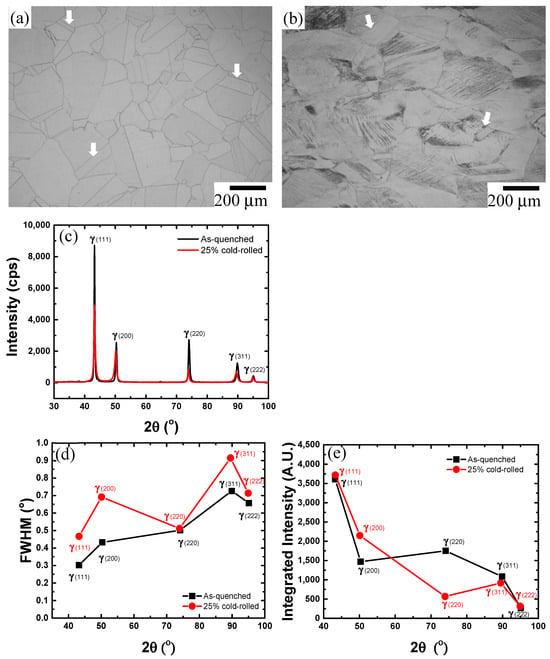
Figure 2.
Microstructural variation and phase stability after cold-rolling: (a) optical micrograph of the as-quenched specimen, (b) optical micrograph of the specimen cold-rolled with a reduction rate of 25%, (c) X-ray diffraction pattern before and after cold-rolling, and a comparison of (d) full width at half maximum (FWHM) and (e) integrated intensity before and after cold-rolling. White arrows indicate annealing twins.
Even after the cold-rolling with a reduction rate of 25%, the high stability of the austenite structure remained due to the high concentration of manganese and nitrogen. The remarkable stability of the austenite structure in HNS is further confirmed by the exceedingly low Ms and Md30 temperatures, which are reported in Table 2 and Table 3 [].

Table 2.
MS temperature calculated by various equations.

Table 3.
Md30 temperature calculated by various equations.
Here, the Ms temperature denotes the initiation temperature of martensitic transformation, whereas the Md30 temperature corresponds to the temperature at which 50% α′-martensite is formed following 30% tensile deformation. Optical micrographs of the specimens with annealing temperature are shown in Figure 3. Slip bands and annealing twins were clearly observed in the specimens annealed up to 700 °C. The recrystallized grains in the specimen annealed at 800 °C were locally observed on grain boundaries and inside grains, and slip bands were still present in a few grains. However, the specimen annealed at 900 °C exhibited completely recrystallized grains, and the average grain size was about 66 μm. A few grains showed annealing twins, and no precipitates were observed within the grains or along the grain boundaries.
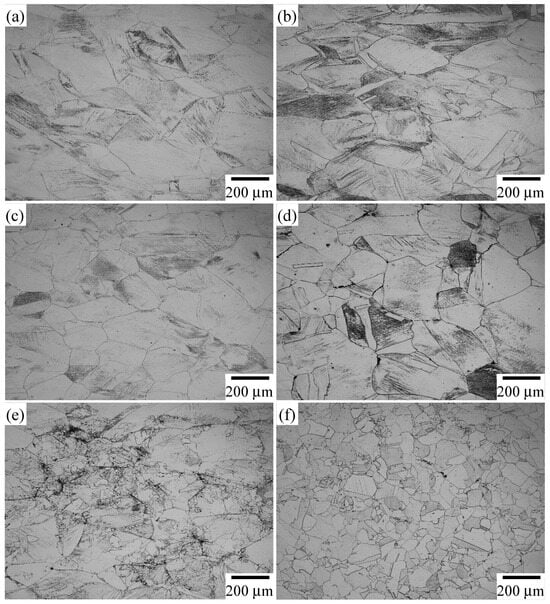
Figure 3.
Optical microstructures of the specimens annealed at (a) 400 °C, (b) 500 °C, (c) 600 °C, (d) 700 °C, (e) 800 °C, (f) 900 °C.
SEM micrographs shown in Figure 4 represented the morphology evolution of precipitates with various annealing temperatures. No precipitate was observed at an annealing temperature below 500 °C, whereas it was observed in the annealing temperature range between 600 and 800 °C. No precipitate was also observed at an annealing temperature of 900 °C. Continuous and spherical precipitates were locally observed along the grain and twin boundaries in the specimen annealed at 600 °C, whereas a continuous and cellular shape of precipitate was observed along the grain boundaries in the specimen annealed at 700 °C. The specimen annealed at 800 °C mainly showed spherical precipitates at the grain boundaries. Precipitates observed along the grain boundaries in the specimen annealed at 800 °C were verified as Cr2N from their trigonal structure by analyzing the TEM micrograph and selected area diffraction (SAD) pattern, as shown in Figure 5 [,,,,]. Lee et al. [] showed that the nose temperature of the Cr2N precipitate was about 800 °C, whereas in the HNS cold-rolled sample with a reduction rate of 25%, a cellular-type Cr2N precipitate was observed at an annealing temperature of 700 °C.
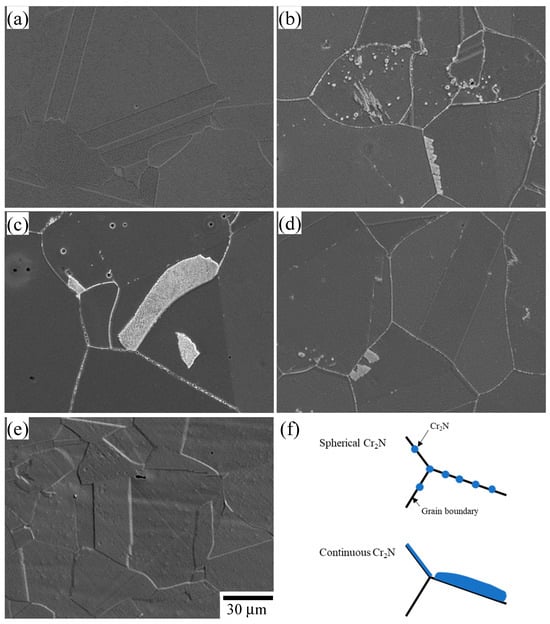
Figure 4.
SEM micrographs showing precipitate along grain boundaries of the specimens annealed at (a) 500 °C, (b) 600 °C, (c) 700 °C, (d) 800 °C and (e) 900 °C. (f) Schematic diagram of spherical Cr2N and continuous Cr2N particles.
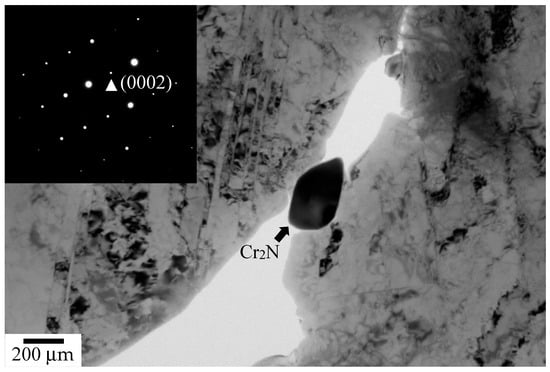
Figure 5.
TEM micrograph and selected area diffraction (SAD) pattern for Cr2N particle on grain boundary (Z = in the specimen annealed at 800 °C.
3.2. Mechanical Properties
Table 4 shows the tensile properties in the as-quenched and the as-cold-rolled specimens. Compared with the as-quenched specimen, the as-cold-rolled specimen had an increased 0.2% offset yield strength (0.2% YS) and ultimate tensile strength (UTS) but a decreased percent elongation (El) and reduction in area (RA).

Table 4.
Tensile properties of the as-quenched and the as-cold-rolled specimens.
Hardness and tensile tests were performed on the specimens that were annealed from 300 to 900 °C after undergoing the cold-rolling reduction rate of 25%. Figure 6 shows the variation in hardness with the various annealing temperatures. Hardness remained nearly constant in the annealing temperature range between 300 and 500 °C, but it gradually decreased with increasing annealing temperature due to matrix recovery, recrystallization and grain growth, as shown in Figure 3. The hardness of the specimen annealed at 600 °C experienced a slight decrease by 12.2 Hv from 380.4 Hv to 368.2 Hv compared to the specimen annealed at 500 °C. The reduction in hardness can be attributed to the matrix recovery process, in contrast to the specimen annealed at 500 °C.
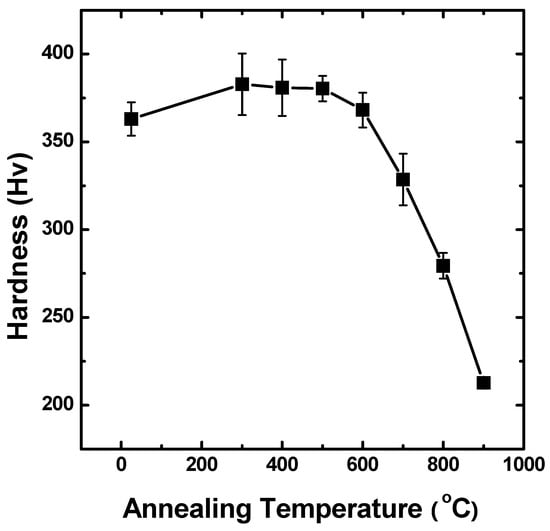
Figure 6.
Variation in hardness with annealing temperature.
Matrix recovery effects in the specimen annealed at 600 °C were also observed in the stress–strain curves, as shown in Figure 7. The stress–strain curves of the as-cold-rolled specimen and the specimen annealed up to 500 °C showed very similar trends. However, the yield strength of the specimen annealed at 600 °C exhibited a slight decrease of 26 MPa, from 974 Mpa to 921 Mpa, in comparison to the specimen annealed at 500 °C. The specimen annealed at the higher temperature showed a lower 0.2% YS and UTS. The specimens annealed at 600 and 700 °C showed lower total strain than those annealed at 500 °C, which was associated with Cr2N precipitation along the grain boundaries. The stress–strain curves presented in Figure 7 were used to plot UTS, 0.2% YS, El and RA against the annealing temperature, as shown in Figure 8. The 0.2% YS and UTS did not show a significant change up to an annealing temperature of 500 °C. However, they showed a gradual reduction at an annealing temperature above 600 °C due to matrix recovery, which was in good agreement with the result of the hardness test. There was a steep drop in 0.2% YS of the specimen annealed at 800 °C due to recrystallization. The RA sharply decreased in the annealing temperature of 600 °C and 700 °C, as shown in Figure 8b. However, the RA in the specimen annealed at 800 °C started to increase, and El also rapidly increased due to the influence of recrystallization. The specimen annealed at 900 °C showed an El and RA similar to the as-quenched specimen.
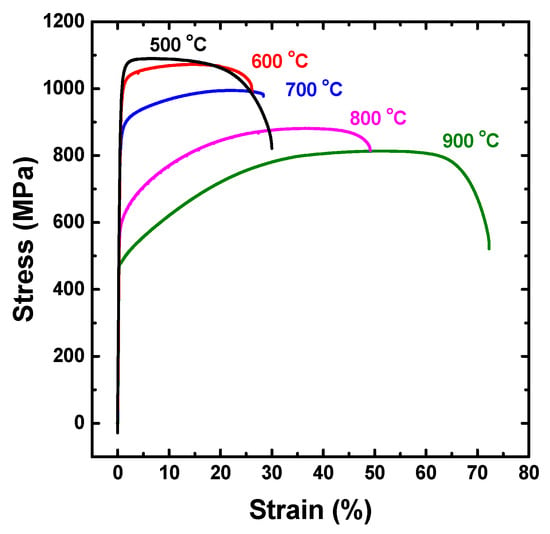
Figure 7.
Stress–strain curve of the specimens annealed at various temperatures.
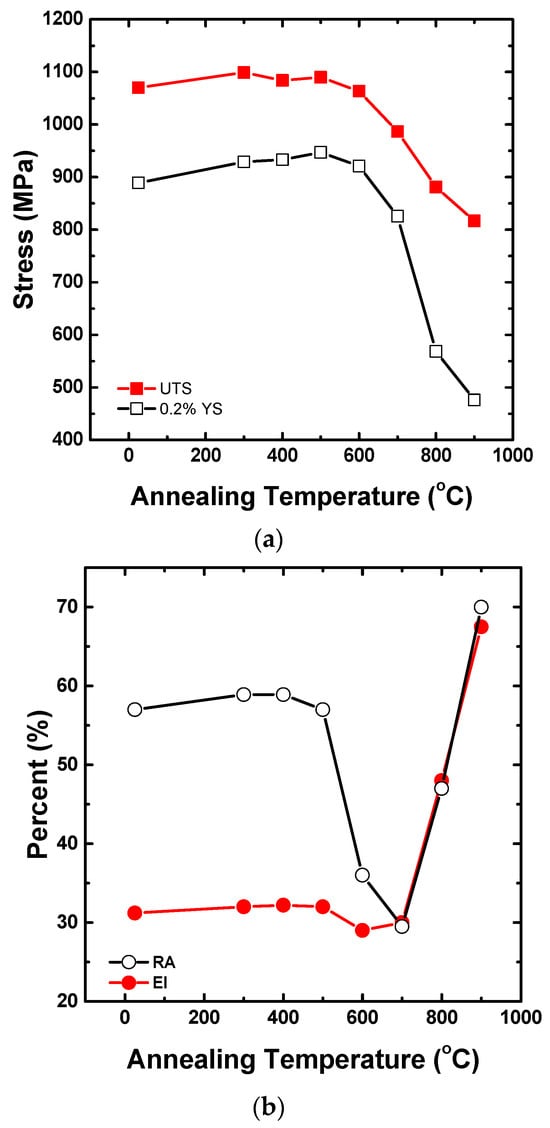
Figure 8.
The variation in (a) 0.2% YS and UTS, as well as (b) El and RA, with annealing temperature of the specimen cold-rolled with a reduction rate of 25%.
3.3. Fractography
The fractography of the specimens after the tensile test revealed that the annealing temperature in cold-rolled HNS had a significant effect on the fracture surface morphology, as shown in Figure 9. The as-cold-rolled and annealed specimens in the temperature range from 300 to 500 °C showed ductile transgranular fracture modes with dimples, as shown in Figure 9a, which correlated well with the high El and RA. Fracture surface features in the specimens annealed at 600 and 700 °C were intergranular fracture modes, which were associated with the steep drop in RA and El. The fracture surface of the specimen annealed at 600 °C exhibited ledges and dimples, whereas ledges were dominantly observed in the fracture surface of the specimen annealed at 700 °C.
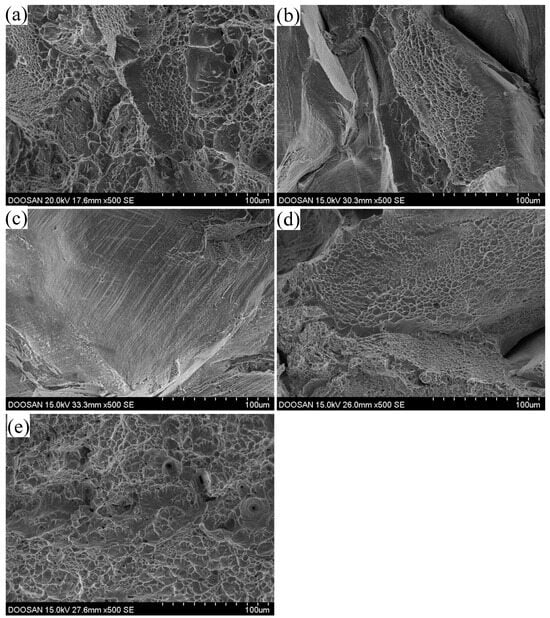
Figure 9.
Fracture surface of the specimens annealed at (a) 500 °C, (b) 600 °C, (c) 700 °C, (d) 800 °C and (e) 900 °C.
Intergranular fracture and transgranular fracture modes were found together in the specimens annealed at 800 °C. It was estimated that the intergranular fracture surface with a dimple was formed when spherical Cr2N precipitate was present on the grain boundaries, and the transgranular fracture surface was formed when the crack propagated in the region without Cr2N precipitate on the grain boundaries. The specimens annealed at 900 °C showed a completely transgranular fracture surface with a dimple.
4. Discussion
4.1. Effects of Cr2N Shape on Fracture Surface Morphology
The microstructural characteristics that changed depending on the annealing temperature of the specimen cold-rolled with a reduction rate of 25% influenced the fracture surface morphology after the tensile test. It was observed that there was no significant change in microstructure when the specimens were annealed within the temperature range of room temperature to 500 °C. Consequently, the fracture behavior remained consistent with a ductile transgranular mode with a dimple. Dimples inside grains were formed due to dislocation pile-ups on slip planes at immovable dislocations [,].
Figure 4 exhibited the presence of Cr2N particles that precipitated along the grain and twin boundaries in the specimens annealed at a temperature range from 600 to 800 °C. The nose temperature of Cr2N precipitation of the HNS cold-rolled with a reduction rate of 25% was approximately 700 °C. When hard Cr2N precipitate formed on the grain and twin boundaries, it worked as an effective barrier for dislocation slip so that the local stress concentration around the Cr2N precipitate on the grain and twin boundaries created microcracks, which propagated along the boundary during plastic deformation [,]. The crack path was associated with the intergranular fracture mode and low RA in the specimens.
Two different types of intergranular fracture surfaces characterized by ledges and dimples were observed, as shown in Figure 9. It seems that the discrepancy of intergranular fracture surface between ledges and dimples depends on the shape of the Cr2N precipitate. When the specimen was annealed at 600 and 700 °C, predominantly continuous Cr2N precipitates formed on the grain boundaries, as shown in Figure 4. This continuous precipitate effectively prevented dislocation slip and led to the formation of dislocation slip bands with ledges along the boundaries between the matrix and continuous Cr2N precipitates during plastic deformation [,]. A crack with ledges initiated at the boundaries between the matrix and continuous Cr2N precipitates when stress was locally concentrated by preventing dislocation slip. The crack could then propagate along the grain boundaries, resulting in the formation of an intergranular fracture surface characterized by ledges on the grain boundaries, as shown in Figure 9b,c. This mechanism was associated with the intergranular fracture surface of ledges on grain boundaries.
The other intergranular fracture surface characterized by dimples was a consequence of microvoid coalescence around spherical Cr2N precipitates along the grain boundaries during plastic deformation [,]. Microvoids were formed due to stress concentration around the spherical Cr2N precipitates on the grain boundaries, preventing dislocation slip during plastic deformation.
Consequently, the type of intergranular fracture surface observed in each specimen was highly dependent upon the shape of the Cr2N precipitated on the grain boundaries during annealing heat treatment. Specifically, when a continuous or cellular shape of Cr2N precipitated on grain boundaries in the specimen annealed at 700 °C, it showed an intergranular fracture surface with only ledges. However, in the specimen annealed at 800 °C, an intergranular fracture surface with only dimples was observed, likely because of the predominant presence of spherical Cr2N precipitate on the grain boundaries. In the case of the specimen annealed at 600 °C, an intergranular fracture surface exhibited ledges and local dimples because of the presence of locally spherical precipitate, despite the predominantly continuous precipitate being present on the grain boundaries.
In the specimen that was annealed at 900 °C, the fracture surface exhibited a ductile transgranular fracture mode with dimples since the Cr2N particles did not precipitate along the grain and twin boundaries.
4.2. Recrystallization Effects on Mechanical Properties
An increase in the annealing temperature of the specimen cold-rolled with a reduction rate of 25% resulted in a decrease in hardness, 0.2% YS and UTS at room temperature. This observation is consistent with the anticipated effects of recovery, recrystallization and grain growth process, as shown in Figure 3. Interestingly, the cold-rolled specimen subjected to an annealing temperature range from 300 to 500 °C exhibited higher hardness and ultimate tensile strength compared to the as-cold-rolled specimen. The increase in mechanical properties was attributed to the significant interaction between partial dislocation and nitrogen in samples annealed below 500 °C [].
The relationship between UTS and hardness in specimens annealed at various temperatures in the cold-rolled steel followed a linear trend, as shown in Figure 10, indicating that the conventional method of estimating UTS based on hardness measurement is also valid in the steel. Specifically, UTS can be calculated using the following relation:
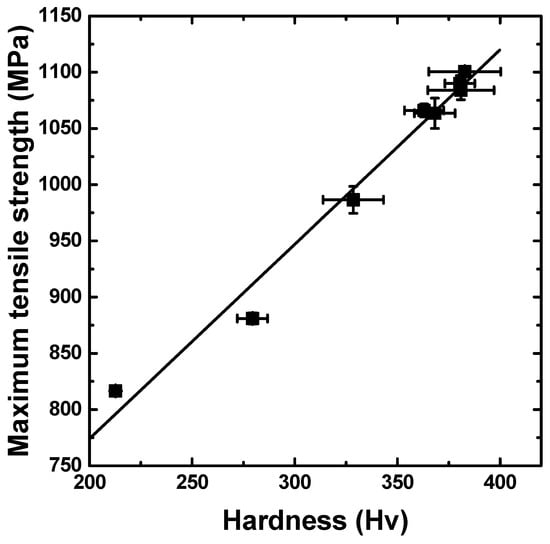
Figure 10.
Relationship between hardness and UTS in HNS. The solid line represents the value predicted by an empirical formula.
When recrystallization locally occurred at the annealing temperature of 800 °C, a significant drop in 0.2% YS as well as a reduction in the ratio of 0.2% YS to UTS were observed, as shown in Figure 8a and Figure 11, respectively. The strength ratio (0.2% YS/UTS) was observed to be approximately 0.85 at an annealing temperature range from 300 to 700 °C, whereas it decreased to less than 0.65 in the specimens annealed over 800 °C. The matrix recovery during annealing was found to have little effect on the strength ratio, whereas the occurrence of recrystallization resulted in a significant reduction in the strength ratio [,]. Interestingly, the values of the strength ratio after recrystallization in the specimens annealed at 900 °C were similar to those of the as-quenched specimens. This suggests that the low dislocation density in the matrix during recrystallization played a critical role in the decrease in the strength ratio.
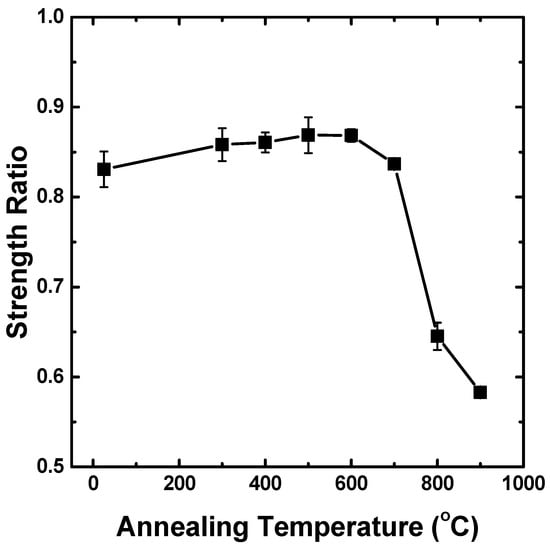
Figure 11.
Variation in the ratio of 0.2% YS to UTS with annealing temperature.
The annealing temperature at which cold-worked HNS was recrystallized without Cr2N precipitates was confirmed from the results of microstructure evolution and the change in tensile properties according to the changes in annealing temperature. For austenitic HNS, cold working and annealing heat treatment processes can be used for grain refinement.
5. Conclusions
- (1)
- In the annealing temperature range of 600 to 800 °C, the precipitates of Cr2N particles along grain boundaries were observed, with the shape of the particles being either continuous or spherical. Furthermore, a continuous cellular shape of Cr2N precipitation was observed in the specimen annealed at 700 °C and in the specimen cold-rolled with a reduction rate of 25%. Notably, the morphology of the precipitates was found to be associated with the type of intergranular fracture, with spherical Cr2N particles exhibiting dimpled fracture surfaces and continuous Cr2N particles exhibiting ledge features.
- (2)
- After exposure to a cold-rolling reduction rate of 25%, the microstructure, hardness, 0.2% YS and UTS of the specimens remained relatively constant up to the annealing temperature of 500 °C, whereas recrystallized grains were observed when annealed at temperatures exceeding 800 °C.
- (3)
- The strength ratio maintained a constant value of approximately 0.85 until an annealing temperature of 700 °C, indicating that the strength ratio was unaffected by matrix recovery. However, a sharp decline in the strength ratio was observed in the specimen annealed over 800 °C, implying that the strength ratio was affected by recrystallization.
- (4)
- A linear relationship between UTS and hardness was observed in HNS, and an empirical relationship was proposed to predict UTS from hardness values.
Author Contributions
Conceptualization, J.-H.S. and J.-Y.S.; methodology, J.-H.S. and Jeong-Young Song; validation, J.-Y.S. and Y.-W.M.; formal analysis, J.-H.S.; investigation, J.-H.S. and J.-Y.S.; data curation, J.-Y.S.; writing—original draft preparation, J.-H.S.; writing—review and editing, J.-H.S., J.-Y.S. and Y.-W.M.; supervision, Y.-W.M.; funding acquisition, J.-H.S. and Y.-W.M. All authors have read and agreed to the published version of the manuscript.
Funding
This research was supported by an R&D program funded by Doosan Enerbility and was also supported by a grant (20181110100410) from the Korea Institute of Energy Technology Evaluation and Planning (KETEP), which is funded by The Ministry of Trade, Industry and Energy (MOTIE, Korea).
Data Availability Statement
The raw data supporting the conclusions of this article will be made available by the authors on request.
Conflicts of Interest
Authors Jong-Ho Shin, Jeon-Young Song and Young-Wha Ma was employed by the company Doosan Enerbility Co., Ltd. All authors declare that the research was conducted in the absence of any commercial or financial relationships that could be construed as a potential conflict of interest.
References
- Ha, H.; Kwon, H. Effects of Cr2N on the pitting corrosion of high nitrogen stainless steels. Electrochim. Acta 2007, 52, 2175–2180. [Google Scholar] [CrossRef]
- Byrnes, M.L.G.; Grujicic, M.; Owen, W.S. Nitrogen strengthening of a stable austenitic stainless steel. Acta Metall. 1987, 35, 1853–1862. [Google Scholar] [CrossRef]
- Werner, E. Solid solution and grain size hardening of nitrogen-alloyed austenitic steels. Mater. Sci. Eng. A 1988, 101, 93–98. [Google Scholar]
- Simmons, J.W. Overview: High-nitrogen alloying of stainless steels. Mater. Sci. Eng. A 1996, 207, 159–169. [Google Scholar] [CrossRef]
- Saller, G.; Spiradek-Hahn, K.; Scheu, C.; Clemens, H. Microstructural evolution of Cr–Mn–N austenitic steels during cold work hardening. Mater. Sci. Eng. A 2006, 427, 246–254. [Google Scholar] [CrossRef]
- Müller, P.C.; Solenthaler, C.; Uggowitzer, P.; Speidel, M.O. On the effect of nitrogen on the dislocation structure of austenitic stainless steel. Mater. Sci. Eng. A 1993, 164, 164–169. [Google Scholar] [CrossRef]
- Llewellyn, D.T. Work hardening effects in austenitic stainless steel. Mater. Sci. Technol. 1997, 13, 389–400. [Google Scholar] [CrossRef]
- Ustinovshikov, Y.; Ruts, A.; Bannykh, O.; Blinov, V.; Kostina, M. Microstructure and properties of the high-nitrogen Fe-Cr austenite. Mater. Sci. Eng. A 1999, 262, 82–87. [Google Scholar] [CrossRef]
- Shin, J.; Lee, J. Effects of twin intersection on the tensile behavior in high nitrogen austenitic stainless steels. Mater. Charact. 2014, 91, 19–25. [Google Scholar] [CrossRef]
- Simmons, J.W. Strain hardening and plastic flow properties of nitrogen-alloyed Fe-17Cr-(8–10)Mn-5Ni austenitic stainless steel. Acta Mater. 1997, 45, 2467–2475. [Google Scholar] [CrossRef]
- Lee, T.; Kim, S.; Jung, Y. Crystallographic details of precipitates in Fe-22Cr-21Ni-6Mo-(N) superaustenitic stainless steels aged at 900 C. Met. Mater. Trans. A 2000, 31, 1713–1723. [Google Scholar] [CrossRef]
- Weiss, B.; Stickler, R. Phase instabilities during high temperature exposure of 316 austenitic stainless steel. Metall. Trans. 1972, 3, 851–866. [Google Scholar] [CrossRef]
- Spruiell, J.E.; Scott, J.A.; Ary, C.S.; Hardin, R.L. Microstructural stability of thermal-mechanically pretreated type 316 austenitic stainless steel. Metall. Trans. 1973, 4, 1533–1544. [Google Scholar] [CrossRef]
- Simmons, J.W.; Atteringe, D.G.; Rawers, J.C. Sensitization of high-nitrogen austenitic stainless steels by dichroium nitride precipitation. Corros. Sci. 1994, 50, 491–501. [Google Scholar] [CrossRef]
- Simmons, J.W. Influence of nitride (Cr2N) precipitation on the plastic flow behavior of high-nitrogen austenitic stainless steel. Scr. Met. Mater. 1995, 32, 265–270. [Google Scholar] [CrossRef]
- Li, H.; Jiang, Z.; Feng, H.; Ma, Q.; Zhan, D. Aging precipitation behavior of 18Cr-16Mn-2Mo-1.1N high nitrogen austenitic stainless steel and its influences on mechanical properties. J. Iron Steel Res. Int. 2012, 19, 43–51. [Google Scholar] [CrossRef]
- Lee, T.; Kim, S.; Takaki, S. Time-temperature-precipitation characteristics of high-nitrogen austenitic Fe-18Cr-18Mn-2Mo-0.9N steel. Metal. Mater. Trans. A 2006, 37, 3445–3454. [Google Scholar] [CrossRef]
- Shi, F.; Wang, L.; Cui, W.; Liu, C. Precipitation kinetics of Cr2N in high nitrogen austenitic stainless steel. J. Iron Steel Res. Int. 2008, 15, 72–77. [Google Scholar] [CrossRef]
- Hong, C.M.; Shi, J.; Sheng, L.Y.; Cao, W.C.; Hui, W.J.; Dong, H. Effects of hot-working parameters on microstructural evolution of high nitrogen austenitic stainless steel. Mater. Des. 2011, 32, 3711–3717. [Google Scholar] [CrossRef]
- Hong, C.M.; Shi, J.; Sheng, L.; Cao, W.; Hui, W.; Dong, H. Influence of hot working on microstructure and mechanical behavior of high nitrogen stainless steel. J. Mater. Sci. 2011, 46, 5097–5103. [Google Scholar] [CrossRef]
- Frehn, A.; Ratte, E.; Bleck, W. Influence of temperature and strain rate on the mechanical properties and the formability of the austenitic stainless steel 1.4376 containing manganese and nitrogen. In High Nitrogen Steels; GRIPS media GmbH: Ostend, Belgium, 2004; pp. 447–460. [Google Scholar]
- Liao, L.; Zhao, Z.; Xu, F.; Zhang, W.; Li, J. Influence of N on precipitation behavior and transformation kinetics of super austenitic stainless steels after isothermal ageing at 900 °C. J. Mater. Res. Technol. 2022, 19, 3670–3684. [Google Scholar] [CrossRef]
- Lee, T.; Oh, C.; Han, H.; Lee, C.; Kim, S.; Takaki, S. On the crystal structure of Cr2N precipitates in high-nitrogen austenitic stainless steel. Acta Cryst. B 2005, 61, 137–144. [Google Scholar] [CrossRef] [PubMed]
- Lee, T.; Kim, S.; Takaki, S. On the crystal structure of Cr2N precipitates in high-nitrogen austenitic stainless steel. II. Order-disorder transition of Cr2N during electron irradiation. Acta Cryst. B 2006, 62, 190–196. [Google Scholar] [CrossRef] [PubMed]
- Liu, W.; Sh, J.B. Failure mode transition of Nb phase from cleavage to dimple/tear in Nb-16Si-based alloys prepared via spark plasma sintering. Mater. Des. 2016, 111, 301–311. [Google Scholar] [CrossRef]
- Gholami, M.; Vesely, J.; Altenberger, I.; Kuhn, H.A.; Janecek, M.; Wollmann, M.; Wagner, I. Effects of microstructure on mechanical properties of CuNiSi alloys. J. Alloys Compd. 2017, 696, 201–212. [Google Scholar] [CrossRef]
- Koyama, M.; Springer, H.; Merzlikin, S.V.; Tsuzaki, K.; Akiyama, E.; Raabe, D. Hydrogen embrittlement associated with strain localization in a precipitation-hardened Fe-Mn-Al-C light weight austenitic steel. Int. J. Hydrogen Energy 2014, 39, 4634–4646. [Google Scholar] [CrossRef]
- Neeraj, T.; Srinivasan, R.; Li, J. Hydrogen embrittlement of ferritic steels: Observations on deformation microstructure, nanoscale dimples and failure by nanovoiding. Acta Mater. 2012, 60, 5160–5171. [Google Scholar] [CrossRef]
- Goswami, R.; Bernstein, N. Effect of interfaces of grain boundary Al2CuLi plates on fracture behavior of Al-3Cu-2Li. Acta Mater. 2015, 87, 399–410. [Google Scholar] [CrossRef]
- Zheng, K.; Dong, J.; Zeng, X.; Ding, W. Precipitation and its effect on the mechanical properties of a cast Mg-Gd-Nd-Zr alloy. Mater. Sci. Eng. A 2008, 489, 44–54. [Google Scholar] [CrossRef]
- Li, H.; Jiang, Z.; Feng, H.; Zhang, S.; Ki, L.; Han, P.; Misra, R.D.K.; Li, J. Microstructure, mechanical and corrosion properties of friction stir welded high nitrogen nickel-free austenitic stainless steel. Mater. Des. 2015, 84, 291–299. [Google Scholar] [CrossRef]
- Samantray, D.; Mandal, S.; Kumar, V.; Alber, S.K.; Bhaduri, A.K.; Jayakumar, T. Optimization of processing parameters based on high temperature flow behavior and microstructural evolution of a nitrogen enhanced 316L(N) stainless steel. Mater. Sci. Eng. A 2012, 552, 236–244. [Google Scholar] [CrossRef]
- Shin, J.; Jeong, J.; Lee, J.; Kim, S.; Jang, J.; Moon, J.; Ha, H.; Lee, T. Nitrogen-induced yield point phenomenon in an austenitic steel. Mater. Sci. Eng. A 2020, 774, 138897. [Google Scholar] [CrossRef]
- Park, M.; Kang, M.; Park, G.; Choi, E.; Kim, H.; Moon, H.; Jeon, J.; Kim, H.; Kwon, S.; Kim, B. The effects of recrystallization on strength and impact toughness of cold-worked high-Mn austenitic steels. Metals 2019, 9, 948. [Google Scholar] [CrossRef]
- Yan, S.; Li, T.; Liang, T.; Chen, J.; Zhao, Y.; Liu, X. By controlling recrystallization degree: A plain medium Mn steel overcoming Lüders deformation and low yield-to-tensile ratio simultaneously. Mater. Sci. Eng. A 2019, 758, 79–85. [Google Scholar] [CrossRef]
Disclaimer/Publisher’s Note: The statements, opinions and data contained in all publications are solely those of the individual author(s) and contributor(s) and not of MDPI and/or the editor(s). MDPI and/or the editor(s) disclaim responsibility for any injury to people or property resulting from any ideas, methods, instructions or products referred to in the content. |
© 2024 by the authors. Licensee MDPI, Basel, Switzerland. This article is an open access article distributed under the terms and conditions of the Creative Commons Attribution (CC BY) license (https://creativecommons.org/licenses/by/4.0/).