Article

Microstructure and Wear Resistance of Grx-Ti-BN Composite Coating on TC4 by Argon Arc Cladding

College of Naval Architecture and Port Engineering, Shandong Jiaotong University, Weihai 264200, China
*
Author to whom correspondence should be addressed.
Metals 2024, 14(4), 403; https://doi.org/10.3390/met14040403
Submission received: 26 January 2024 / Revised: 26 March 2024 / Accepted: 27 March 2024 / Published: 29 March 2024

Abstract

:
The TC4 (Ti-6Al-4V) alloy has problems such as low material hardness, poor wear resistance, and abnormal sensitivity to adhesive wear and fretting wear. In this study, we used graphene-reinforced Ti/BN composite coatings prepared on the surface of the TC4 alloy by argon arc cladding technology. We explored the optimal content of graphene to improve its hardness and wear resistance. The physical phases and microstructures of the coatings were analyzed using an X-ray diffractometer, metallurgical microscope, and scanning electron microscope. Microhardness and wear properties of the cladding coating were measured by a Vickers hardness tester and a universal friction and wear tester. The incorporation of graphene resulted in a transformation of the reinforcing phase in the coating from TiN to Ti(N, C). The C element in the molten pool was substituted with the N element in an unending solid solution, resulting in the formation of Ti(N, C) through intermittent nucleation. As the amount of graphene in the molten pool increases, the concentration of carbon (C) also increases. This leads to the continuous growth of Ti(N, C) particles, resulting in a coarser coating structure and a decrease in coating performance. When the graphene content is 5 wt.%, the microstructure refinement of the coating is the most obvious, the microhardness is 900 HV0.2, which is 3 times higher than that of the matrix, and the wear rate is 4.9 × 10⁻⁵ mm3/(N·m), which is 4.9 times higher than that of the matrix. The wear mechanism of the coating is primarily abrasive wear with some slight adhesive wear.

1. Introduction

The TC4 alloy materials are widely utilized in aircraft, marine equipment, petrochemicals, the automotive industry, and biomedical areas owing to their low density, high specific strength, corrosion resistance, and high-temperature resistance [1,2,3,4]. They are widely used in key moving parts such as ships, deep submersibles, and power transmission systems of marine exploration equipment in the field of marine equipment. However, the use of titanium alloy in these parts poses several challenges such as low material hardness, inadequate wear resistance, adhesion wear, and fretting wear. These issues frequently lead to non-wear corrosion and poor reliability, which act as significant obstacles to the advancement of cutting-edge offshore equipment [5,6,7,8,9]. Surface modification technology has emerged as the primary approach to address this issue [10,11]. Methods such as plasma spraying, physical/chemical vapor deposition, tungsten inert gas, cold spraying, and other surface modification techniques have been extensively employed to enhance the wear resistance of titanium alloy surfaces [12,13,14,15,16]. The TC4/NiCrAlY anti-wear composite coating without cracking defects was manufactured by using an insulation layer with the in situ generation of enhanced phase transition layer technology. The highest hardness of the TC4/NiCrAlY anti-wear composite coating is 653.56 HV0.5, and the wear rate is 2.588 × 10⁻⁴ mm3/(N⋅m) at room temperature [17]. Argon arc cladding is a highly advantageous method due to its low cost, ease of operation, reliability, and controllability, and good metallurgical bonding can be obtained between the base material, making it a popular choice for enhancing the wear resistance of titanium and expanding the range of applications in the titanium industry [18].
Graphene is a single-layer graphite flake, which refers to a dense layer of carbon atoms wrapped in a honeycomb crystal lattice, and sp2 carbon atoms are tightly packed and arranged into a two-dimensional structure, like the single-atom layer of graphite [19]. Graphene’s high chemical inertness, high strength, and low interlayer shear force give it good anti-friction and anti-wear potential [20,21]. In recent years, graphene has often been used in reinforced metal matrix composite coatings, through fine grain strengthening [22], dislocation strengthening [23], load transfer strengthening [24], thermal mismatch strengthening [25], Orowan strengthening [21], and other strengthening mechanisms, so that the coating has excellent electrical and thermal conductivity, high strength and toughness, and good wear resistance and corrosion resistance [26]. For example, the graphene-reinforced titanium-based composite coating was prepared on the surface of the TC4 alloy by argon arc cladding technology, and it was found that graphene and titanium spontaneously generated TiC ceramic particles in granular form and petal-like form in situ, and the microhardness was 845.4 HV0.2 and the weight of the grinding loss was 0.0123 g [27]. To further improve the application field of titanium alloy, the effect of graphene addition on the performance of cladding coating was explored. Grx + Ti + BN composite coating was prepared on a TC4 matrix by argon arc cladding technology, the reinforced phase of TiB ceramic particles was synthesized in situ, and the influence of graphene addition on the microstructure and mechanical properties of the coating was discussed; this study has certain guiding significance for the application of graphene in the engineering field.

2. Experimental Section

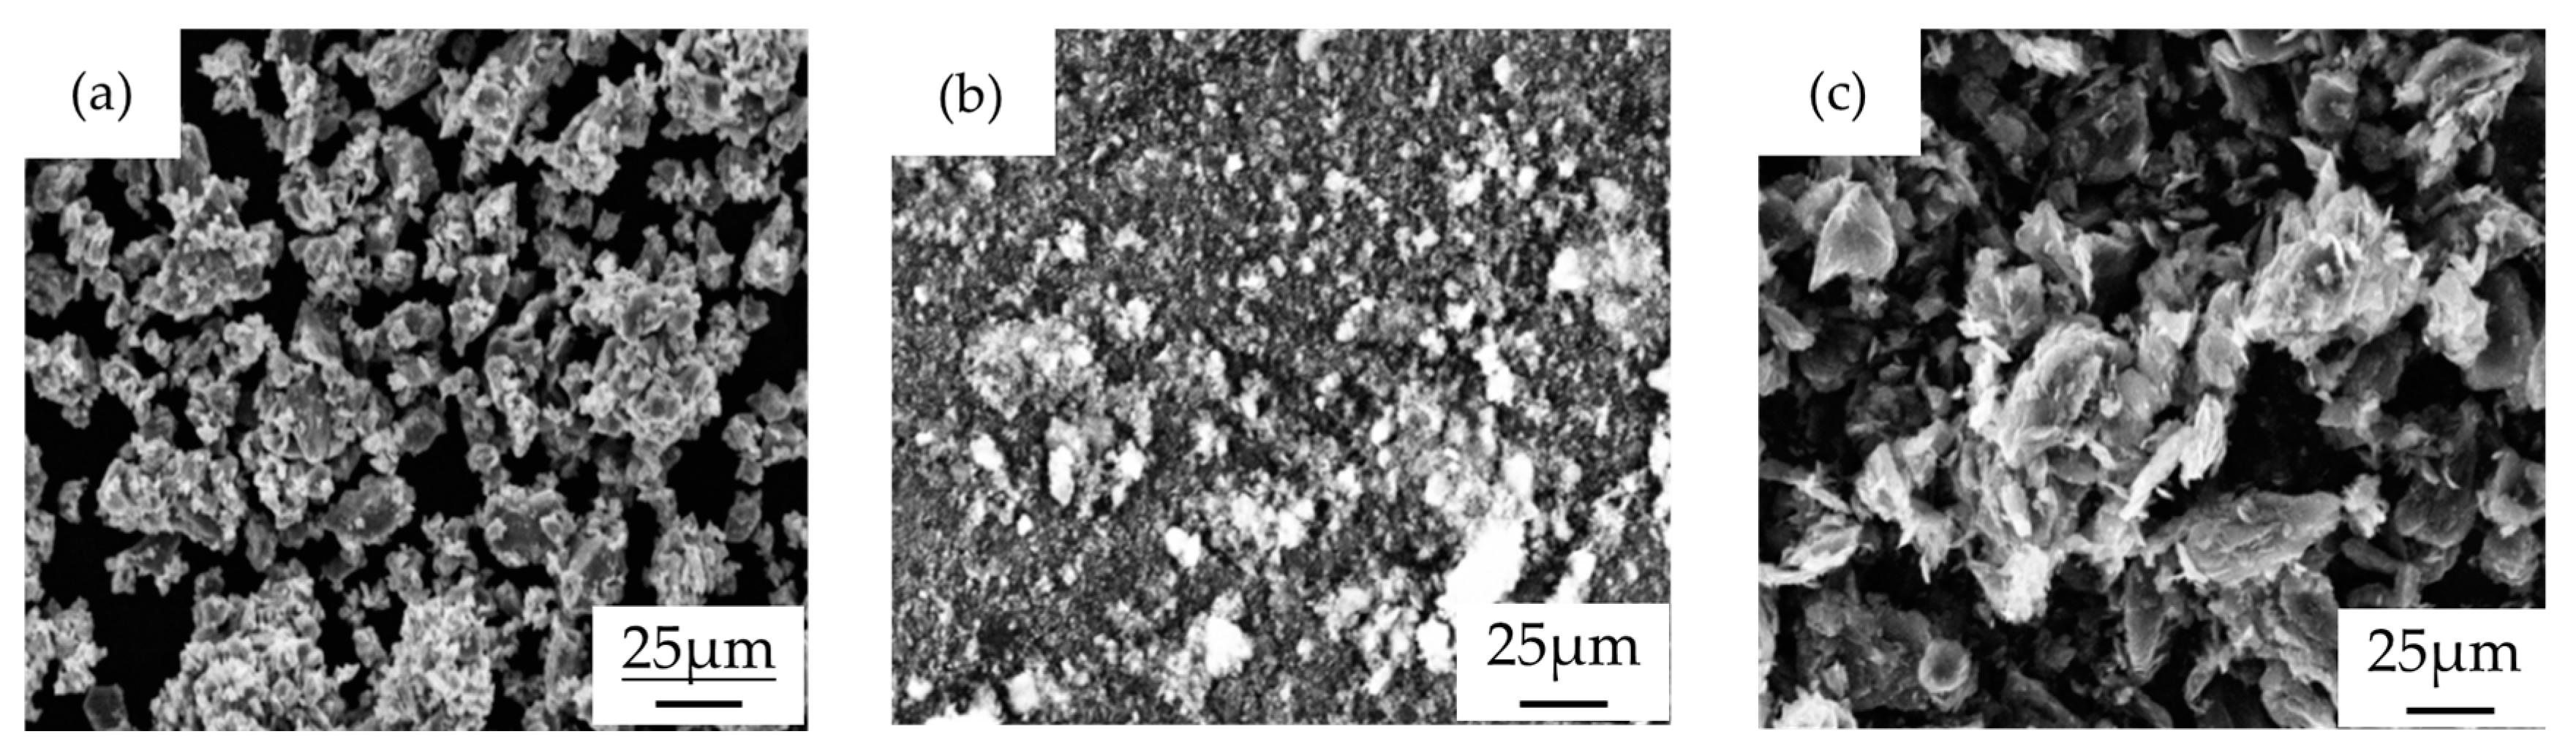
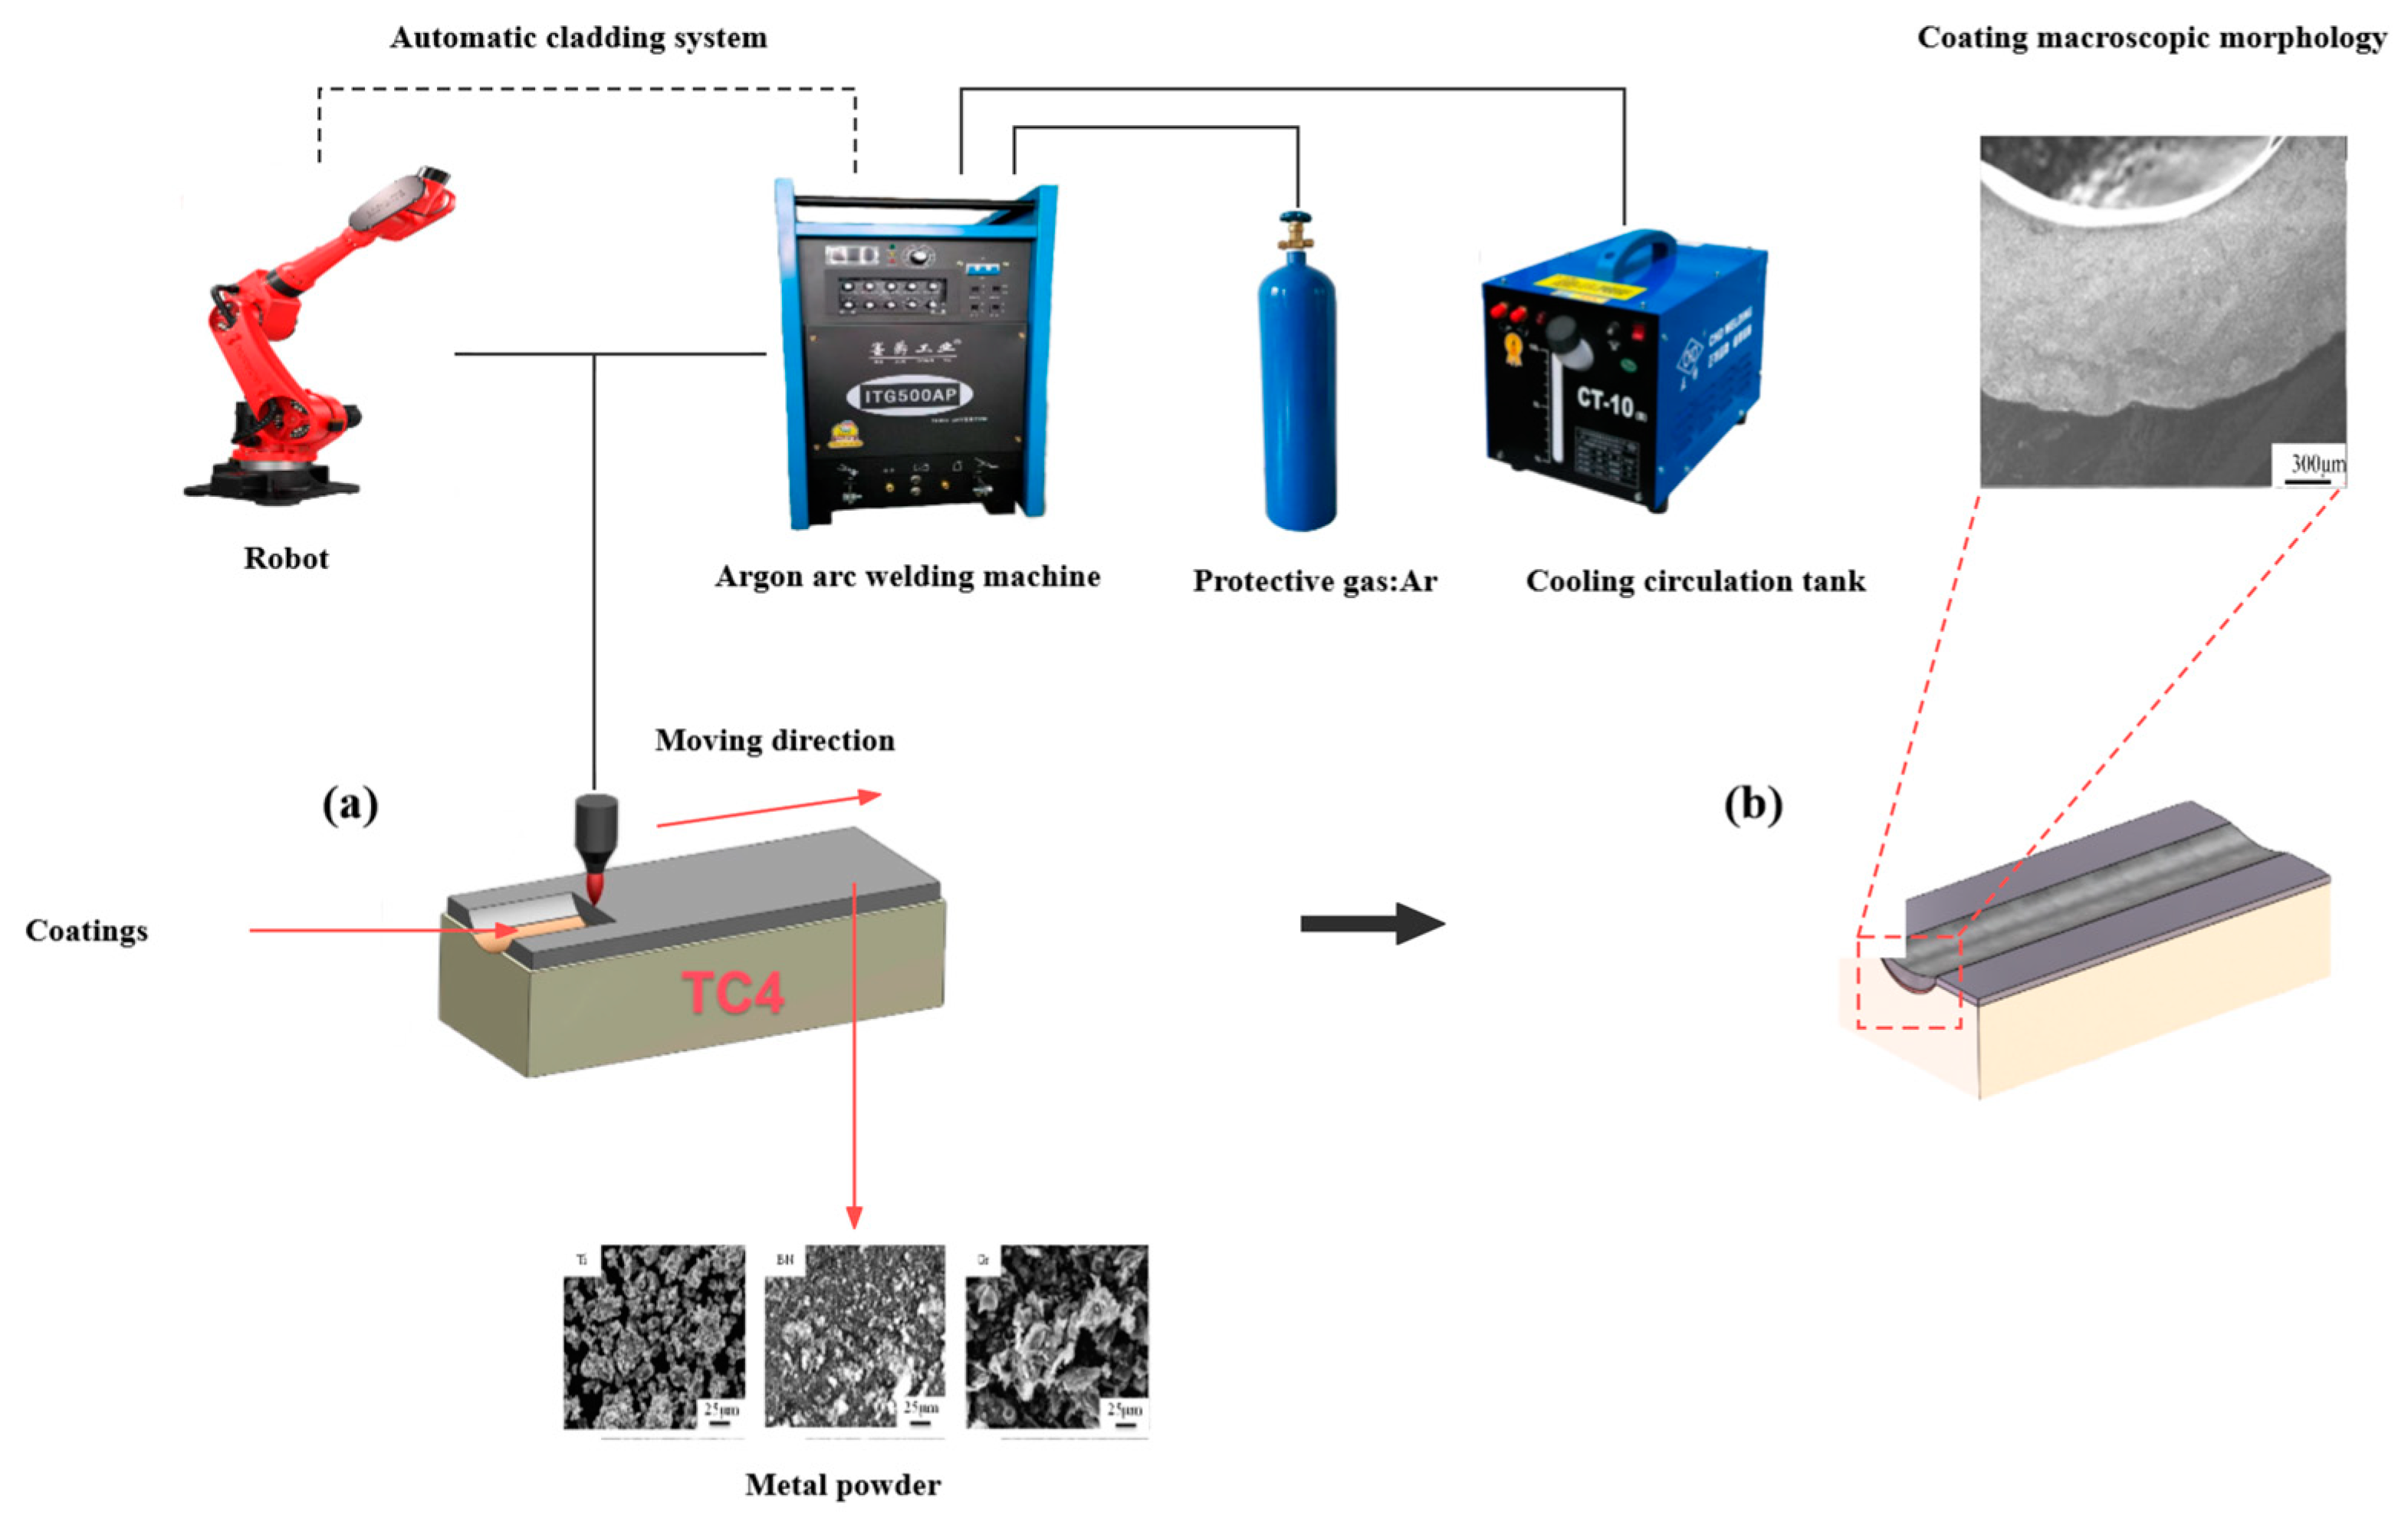
2.1. Material and Preparation

The TC4 titanium alloy (Al 6.15, V 3.70, C 0.10, Fe 0.30, Ti-balance <in wt.%>) [26] was used as the test substrate material with dimensions of 60 mm × 12 mm × 10 mm. The cladding surface was abraded using sandpaper and then purified using 100% ethanol, and the matrix was put into the drying oven and subjected to a drying process at a temperature of 120 °C for 120 min. The starting powders for the nanocomposite synthesis were as follows: Gr (purity > 99.9%, Heilongjiang University of Science and Technology, Harbin, China) and Ti (purity: >99.5%, particle size: 10–20 μm, Beijing General Research Institute of Nonferrous Metals, Beijing, China) and BN (purity > 99.9%, Beijing General Research Institute of Nonferrous Metals, Beijing, China) (see Figure 1). Graphene powder was mixed with (Ti + BN) powder with a molar ratio of 3:2. To keep the total mass of the powder constant, different amounts of graphene were added: 0 wt.%, 1 wt.%, 3 wt.%, 5 wt.%, 7 wt.%. The weighing was done using a BSA124S-CW-type electronic analytical (Stemart Ltd., London, UK) balance with an accuracy of 10−4 g. The necessary cladding powder was measured, with the mass of each powder group shown in Table 1, and the overall mass of each group being 5 g. The alloy powder, after being prepared, was placed in an agate research body and thoroughly ground. It was then transferred to a petri dish and left to dry naturally for 120 min. The powder was mixed with glue as a binder and evenly adjusted. It was then coated onto the surface of the treated TC4 alloy and pressed into a mold for shaping. The resulting thickness was approximately 1 mm, and it was left to stand for 24 h. Ultimately, the compacted powder sample was subjected to a drying process in a muffle furnace at a temperature of 120 °C for 120 min. The argon arc cladding (ITG500AP) equipment (Guangzhou Xinli Welding Equipment Co., Ltd., Guangzhou, China) was used to clad the preset powder that was pressed into shape. An Ar atmosphere was used to avoid the oxidation of the cladding surface with a gas flow rate of 10 L/min. The specific process parameters are shown in Table 2. The six-axis Robot (BRTIRUS1820A) (Borunte Robot Co., Ltd., Dongguan, China) was used to ensure the cladding speed, and the cladding process is shown in Figure 2.

2.2. Microstructure Observation and Performance Testing

The microstructure of the polished coated surface was characterized using the DX-2700BH X-ray diffractometer model. Water sandpaper with a grit size of 400#–1500# was utilized to polish the cross-section of the composite coating. Then a suspension containing 20 wt.% Cr2O3 was used for polishing, to finalize the preparation of metallographic samples. The microstructure was observed after the etching of the polished samples in the mixture of ethanol, HNO3, and HF. The corrosion time was precisely controlled at approximately 120 s. Subsequently, the German EVO MA10 scanning electron microscope (ZEISS, Oberkochen, Germany) was employed to examine the coating microstructure. Microstructural characterization of different phases was performed by trans-mission electron microscopy (TEM) (JEOL Ltd., Tokyo, Japan) using an FEI Tecnai G2 F20 (FEI, Lausanne, Switzerland). The elements present in the coating were further analyzed using the Quantax 200 XFlash 6|10 energy spectrometer (Quantax, San Marcos, CA, USA). The microhardness test of the cross-section of the cladding specimen was carried out by using the microhardness tester (HV-1000A) (Sinowon, Jiangmen, China). The measurement spacing from substrate to coating was approximately 100 µm. The load was 0.2 kgf and the holding time was 10 s. Each group measured 10~14 points, each point interval was 0.1 mm, a total of three groups were measured to take the average value, and finally the microhardness of the coating area, the heat-affected zone, and the matrix area was sorted out. The loading load was 10 kgf, the load was 10 s, each sample was measured seven times, and the average value was taken after removing the maximum and minimum values. By measuring the crack length at the Vickers hardness indentation angle, the fracture toughness of the coating was calculated using Equation (1) [28].
K I C = 0.15 × H V 10 L
where KIC is the fracture toughness (MPa m1/2); HV10 is the Vickers hardness under 10 kgf load (N/mm2); and ∑L is the sum of the crack length around the indentation (mm). The MMS-2A pin-disc friction (ChenDa, Jinan, China)and wear testing machine were utilized to assess the friction and wear characteristics of the specimen. The testing parameters included a rotational speed of 250 revolutions per minute, an applied load of 100 Newtons, a duration of 10 min, the diameter of the wear track was 45 mm, and a friction pair consisted of 45 quenched steels with a hardness of around 55 HRC. Three repeats were done for the wear test on each coating and the error bars were determined. The profiles of wear scars were recorded by an RTEC UP Dual Model 3D profilometer (Rtec, Yankton, SD, USA). The specific wear rate was calculated by (1).
W R = 2 π r S F L
where WR is the specific wear rate (mm3/N·m); V is the volume loss (mm3), which is equal to 2πr·S; r is the radius of rotation (mm); S is the area by integrating the curvilinear function of profiles (mm2); F is the applied load (N); and L is the total sliding distance (m). The KYKY-EM6900 scanning electron microscopy (KYKY Technology Co., Ltd., Beijing, China) was employed to examine the morphology of the specimen post-wear.

3. Results and Discussion

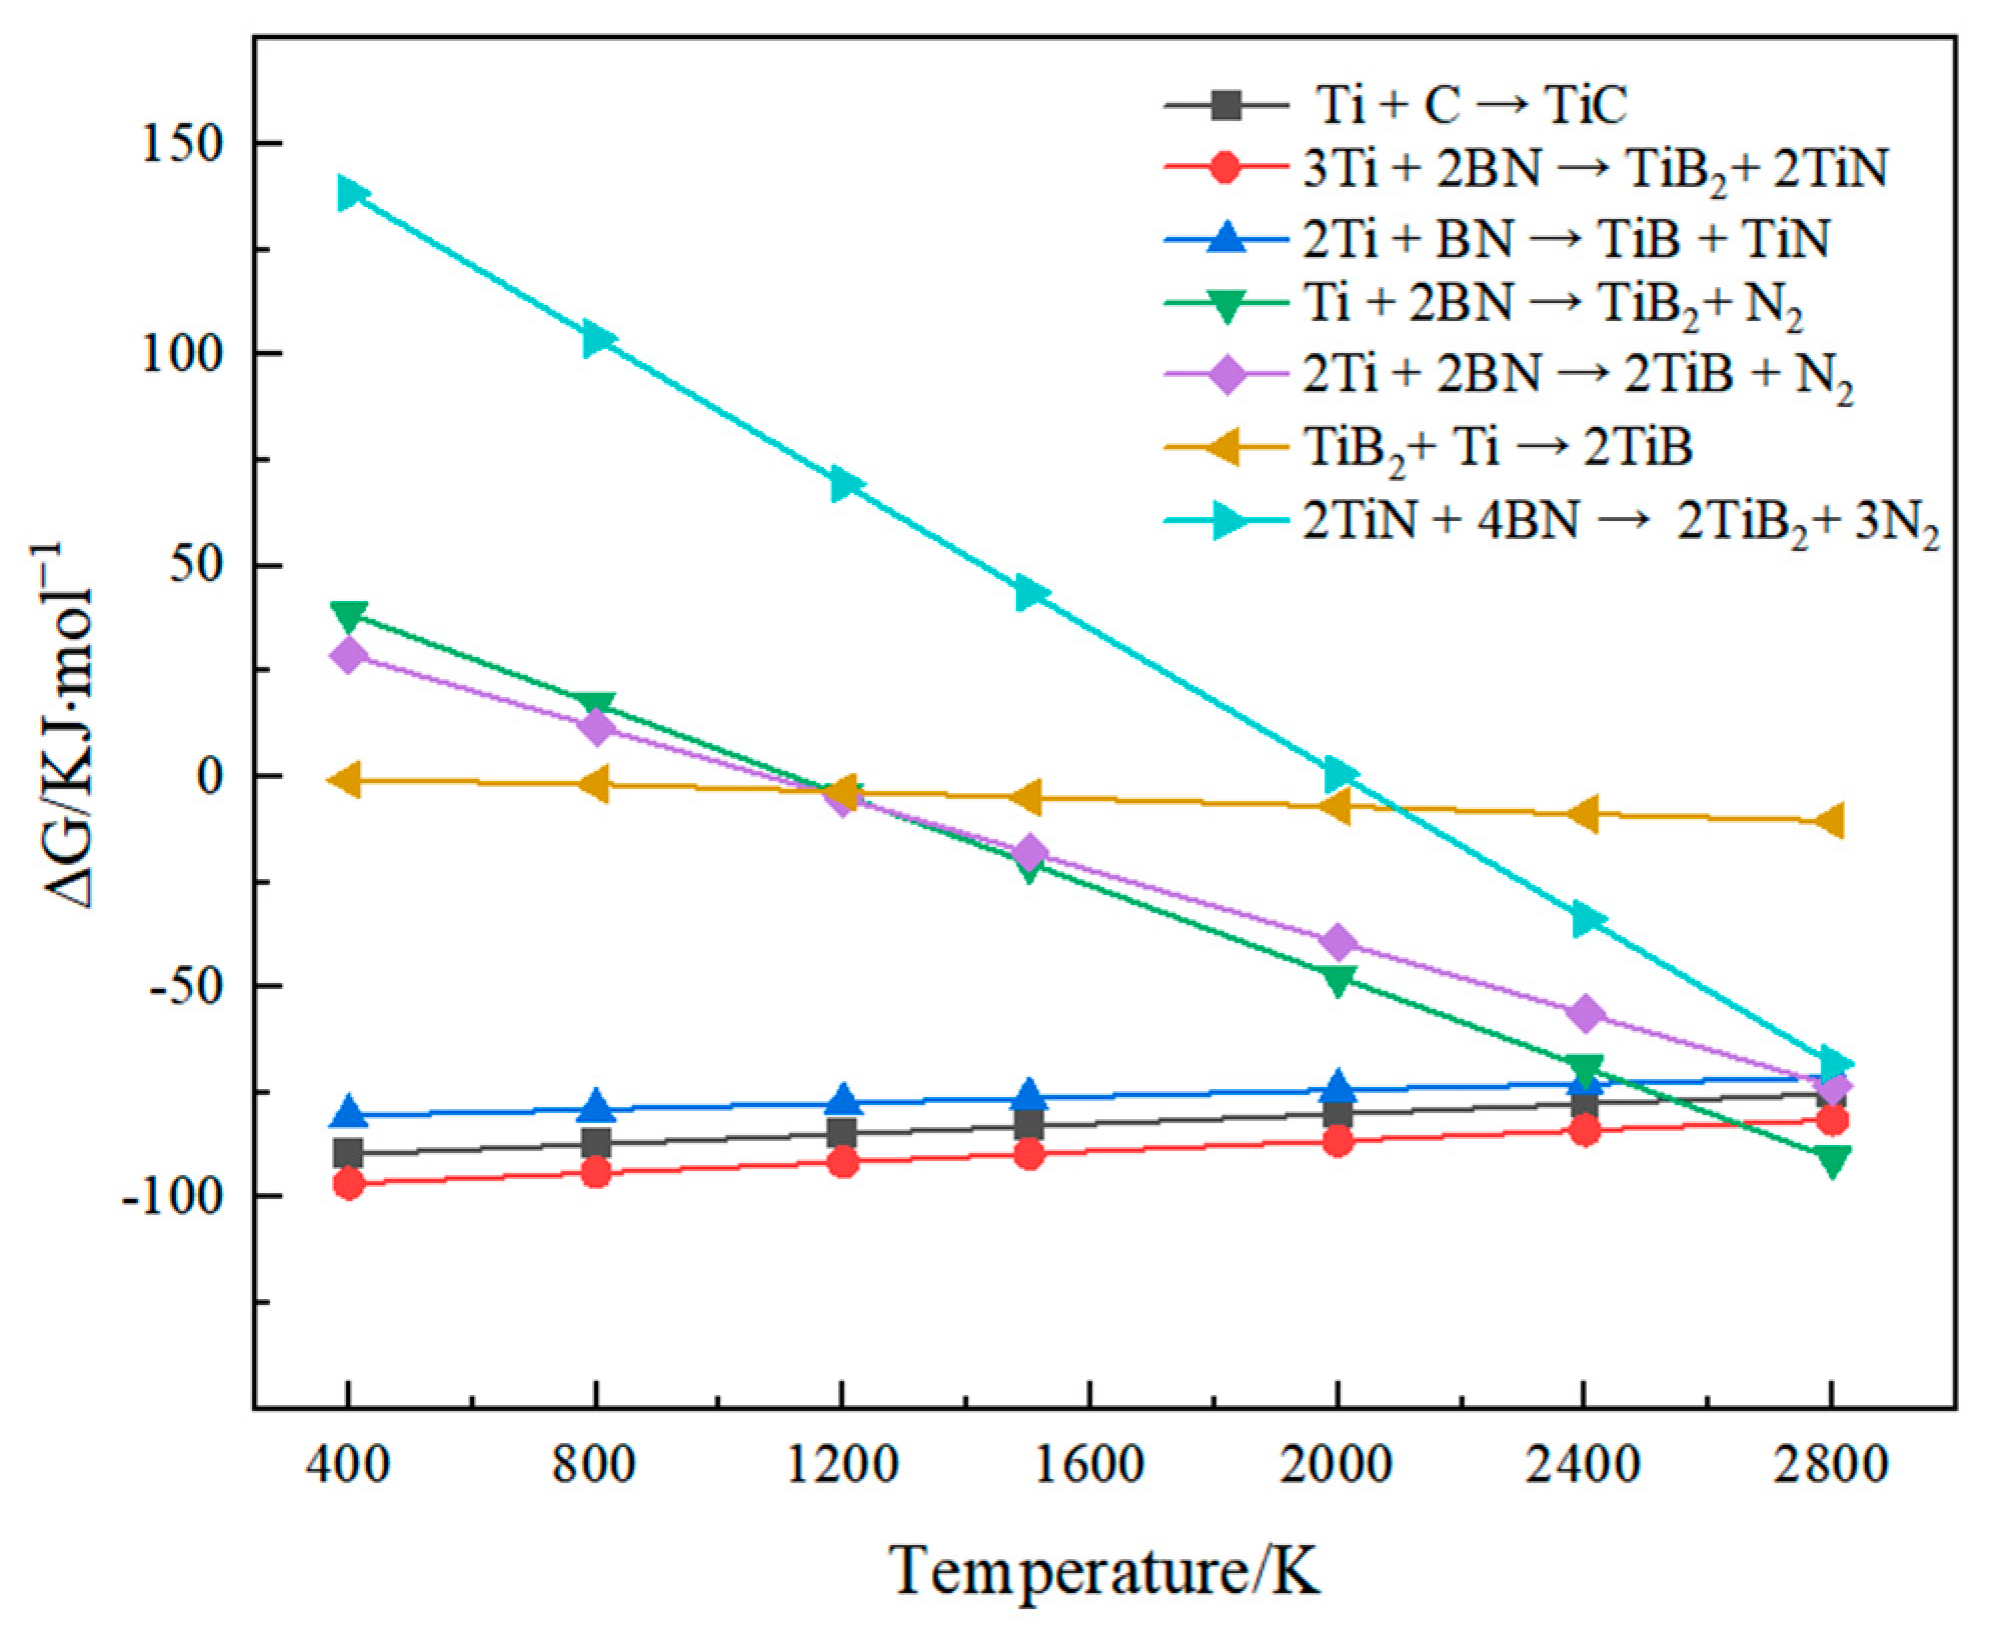
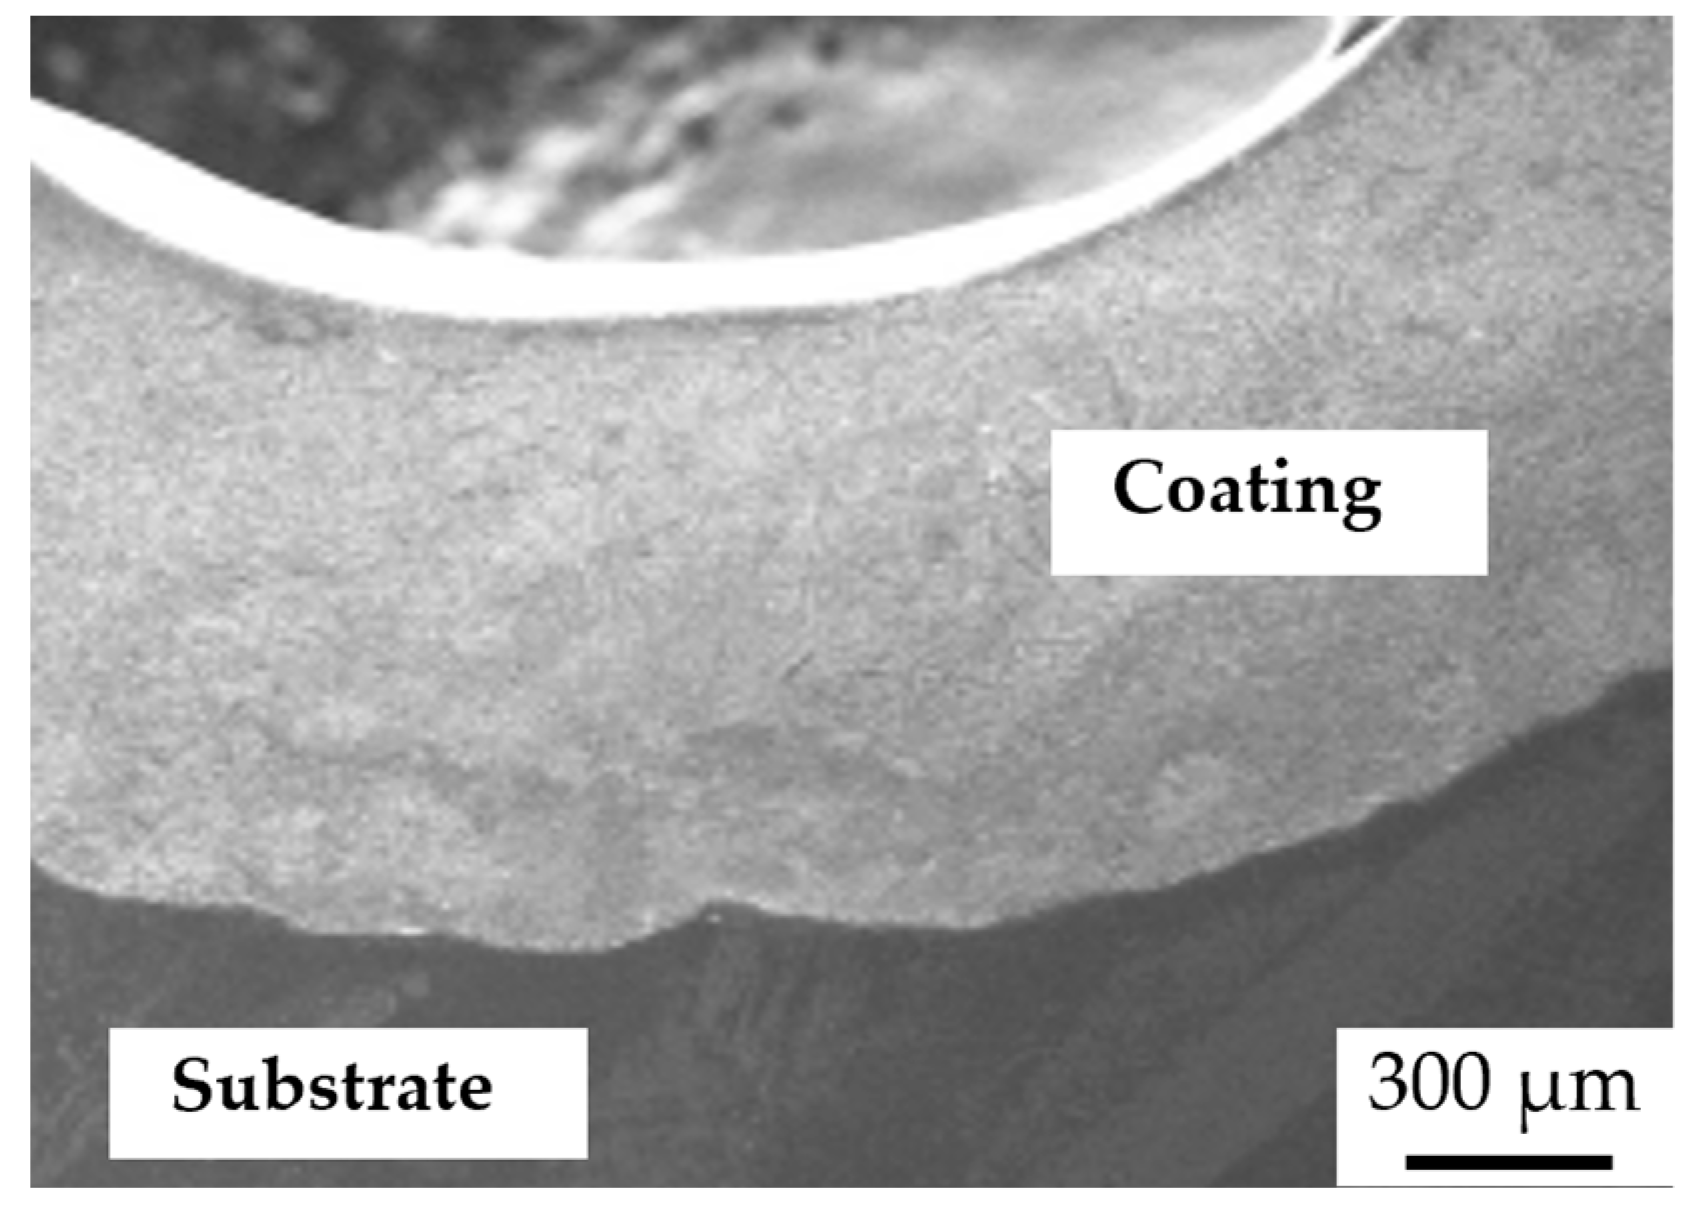
3.1. Coating Thermodynamic Analysis and Phase Composition

By conducting thermodynamic calculations, the Gibbs free energy values for each significant phase in the in situ reactive alloy system were determined. This allowed for a preliminary assessment of the feasibility of the desired phase enhancement in terms of kinetics. The standard Gibbs free energy ΔGT of a chemical reaction can be determined using the enthalpy of formation ΔHT, the entropy value ΔST, and the corresponding temperature T. The calculation formula is given by Equations (3)–(5).
Δ G T θ = Δ H 298 θ T φ T
Δ H 298 θ = ( n i Δ H i , f , 289 θ ) p r o d u c t ( n i Δ H i , f , 298 θ ) r e a c t a n t
Δ φ T = ( n i φ i , T ) p r o d u c t ( n i φ i , T ) r e a c t a n t
Thereinto, Δ G T θ —matter of Gibbs free energy;
Δ H 298 θ —the standard molar relative enthalpy of pure substances at 298 K;
Δ φ T —Gibbs free energy function of matter.
Regarding the alloy system, the primary reactions that could take place are the variations in the standard Gibbs free energy ΔG0 and temperature T, as depicted in Figure 3. The figure illustrates that the temperature ranges from 400 K to 2800 K. The standard Gibbs free energy of TiB2 is positive, exceeding 0 kJ/mol, while the ΔG0 value of other reaction formulas is negative, below 0 kJ/mol [29]. This indicates that the driving force for the reaction between Ti, BN, and graphene to form TiB2 and TiN is stronger compared to the reaction between TiC and TiB. Furthermore, the formation of TiN and TiB2 exhibits higher thermodynamic stability. Thermodynamically, it is possible to produce improved phases of TiN, TiB2, TiC, and TiB in the Ti–BN–Grx system.
Numbered lists can be added as follows: Figure 4 shows the XRD diffraction pattern of Ti + BN + Grx coating for argon arc cladding. The BN powder is completely engaged in the reaction, and these atoms are effectively exposed to each other due to the movement of the molten pool. So, the diffusion rate of the atoms increases, leading to a more intricate chemical reaction. Within the molten pool, the highest concentration of atoms is occupied by Ti, followed by B and N atoms, with C atoms having the lowest concentration. According to thermodynamic data, the temperature range is between 400 K and 2800 K. Among the compounds present, TiB2 and TiN have the lowest Gibbs free energy. This means that Ti atoms in the molten pool prefer capturing N atoms to form TiN, and then capturing C and B atoms to form TiC and TiB2, respectively. It is worth noting that TiC and TiN have crystal structures like that of NaCl, as the atomic radii of C and N are comparable. The material is classified under the cubic crystal system, and its lattice structure follows the face-centered cubic arrangement, which fulfills the Hume-Rothery condition [30]. Thus, during the solidification process in the molten pool, both TiN and TiC compounds are formed. As the reaction progresses, the carbon (C) atoms in TiC gradually substitute the nitrogen (N) atoms in TiN, ultimately resulting in the formation of the enhanced Ti(N, C) phase. Due to the significant production of Ti atoms during the melting of the matrix, the TiB2 formed in the molten pool undergoes continuous reaction with Ti, resulting in the absence of observable peaks for TiC and TiB2 in the XRD pattern. The G0 coating, in the absence of graphene, primarily consists of α-Ti, TiN, and TiB phases. The coating containing graphene is predominantly constituted of α-Ti, Ti(N, C), and TiB phases. This indicates that graphene undergoes an in situ reaction with Ti and BN. The figure demonstrates that the phase composition of the coating remains constant within the range of 1–7 wt.% as the graphene content increases.
Figure 5 shows the cross-sectional SEM morphology of Ti + BN + G5 coating of argon arc cladding. As shown, it illustrates a crescent-shaped cross-section of the coating, with a cladding layer depth of approximately 0.9 mm from the surface to the interface and the absence of a distinct interfacial layer between the coatings and substrate. The reason for this is that argon arc cladding is a process of rapid melting and rapid cooling that occurs outside of equilibrium. The tungsten arc generates extremely high temperatures, causing the alloy powder and a portion of the matrix to quickly melt and form a molten pool. In the preset powder coating, titanium powder has the highest proportion, resulting in better contact wettability between the alloy powder and the matrix. However, the surface tension of the resulting liquid molten pool is poor, leading to convection in the center area of the molten pool in the direction of radius R. As a result, the middle part of the coating becomes thicker, creating a “concave” appearance [31,32].

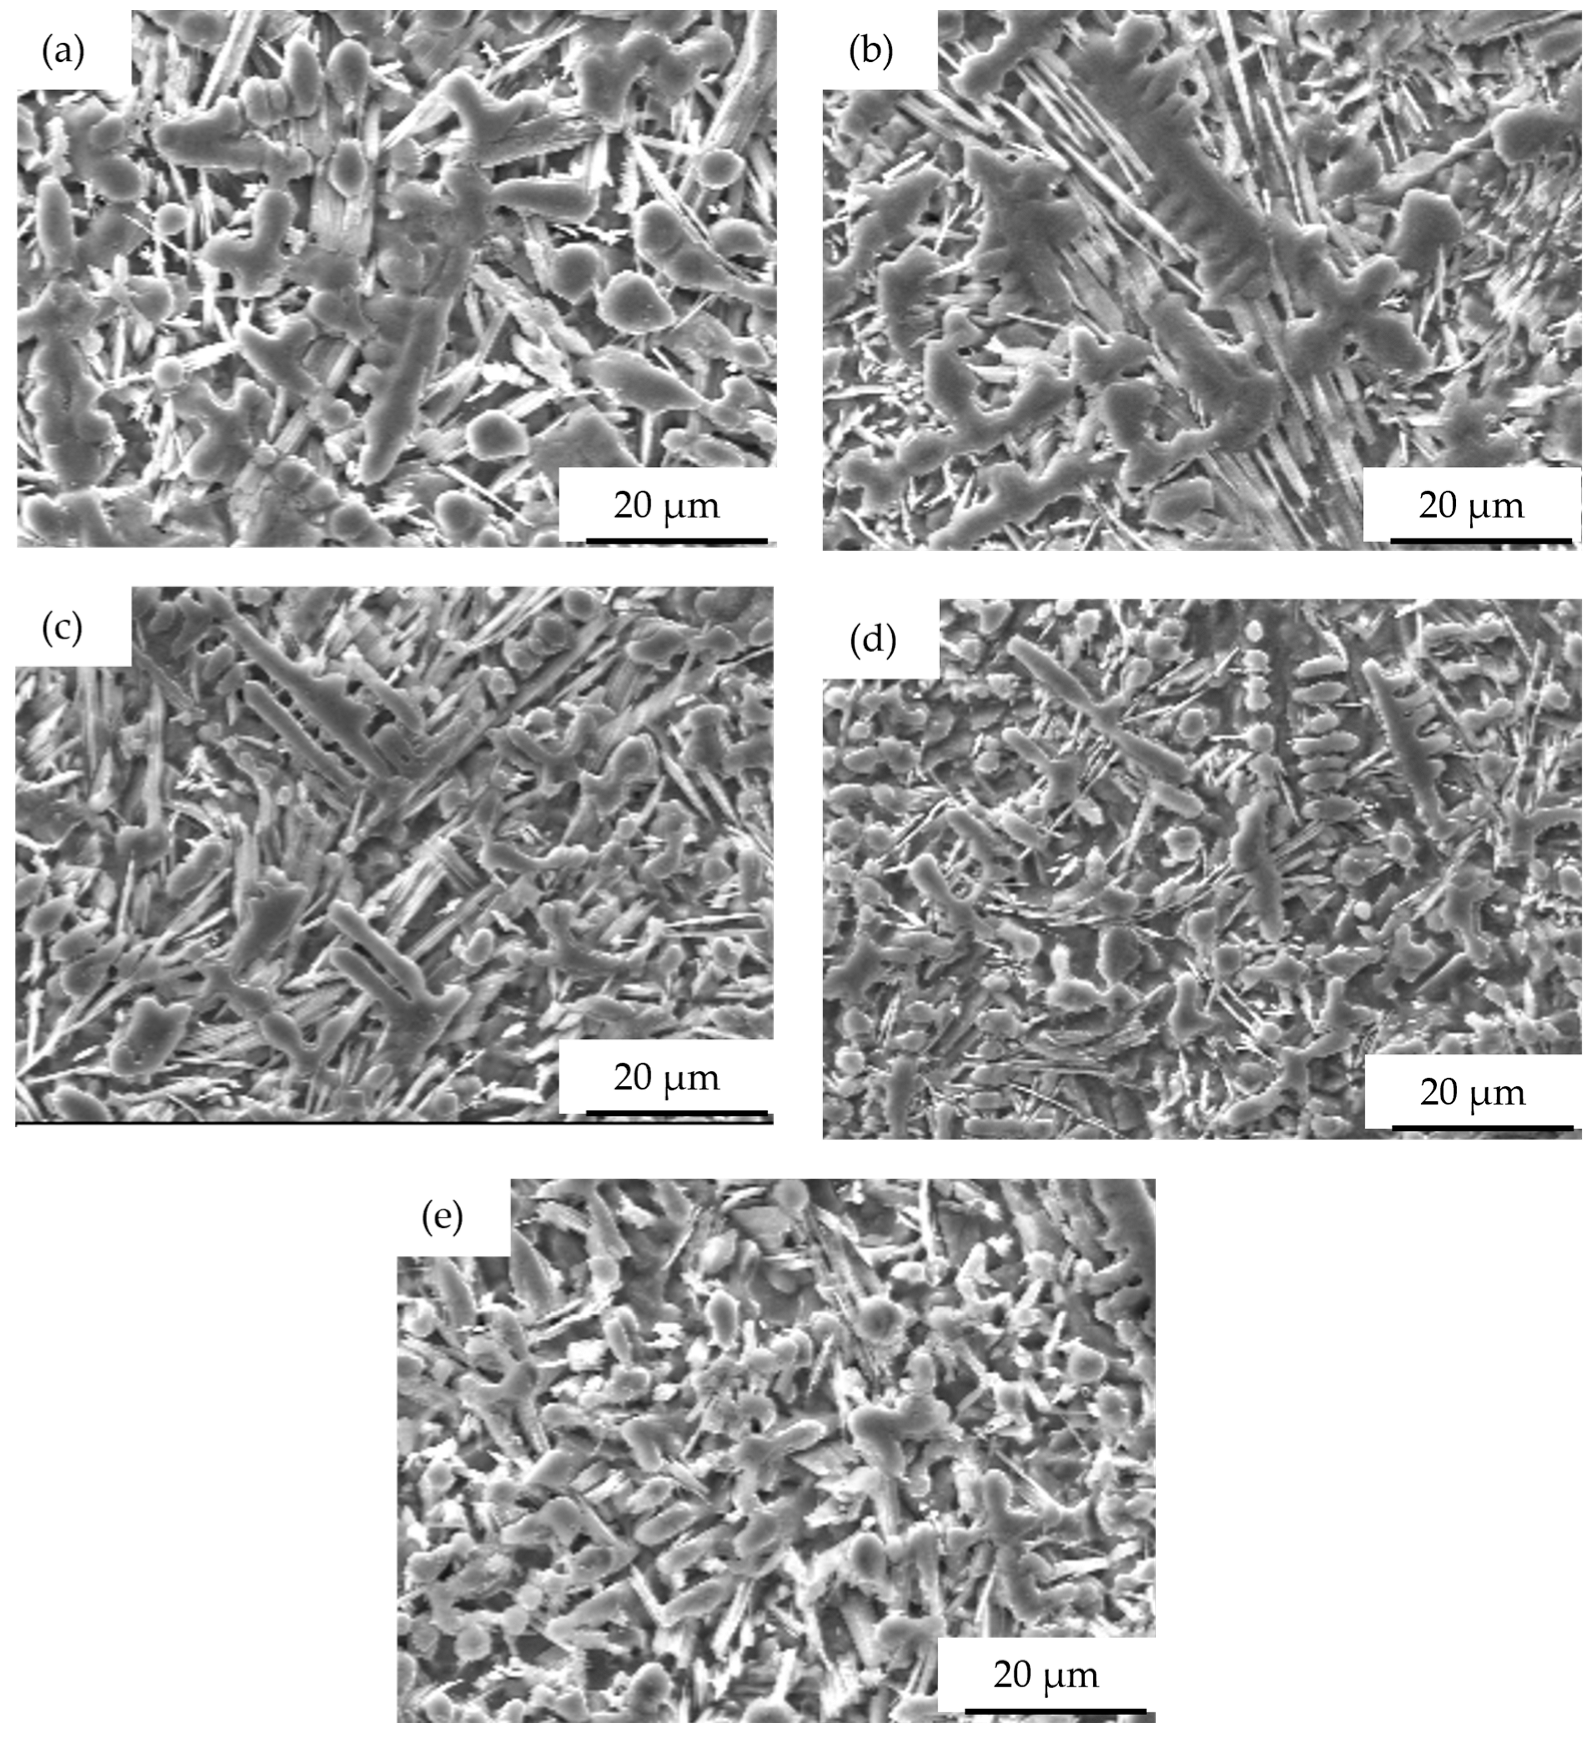
3.2. Microstructure of the Coatings

Figure 6 shows the SEM microstructure of the center of the Ti + BN + Grx coating. The coating’s morphology undergoes considerable changes as the graphene content increases. The uppermost layer of the G0 coating consists of dendritic, granular, and needle-like reinforced phases with a dispersed distribution. The size of the enhanced phase has the following order: dendritic > granular > needle-rod-like when the graphene content is 1 wt.%. The coating’s enhanced phase consists of dendritic, granular, and needle-like rods. The granular and needle-like reinforced phase is more prominent, while the dendrite-reinforced phase is also somewhat refined when the graphene content is 3 wt.%. The middle structure of the coating is significantly reduced, and the growth of the dendrite-enhanced phase follows a more regular pattern along the penetration direction. With a graphene content of 5 wt.%, the needle-rod-like, granular, and dendrite-enhanced phases exhibit the smallest size and the densest structure. The growth of the dendrite-reinforced phases is the most regular, and they are distributed along the penetration depth. At a graphene content of 7 wt.%, the distribution of tissue within the coating was uneven, with a somewhat coarse enhancement phase in the form of dendrites. So, it is evident that the introduction of graphene does not alter the morphology of the enhanced phase within the coating. However, as the mass fraction of graphene increases, the coating structure undergoes gradual refinement. Specifically, when the graphene content reaches 7 wt.%, the coating structure undergoes significant changes. The distribution of the enhanced phase becomes uneven and its size increases.
Figure 7 shows the graphene content of 5 wt.% of the coating middle of the SEM diagram and elemental energy spectrum analysis. The distribution of C, Ti, B, and N elements is shown in Figure 7c–f. The most prominent distribution is observed for Ti and N elements, which are both distributed in a granular, dendrite-enhanced phase. The distribution of the B element is consistent with a needle-like reinforced phase. The distribution of the C element is like that of the N element. By analyzing the XRD pattern, it is evident that the granular and dendrite-enhanced phase in the coating, after adding graphene, is Ti(N, C), while the needle-like reinforced phase is TiB.
So, it is evident that the growth of Ti(N, C) crystals is influenced by several factors under the thermal circumstances of argon arc cladding. The real reaction results in the formation of diverse forms of the augmented phase of the Ti(N, C) complex, including granular and dendritic structures. During the initial phase of solidification, the growth of Ti(N, C) crystals relies on diffusion, leading to a sluggish growth rate and limited branching and selective growth. Ultimately, this process results in the formation of the enhanced phase of granular Ti(N, C). During the solidification process, the graphene content steadily rises, leading to the continuous synthesis of Ti (N, C) and the gradual formation of crystal nuclei. The release of the latent heat of crystallization occurs during this process. Additionally, the molten pool experiences electromagnetic contraction force, plasma flow force, spot pressure, and other forces [33]. As a result, the heat conduction process in the molten pool becomes directional, specifically along the depth direction. As a result, crystal nuclei of Ti(N, C) are sporadically formed in the direction of penetration depth within the molten pool. The concentration of Ti, N, and C atoms surrounding the crystal nucleus gradually diminishes, and the growth proceeds slowly along the arrangement of the crystal nuclei. Eventually, a dendrite-enhanced phase is established. As the concentration of Ti(N, C) increases, it gradually fills the space in the coating, resulting in a significant amount of Ti atoms remaining in the coating. In the molten pool, Ti interacts with TiB2 to produce TiB, which then precipitates around the reinforced phase of Ti(N, C).
In order to further analyze the growth of in situ synthesized particle phases, the bright field TEM images and corresponding selected diffraction patterns of Ti (C, N) and TiB phases in the coating were analyzed, as shown in Figure 8. The TiB phase synthesized in situ grows along the (100), (101), and (101) crystal planes in the [010] direction to form a rod-like structure, as shown in Figure 8; from Figure 8, it can be observed that the TiC (C, N) phase synthesized in situ grows along the (121) direction along (111), (202), and (113). The cluster of TiB whiskers was not found in the coating. The reason is the low concentration of B atoms in the matrix, which makes it difficult to generate clustered TiB whiskers during the in situ reaction process [34].

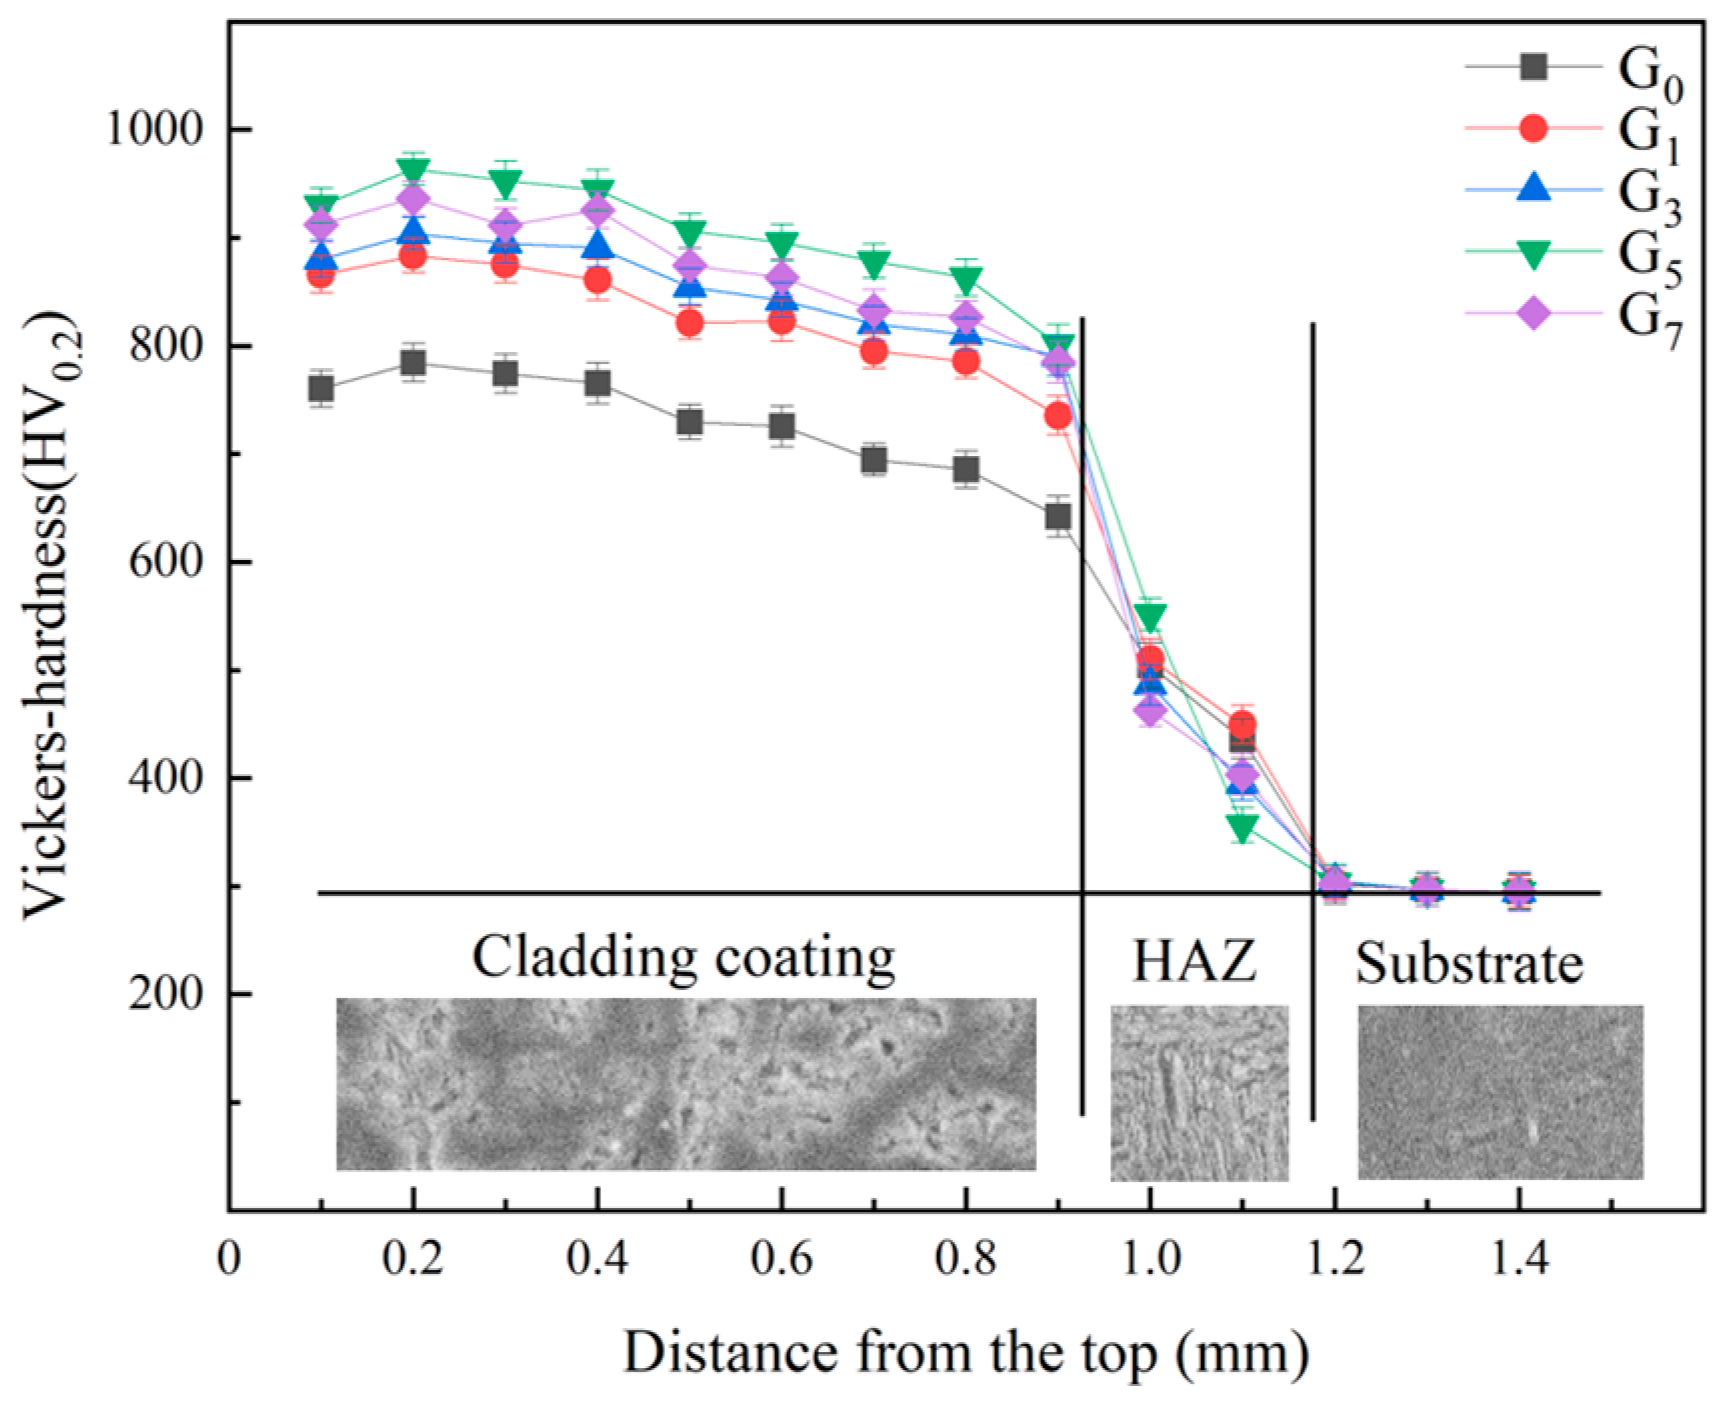
3.3. Microhardness of the Cladding Layer
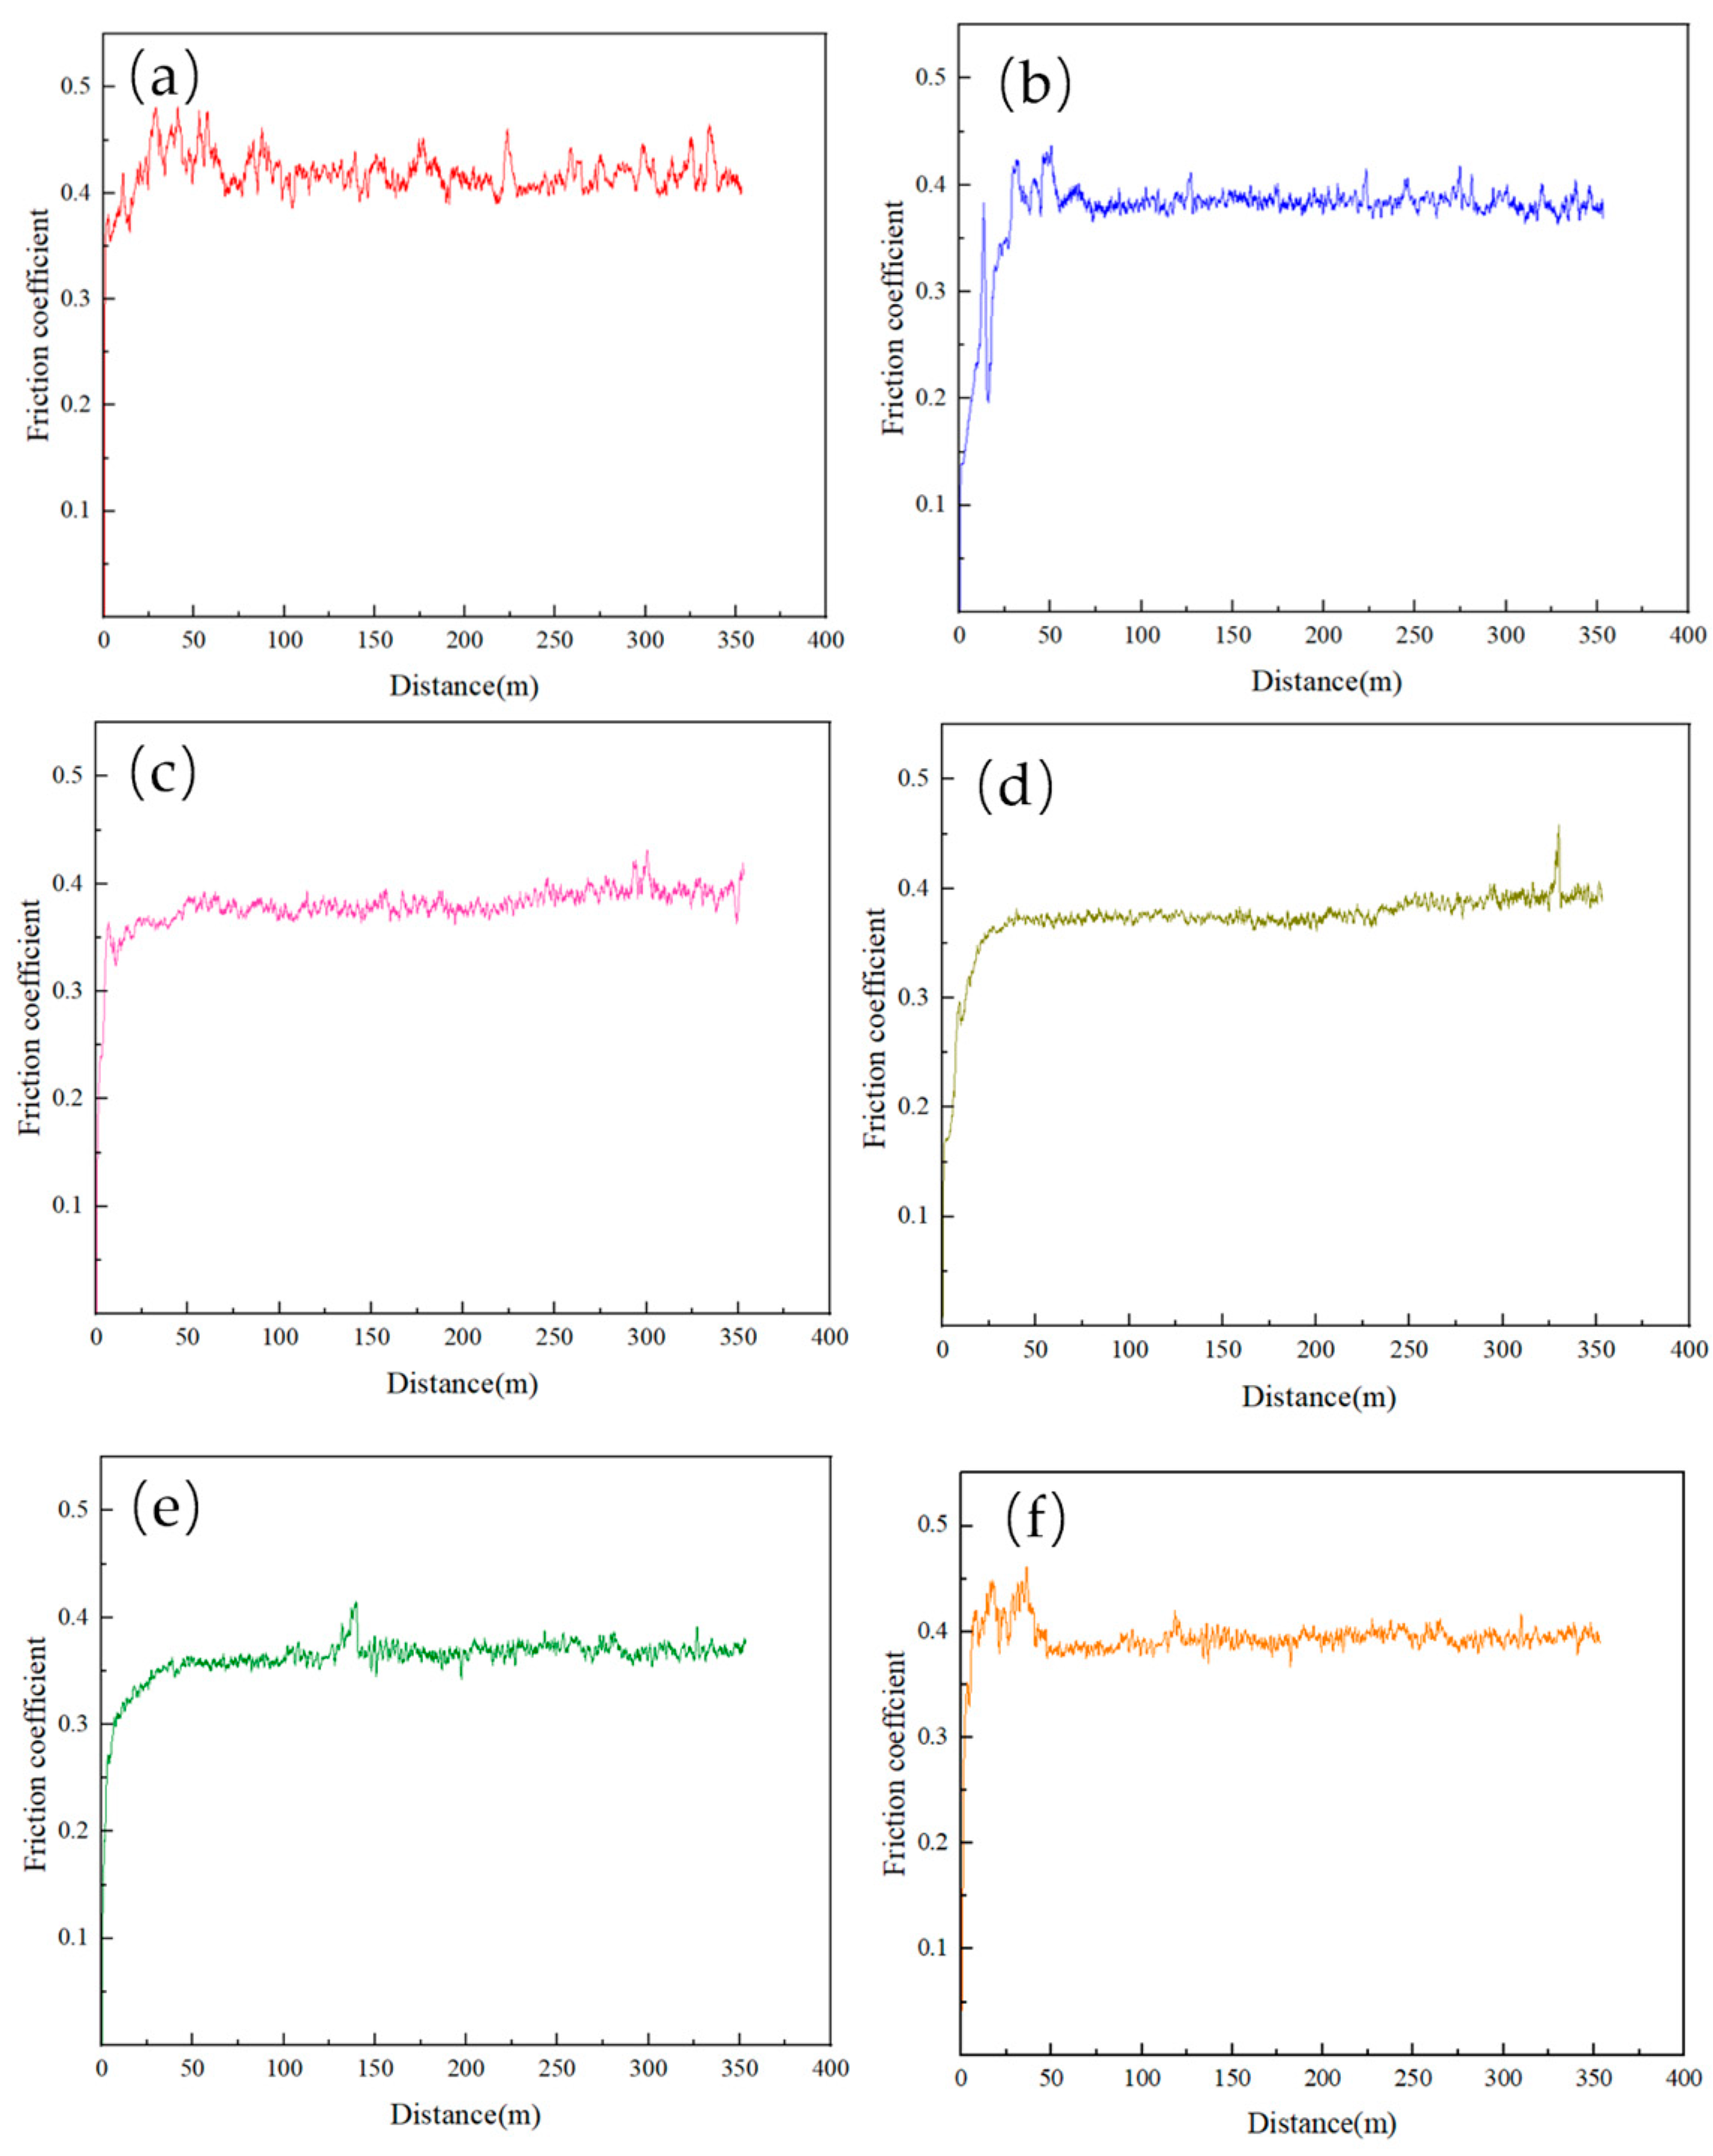
Figure 9 shows the cross-sectional microhardness distribution of Ti + BN + Grx coating (the microstructure image was taken from the microstructure of Ti + BN + G5). This shows a constant trend in the microhardness distribution, with an initial increase followed by a subsequent reduction. The microhardness curve can be segmented into three distinct regions: the coating area, the heat-affected zone, and the matrix. Within the range of 0.9 mm from the coating zone to the heat-affected zone, the microhardness remains consistently high. However, in the heat-affected zone, the microhardness decreases rapidly, although it still surpasses that of the matrix. Upon analysis, it is evident that the microhardness value is influenced by the distribution and size of the Ti (N, C) and TiB phases that reinforce the coating. These additional phases in the coating impede the movement of dislocations, thereby greatly enhancing the stability of dislocations and improving the strength and hardness of the coating. The reinforcing phase located in the uppermost part of the coating exhibits a finer and denser structure, resulting in a greater microhardness value in this region. As the distance from the surface layer increases, the size of the reinforced phase along the penetration direction gradually grows, while the hardness of the corresponding coating area gradually decreases. At the point where it intersects with the matrix, the reinforcing phase experiences increased size and disordered distribution due to the buoyancy during the cladding process and the dilution effect when the matrix melts. As a result, the coating’s hardness sharply decreases. Upon reaching the heat-affected zone, the microhardness value remains elevated compared to the matrix. This is attributed to the exceptionally high temperature produced during the cladding process, which induces a partial phase alteration in the matrix.
The microhardness of coatings with different graphene content, ranging from G0 to G5, exhibits a gradual increase. This can be attributed to the addition of graphene, which forms a finer and denser structure. Among these coatings, G5 has the highest overall microhardness level, with an average microhardness of 900 HV0.2. On the other hand, the microhardness of G7 initially increases and then decreases, but with significant fluctuations in hardness values. This can be explained by the coarse and uneven distribution of the dendrite Ti (N, C) reinforced phase observed in the microstructure analysis of the G7 coating. This uneven distribution negatively impacts the performance of the coating. Figure 10 shows the optical image of the Vickers indentation of the G5 coating, and the fracture toughness of the G5 coating is 13.17 MPa m1/2 from Equation (1), so the G5 coating has high hardness and toughness at the same time.

3.4. Wear Behavior

Figure 11 shows the friction coefficient curve of the matrix and the Ti + BN + Grx coating. The friction coefficient of the coating containing 1–5 wt.% graphene is lower than that of the matrix. Data analysis reveals that the average friction coefficient of the matrix is approximately 0.42, while the friction coefficient of the graphene composite coating with 1–5 wt.% ranges from 0.36 to 0.39. Figure 11f reveals that at a graphene content of 7 wt.%, the friction coefficient exhibits an increasing pattern, which can be attributed to the aggregation and coarsening of dendritic Ti(N, C) tissues in the coating. It typically correlates with the change in wear resistance. In the case of the Ti + BN + Grx coating, when the graphene content is 5 wt.%, the friction coefficient is low, indicating strong wear resistance.
Figure 12 shows the wear rate and relative wear resistance of the matrix and Ti + BN + Grx coating under the same wear parameters shown. The relative wear resistance is the wear rate of the substrate divided by the wear rate of the specimen. The figure demonstrates that the addition of graphene reduces the wear rate of the coating compared to the matrix. With the increase in graphene, the wear resistance is better. The wear resistance of the coating is at its best when the graphene content is 5 wt.%. However, as the graphene concentration increases to 7 wt.%, the wear rate increases, and the relative wear resistance declines.
Figure 13 shows the surface morphology of a Ti + BN + Grx coating with varying amounts of graphene content in the matrix. Figure 13a displays the surface wear morphology of the substrate, revealing the presence of numerous grinding chips and sticks as well as deep furrows. According to the analysis, the low hardness of the matrix causes it to undergo significant plastic deformation when it rubs against the 45 steel friction pair, which has a higher hardness. This results in the surface of the matrix being subjected to extrusion and cutting by the micro convex bodies of the friction pair, leading to the formation of deep furrows and a large quantity of abrasive chips on the surface. When there is continuous movement between the matrix and the friction pair, the micro convex body on the friction pair and the matrix surface undergoes cold welding, resulting in the constant formation and breaking of solder joints. This process leads to the creation of numerous adhesive marks on the surface of the substrate. The research indicates that the primary wear mechanisms affecting the matrix are abrasive wear and adhesive wear. The wear morphology of the Ti + BN + G0 coating surface is depicted in Figure 13b. A comparison with the matrix wear morphology reveals a noticeable reduction in adhesion phenomena and abrasive chips. However, there is still the presence of furrows, which are indicative of typical abrasive wear and slight adhesion wear. The analysis indicates that the presence of hard particles TiN and TiB, which are formed in the coating itself, makes it challenging for the micro convex body on the friction pair to compress the coating. As a result, the damage to the coating surface during the grinding process is significantly reduced. This leads to a shallow plow groove, relatively small grinding chips, and only minimal adhesion. In Figure 13c, the addition of graphene to the Ti + BN + G1 coating results in a reduction in adhesion and abrasive chips on the coating surface, as well as a shallower furrow. This is attributed to the formation of the Ti (N, C) particle phase with higher hardness in the coating, making it more difficult for the micro convex body on the friction pair to damage the coating surface. At a graphene content of 5 wt.%, as depicted in Figure 13d, the wear surface appears smooth with minimal abrasive chips and slight furrows. However, at a graphene content of 7 wt.%, the dendritic Ti (N, C) structure in the coating is aggregated and coarse, and the distribution of hard particles is uneven, resulting in an increase in wear debris in the composite coating and the formation of relatively deep plow grooves. Therefore, the wear mechanism of the coating begins to shift towards abrasive wear.

4. Conclusions

By employing the argon arc cladding technique and utilizing Ti powder, BN powder, and graphene powder as primary constituents, a Ti + BN cladding layer reinforced with graphene was fabricated. The cladding layer was successfully metallurgically bonded to the base material, exhibiting a smooth surface and absence of internal defects.
The unreinforced phase without graphene coating consists of granular, dendritic TiN, and needle-like TiB. The coating reinforcement phase consists of granular, dendritic Ti(N, C), and needle-like TiB when the amount of graphene increases. The microstructure becomes smoother and denser as the graphene content increases, with the optimal effect observed at a content of 5 wt.%. Excessive graphene content results in the heightened aggregation and coarsening of the Ti(N, C) phase.
The mechanical characteristics of the coating achieved using argon arc cladding exhibit an initial increase followed by a subsequent decrease as the mass fraction of graphene increases. The addition of 5 wt.% graphene to the Ti + BN + Grx coating significantly enhances its microhardness and wear resistance. The coating has a superior average microhardness of 900 HV0.2, a minimal friction coefficient of around 0.36, and negligible fluctuation. It demonstrates excellent wear resistance even when subjected to high loads and prolonged friction wear. When the graphene content is 7 wt.%, the friction coefficient increases, the wear amount increases, and the wear mechanism is abrasive wear.

Author Contributions

Conceptualization, Q.L. and J.M.; methodology, Q.L. and J.M.; validation, H.D. and Y.H.; formal analysis, Q.L. and H.D.; investigation, X.S., C.H., Y.H. and S.L.; data curation, S.L., C.H. and H.D.; writing—original draft preparation, Q.L.; writing—review and editing, J.M. and X.S.; supervision, J.M.; project administration, J.M. All authors have read and agreed to the published version of the manuscript.

Funding

This research was supported by the Natural Science Foundation of Shandong Province (Nos. ZR2020KF024), the Student Innovation and Entrepreneurship Training Program of Shandong Province (Nos. S202311510154, S202311510210, S202311510274).

Data Availability Statement

The original contributions presented in the study are included in the article, further inquiries can be directed to the corresponding author.

Conflicts of Interest

The authors declare no conflicts of interest.

References

  1. Wang, Y.; Li, J.; Dang, C.; Wang, Y.; Zhu, Y. Influence of carbon contents on the structure and tribocorrosion properties of TiSiCN coatings on Ti6Al4V. Tribol. Int. 2017, 109, 285296. [Google Scholar] [CrossRef]
  2. Li, M.C.; Zhang, P.L.; Yu, Z.S.; Hua, Y.; Xin, Y.; Shaowei, L. Microstructure and Micromechanical Properties of Ni-Ti-Si Coating Deposited by Laser Cladding. Rare Met. Mater. Eng. 2019, 48, 1225. [Google Scholar]
  3. Mao, X.; Dong, L.; Zhang, Y.; Qin, S.; Sun, G.; Wang, L. Superior strength-ductility combination in TiC/TC4 composites via in situ construction Ti2Cu nanoparticles. Carbon 2024, 219, 118805. [Google Scholar] [CrossRef]
  4. Wang, J.H.; Peng, F.D.; Xu, Q.; Zhao, X.; Hu, Z.; Zhang, J.; Liu, Y. Enhanced dry machinability of TC4 titanium alloy by longitudinal-bending hybrid ultrasonic vibration-assisted milling. J. Clean. Prod. 2022, 379, 134866. [Google Scholar]
  5. Zhao, X.; Liu, H.; Li, S.; Wang, X.; Sheng, Y.; Zhang, P.; Li, W. Corrigendum to “Combined effect of TiN coating and surface texture on corrosion-wear behavior of selective laser melted CP-titanium in simulated body fluid”. J. Alloys Compd. 2020, 842, 155750. [Google Scholar] [CrossRef]
  6. Sun, J.; Qi, Y.J.; Liu, H.; Zeng, R.C. Research Progress on Tribo-Corrosion of Titanium and Titani-um Alloys in Seawater Environment. Mater. Prot. 2020, 53, 151–156. [Google Scholar]
  7. Zhang, L.T.; Liu, D.X.; Zhang, W.Q.; Wang, X.S.; Dai, X.Y.; Xu, J.F. Research Progress of Laser Cladding Coating on Titanium Alloy Surface. Surf. Technol. 2020, 49, 97–104. [Google Scholar]
  8. Zhang, Z.Q.; Yang, F.; Zhang, H.W. Microstructure and wear resistance of TiCx reinforced Ti-based laser cladding coating with race earth. Aeronaut. Astronaut. Sin. 2021, 42, 43–56. [Google Scholar]
  9. He, Y.N.; Yu, S.R.; Li, S.X.; Chen, Q. Evolution of Tribological Characteristics of TC4 Alloy in Fretting Wear Partial Slip Regime. Mater. Rep. 2021, 35, 14096–14100. [Google Scholar]
  10. Liu, J.D.; Zhang, S.Q.; Wang, H.M. Microstructure and wear resistance of laser cladding WC particles reinforced composite coatings. Chin. J. Nonferrous Met. 2012, 22, 2600–2607. [Google Scholar]
  11. Zhao, X.; Lv, P.; Fang, S.; Tu, X.; Ren, P.; Liu, D.; Chen, L.; Xiao, L.; Liu, S. Microstructure and Wear Behavior of Ti-xFe-SiC In Situ Composite Ceramic Coatings on TC4 Substrate from Laser Cladding. Materials 2023, 17, 100. [Google Scholar] [CrossRef] [PubMed]
  12. Gao, Y.; Shen, K.; Wang, X. Microstructural evolution of low-pressure plasma-sprayed Ti–6Al–4V coatings after heat treatment. Surf. Coat. Technol. 2020, 393, 125792. [Google Scholar] [CrossRef]
  13. Koseki, S.; Inoue, K.; Sekiya, K.; Morito, S.; Ohba, T.; Usuki, H. Wear mechanisms of PVD-coated cutting tools during continuous turning of Ti-6Al-4V alloy. Precis. Eng. 2017, 47, 434. [Google Scholar] [CrossRef]
  14. Liu, L.; Liu, H.; Zhang, X.; Wang, Y.; Hao, X. Corrosion Behavior of TiMoNbX (X = Ta, Cr, Zr) Refractory High Entropy Alloy Coating Prepared by Laser Cladding Based on TC4 Titanium Alloy. Materials 2023, 16, 3860. [Google Scholar] [CrossRef] [PubMed]
  15. Vaz, R.F.; Garfias, A.; Albaladejo, V.; Sanchez, J.; Cano, I.G. A Review of Advances in Cold Spray Additive Manufacturing. Coatings 2023, 13, 267. [Google Scholar] [CrossRef]
  16. Yang, C.Y.; Cheng, X.; Tang, H.B.; Tian, X.; Liu, D. Influence of microstructures and wear behaviors of the microstructures coatings on TC11 alloy surface using laser cladding technique. Surf. Coat. Technol. 2018, 337, 97. [Google Scholar] [CrossRef]
  17. Wen, R.H.; Ming, P. Microstructure and wear resistance of laser cladding NiCrAlY/TC4 composite coatings with in-situ synthesized transition layer by modulating thermal boundary in nitrogen atmosphere. J. Mater. Sci. 2023, 58, 16119–16143. [Google Scholar]
  18. Meng, J.; Ji, Z. Microstructure and Technology Research of In-situ Synthesis TiN-TiB2/Ni Composite Coating by Argon Arc Cladding. Phys. Procedia 2013, 50, 253–260. [Google Scholar] [CrossRef]
  19. Liu, Z.Y.; Ma, G.Z.; Xiao, Y.F.; Wang, X.H.; Yu, T.Y.; Wang, H.P.; Wang, H.D. Research Status of Graphene Friction Reduction and Anti-wear Coating Technology. Surf. Technol. 2023, 52, 78–87+121. [Google Scholar]
  20. Berman, D.; Erdemir, A.; Sumant, A.V. Graphene: A new emerging lubricant. Mater. Today 2014, 17, 31–42. [Google Scholar] [CrossRef]
  21. Xiao, P.; Yang, L.; Liu, J.; Zhang, X.; Chen, D. A non-fluorinated superhydrophobic composite coating with excellent anticorrosion and wear-resistant performance. Front. Chem. 2022, 10, 952919. [Google Scholar] [CrossRef] [PubMed]
  22. Baig, Z.; Mamat, O.; Mustapha, M. Recent Progress on the Dispersion and the Strengthening Effect of Carbon Nanotubes and Graphene-Reinforced Metal Nanocomposites Critical. Rev. Solid State Mater. Sci. 2016, 43, 1–46. [Google Scholar]
  23. Rashad, M.; Pan, F.; Tang, A.; Asif, M.; She, J.; Gou, J.; Mao, J.; Hu, H. Development of magnesium-graphene nanoplatelets composite. J. Compos. Mater. 2014, 49, 285–293. [Google Scholar] [CrossRef]
  24. Liu, Z.Y.; Xiao, B.L.; Wang, W.G.; Ma, Z.Y. Analysis of carbon nanotube shortening and composite strengthening in carbon nanotube/aluminum composites fabricated by multi-pass friction stir processing. Carbon 2012, 50, 1843. [Google Scholar] [CrossRef]
  25. Liu, X.H.; Li, J.J.; Liu, E.Z.; He, C.; Shi, C.; Zhao, N. Towards strength-ductility synergy with favorable strengthening effect through the formation of a quasi-continuous graphene nanosheets coated Ni structure in aluminum matrix composite. Mater. Sci. Eng. A 2019, 748, 52. [Google Scholar] [CrossRef]
  26. Liang, B.M.; Luo, M.Y.; Zhang, Z.J.; Zhang, X.H. Research Progress on Preparation and Strengthening Mechanism of Graphene Raw Materials for Graphene Metal Matrix Composites. Light Ind. Sci. Technol. 2017, 8, 5. [Google Scholar]
  27. Meng, J.S.; Li, C.S.; Mi, D.Z.; Liu, B.B.; Xue, F.; Cui, W.C. Structure and Properties of Graphene Reinforced Ti-bas-ed Composite Coatings on TC4 Alloy. Surf. Technol. 2021, 50, 79–85. [Google Scholar]
  28. Zhang, M.C.; Guo, R.P.; Zhang, Y. Preparation and Characterization of High-entropy Cemented Carbide WC-AlCo0.4CrFeNi2.7. Mater. Rep. 2024, 38, 168–173. [Google Scholar]
  29. Ye, D.L.; Hu, J.H. Practical Thermodynamic Numbers for Inorganic Substances According to the Manual; Metallurgical Industry Press: Dongcheng, China, 2002. [Google Scholar]
  30. Ehira, M.; Egami, A. Mechanical properties and microstructures of submicroncemets. Int. J. Refract. Met. Hard Mater. 1995, 13, 313–319. [Google Scholar] [CrossRef]
  31. Song, B.X.; Yu, T.B.; Jiang, X.Y.; Xi, W.C. Analysis of Molten Pool Temperatures and Convection Caused by Laser Cladding. J. North-East. Univ. 2020, 41, 1427–1431. [Google Scholar]
  32. Zhang, C.W. Study on the Structure and Performance of Ti(B, C, N) Powders on Steel and Titanium Alloy Substrate by Laser Cladding; Jilin University: Changchun, China, 2015. [Google Scholar]
  33. Xiong, L.S. Fundamentals of Welding Engineering; China Machine Press: Beijing, China, 2007; pp. 113–154. [Google Scholar]
  34. Meng, J.S.; Shi, X.P.; Zhang, S.J.; Wang, M.; Xue, F.; Liu, B.; Bian, L. Friction and wear properties of TiN-TiB2-Ni based composite coatings by argon arc cladding technology. Surf. Coat. Technol. 2019, 374, 437–447. [Google Scholar] [CrossRef]
Figure 1. Morphology of the original powder: (a) Ti powder; (b) BN powder; (c) Graphene powder.
Metals 14 00403 g001
Figure 2. Argon arc cladding process diagram: (a) Schematic diagram of argon arc cladding; (b) coating morphology.
Metals 14 00403 g002
Figure 3. Standard Gibbs free energy curve of the main reaction with temperature.
Metals 14 00403 g003
Figure 4. XRD pattern of Ti + BN + Grx coating with different graphene contents.
Metals 14 00403 g004
Figure 5. Cross-sectional SEM morphology of Ti + BN + G5 coating.
Metals 14 00403 g005
Figure 6. Microstructure of Ti + BN + Grx coating in the middle of (a) G0; (b) G1; (c) G3; (d) G5; (e) G7.
Metals 14 00403 g006
Figure 7. Ti + BN + G5 coating middle microstructure surface scan: (a) surface scanning area; (b) elemental energy spectrum analysis; (c) C element; (d) Ti element; (e) B element; (f) N element.
Metals 14 00403 g007
Figure 8. TEM micrographs of Ti + BN + G5; the phase bright field images and selected area electron diffraction patterns.
Metals 14 00403 g008
Figure 9. Microhardness of graphene Ti + BN + Grx coatings.
Metals 14 00403 g009
Figure 10. G5 coating Vickers indentation optical image.
Metals 14 00403 g010
Figure 11. Friction coefficient curve between Ti + BN + Grx coating and substrate (a) matrix; (b) G0; (c) G1; (d) G3; (e) G5; (f) G7.
Metals 14 00403 g011
Figure 12. The matrix and Ti + BN + Grx coating wear rate and relative wear resistance.
Metals 14 00403 g012
Figure 13. Surface wear morphology of graphene Ti + BN + Grx coating with different contents and substrates: (a) matrix; (b) G0 coating; (c) G1 coating; (d) G3 coating; (e) G5 coating; (f) G7 coating.
Metals 14 00403 g013
Table 1. Ti-BN-Gx system powder quality.
ConstituenciesPowder Mass (g)
TiBNGr
Ti-BN-G03.711.290
Ti-BN-G13.671.280.05
Ti-BN-G33.601.250.15
Ti-BN-G53.521.230.25
Ti-BN-G73.451.200.35
Table 2. Cladding process parameters.
Current/AVoltage/VCladding Speed/mm·s−1Argon Flow/L·min−1Argon Purity/%
10014.53.01099.9
Disclaimer/Publisher’s Note: The statements, opinions and data contained in all publications are solely those of the individual author(s) and contributor(s) and not of MDPI and/or the editor(s). MDPI and/or the editor(s) disclaim responsibility for any injury to people or property resulting from any ideas, methods, instructions or products referred to in the content.

