1. Introduction
Magnesium alloys have significant value as lightweight engineering materials [
1,
2], with magnesium recently being heralded as the metal of the future [
3,
4]. Their high specific strength, low density (1.74 g·cm
−3 compared with aluminium (2.7 g·cm
−3)), high stiffness, ductility, and good machinability give them a wide range of applications, especially in the automotive and aerospace industries [
5,
6]. With a melting point of 650 °C, magnesium forms a polycrystalline metal with a hexagonal crystal structure that has a c/a ratio of 1.62 [
7,
8]. Through alloying, thermal treatment, and strain hardening, the mechanical properties of these alloys can be optimized for specific applications [
9,
10,
11]. However, in extruded or sheet form, their strong basal texture, in which a majority of grains are aligned with the hexagonal c-axis normal to the sheet, gives them strongly anisotropic yield behaviour and asymmetric yield stresses [
12], which complicates their machinability and practical use [
13,
14].
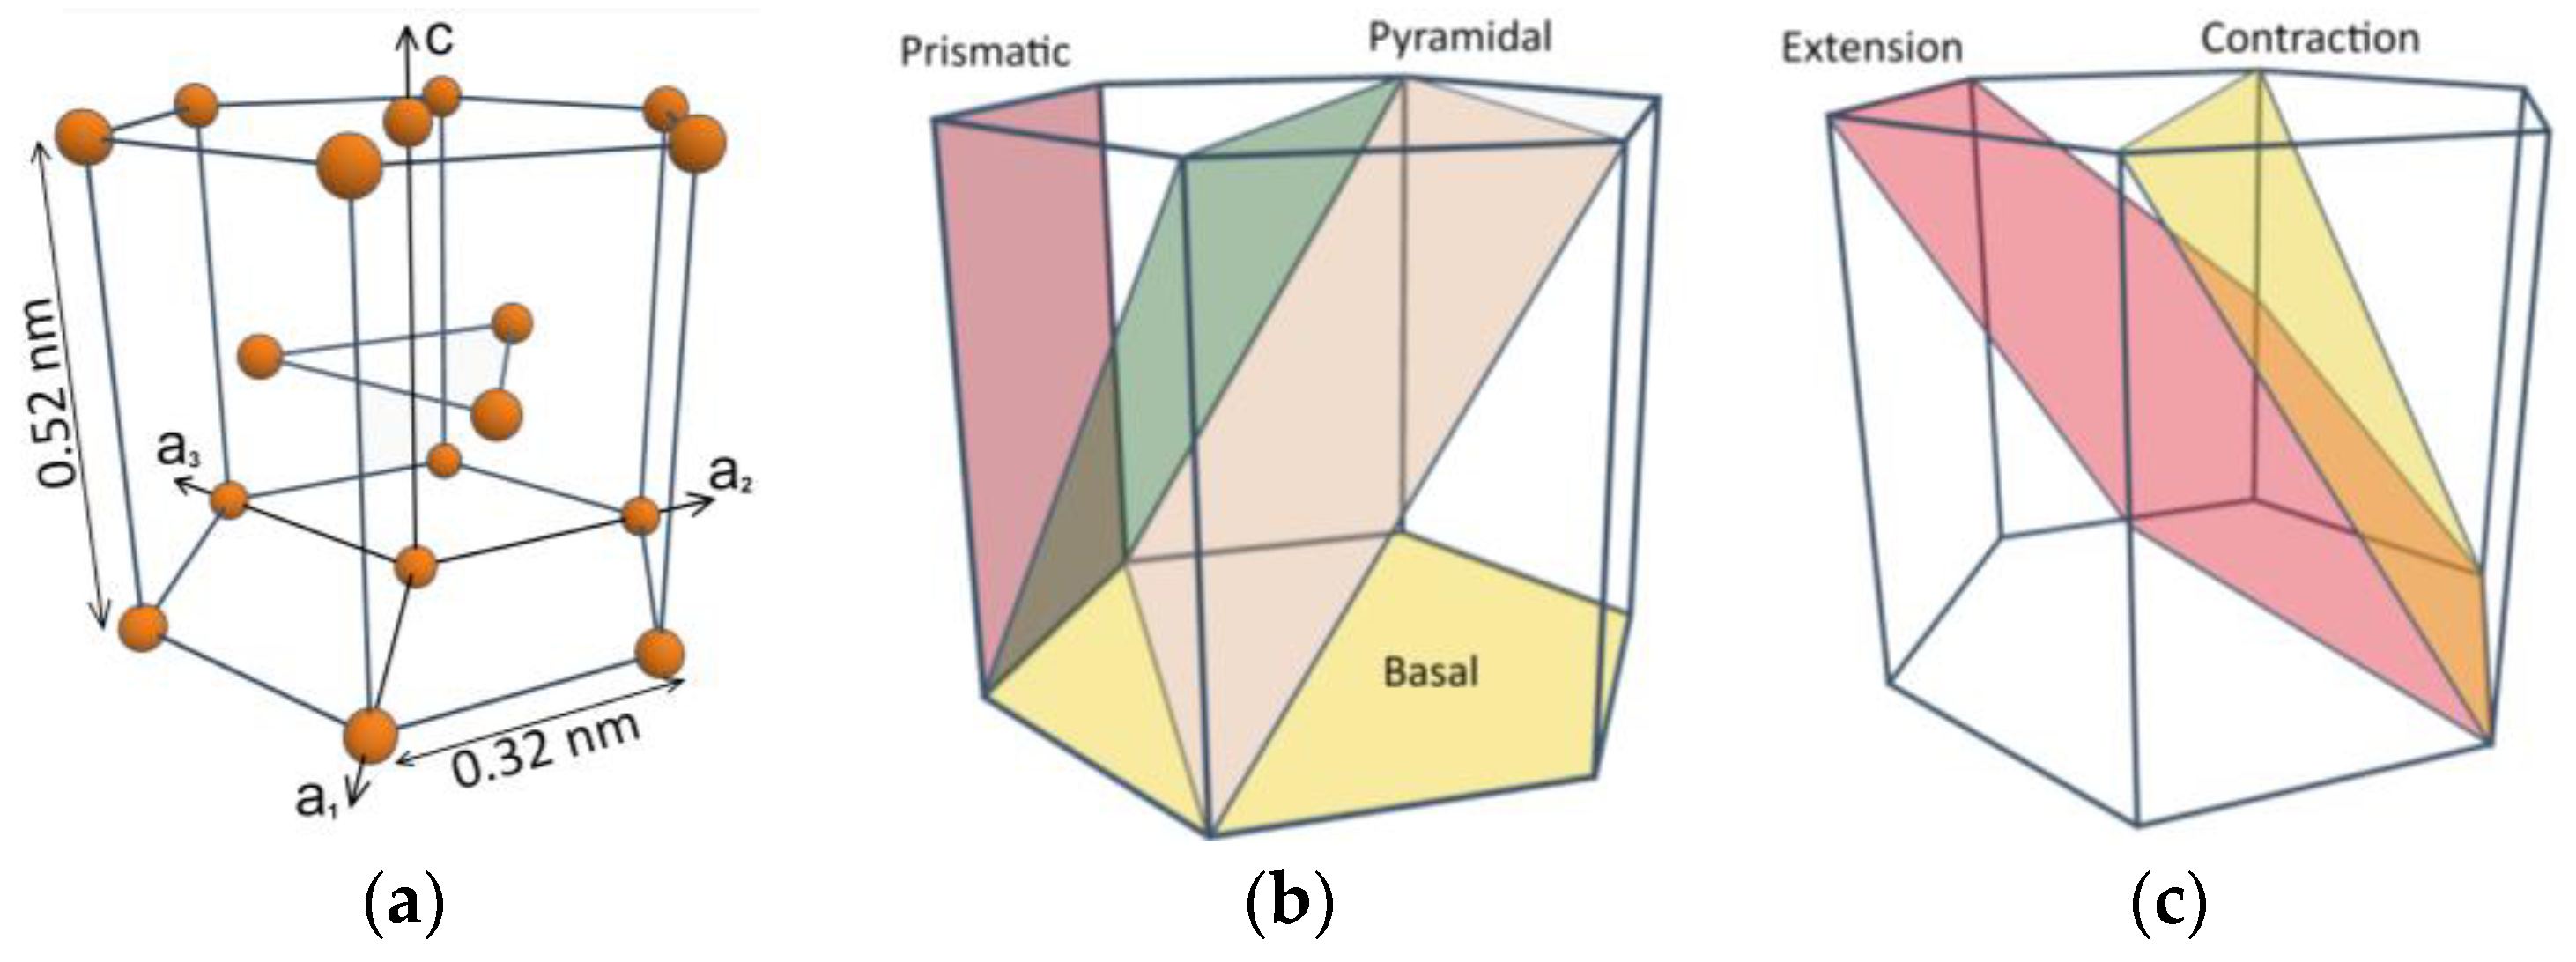
Figure 1 shows the basic unit cell of magnesium and their planes for dislocation slip and twinning [
15]. Because of the hexagonal crystal system, basal slip and extension twinning are the main modes of plastic deformation in magnesium at room temperature, both with a critical resolved shear stress (CRSS
RT) of approximately 0.5 MPa [
16,
17,
18,
19,
20,
21]. At higher temperatures, prismatic and pyramidal slip are possible with CRSS
RTs of approximately 40 and 60 MPa, respectively, as well as contraction twinning with a CRSS
RT of approximately 200 MPa [
16,
22]. Extension twinning extends the lattice in the c-direction by reorientation across the [
10,
11,
12] planes [
23], while basal slip extends the lattice parallel to the basal plane. The basal texture in an AZ31B sheet has a large influence on the activation of deformation modes during mechanical testing, and it is reported that prismatic slip and extension twinning can activate preferentially to basal slip according to the direction of the applied force [
24].
In this study, the plastic deformation mechanisms of twin-roll cast AZ31B alloy sheets (weight percentage composition [
25]: 2.75% Al, 1.08% Zn, 0.368% Mn, 0.0262% Cu, 0.0187% Si, 0.00282% Fe, 0.00038% Ni, and 0.00041% Ca) are investigated when subjected to pure shear stress [
26,
27]. By adapting a recently developed sample geometry [
28] and using an in situ mechanical tester, the samples’ behavior was studied inside a scanning electron microscope (SEM). Real-time electron backscatter diffraction (EBSD) lattice orientation mapping [
29,
30] was used to reveal the initiation and growth of deformation structures within the samples when they were subjected to incrementally increasing pure shear stress.
In situ mechanical testing was initially developed in the late 1960s [
31] and, since that time, has undergone significant further development due to its high value for investigating material behavior under controlled conditions of stress combined with real-time imaging at the micron and sub-micron scales. The initiation and growth of deformation structures can be studied with increasing or decreasing stress states or cyclic stress to examine how plastic strain appears in the microstructure. This knowledge is especially relevant to the development of materials for engineering applications, as well as the design of individual stress-bearing components, because the macroscopic properties of bulk materials are derived from their behavior at the microscopic scale. In combination with EBSD mapping, changes in the lattice orientation can be studied in situ in relation to specific applied stress states, which further elucidates the localized distribution of elastic and plastic strain that accompanies and precedes macroscopic plastic flow.
Shear testing is a form of mechanical stress test that applies offset opposing forces across a volume of material rather than directly opposing forces, which are otherwise used for uniaxial compression and tension tests. The shear test emulates real-world conditions that involve shearing forces such as those encountered through friction when components are displaced relative to each other while maintaining mechanical contact. Also, in a sheet loaded with in-plane shear forces or in a torsionally loaded plate, shear stresses occur within the bulk of the material. Knowledge of how a material behaves under shear stress can then be used to design components to withstand these stresses in real world applications. In the case of sheet materials, shear tests can be made parallel or inclined to the sheet plane with appropriate sample and experiment design. Recent studies have shown the extent to which shear studies have been conducted on magnesium alloys [
32,
33], while developments in sample design [
28] permit the application of pure shear stress to an optimized gauge area as a result of applied tensile force.
Earlier studies of magnesium AZ31B subjected to uniaxial compressive stress observed plastic deformation in the form of bands of twinned grains (BTG) [
25,
34]. These bands formed normal to the maximal principal compressive stress
and individual twins inside the bands were aligned approximately parallel to those bands. Recent in situ studies of magnesium subjected to uniaxial compressive stress confirmed this and investigated in more detail the initiation and growth of individual twins [
15] under this stress state. The current study applies this approach of in situ testing with pure shear stress, an area that has not yet been explored in the literature. The goal of this study is to investigate the nature of plastic flow at the microscopic level and to observe its evolution with increasing stress.
2. Materials and Methods
Textured AZ31B magnesium sheets were obtained from Magnesium Flachprodukte GmbH in Freiberg [
35] and test samples were milled from these sheets using a PFE1000-PX CNC milling machine from BZT Maschinenbau GmbH (Leopoldshöhe, Germany) mill fitted with a 202515-2 carbide cutter from Garant Productions GmbH (Hoffmann Group, Munich, Germany) operated at
with a cutting speed of
and a 10 µm depth of cut and cooled using compressed air. Sample geometry was adapted from the studies of [
29] and surface roughness after milling was nominally Ra = 0.6 µm. Mechanical tests were carried out in a Zeiss Merlin SEM with an accelerating voltage of 20 kV. A 5 kN in situ tension-compression stage from Kammrath & Weiss GmbH (Schwerte, Germany) (referred to herein as the in situ stage) was used to incrementally increase the shear stress on the sample.
Figure 2 shows details of the pure shear test sample. The experiment used the in situ stage to apply a tensile force (
F1) to the sample in the
direction. Dimensions of the sample were chosen so that it would fit into the in situ stage and have the same length (60 mm) and thickness (3 mm) as the earlier uniaxial compression samples [
15]. The geometry, based on [
28], was optimized with the help of numerical simulations to produce an almost pure shear stress state in the area between the 2 notches. This is shown using the triaxiality factor
η = σ
m/σ
v.Mises in
Figure 3a. Samples were finely ground and polished on one side before in situ testing so that the analysed surface was suitable for imaging and EBSD mapping [
36,
37].
Figure 2c shows the 3D-printed (3DP) plastic sample holder designed to fit a RotoPol 11 polishing machine from Struers GmbH (Ballerup, Denmark). Using this holder, three samples could be ground and polished simultaneously with an even surface finish.
Grinding was carried out using 2500- and 4000-grit silicon carbide papers, polishing using a colloidal suspension of 40 nm silicon dioxide powder solution in deionized water on a neoprene cloth, vibrational polishing using 30 nm aluminum oxide powder suspension on a neoprene cloth in a Buehler Vibromet, and cleaning in an ultrasonic bath. By using deionized water for each stage and absolute ethanol for final cleaning, it was possible to produce a surface without a hydroxide layer [
38], which would otherwise form with water-containing solutions and diminish the EBSD signal which is derived from the upper 100 nm or so of the surface [
39]. This high surface quality allowed the same area of samples to be studied and mapped multiple times; only the physical deformation of grains at the surface by the mechanical test eventually obstructed the electron signal reaching the CCD sensor of the EBSD detector.
The geometry of the pure shear sample, based on [
28], was optimized with the help of numerical simulations to produce an almost pure shear stress state in the area between the 2 notches.
Figure 3 shows the results of the finite element simulation of the pure shear sample based on a linear-elastic constitutive law considering large deformations. The dimensions of the shear sample were optimized by an isotropic elastic FEM (finite element method) simulation considering large deformations. A Young’s modulus of 42,866.5 MPa and a Poisson’s ratio of 0.32 [
25] were used for the isotropic elastic material model. The geometry, shown in
Figure 3a, was discretized using 94,500 hexahedral isoparametric elements (C3D20R) with quadratic shape functions and a reduced integration scheme. The boundary conditions specified on the left surface of the clamping area (
surface) are such that the displacements
,
, and
are set to zero. In addition, a homogenous distributed load of
N was applied on the right-hand side of the right clamping surface.
The main purpose of using the FEM simulation was to optimize the geometry of the sample to achieve a homogeneous pure shear stress state in the gauge area. A defining characteristic of the pure shear stress state is that the major principal stress (positive value), the minor principal stress (negative value), and the maximum shear stress are equal in magnitude. It should be noted that the principal stresses and the principal axis system are marked with in this study. In addition, the principal stresses are ordered according to the convention ≥ ≥ . It is well established that the axis system, where the maximum shear stress occurs, is rotated by relative to the principal axis system. The corresponding values and the corresponding axis system are denoted as .
To verify whether a pure shear stress state has been achieved in the gauge region, the triaxiality factor
is used. The triaxiality factor is calculated using the formula
where
is the arithmetic mean of the normal stresses,
the first stress invariant, and
the von Mises equivalent stress. For a pure shear stress state,
. The triaxiality factor converts a multiaxial stress tensor into a simple scalar quantity, making it easy to evaluate the multiaxiality of the stress state.
Figure 3a displays the plot of the scalar field
in the range of
. The plot confirms the attainment of an almost perfect pure shear stress state within the central gauge area.
Figure 3b shows the distribution of the maximum shear stress
and the orientation of the corresponding
–
axis system. The axis system is rotated by the angle
in relation to the global
axis system presented in
Figure 3a. The shear stress should be the maximum and as homogeneous as possible in the central gauge area. To verify this,
is plotted in
Figure 3c along the paths
and
, which are illustrated in
Figure 3b.
Figure 3c confirms that the maximum value of
is attained at
and
. Furthermore,
remains constant along the paths
and
for a certain length. This is particularly valid for the path
, which verifies the presence of an acceptable homogeneous stress distribution in the central gauge zone.
In addition to the triaxiality factor
and the maximum shear stress
, the principal stresses
and
and the orientation of the corresponding principal
axis system were analyzed for the central gauge area. This is of crucial importance, as one of the main objectives of this study is to investigate whether the twins align perpendicular to the minor principal stress
as in the uniaxial experiments in [
15], although a pure shear stress state prevails.
Figure 3d shows the distribution of the minor principal stress
for an external load of
N. Additionally,
Figure 3d shows the orientation of the principal axis system and the associated principal stresses. The major principal stress in the central gauge area is
MPa, which is a tensile stress. Conversely, the minor principal stress of
MPa is a compressive stress. Consequently, the criterion for the pure shear stress state
is approximately valid with a deviation of 8.66%. The principal
axis system is rotated by the angle
with respect to the global
axis system, introduced in
Figure 3a. The alignment of the principal stress directions is crucial for comprehending the microscopic deformation mechanisms later on.
Figure 4 shows details of the experimental set-up. The in situ stage was attached to the microscope stage using an electrically conductive steel adapter provided by Kammrath & Weiss GmbH. The adapter plate tilted the sample by 50° to the horizontal, and when combined with the 20° tilt within the in situ stage, the required 70° tilt was achieved for EBSD measurement. The horizontal and vertical positions of the stage were precisely set in order to avoid contacting the SEM objective pole piece or the sensors when the in situ stage was inserted into the chamber.
Figure 3b shows the polished sample fixed using hardened steel gripping plates in the in situ stage.
Figure 4c illustrates the EBSD system, where electrons backscattered from atoms within approximately 100 nm of the sample surface are diffracted by the upper layers of the sample lattice, collected on the CCD sensor of an Oxford Instruments Nordlys detector, and processed in the AZtecHKL software (version 3.3 SP1) into phase and orientation of the scattering site. By scanning the electron beam raster-style across an area of the sample, a map of phase and lattice orientation, called the Inverse Pole Figure or IPF, was produced. These maps were recorded at different values of load and later processed using the ATEX analysis software (version 4.05) [
40].
Figure 4d shows a typical experimental load–displacement curve. As the stress and strain within the pure shear gauge zone could not be measured directly due to the complex geometry of the sample, the curve displays measured values of applied force
F1 vs. macroscopic displacement
in the
direction. Force was increased incrementally by driving the DC motor at a speed of 2 µm per second to specific pre-set breakpoints. At each breakpoint, power to the motor was held constant while SEM images and EBSD lattice orientation maps were collected. Maps covered a typical area of 100 × 80 µm
2, with a measurement spacing of 0.1 or 0.2 µm. This allows a compromise between resolution and collection time while including an area of some 100 grains. The clean surface produced a strong clear EBSD signal, which allowed for rapid processing times so that each map required around 1 h to collect and multiple mappings could be made of the same area. During collection times, system relaxation gave rise to a slight reduction in force; consequently, these measurement periods appear as inverted spikes in the loading curve.
Figure 5 shows the method used to prepare samples for investigation using TEM. A sample that had been loaded to 950 N was mounted on the table of a 3D-printed core drill and a 3 mm cylinder was removed from the central zone using a stainless-steel tube with 4.0 mm outer diameter and 3.25 mm inner diameter. The core drill, a simplified version of that developed earlier [
41], was operated at 200 min
−1 with a slurry of 15 µm diamond particle paste under a pressure of approximately 5 N which was applied using a 50 mm long 10 mm-diameter stainless-steel compression spring with 0.35
spring constant. Approximately 5 h was required for the drill to grind through the 3 mm-thick sheet. By grinding the annular channel slightly off-center, a slight impression on the side remaining from the sample geometry made it possible to maintain knowledge of the orientation relative to the larger test sample during subsequent studies. After cleaning, the 3 mm cylinder was mounted on a brass rod and sliced into three discs, each approximately 250 µm thick, using a fine-grit diamond wafering blade in a Struers Minitom. The discs were then ground using a self-made 3D-printed manual grinding tool on a 12 µm alumina abrasive sheet on a glass plate to obtain an even surface finish and thickness of approximately 100 µm.
Figure 6 shows the dimpling process that thins the central area of the round sample to <30 µm thickness before ion milling. The dimple grinder-polisher was a 3D-printed device [
42] with a horizontally-mounted DC motor for the grinding/polishing disc and a vertically-mounted DC motor to rotate the sample. The sample was mounted on a 2 mm-thick 8 mm-diameter glass disc mounted in a 3DP plastic holder and rotated at 10 min
−1. A plastic grinding disc and 3 µm diamond abrasive in ethylene glycol required 20 min to form the initial dimple with a vertical force of approximately 60 gf or 0.6 N and rotation speed of approximately 100 min
−1. Polishing was carried out using a strip of flocked polishing cloth mounted on a 3D-printed plastic disc with 1 µm diamond in ethylene glycol and deionized water with the same load as for grinding. A small hydroxide layer would inevitably form on the surface, but by using deionized water the thickness of the layer was minimized, and it would be removed later by ion milling. The sample was dimple-ground and polished on both sides.
Figure 7a shows the 3 mm-diameter sample before dimple grinding and
Figure 7b after dimple grinding: the dimple is well-centered and shows the expected fine uniform grinding lay of 3 µm diamond combined with a plastic grinding disc. The central area at this stage was 40 µm thick as measured using the calibrated depth control of the Zeiss Axio Imager II optical microscope.
Figure 7c shows the dimple after polishing: the grinding lay have been removed and only very fine marks remain, typical of 1 µm diamond polishing. At this stage, the central area was approximately 30 µm thick and any subsurface damage remaining would be expected to be less than 1 µm deep [
43,
44]; ion-beam milling would remove this damage as it removes 15 µm from both sides.
Figure 7d shows the sample after ion-beam milling using a Gatan PIPS II. The sample holder was cooled using liquid nitrogen to −50 °C, beam energy was 6 keV until perforation by 2 keV for 5 min and 1 keV for one minute to remove amorphization, gun angles were 6° from above and 6° from below, and a rotation speed of 3 min
−1 was used. With these parameters, perforation was achieved in approximately 25 min.
3. Results and Discussion
Figure 8 shows SEM images of a sample at six different pure shear-stress states corresponding to applied force
F1 of: (a) 600 N, (b) 780 N, (c) 850 N, and (d) 1500 N. The dark curve in each image is the focal band resulting from the 70° tilt of the sample. Plastic deformation first appears in the central pure shear zone at around a 700 N, load forming an elliptical shape, and grows in size with an increasing load until it extends across the gauge zone. This is consistent with the results of the FEM simulation in
Figure 3. Bands of twinned grains at the edges of the notch roots first appear at around 600 N. These regions exhibit a large negative minor principal stress
, as shown in
Figure 3d. Along with this, the stress state is almost uniaxial with
, which favors the formation of BTGs. These deformation microstructures, together with the surface disturbance, grew in size and became more pronounced as the sample distorted macroscopically until, at approximately a 1500 N force, the sample failed. The dark rectangular area in the zone of plastic deformation is the area studied using EBSD to observe changes in the microstructure with an increasing applied load. The rectangle itself is caused by carbon deposition along the electron beam, as this area was mapped for several hours and collected carbon contamination during the scans.
Figure 9 shows details of the sample surface during the pure shear test before loading and at increasing values of force
of (b) 700 N, (c) 780 N, (d) 850 N, (e) 950 N, and (f) 1400 N. Clearly, the plastic flow has formed deformation structures slanted from the lower left to upper right, normal to the principal compressive stress
. The contaminated area is useful for reference of the area used for EBSD mapping.
Figure 10 shows higher magnification details of the pure shear zone at (a) 950 N and (b) 1400 N of applied force adjacent to the contaminated rectangle areas. Throughout the deformation zone, dislocation slip is found to be more prevalent than twinning. In
Figure 10b, deep slip steps are seen in a number of grains. An in-plane compressive force will result in an expansion normal to the sheet in accordance with the Poission’s ratio [
45], while a tensile force will have the opposite effect; it is reasonable to expect shear stress to have a combined effect, with some grains expanding out of the sheet while others retract from the surface. This could explain the type of appearance in these images. Twinned grains under compression show a plastic Poisson’s ratio
(the first index denotes the
direction, the second denotes the normal direction of the sheet surface plane) of approximately 1.0 and
of approximately 0.0 [
45], whereas the macroscopic material under tension show a plastic Poisson’s ratio of approximately 0.5 [
45]. Therefore, because of compatibility reasons, dislocation slip and the irregular surfaces appear.
Figure 11 shows the marked rectangular area of the sample at four different loading conditions: before loading and at 700 N, 900 N, and 1000 N of applied force. The inset colour code that relates colour to the lattice orientation normal to the sheet is applicable to all subsequent orientation maps and is not reproduced in each map. The mostly red colour denotes the basal texture with the c-axis of the grain lattice normal to the sheet. The few non-aligned grains are typical of AZ31B sheets. Grain identification is made using a disorientation angle of 5°. At 750 N, the first few twins have appeared, visible in the top left, but otherwise there is little change. At 900 N, several grains have become twinned throughout and appear as regular grains tilted away from normal. An inclination of twins is clearly appearing from the lower left to upper right. At 1000 N, surface irregularity has reduced the EBSD signal in many areas and many points are zero solutions (cannot be indexed by the software due to poor signal) and appear black. With new developments in EBSD detectors [
46], these types of low signa andl high noise areas might be more measurable. However, it is clear that a high density of twins has formed up with the same inclination.
Figure 12 shows the growth of a band of extension twins that extends across eight grains in the middle of the pure shear zone. The band is oriented normal to the principal compressive stress
. The four images correspond to applied forces of 700 N, 730 N, 780 N, and 850 N. The twins have expanded laterally and become wider as a result of the increasing stress, while additional smaller twins parallel to the main band have appeared and grown. The growth of the main band has been in both directions, left and right, but more significantly to the right, filling out the parent grains. The shearing of the area can be seen in the image, with the upper right grains moving to the right and the lower grains progressively shifting to the left. The pole figures for each map show the growth of the twinned lattice. Additionally, the x
1, x
2 and x
3 Kearn’s factors [
47] for each map are (0.10, 0.10, 0.8), (0.11, 0.10, 0.79), (0.12, 0.10, 0.78), and (0.14, 0.10, 0.76), which shows the realignment of the lattice away from x
3 mainly into x
1. This means that an increase of 150 N in applied force corresponds to an increase of approximately 5% in the twinned lattice area. The two SEM images show the changes in the surface appearance between 700 and 850 N. It is clear that the band of twins is inclined to the sheet surface, as this is where the grains have expanded outwards from the bulk sample under stress.
Figure 13 shows detailed lattice orientation maps of the large twin in the top left of
Figure 12 at 700 and 850 N of applied force. The lower right area of this grain has become progressively twinned and an area in the top left of the grain has begun to twin. Maps of internal grain disorientation can, to some degree, be identified with elastic strain in grains, as inhomogeneous bending and torsion will give rise to disorientation away from the grain average. Clearly, the 850 N sample contains more elastic strain in the grains, although the twins themselves contain very little elastic strain; this suggests that twinning has the effect of releasing elastic strain in the lattice. To process the internal grain disorientation data, it was necessary to reduce the grain tolerance angle to 1°, otherwise separate grains with small-angle boundaries appear as single grains and can give false disorientation values; this has produced a large number of dark spots in the images.
Figure 13d represents an orientation linescan across the grain from A to B, and it is clear how the strain has increased with increasing stress, including the top left area which has developed a discontinuity from the main grain that appears to be the early stages of a twin. The maximum disorientation is 10.9°, which is consistent with previous observations that indicate that this could be a threshold for twinning to occur.
Figure 14 shows EBSD maps from within the pure-stress zone after an applied load of 950 N and after fresh surface preparation. In
Figure 14a, the area contains around 120 grains and the twin density is very high, many grains are fully twinned, and the angle of the twins with respect to
is approximately 90°. All twins are extension type with an 86.3° disorientation. Many of the grains contain internal disorientation, which can be identified with elastic strain, with an average of 2.23° and a maximum of 9°. The Kearns factors for this condition are x
1 = 0.2, x
2 = 0.48, and x
3 = 0.32, indicating significant loss of texture as grains are reoriented through twinning.
Figure 14c, showing a higher magnification, reveals multiple twins in several grains.
Figure 14d shows grain disorientation along the line A-B across the larger pink grain and a disorientation of approx. 86.3° characteristic of extension twins, and approx. 5° disorientation on the right side, indicating that, with increasing stress, the twin would likely grow in that direction.
Figure 15 shows a higher magnification lattice orientation map of the 950 N-loaded sample at a grain containing a large twin that has grown from the lower left to upper right. Things to note in this image are: the higher strain is in the parent grain next to the base of the orange twin, suggesting that this is where twining is growing; the maximum measured disorientation within the grains is 9°; most of the very small spots are extension twins; the lower end of the grain where the strain is higher is where the twin would grow; the strain on the right of the twin in the parent grain is greater than on the left, suggesting that the grain would grow to the right; the band of elastic strain across grains (line 4) seems to be derived from the grain on the right; the red twin appears to have grown into the yellow grain. The dark orange grain in the lower left is not a twin of the pink grain, and the interface between the two is the grain boundary of the pink grain.
Figure 16 shows bright field TEM images of a typical area from the gauge zone of the sample subjected to a 950 N force. The diffraction pattern shows the [100] or [2-1-10] zone axis of the grain, while the hexagonal unit cell (with side length ratio 1.62) corresponds to the lattice inside the twins and indicates the [0001] direction (c-axis), the basal plane (0001), and the (10–12) extension twinning plane. The direction of the minor principal stress
is indicated by the arrow, and this direction applies to all subsequent images. The image contains three parallel twins of extension type, which is consistent with the EBSD maps that show a high concentration of twins mostly parallel to each other and approximately perpendicular to the direction of the compressive stress
.
Figure 16c shows more details of the middle twin; features inclined to the length of the twin are stacking faults on the basal plane, which form as atoms rearrange themselves during the twinning process.
Figure 16d shows details of the end of the twins where they intersect the grain boundary. This area corresponds to the white square in
Figure 16a below the diffraction pattern. In both cases, the stacking faults are normal to the grain boundary, which shows that the twin at this location has the lattice with the c-axis parallel to the grain boundary. This suggests that a favorable location for twinning to initiate is at grain boundaries. TEM examines very small volumes of material at a high resolution. It is suited to revealing details that are not present in SEM or EBSD images, but macroscopic generalisms should not be extrapolated from the TEM study unless it is extensive and examines a larger number of sample areas. There is a periodicity of 106 nm in the spacing of the parallel stacking faults, their presence adding to the mechanical properties of the alloy [
48,
49].
Figure 17 shows TEM bright field images of intersecting twins. These images and those in
Figure 18 are made using multibeam conditions to optimize the contrast. In addition to parallel twins, twins were also found to cross and intersect with each other. The number of these was very low compared with that of parallel twins, but still consistent with the EBSD maps from the gauge zone that do show occasional crossing twins (e.g.,
Figure 12c). The faint lines in the image from the top left to bottom right are tracks from ion-beam milling, and can be ignored. The two twins in
Figure 17a share the same orientation relation with the parent grain, as illustrated by the parallel stacking faults. The location of intersection reveals some complexity, and an area that could be considered as a transition zone. In
Figure 17b, there is clearly a dominant twin (top left to lower right) that is intact through the intersection and one that crosses it but is not connected.
Figure 17c,d shows the propagating tip of a twin and a lenticular extension twin with a high aspect ratio.
Figure 18 shows TEM bright field images of other features observed during investigation that are evidence of the high levels of strain taking place in the lattice.
Figure 18a shows the dense networks of dislocations that are present, which is expected at high levels of strain and also observed in the SEM images [
50,
51,
52].
Figure 18b shows the typical distribution of a smaller population of precipitates, consistent with an earlier study [
34]. Further studies on dislocation slip and deformation twinning in magnesium alloys can be found to add context to these investigations and give an indication of the direction of research in this field [
53,
54,
55,
56].


