Article

Aging Treatment Induces the Preferential Crystallographic Orientation of αs in the Near-α Titanium Alloy Ti60

Key Laboratory for Light-Weight Materials, Nanjing Tech University, Nanjing 211816, China
*
Authors to whom correspondence should be addressed.
Metals 2024, 14(5), 602; https://doi.org/10.3390/met14050602
Submission received: 18 April 2024 / Revised: 16 May 2024 / Accepted: 17 May 2024 / Published: 20 May 2024
(This article belongs to the Special Issue Light Alloys and Composites)

Abstract

:
In this article, we subjected the Ti60 alloy to solid-solution treatment at 1020 °C and aging treatment at 600 °C, respectively, achieving a bimodal microstructure. The microstructures obtained after aging treatment showed no significant difference in the primary α-phase content, size, and width of the lamellar α phase. This suggests that the final microstructure morphology is primarily determined by the solid-solution temperature, with the aging process exerting less pronounced effects on microstructural alterations. Furthermore, we investigated the effect of solid-solution and aging treatment on the crystallographic orientation evolution of the secondary α phase (αs) in the near-α titanium alloy Ti60. The αs phase displays a random orientation in solid-solution treatment sample, while it demonstrated a preferential {0 1 −1 0} orientation after aging treatment. This interesting phenomenon is attributed to the enhanced variant selection resulting from the dissolution of variant near 60° and 90° during aging. Furthermore, the αs with {0 1 −1 0} orientation nucleated at the grain boundary and coalesced into larger αs lath with increasing aging time, further contributing to the αs {0 1 −1 0} texture.

1. Introduction

In recent decades, researchers and scholars have dedicated substantial effort to investigating the influence of heat treatment on the microstructural evolution of titanium alloys and understanding the intricate relationship between microstructure and mechanical properties. In practical applications, the Ti60 titanium alloy commonly exhibits a bimodal microstructure. This selection is based on the superior matching of creep and fatigue properties exhibited by the Ti60 titanium alloy with a bimodal microstructure when compared to other high-temperature titanium alloys [1,2,3]. Typically, the bimodal microstructure of near-α titanium alloys is generally defined as secondary α-phase(αs) laths surrounded by αp phase(αp) with a content of less than 40%. The formation of this microstructure is influenced by diverse heat treatment procedures as well as various hot working processes, which entail deformation within the β-phase region followed by shaping within the α + β-phase region [4,5].
The heat treatment process for titanium alloys is typically employed to control the content of the two phases, particularly in near-α titanium alloys where the αp-phase content plays a pivotal role in determining mechanical properties. Decreasing the αp-phase content can enhance fracture toughness and creep resistance to some extent, albeit at the expense of reduced plasticity and fatigue properties [6]. At the same time, heat treatment significantly influences the alteration of crystallographic orientation in these two phases [1,7,8]. This approach provides the most effective way of modulating the microstructure and properties of Ti60 alloy through phase transformation.
Throughout this process, the parent and child phases commonly exhibit specific relationships in lattice orientation. The most prevalent relationships are expressed through the Burgers Orientation Relationship (BOR): (1 1 0)β//(0 0 0 1)α and [1 1 −1]β//[1 1 −2 0]α [9]. In recent decades, driven by advancements in material characterization techniques and heightened demands for alloy properties, the impact of variant selection on grain orientation distribution and material mechanical properties during the phase transformation process has garnered increasing attention from scholars globally. Ideally, in the α ⟶ β ⟶ α transformation process, there exist 72 potential variant choices, each with an equal probability. In the absence of processing methods such as deformation and heat treatment, titanium alloys typically do not exhibit texture in the microstructure. However, as research advances, numerous scholars have documented the phenomenon of variant selection during the phase transformation process of titanium alloys. This phenomenon can alter the crystal orientation distribution within the material, subsequently influencing its ultimate mechanical properties [10,11,12]. The mechanism of variant selection that occurs during phase transformations in hexagonal close-packed (HCP) and body center cubic (BCC) metals is commonly associated with strain and elastic anisotropy. This association arises because phase transformations typically entail anisotropic volume changes and stress alterations, particularly pronounced in titanium alloys, which result in a relatively strong intensity of α-phase texture. Solid-solution and aging treatments are extensively employed as strengthening methods for titanium alloys. These methods aim to regulate the microstructure morphology and enhance mechanical properties by exploiting the microstructure’s sensitivity to heat treatment conditions [13,14,15]. Indeed, the heat treatment of titanium alloys leads to a complex evolution in microstructure. Previous researchers have conducted comprehensive investigations into the diverse microstructures of titanium alloys resulting from various heat treatments and their consequential impacts on mechanical properties, aiming to choose an optimal heat treatment process [14,16,17,18]. In addition, the researchers investigated the changes in the α-phase orientation of titanium alloys after different annealing temperatures and cooling rates [7,9].
In summary, these studies have revealed a close relationship between the microstructure of titanium alloys and their mechanical properties. Additionally, the influence of heat treatment on the orientation distribution of the titanium alloy microstructure, particularly the α phase, has been found to be closely intertwined. In this study, backscattered electron imaging (BSE) and backscatter diffraction (EBSD) methods were employed to investigate the microstructure morphology and orientation differences within the crystals of the Ti60 alloy after heat treatments at 1020 °C and 1020 °C + 600 °C, respectively. The solid-solution treatment involving the αs phase was utilized to reconstruct the prior β grains, facilitating a detailed analysis of the influence of distinct heat treatment processes on crystal orientation. To the best of our knowledge, the changes in orientation of αs in near-α titanium alloys after aging treatment remain insufficiently clarified. The objective of this study was to enhance our understanding of the impact of solid-solution aging treatment on the evolution of αs crystallographic orientation in Ti60 alloy, to advance our precise regulation of the microstructure of near-α titanium alloys.

2. Materials and Experimental Procedures

2.1. Materials

The material selected for the experiments was a forged Ti60 titanium alloy. Its specific chemical composition is presented in Table 1. As illustrated in Figure 1, the microstructure of the as-received Ti60 alloy exhibits a homogeneous bimodal structure with about 37% of the equiaxed αp phase having a grain size of about 27.56 μm, and the remaining 63% of the lamellar α phase in β-phase matrix. The α-phase content and size in different microstructure states were measured by Image-Pro Plus 6.0 software. The initial microstructure analysis included inverse pole figure (IPF) and pole figure (PF) results.

2.2. Experimental Procedures

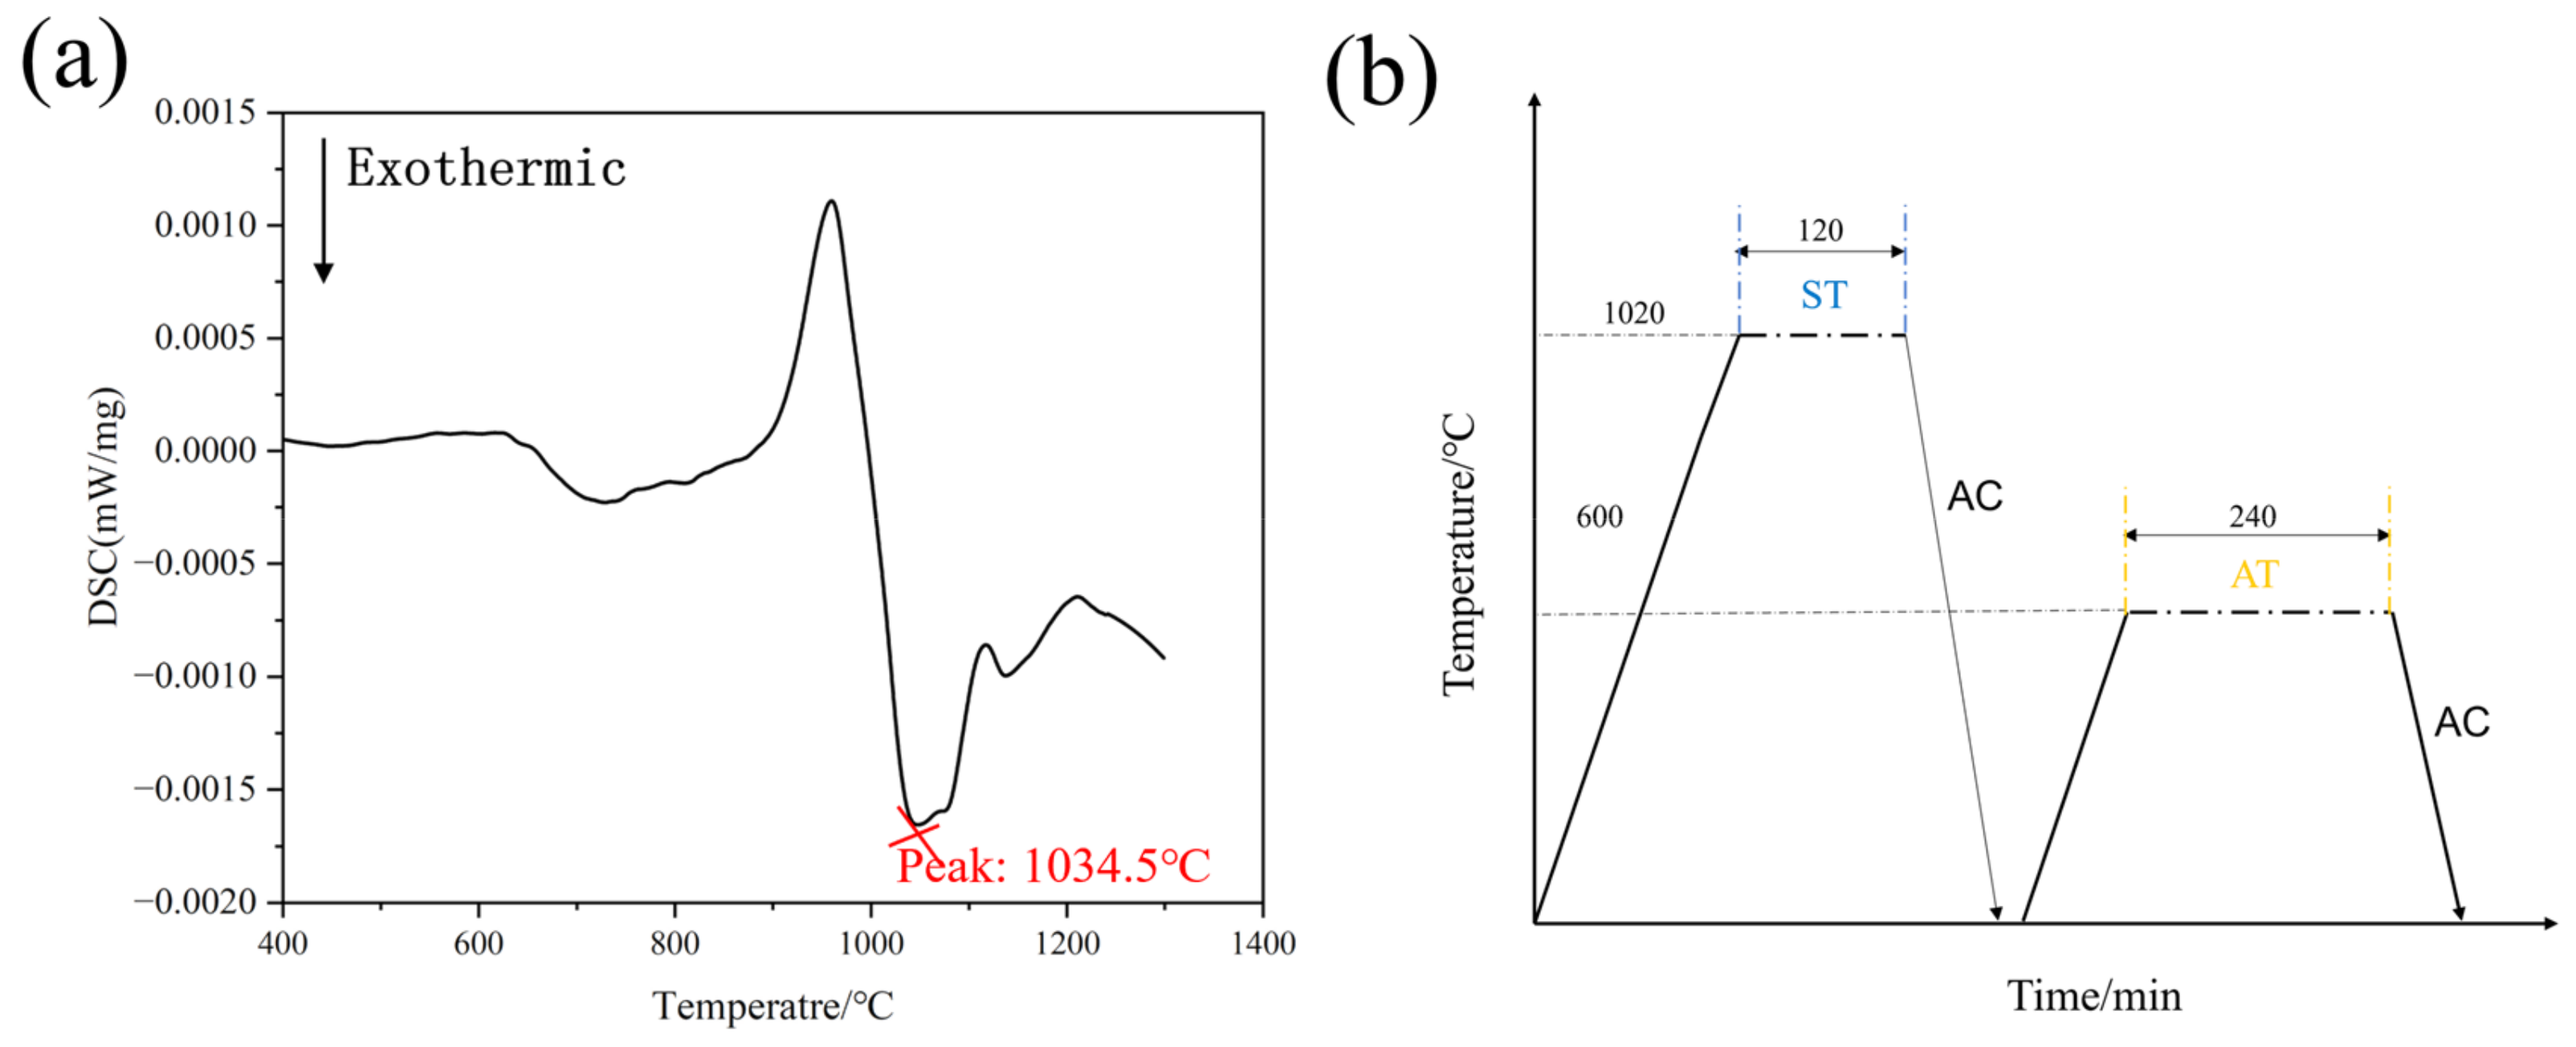
The β-phase transition temperature of the Ti60 alloy was measured as 1030 ± 5 °C using the differential scanning calorimetry (TA, DSC) method in a N2 atmosphere, as depicted in Figure 2a. This result serves as a reference for the subsequent development of the heat treatment process. To investigate the impact of solid solution and subsequent aging treatment process on the microstructure crystal orientation, the Ti60 forging billet was cut into 10 mm × 7 mm × 5 mm rectangular samples using an HSQ2C wire electrical discharge machine (WEDM) from Sanko Technology in Suzhou, China. The samples were subjected to heat treatment experiments in the GSL-1600 in Shanghai, China vacuum tube furnace. In this process, the samples were loaded into the furnace through one end of a quartz tube, positioned at the midpoint of the tube, and sealed on both ends with refractory bricks. Upon completion of the heat treatment experiments, the samples were withdrawn from the middle of the tube and subjected to either water quenching or air cooling. As in the actual production process of large workpieces, a moderate air cooling rate is generally chosen to avoid cracking, so the cooling methods chosen for this experiment utilize air cooling. The heat treatment process is shown in Figure 2b: the solution treatment process involved heating the samples in the α + β-phase region to 1020 °C under insulation for 2 h at a temperature increase rate of 15 °C/min, followed by air cooling to room temperature (hereinafter referred to as ST). Subsequently, after solid-solution treatment at 1020 °C, the samples were cooled to room temperature and then held at 600 °C for 4 h before being air-cooled to room temperature (hereinafter referred to as ST + AT).
After heat treatment, the specimens were cut in the same direction, and then the microstructure and orientation of the specimens were examined using BSE and EBSD. The Ti60 alloy orientation information was obtained using the EBSD technique with the device model TESCAN S8000 in Brno, Czech Republic. During the EBSD experiments, data acquisition parameters included an acceleration voltage of 20 kV, a current of 20 nA, a 500 μm range, and a 0.4 μm step size. To prepare the EBSD crystal orientation specimens, the sample surfaces underwent pre-grinding and electrolytic polishing treatments. This preparation step is crucial due to the deformation that occurs on the sample surface during previous sample preparation processes, resulting in lattice aberration distortion and the presence of a stress layer. Electrolytic polishing effectively removes this stress layer from the sample surface, thereby enhancing the calibration accuracy of the crystal orientation. The electrolytic polishing experiments were carried out using devices such as magnetic stirrer, DC power supply and selecting appropriate voltage and temperature. The electrolytic polishing solution composition comprised 15% HClO4, 35% CH3(CH2)3OH, and 60% CH3OH, and the experiments were maintained at a temperature of −20 °C and a voltage of 50 V for a duration of 50 s.

3. Results and Discussion

3.1. Microstructure Changes during Solid-Solution and Aging Treatments

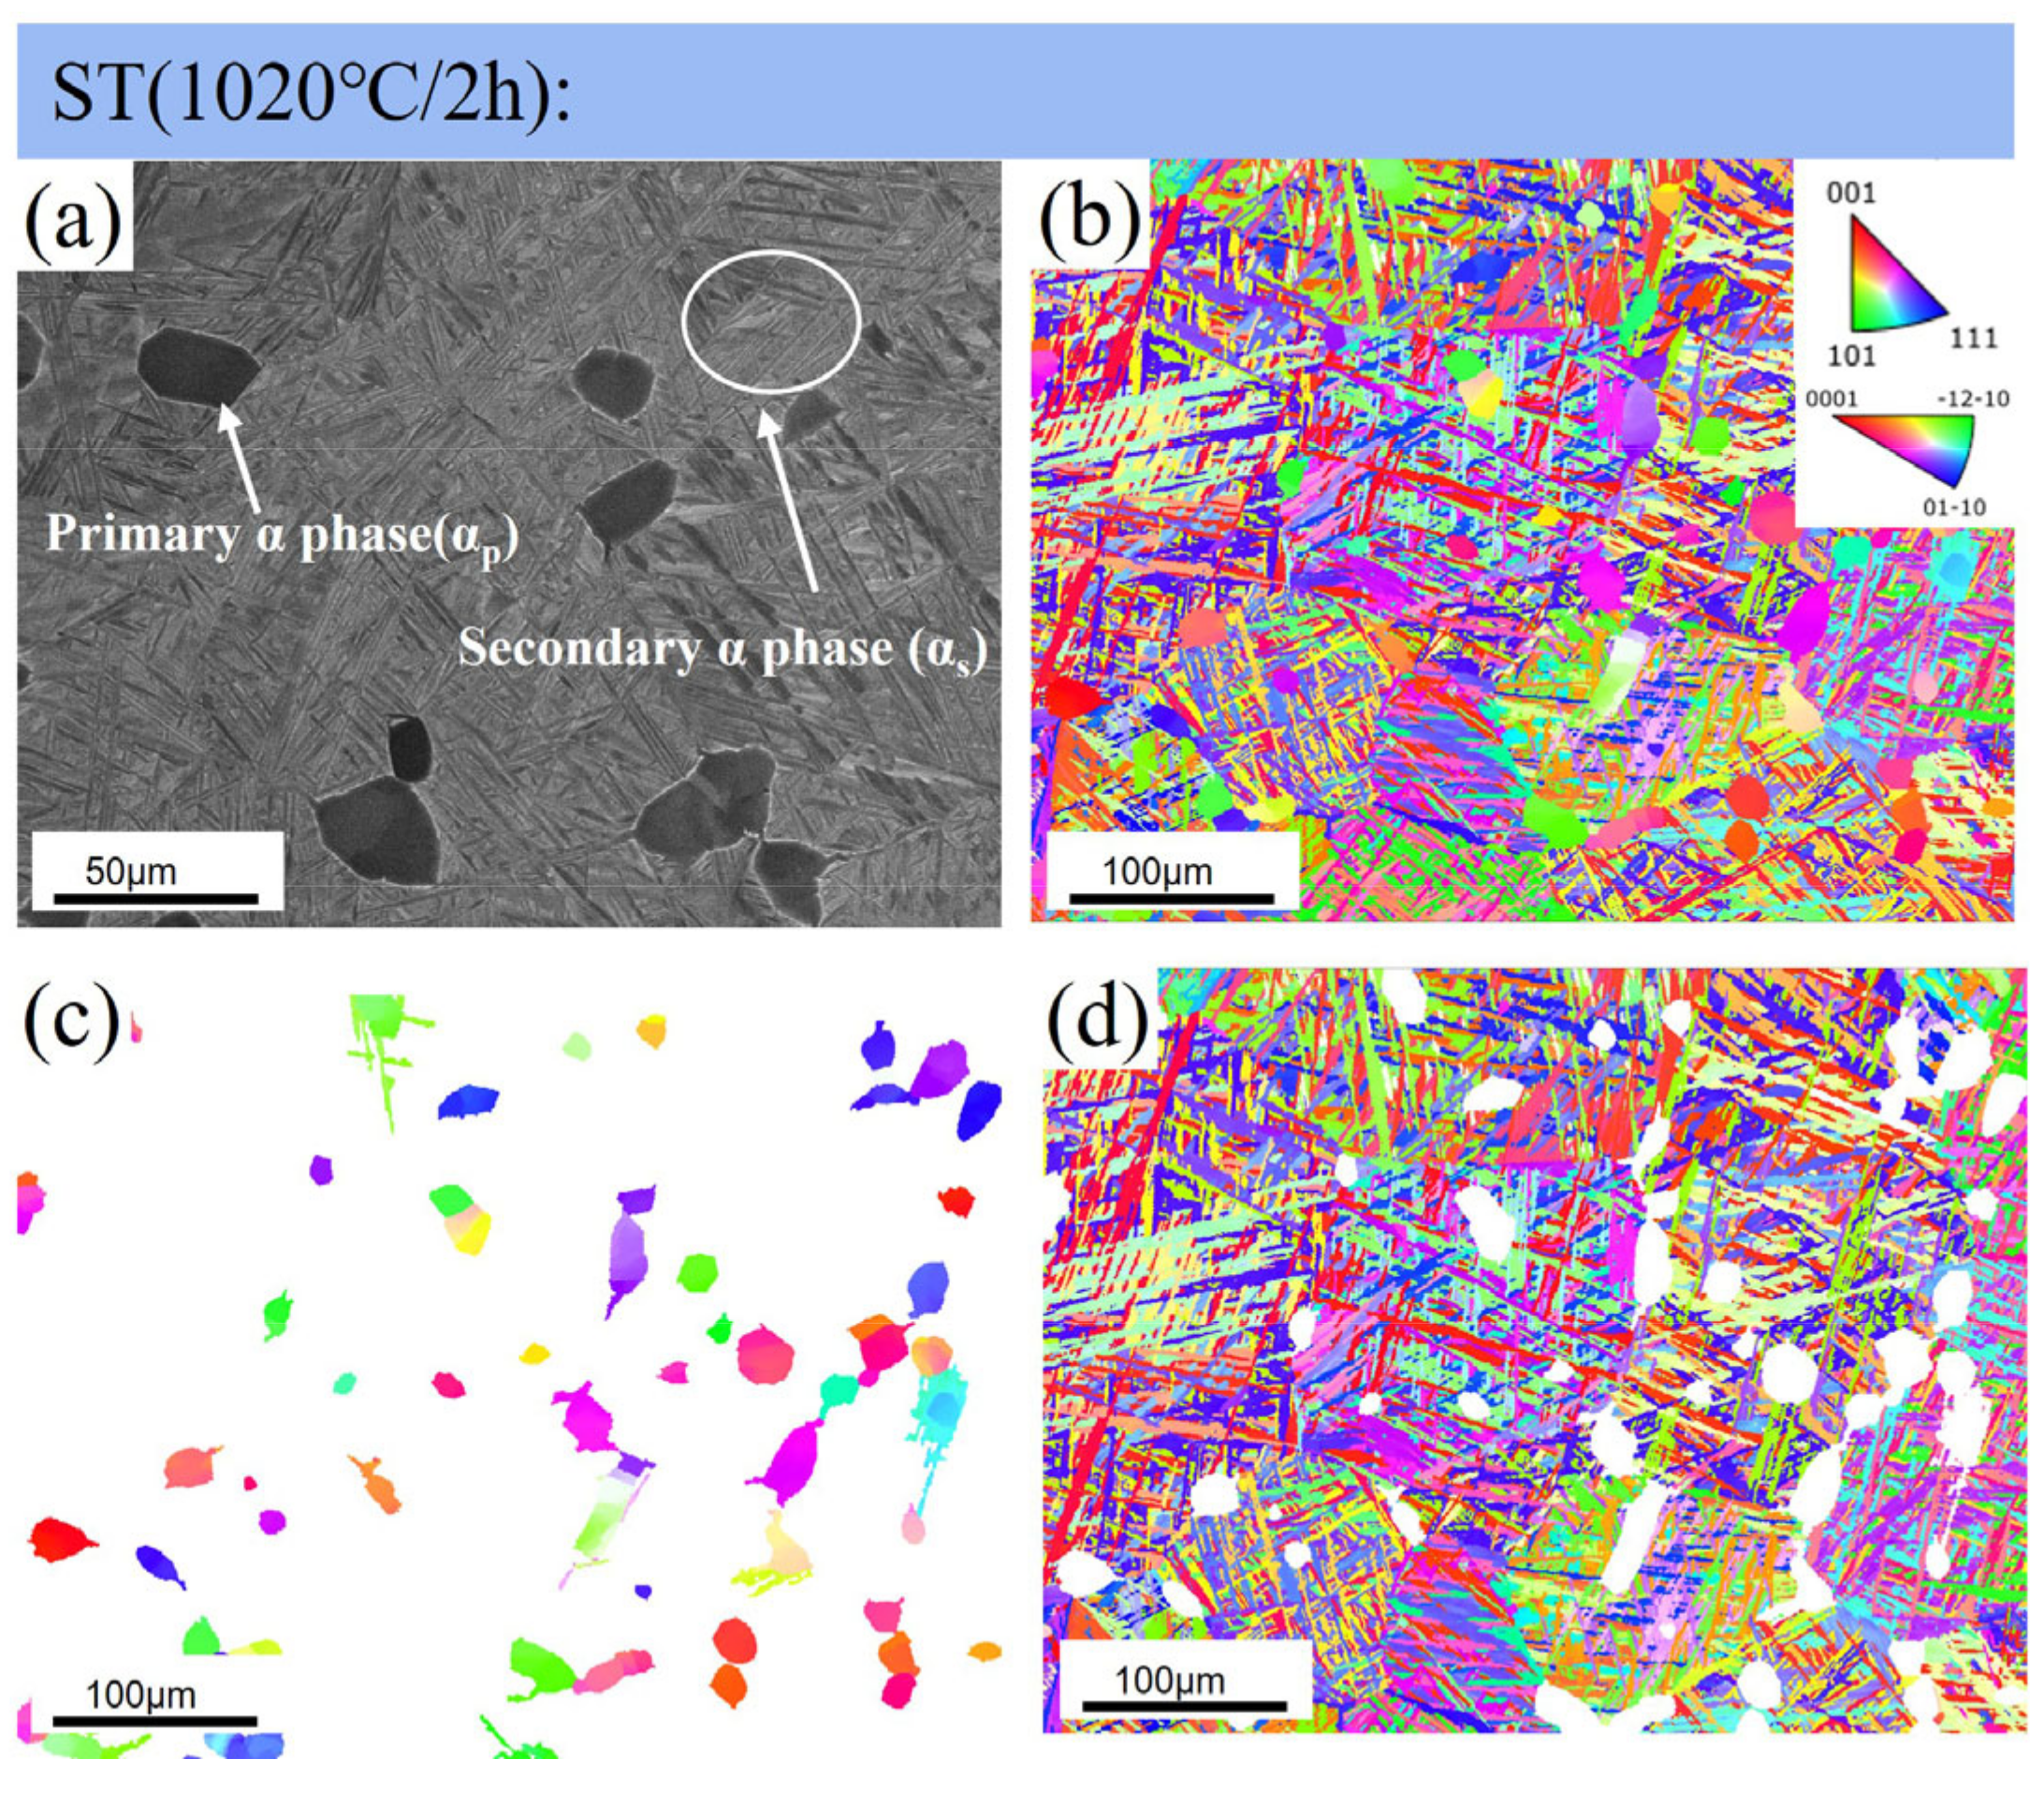
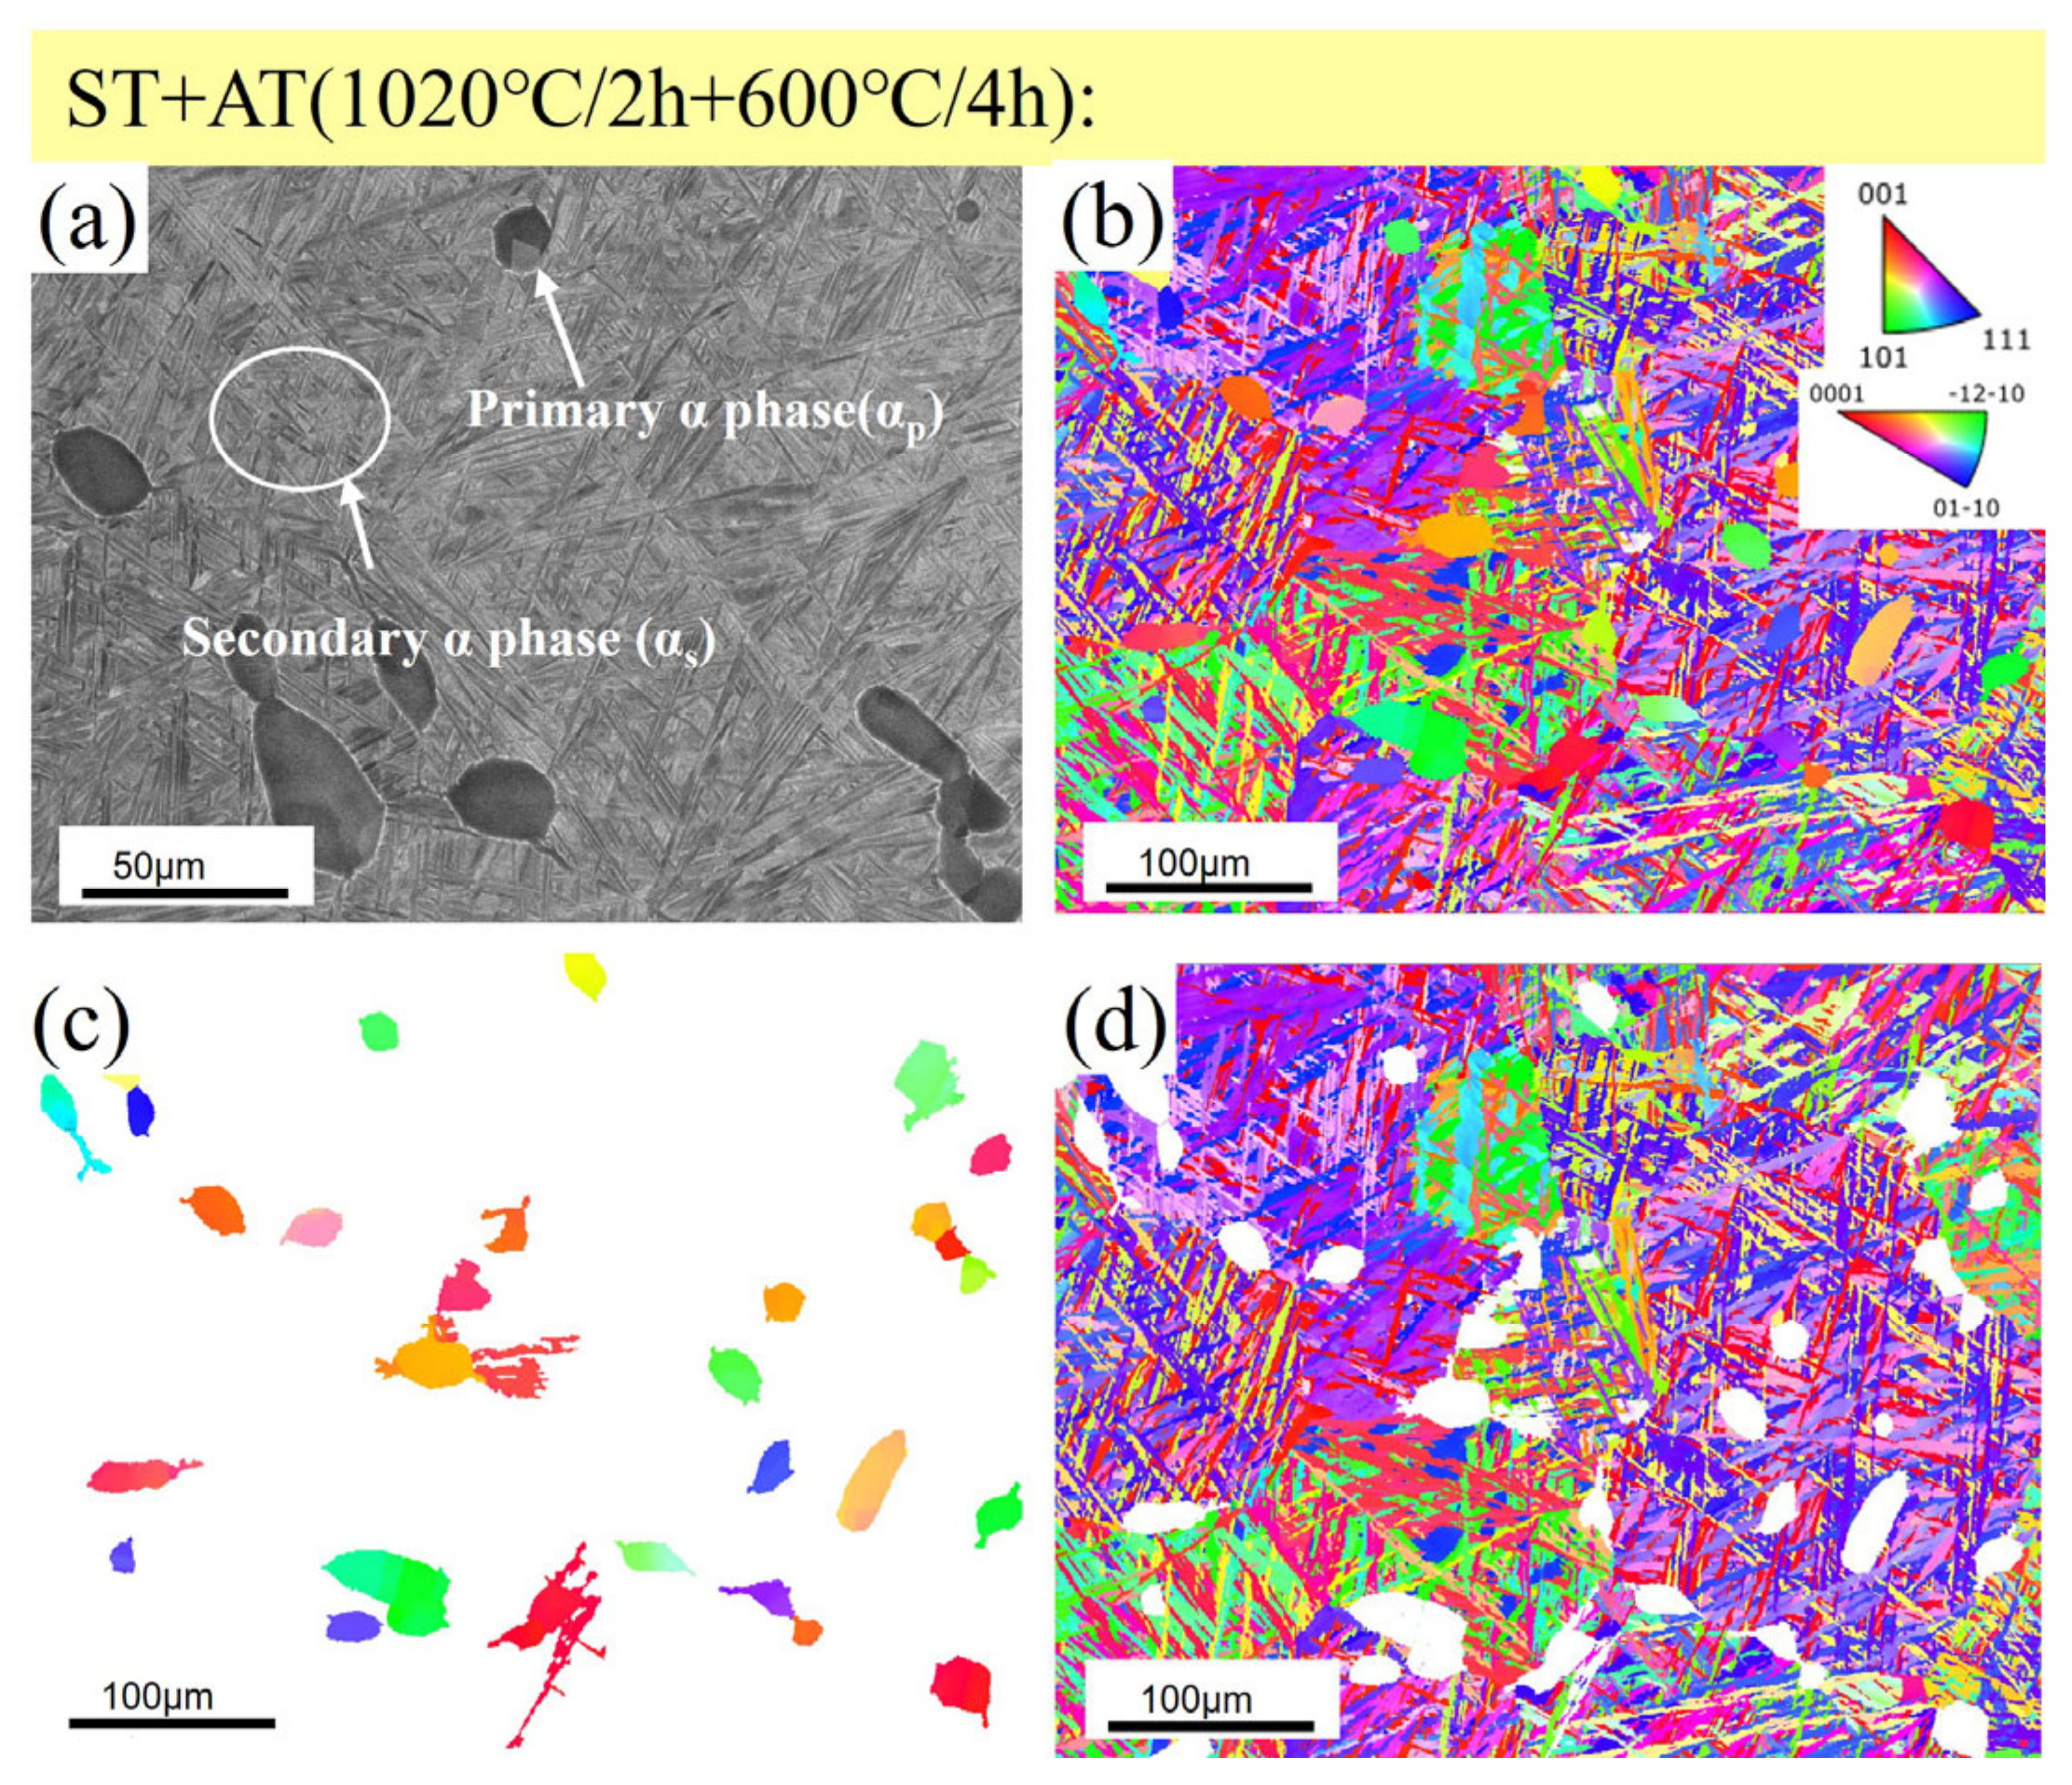
Figure 3 and Figure 4 depict the microstructure formed after ST and ST + AT heat treatments, respectively, both exhibiting typical bimodal microstructures characterized by equiaxed αp and basket-shaped αs phases. The BSE results of the microstructure after heat treatments are shown in Figure 3a and Figure 4a. Quantitative analysis using specialized software revealed that the volume fraction of αp phase decreased to approximately 9.2% compared to the initial microstructure. Additionally, the grain size reduced to about 15 μm, and the width of the lamellar α phase decreased from 4.8 μm to approximately 1 μm. The results indicate that the aging treatment has no significant effect on the morphology of the microstructure, grain size, and effect of solid-solution treatment temperature on the αp-phase content or size, and the lamellar α-phase width in the microstructure is more obvious.
The BSE results revealed a non-uniform color distribution in the microstructure following heat treatments. This inconsistency stemmed from the relatively small size of the samples used for microstructure characterization and the rapid cooling rate induced by the solid-solution method followed by air cooling. As the temperature drops swiftly, the diffusion rate of the elements diminishes rapidly. Consequently, the distribution of inclusions (particularly α-phase stable element Al and β-phase stable elements such as Mo, Nb, W, and Si) fails to reach thermodynamic equilibrium at room temperature. As a result, there is an irregular distribution of inclusions, leading to the observed non-uniform color distribution in the BSE diagram results [19,20]. The IPF results of different microstructures after heat treatment reveal significant orientation changes compared to the initial microstructure (depicted in Figure 3b and Figure 4b). This phenomenon can be attributed to several factors. First is the temperature of 1020 °C near the Tβ heat treatment temperature during the solid-solution process. As a result, the content of the αp phase decreases, and nucleation of the αp phase occurs at the boundaries of β-phase grains during the cooling stage. Subsequently, the lamellar α phase undergoes growth and penetrates into the β grains, causing a transformation in the morphology of the lamellar α phase from lath-like to needle-like. This observation underscores the influence of heat treatment on modifying both the morphology of the microstructure and its crystallographic orientation at the same time.
Furthermore, the αp grains undergo grain boundary segregation in both ST and ST + AT treatments, with the effect being more pronounced in the latter. This phenomenon can be attributed to the connection of thermo-etched grooves in αp with those in other regions during the heating and holding process, leading to the division of the initial large equiaxed αp grains into two smaller grains. This observation aligns with thermodynamic law and is evident in the inverse pole figures (IPFs) [21]. To obtain deeper insights into the crystallographic orientation of the grains, a more comprehensive EBSD analysis was conducted. By integrating the morphological information obtained from the EBSD-scanned region, the αp and αs phases were clearly separated in the IPF maps of the EBSD. Detailed illustrations of these findings are presented in Figure 3c,d and Figure 4c,d. It is interesting to note that the orientation of αp remains relatively random after heat treatment, whereas the distribution of the αs orientation shows a preferential orientation after aging treatment. Figure 4d illustrates that the orientation of αs in the microstructure after heat treatment exhibits a bias towards {0 1 −1 0}, contrasting with the more randomly distributed αs orientation observed after ST (Figure 3d).
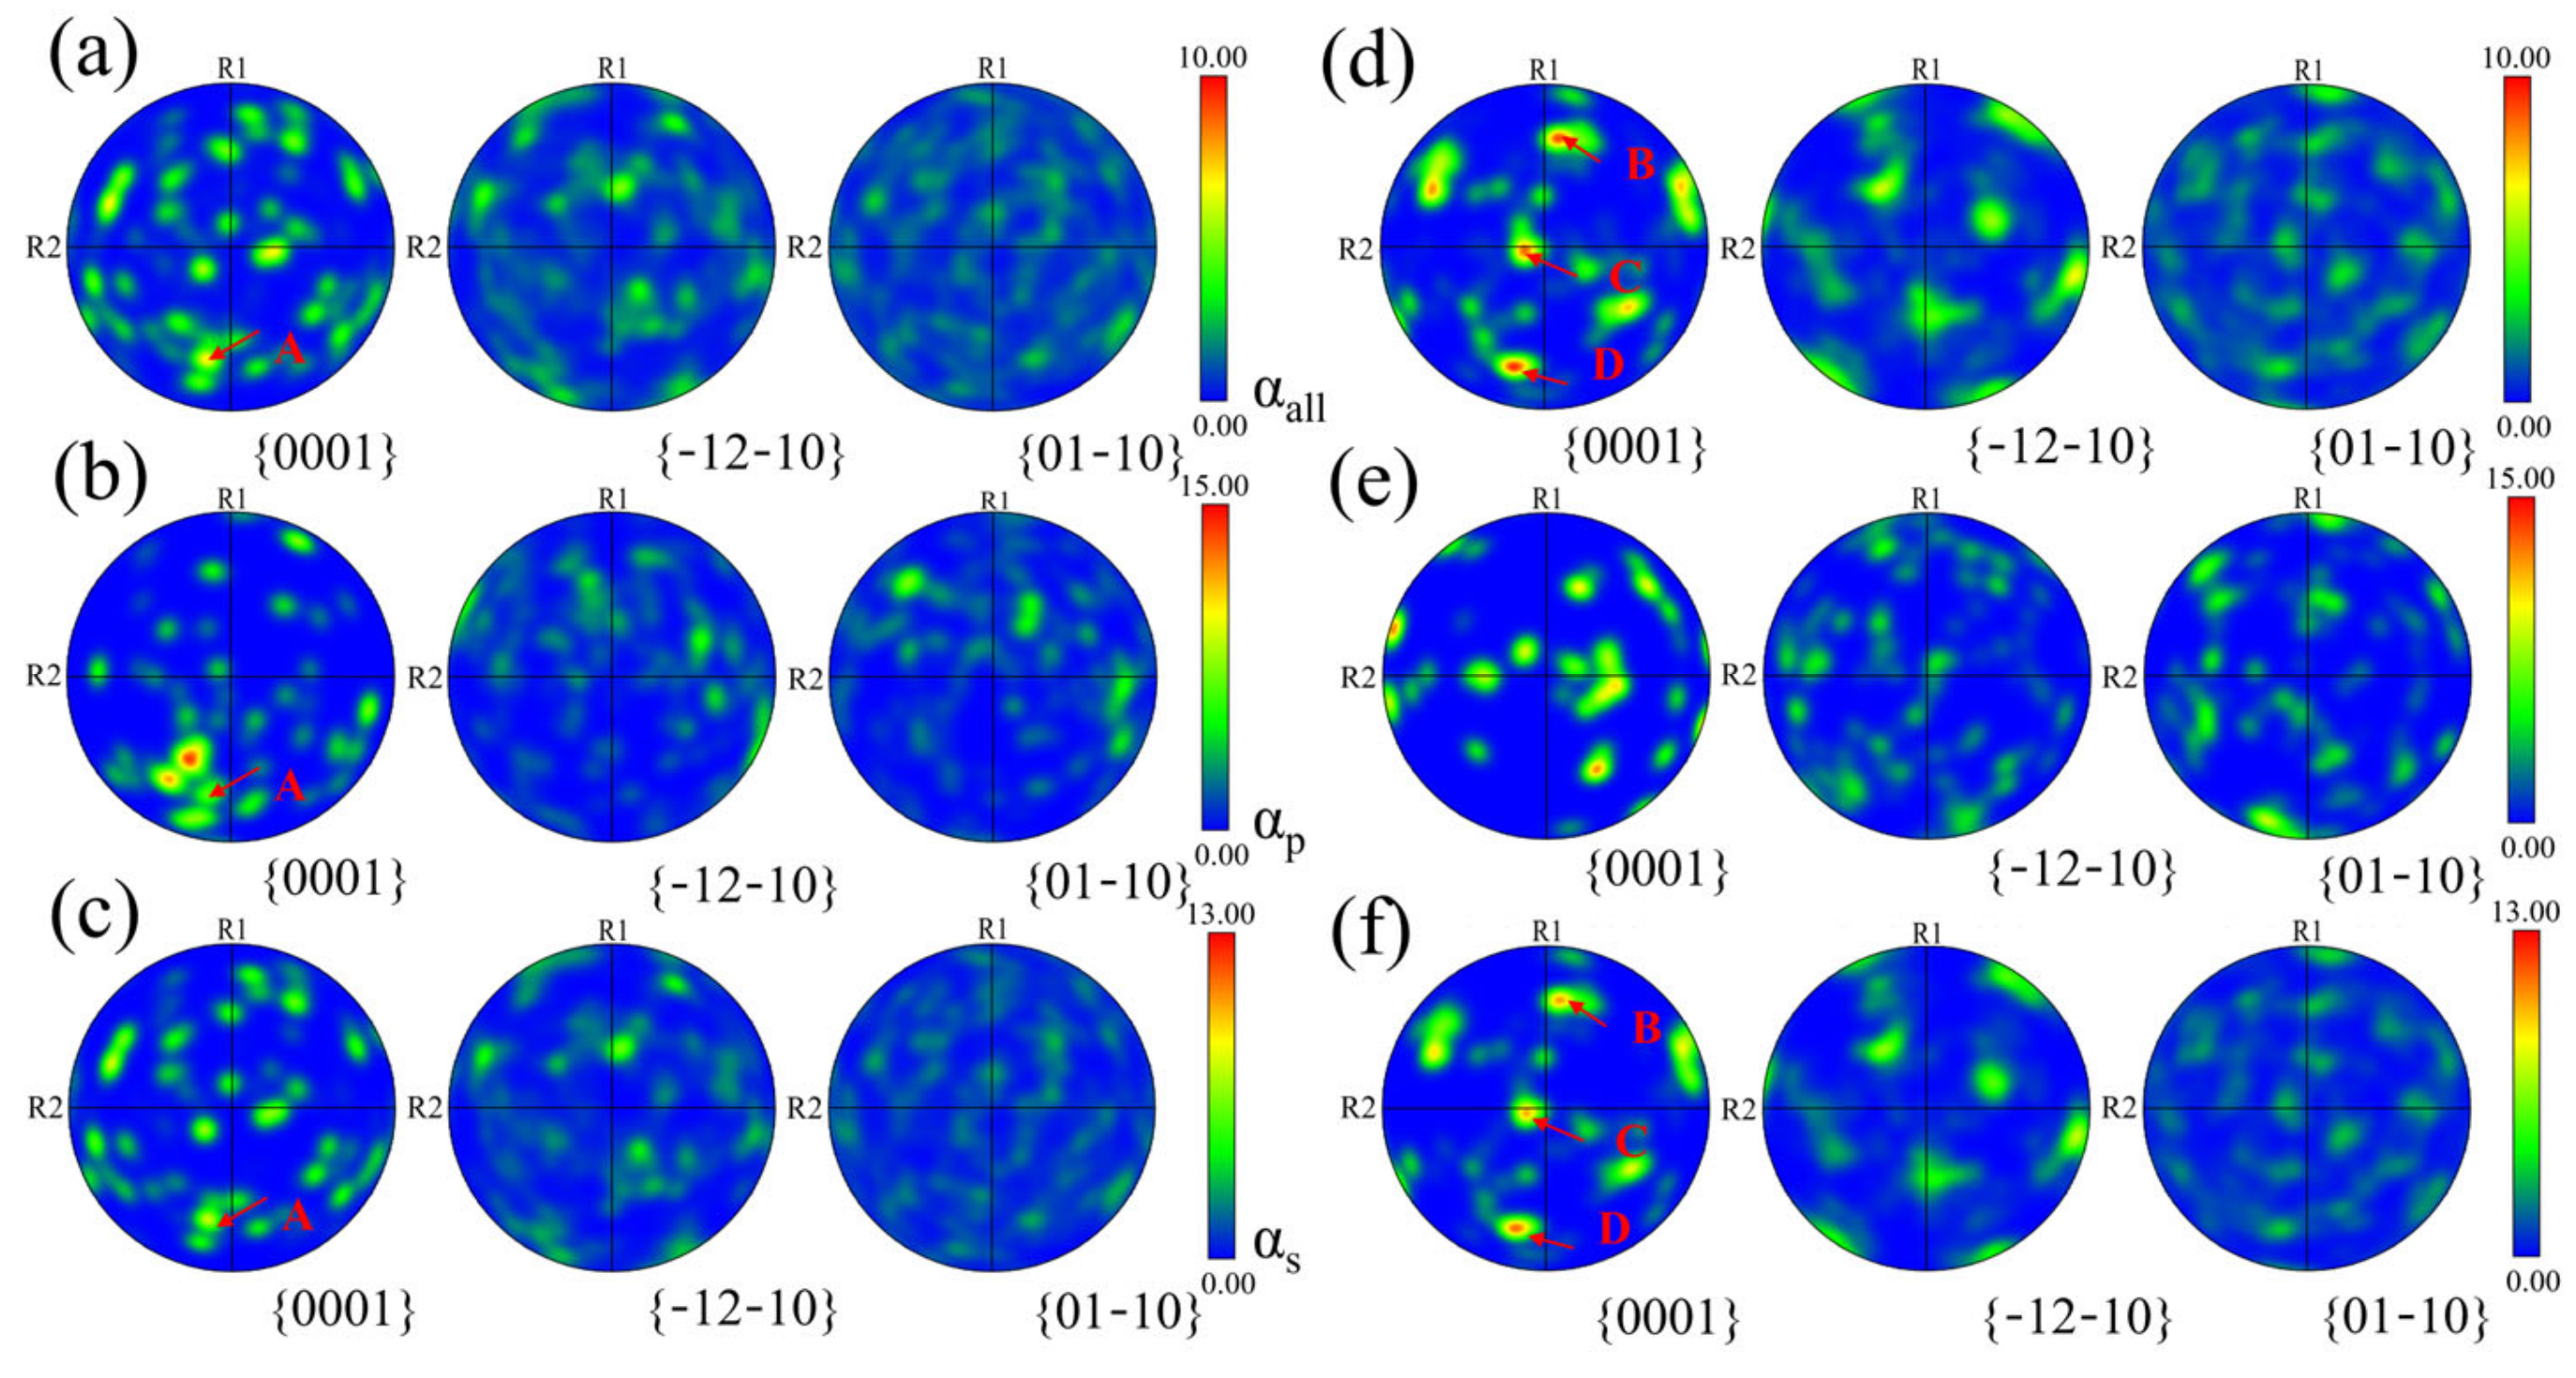
To provide a visual representation of the preferred orientation behavior more intuitively, the textures of αp and αs are depicted using {0 0 0 1}, {−1 2 −1 0}, and {0 1 −1 0} pole figures. The texture of the αp and αs phases after ST treatment of the samples are represented in Figure 5b,c, respectively, while the textures of the αp phase and αs phases after ST + AT treatment of the samples are represented in Figure 5e,f, respectively. Notably, Figure 5c,f reveal a distinct texture composition characterized by a dominant component with higher intensity compared to the overall texture of the α phase depicted in Figure 5a,d. This phenomenon may be due to the absence of αp phases with other orientations. Furthermore, the orientation relationships between αp phase and αs phases in the samples after the two different heat treatments exhibit some differences. For the ST-treated samples, the difference between the αp and αs texture fractions in the {0 0 0 1} polar plots are significant, and this finding is replicated in the samples treated with ST + AT.
As indicated by the red arrow in Figure 5, the maximum intensity in the {0 0 0 1} plane of αs phase after ST + AT (Figure 5f) is approximately six times higher than that of the ST sample (Figure 5c). This observation suggests that aging treatment significantly impacts the orientation change in the αs phase. A comparison between Figure 5b,c reveals that the αp texture component located at point A (marked by the red arrow) overlaps with the αs texture component. In contrast, this phenomenon is absent in the results following aging treatment, as depicted in Figure 5e,f. This occurrence is likely attributed to the influence of variant selection. During air cooling, a diffuse phase transition occurs, inducing specific orientations and transformations via variant selection [9]. This phenomenon will be further elaborated upon in the following discussion.
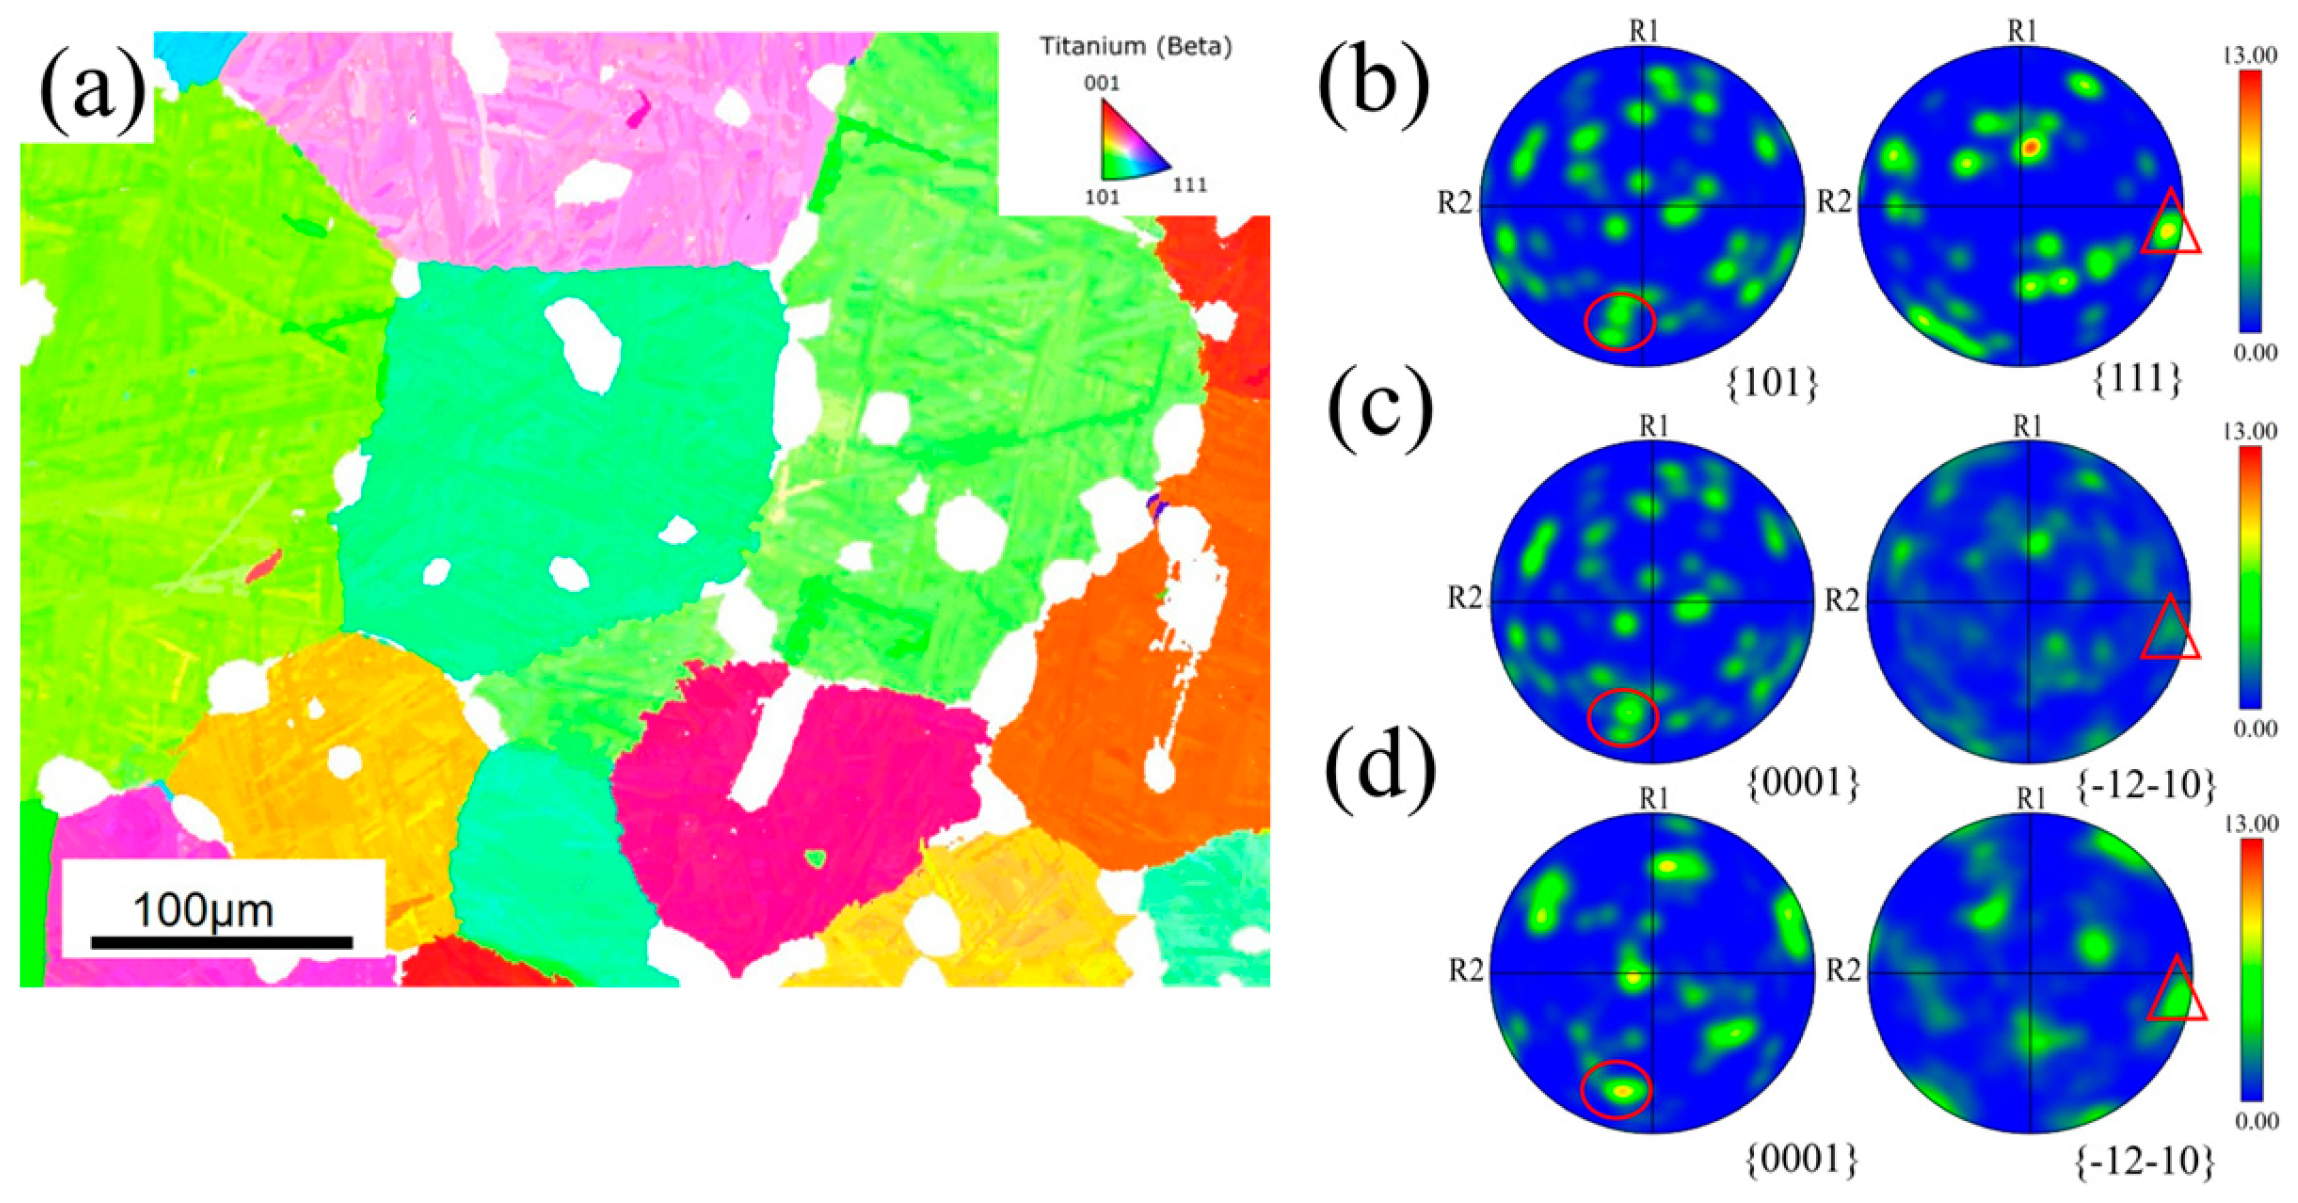
To further illustrate the texture evolution, the reconstruction of the prior β phase was conducted utilizing the αs phase obtained after solid-solution treatment at 1020 °C, and the results are shown in Figure 6. It is noteworthy that the prior β phase significantly influences the texture evolution of the αs phase. In general, the orientation of the αs phase in titanium alloys is considered to be a direct result of the selection of previous β grains and variant selection [22]. As depicted in Figure 6a, the reconstruction of the prior β grain for the αs phase following the 1020 °C solution treatment reveals that the prior β-phase grains tend to be larger compared to the α-phase grains. The PF results (Figure 6b–d) marked with red circles and triangles also show that there is a significant texture overlap between the solid solution treatment and the subsequent solid solution aging treatment where the texture intensity is high, in accordance with the BOR. The enhanced texture intensity of the αs phase following the addition of the aging treatment compared to its intensity after the solid-solution treatment alone is thought to be caused by the variant selection phenomenon [23].

3.2. Effect of Aging Treatment on αs Phase Orientation

Theoretically, titanium alloy can form 12 kinds of variants in the process of β → α-phase transformation (Table 2). However, in practical applications, due to the existence of many factors such as cooling rate and heat treatment temperatures, several kinds of variants display preferred precipitation during the process of phase transformation, which is the so-called phenomenon of variant selection [24]. The α phase can exist in a coherent or semi-coherent state [25]. Specifically oriented lamellar α-phase coarsening has been observed at grain boundaries after following aging treatment. This phenomenon is probably due to the lower nucleation energy of the α phase compared to other phases during the holding process, thereby facilitating its easier nucleation and subsequent coarsening. Previous studies have shown that the α phase is generally semi-coherent, and coherent α phases can only be observed in rare cases. This phenomenon is primarily caused by the growth of the α phase after the aging treatment and variant dissolution.
The phase transition process experienced during the ST + AT treatment involves the formation of strain energy, which plays a crucial role in these transitions. Strain energy arises from the lattice mismatch and differences in crystal structure between the β and α phases. Specifically, the α and β phases in titanium alloys possess distinct crystal structures, leading to a lack of perfect alignment in lattice parameters and atomic arrangements, resulting in crystallographic mismatch. Consequently, strain energy is generated during the phase transformation process. Additionally, the volume of the α and β phases is not equal during the transition, leading to internal stress and strain within the material and the further accumulation of strain energy. In essence, lattice distortions occur in both phases during the phase transition, ultimately contributing to the phenomenon of variant selection [26]. Previous studies [27,28] have developed a quantitative 3D model to calculate a stress-free transformation strain (SFTS) of each of the 12 α variants in both the coherent and semi-coherent state. The phenomenon of variant selection arises from elastic interactions among variants, aiming to achieve optimal self-accommodation. In the absence of variant selection, the five variant ratios are 10° <0 0 0 1>, 60° <1 1 −2 0>, 60.83° <−1.377 −1 2.377 0.359>, 63.26° <−10 5 5 3>, and 90° <1 −2.38 1.38 0>, and their random frequencies are 9.1%, 18.2%, 36.4%, 18.2%, and 18.2% [29]. Generally, the frequency distribution of different variants is closely correlated with the distribution of the misorientation angle. Analysis of the misorientation angle of αs (Figure 7a,b) reveals that, after heat treatment, the peak typically occurs at 60–63° ± 1.5°, deviating from the aforementioned proportions for the selection of the five variants. Dissolution of the variants occurs at around 60° and 90° after aging treatment, as depicted in Figure 7c,d. To ensure the reliability of the experimental results, multiple regions were selected for observation when the samples were characterized by EBSD. From the software analysis results, it can be concluded that the variations around the 60° and 90° variants exhibit a similar trend. The enhanced variant selection phenomenon induces a bias of αs towards {0 1 −1 0}, strengthening the preferred {0 1 −1 0} orientation in the αs texture [11].
Table 2. Twelve possible α variants generated during β- to α-phase transformation through the BOR [29].
VariantPlaneDirectionRotation Angle/Axis from V1
V1(1–10) (0001)[111] [11–20]-
V2(10–1) (0001)[111] [11–20]60°/[11–20]
V3(01–1) (0001)[111] [11–20]60°/[11–20]
V4(110) (0001)[−111] [11–20]90°/[1 −2.38 1.38 0]
V5(101) (0001)[−111] [11–20]63.26°/[−10 5 5 3]
V6(01–1) (0001)[−111] [11–20]60.83°/[−1.377 −1 2.377 0.359]
V7(110) (0001)[1–11] [11–20]90°/[1 −2.38 1.38 0]
V8(10–1) (0001)[1–11] [11–20]60.83°/[−1.377 −1 2.377 0.359]
V9(011) (0001)[1–11] [11–20]63.26°/[−10 5 5 3]
V10(1–10) (0001)[11–1] [11–20]10°/[0 0 0 1]
V11(101) (0001)[11–1] [11–20]60.83°/[−1.377 −1 2.377 0.359]
V12(011) (0001)[11–1] [11–20]60.83°/[−1.377 −1 2.377 0.359]
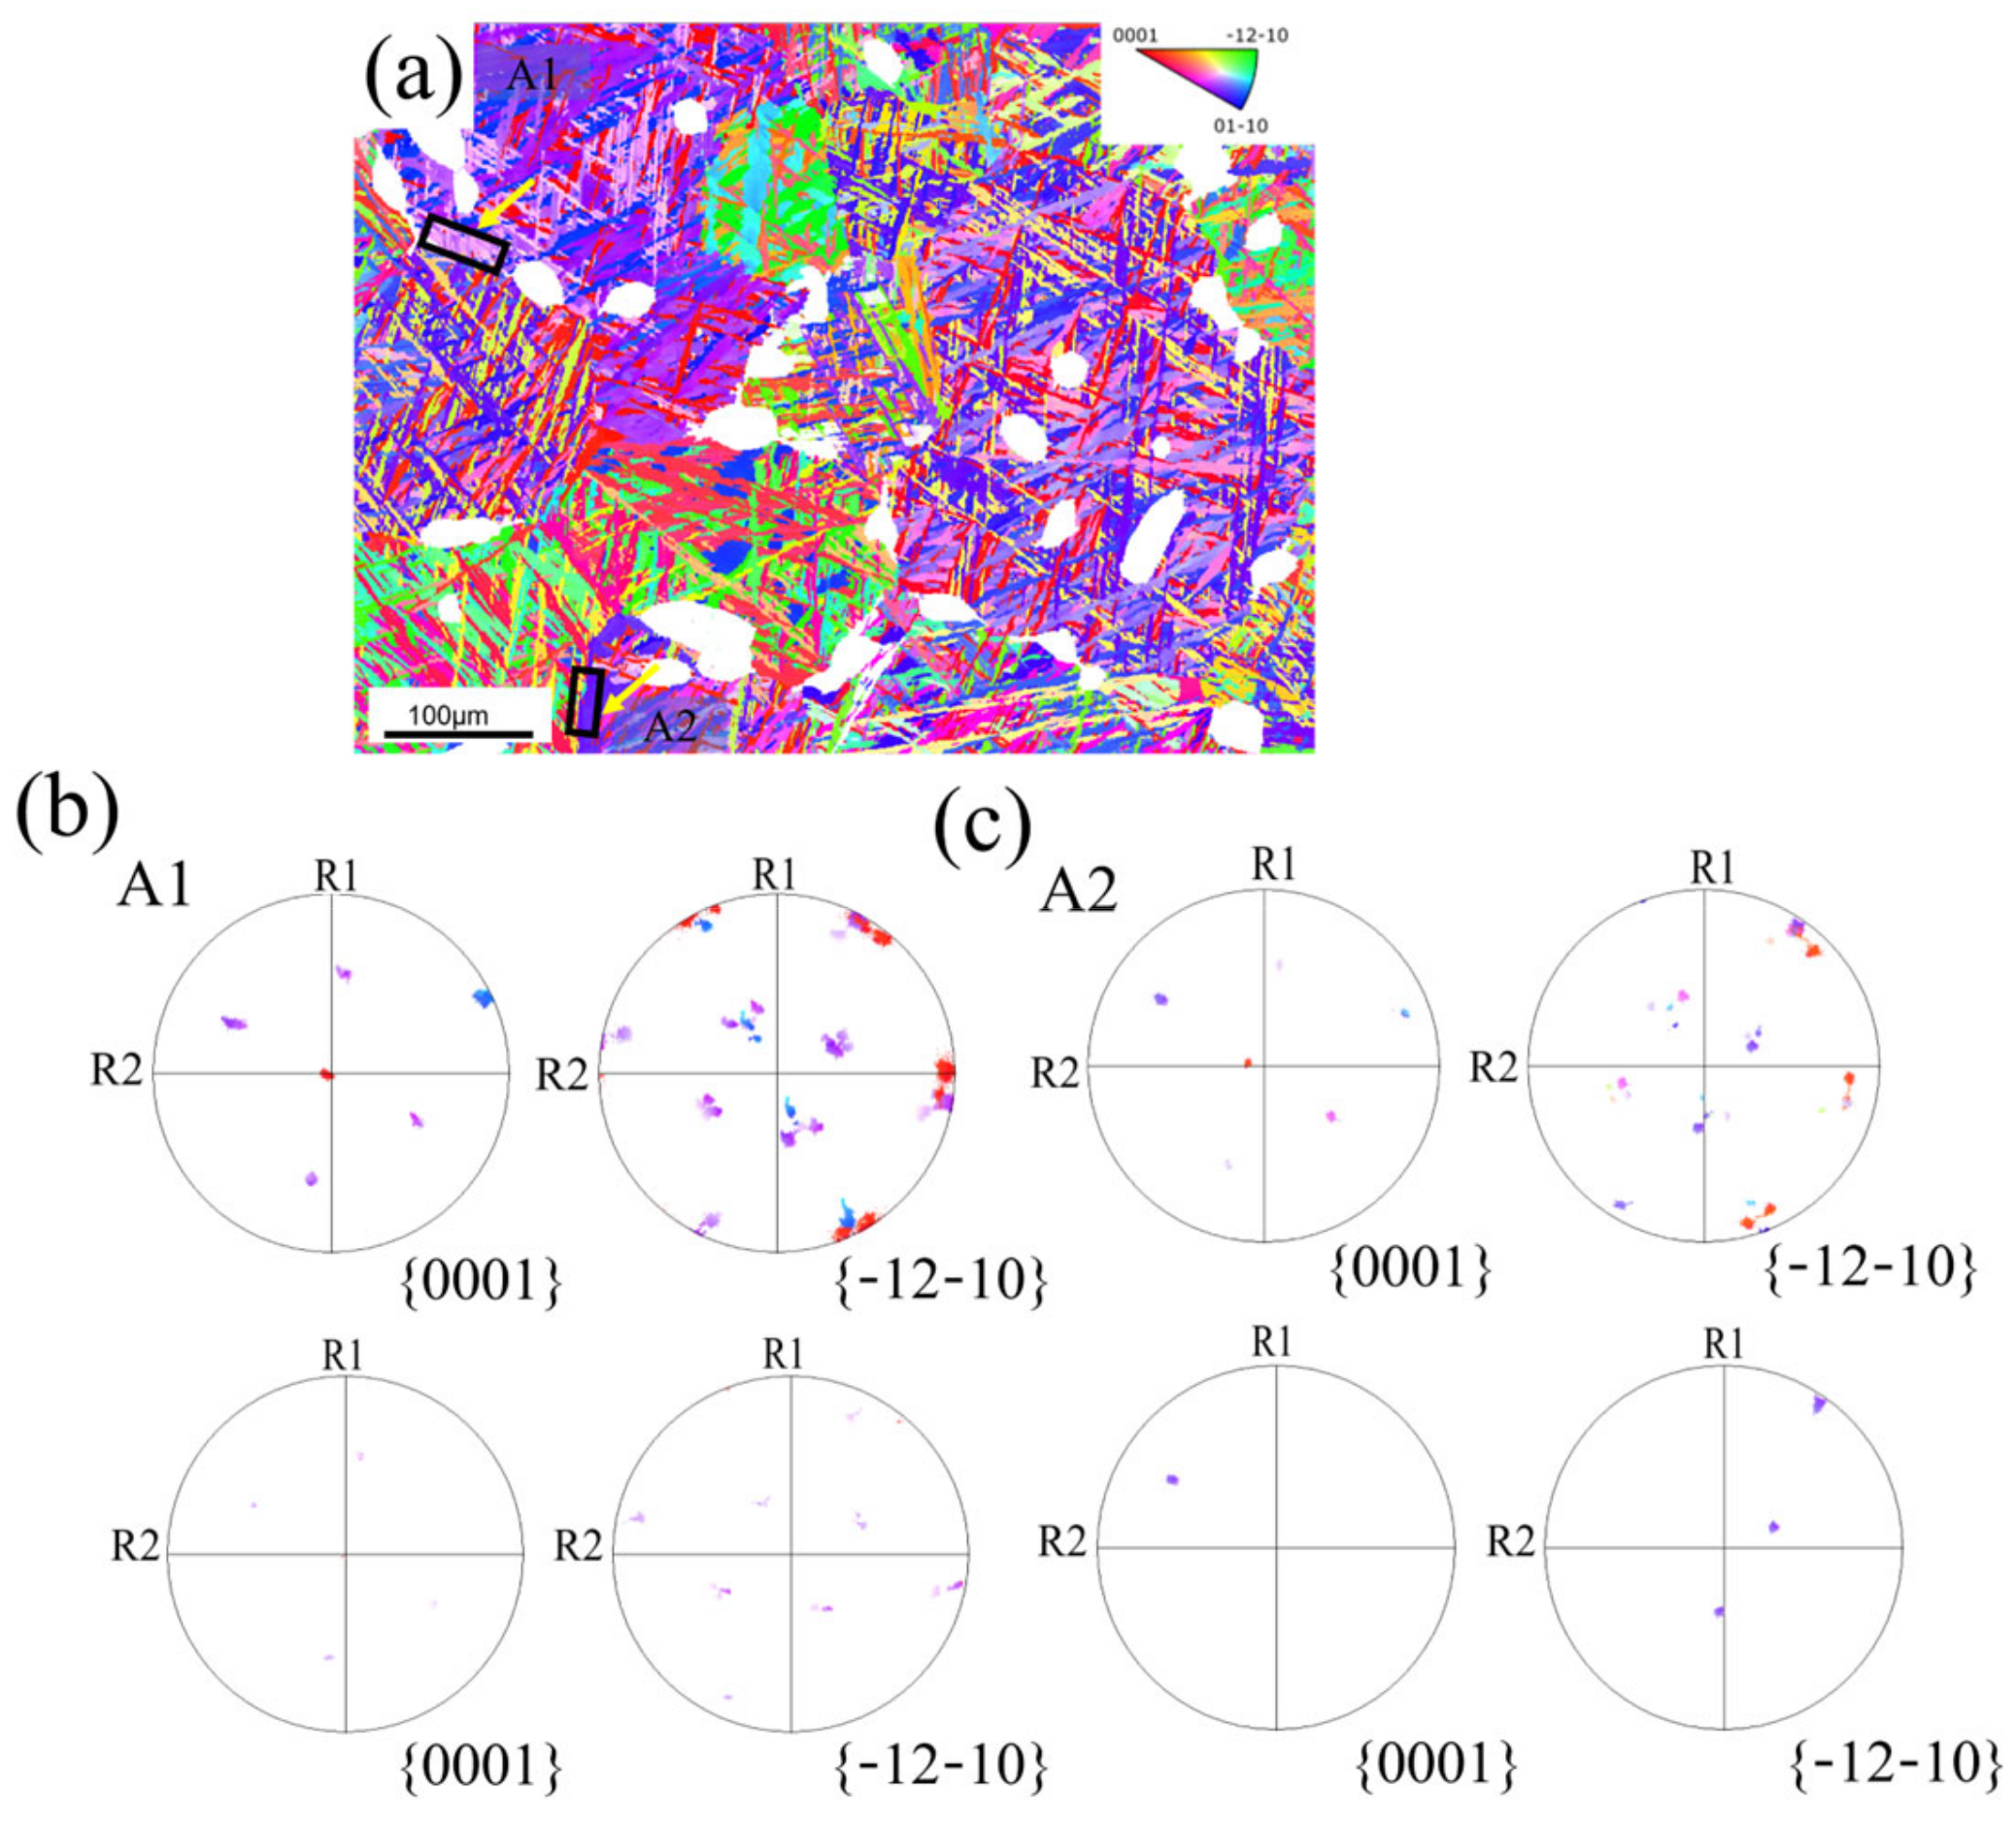
During the phase transition, the difference in the lattice parameters between the two phases results in the accumulation of strain energy, while the formation of interfacial energy is caused by the appearance of the interface between the two phases. Therefore, the preferential nucleation of αs at grain boundaries reduces both the interfacial and strain energies [30], thereby facilitating the selection of specific α variants with preferential nucleation at the grain boundaries. After aging treatment, the α boundaries have lath-shaped nuclei exhibiting a similar orientation bias toward {0 1 −1 0}, as indicated by the black frame in Figure 8a, contributing to the formation of a specific αs texture. The lamellar α phase oriented in the {0 1 −1 0} direction is evident in these two regions, while the lamellar α phase of this orientation is coarsened at the boundary, which can be further concluded using the polar diagrams. Pole figures representing the orientation at the α boundaries in A1/A2 are depicted in Figure 8b,c, illustrating a clear preference for {0 1 −1 0} orientation in both A1 and A2 regions. This tendency may arise from the limited nucleation of new variants during the aging treatment, coupled with the coalescence of grain boundaries into broad α-phase laths over an extended holding time [8,31]. Consequently, these behaviors contribute to the enhanced intensity of the {0 1 −1 0} texture.

4. Conclusions

This study of the microstructure and orientation changes in Ti60 alloy after different heat treatments led to the following conclusions:
(1)
Heat treatment serves as a pivotal tool for microstructure regulation. As the solid-solution temperature rises, the primary α−phase content, size, and lamellar α-phase width progressively diminish. Although there was no significant change in the microstructure after aging treatment and solid-solution treatment, the analysis of their orientation relationship using EBSD revealed that the organization appeared to have a selective orientation of {0 1 −1 0} after solid-solution treatment at 1020 °C for 2 h follow by air cooling at 600 °C for 4 h.
(2)
During the aging process of the forged Ti60 alloy, the dissolution of variants near 60° and 90° enhanced the phenomenon of variant selection, resulting in a notable bias in the αs orientation towards {0 1 −1 0}. Additionally, the {0 1 −1 0}-oriented laths identified at the α boundaries demonstrated nucleation, intergrowth, and aggregation into α-laths during aging treatment, thereby augmenting the intensity of the distinctive texture.
The objective of this study was to enhance our comprehension of the impact of solid-solution aging treatment on the evolution of αs crystallographic orientation in Ti60 alloy to advance the precise regulation of the microstructure of near-α titanium alloys. The observation that the α-phase coarsening of lamellae with a specific orientation {0 1 −1 0} orientation after aging treatment may occur in other types of titanium alloys such as β titanium, α titanium, and α+β titanium need to be verified in future experimental studies. Additionally, future research endeavors should concentrate on exploring the influence of Ti60 alloy orientation on its performance. Through conducting in-depth investigations, we can establish a theoretical foundation for practical production applications, facilitating a comprehensive analysis of the relationship between microstructure and performance.

Author Contributions

Conceptualization, X.L., C.L. and H.W. (Hao Wu); investigation, B.L. and H.W. (Hao Wu); methodology, X.L. and C.L.; writing—original draft preparation, B.L.; writing—review and editing, C.L., X.L. and R.L.; resources, K.M., H.W. (He Wu) and R.L.; data curation, H.W. (He Wu), K.M. and B.L.; project administration, R.L., H.W. (He Wu) and K.M.; supervision C.L. and H.W. (Hao Wu). All authors have read and agreed to the published version of the manuscript.

Funding

This research was supported by the National Key R&D Program of China (No. 2022YFB3705500), and the National Natural Science Foundation of China (No. 52271104).

Data Availability Statement

The data presented in this study are available on request from the corresponding author. The data are not publicly available due to privacy.

Conflicts of Interest

The authors declare no conflicts of interest.

References

  1. Zhao, Z.B.; Liu, Z.; Wang, Q.J.; Liu, J.R.; Yang, R. Analysis of local crystallographic orientation in an annealed Ti60 billet. J. Mater. Sci. Technol. 2019, 35, 591–595. [Google Scholar] [CrossRef]
  2. Glavicic, M.; Bartha, B.; Jha, S.; Szczepanski, C. The origins of microtexture in duplex Ti alloys. Mater. Sci. Eng. A 2009, 513, 325–328. [Google Scholar] [CrossRef]
  3. Gey, N.; Bocher, P.; Uta, E.; Germain, L.; Humbert, M. Texture and microtexture variations in a near-α titanium forged disk of bimodal microstructure. Acta Mater. 2012, 60, 2647–2655. [Google Scholar] [CrossRef]
  4. Germain, L.; Gey, N.; Humbert, M.; Vo, P.; Jahazi, M.; Bocher, P. Texture heterogeneities induced by subtransus processing of near α titanium alloys. Acta Mater. 2008, 56, 4298–4308. [Google Scholar] [CrossRef]
  5. Chuan, W.; He, Y.; Wei, L.H. Modeling of discontinuous dynamic recrystallization of a near-α titanium alloy IMI834 during isothermal hot compression by combining a cellular automaton model with a crystal plasticity finite element method. Comp. Mater. Sci. 2013, 79, 944–959. [Google Scholar] [CrossRef]
  6. Wang, C.C.; Li, B.L.; Qiao, X.; Wang, T.B.; Qi, P.; Nie, Z.-R. In Effect of primary α phase content on creep property of high temperature titanium alloy. Mater. Sci. Forum 2020, 993, 217–222. [Google Scholar] [CrossRef]
  7. Zhao, Z.B.; Wang, Q.J.; Liu, J.R.; Yang, R. Effect of heat treatment on the crystallographic orientation evolution in a near-α titanium alloy Ti60. Acta Mater. 2017, 131, 305–314. [Google Scholar] [CrossRef]
  8. Balachandran, S.; Kashiwar, A.; Choudhury, A.; Banerjee, D.; Shi, R.; Wang, Y. On variant distribution and coarsening behavior of the α phase in a metastable β titanium alloy. Acta Mater. 2016, 106, 374–387. [Google Scholar] [CrossRef]
  9. Beladi, H.; Chao, Q.; Rohrer, G.S. Variant selection and intervariant crystallographic planes distribution in martensite in a Ti-6Al-4V alloy. Acta Mater. 2014, 80, 478–489. [Google Scholar] [CrossRef]
  10. Shi, R.; Dixit, V.; Fraser, H.L.; Wang, Y. Variant selection of grain boundary α by special prior β grain boundaries in titanium alloys. Acta Mater. 2014, 75, 156–166. [Google Scholar] [CrossRef]
  11. Wang, Y.; Sun, Z.; Yin, Z.; Yin, L.; Huang, L. Formation and characteristics of bilamellar microstructure in Ti6242S titanium alloy under dual heat treatment. Mater. Charact. 2022, 187, 111835. [Google Scholar] [CrossRef]
  12. Zhang, Y.; Xin, R.; Wang, K.; Liu, Q. Variant selection of α precipitates formed at β triple junctions in titanium alloy. Mater. Charact. 2022, 189, 111975. [Google Scholar] [CrossRef]
  13. Sun, Z.; Wu, H.; Ma, X.; Mao, X.; Yang, H. Dependence of microstructure on solution and aging treatment for near-β forged TA15 Ti-alloy. J. Mater. Eng. Perform. 2016, 25, 4549–4560. [Google Scholar] [CrossRef]
  14. Wu, C.; Zhan, M. Microstructural evolution, mechanical properties and fracture toughness of near β titanium alloy during different solution plus aging heat treatments. J. Alloys Compd. 2019, 805, 1144–1160. [Google Scholar] [CrossRef]
  15. Xiang, W.; Yuan, W.; Deng, H.; Luo, H.; Chen, L.; Yin, W. Effect of Aging Temperature on the Microstructure and Mechanical Properties of a Novel β Titanium Alloy. Materials 2023, 16, 7393. [Google Scholar] [CrossRef] [PubMed]
  16. Jia, M.; Alshammari, Y.; Yang, F.; Bolzoni, L. Effect of heat treatment on the microstructure and mechanical properties of blended elemental Ti–6Al–4V produced by powder forging. Mater. Sci. Eng. A 2020, 791, 139724. [Google Scholar] [CrossRef]
  17. Jia, W.; Zeng, W.; Yu, H. Effect of aging on the tensile properties and microstructures of a near-alpha titanium alloy. Mater. Des. 2014, 58, 108–115. [Google Scholar] [CrossRef]
  18. Lei, L.; Zhao, Q.; Wu, C.; Zhao, Y.; Huang, S.; Jia, W.; Zeng, W. Variant selection, coarsening behavior of α phase and associated tensile properties in an α+β titanium alloy. J. Mater. Sci. Technol. 2022, 99, 101–113. [Google Scholar] [CrossRef]
  19. Huang, S.; Zhao, Q.; Wu, C.; Lin, C.; Zhao, Y.; Jia, W.; Mao, C. Effects of β-stabilizer elements on microstructure formation and mechanical properties of titanium alloys. J. Alloys Compd. 2021, 876, 160085. [Google Scholar] [CrossRef]
  20. Yue, K.; Liu, J.; Zhang, H.; Yu, H.; Song, Y.; Hu, Q.; Wang, Q.; Yang, R. Precipitates and alloying elements distribution in near α titanium alloy Ti65. J. Mater. Sci. Technol. 2020, 36, 91–96. [Google Scholar] [CrossRef]
  21. Gao, X.; Zeng, W.; Wang, Y.; Long, Y.; Zhang, S.; Wang, Q. Evolution of equiaxed alpha phase during heat treatment in a near alpha titanium alloy. J. Alloys Compd. 2017, 725, 536–543. [Google Scholar] [CrossRef]
  22. Stanford, N.; Bate, P. Crystallographic variant selection in Ti-6Al-4V. Acta Mater. 2004, 52, 5215–5224. [Google Scholar] [CrossRef]
  23. Lu, S.; Todaro, C.; Sun, Y.; Song, T.; Brandt, M.; Qian, M. Variant selection in additively manufactured alpha-beta titanium alloys. J. Mater. Sci. Technol. 2022, 113, 14–21. [Google Scholar] [CrossRef]
  24. Gao, P.; Fu, M.; Zhan, M.; Lei, Z.; Li, Y. Deformation behavior and microstructure evolution of titanium alloys with lamellar microstructure in hot working process: A review. J. Mater. Sci. Technol. 2020, 39, 56–73. [Google Scholar] [CrossRef]
  25. Banerjee, D.; Williams, J.C. Perspectives on titanium science and technology. Acta Mater. 2013, 61, 844–879. [Google Scholar] [CrossRef]
  26. Li, Z.; Li, J.; Zhu, Y.; Tian, X.; Wang, H. Variant selection in laser melting deposited α+ β titanium alloy. J. Alloys Compd. 2016, 661, 126–135. [Google Scholar] [CrossRef]
  27. Shi, R.; Ma, N.; Wang, Y. Predicting equilibrium shape of precipitates as function of coherency state. Acta Mater. 2012, 60, 4172–4184. [Google Scholar] [CrossRef]
  28. Shi, R.; Wang, Y. Variant selection during α precipitation in Ti-6Al-4V under the influence of local stress—A simulation study. Acta Mater. 2013, 61, 6006–6024. [Google Scholar] [CrossRef]
  29. Wang, S.; Aindow, M.; Starink, M. Effect of self-accommodation on α/α boundary populations in pure titanium. Acta Mater. 2003, 51, 2485–2503. [Google Scholar] [CrossRef]
  30. Furuhara, T.; Kawata, H.; Morito, S.; Maki, T. Crystallography of upper bainite in Fe-Ni-C alloys. Mater. Sci. Eng. A 2006, 431, 228–236. [Google Scholar] [CrossRef]
  31. Davis, A.E.; Donoghue, J.; Kennedy, J.R.; Byres, N.; Prangnell, P.B. In-situ observation of single variant α colony formation in Ti-6Al-4V. Acta Mater. 2021, 220, 117315. [Google Scholar] [CrossRef]
Figure 1. As-received Ti60 alloy microstructure: (a) BSE image; (b) IPF image; (c) grain size figure; (d) PF image of α phase.
Metals 14 00602 g001
Figure 2. (a) Differential scanning calorimetry result for Ti60 alloy; (b) Ti60 heat treatment schedules.
Metals 14 00602 g002
Figure 3. BSE and IPF maps: (a) BSE maps after ST; (b) IPF maps after ST; (c) orientation of the αp grains in (b); (d) orientation of the αs grains in (b).
Metals 14 00602 g003
Figure 4. BSE and IPF maps: (a) BSE maps after ST + AT; (b) IPF maps after ST + AT; (c) orientation of the αp grains in (b); (d) orientation of the αs grains in (b).
Metals 14 00602 g004
Figure 5. Pole figures with (ac) and (df) corresponding to (bd) of Figure 3 and Figure 4, respectively.
Metals 14 00602 g005
Figure 6. IPF and PF plots for Ti60 after solid solution treatment at 1020 °C: (a,b) IPF and PF maps of reconstructed prior β texture after 1020 °C; (c,d) PF map of αs after ST and ST + AT, respectively.
Metals 14 00602 g006
Figure 7. Misorientation angle distribution of αs: (a) ST; (b) ST + AT; (c) distribution of variants around 60° in ST and ST + AT; (d) distribution of variants around 90° in ST and ST + AT.
Metals 14 00602 g007
Figure 8. Microstructure results after aging treatment: (a) IPF maps of αs after ST and AT; (b) PF maps of A1 and frame area in A1; (c) PF maps of A2 and frame area in A2.
Metals 14 00602 g008
Table 1. Ti60 alloy chemical composition (wt%).
AlSnZrMoSTaNbFeHOTi
5.63.83.20.50.3510.40.0320.0010.09bal
Disclaimer/Publisher’s Note: The statements, opinions and data contained in all publications are solely those of the individual author(s) and contributor(s) and not of MDPI and/or the editor(s). MDPI and/or the editor(s) disclaim responsibility for any injury to people or property resulting from any ideas, methods, instructions or products referred to in the content.