Article

Cracking Behavior of the ZhS6K Superalloy during Direct Laser Deposition with Induction Heating

1
World-Class Research Center, Advanced Digital Technologies, State Marine Technical University, 190121 Saint Petersburg, Russia
2
Laboratory of Bulk Nanostructured Materials, Belgorod State University, 308015 Belgorod, Russia
*
Author to whom correspondence should be addressed.
Metals 2024, 14(6), 610; https://doi.org/10.3390/met14060610
Submission received: 6 April 2024 / Revised: 19 May 2024 / Accepted: 20 May 2024 / Published: 22 May 2024

Abstract

:
For this work, the behavior of the ZhS6K alloy (Russian grade) in the process of direct laser deposition was investigated. Two samples, a “small” one (40 × 10 × 10 mm3) and “large” one (80 × 16 × 16 mm3), were fabricated with direct laser deposition. In both samples, the typical dual-phase γ/γ’ microstructure with cuboidal shape of the γ’ precipitates was observed. Both specimens revealed a similar tendency to continuous increasing in hardness from the bottom to the top associated with the refinement of γ’ precipitates. The “small” sample was essentially crack-free, while the “large” one underwent extensive cracking. The possible effects of various factors, including thermal history, size, and shape of the gamma grains, on cracking behavior were discussed.

1. Introduction

Additive manufacturing (AM) is a common name for a wide range of manufacturing techniques that involve the layer-by-layer building of the desired parts from powders or wires (in the case of metallic AM) in accordance with a pre-designed 3D model [1] as opposed to conventional subtractive manufacturing (drilling, milling, cutting, etc.) or metal forming (forging, rolling, extrusion, etc.) techniques. AM is getting widespread applications in various industries, including the aerospace sector [2]. Aerospace manufacturing often requires complex-shaped parts in rather limited quantities, and AM technologies are ideally suited for this task. Many AM technologies have been developed, and the most notable for metallic materials are selective laser melting (SLM) [3], direct laser deposition (DLD) [4,5], electron beam melting (EBM) [6], and wire arc additive manufacturing (WAAM) [7,8]. Among these methods, DLD offers unique capacities like an excellent balance between the productivity and surface quality, the ability to build large-scale parts, and the capacity of multi-material fabrication [5,9,10,11].
Ni-based superalloys, due to excellent high-temperature mechanical performance and good oxidation and corrosion resistance, occupy a special place in the aerospace industry as materials of choice for the hottest parts of aircraft engines [12,13]. The opportunity to avoid costly traditional techniques required to obtain high mechanical properties in cast alloys caused a huge interest in the application of AM processes for these materials [14,15]. However, it has been known for decades that many Ni alloys have poor weldability [16,17]. A decrease in weldability is usually associated with a high content of Al and Ti [16,17]. Since Al and Ti are responsible for the formation of the strengthening γ’ phase [12], weldable alloys usually have relatively low-strength characteristics, and high-strength, high-temperature alloys are poorly weldable.
The similarities in the thermal cycle between the welding and AM processes suggest that many high-strength Ni-based superalloys will be prone to extensive cracking during AM processes [18,19,20,21]. Due to the complex chemical and phase composition and the associated complexity of solidification after laser/electron melting (and possible re-melting and re-solidification during the melting of the further layers) processes and also solid-state transformation, multiple mechanisms can be responsible for the crack formation. The cracks can be divided [22] into solidification cracks [23], liquation cracks [23], strain-age cracks [23], and ductility-dip cracks [24]. The first two are liquid cracks, which require the presence of a liquid phase, while the latter two are solid cracks. The exact mechanism of cracking varies significantly depending on the exact alloy and process parameters.
One of the prominent research directions to solve the problem of cracking of Ni-based alloys during AM is the development of the new Ni-based superalloys optimized specifically for AM processes [23,25,26,27]. There are some reports of the alloys containing substantial amounts of the γ’ particles after printing and further heat treatment and reasonable mechanical properties at T = 900 °C [27] or excellent oxidation resistance [28]. Another potential route to solve the problem of cracking is the optimization of the printing process. One of the most feasible strategies is to use induction heating to reduce the temperature gradient during the AM process [29,30,31]. However, the optimal printing parameters for different alloys are not evident.
In this work, a detailed examination of the microstructure of the two samples of the Russian ZhS6K grade alloy with a high (>50%) fraction of the γ’ particles with different dimensions and therefore thermal history was performed. The ZhS6K alloy is a casting alloy that contains chromium (12 wt.%), molybdenum (4 wt.%), titanium (3 wt.%), aluminum, cobalt, and tungsten (5 wt.% each) and is used in the manufacture of the nozzles and working blades of turbines and one-piece rotors [32]. The yield strength of the alloy is 784 MPa at room temperatures. The main aim of this work was to obtain a better understanding of the crack formation mechanisms in this particular alloy.

2. Materials and Methods

The ZhS6K nickel alloy was used as a program material. The powder was produced by inert gas atomization. The actual composition of the powder was (in wt.%) 66.08Ni—10.72Cr—6.02W—5.53Al—4.56Co—4.13Mo—2.95Ti—0.16C. The powder size was in the range of 40–100 μm.
A custom robotic direct laser deposition complex with an IPG fiber laser was used in the current work. The laser system had a maximum power of 3000 W. Two Fanuc robot positioners with six and two axes were included in the complex. A laser welding head with a coaxial four-string nozzle was used for the powder supply. The chamber was filled with an argon gas. An inductor was used for the heating of samples due to Joule heat. Heating occurred through the substrate (see Figure 1 for details).
Two multi-pass rectangular samples were fabricated on an Inconel 718 substrate. The dimensions of the substrate and deposited samples are presented in Figure 2. The “small” sample measured 40 × 10 × 10 mm3 and consisted of 12 layers, with each layer having 5 tracks in width. The “large” sample with dimensions 80 × 16 × 16 mm3 consisted of 20 layers and 9 tracks. The distance between the centers of the adjacent tracks was 1.67 mm. A vertical step size of 0.8 mm was used. Passages were carried out in one direction. The process parameters are summarized in Table 1.
The temperature during the fabrication of the large specimen was measured using tungsten/rhenium alloy (Tungsten 95%/Rhenium 5%—Tungsten 80%/Rhenium 20%) thermocouples, the closest analogue of which is a type C thermocouple. The thermocouple with a diameter of 0.5 mm was located on the substrate directly at the bottom of the deposited sample (red dot in Figure 2). In addition, due to the inability to measure the temperature on the sample surface, the temperature at the surface of the DLD specimen was estimated using a simulation. ANSYS Mechanical APDL software (version 19.0) was used for calculations.
The following thermal conductivity equation was used:
ρ c T t K T = 0
where ρ is the density, c is the heat capacity, T is the temperature, t is the time, and K is the thermal conductivity.
The finite element method (FEM) was used to solve Equation (1). The calculations took into account the temperature dependencies of the thermophysical properties of the Inconel 718 and ZhS6K alloys (Table 2). Equation (1) was solved with the initial and boundary conditions. The boundary condition for the heat flux from the laser will constantly shift along with the height of the deposited layer. The following initial condition was used:
T | t = 0 = 1000   ° C
The following convection boundary condition for the side walls and substrate was applied:
K dT dn = h f T s T amb
where T amb is the ambient temperature, h f is the convection coefficient, and T s is the surface temperature of the heated body.
The constant temperature boundary condition was applied to the bottom edge of the substrate:
T = 1000   ° C
The boundary condition for the heat flux from the laser source used can be written as:
K dT dn | r = layers = q ; where   q x , t = Q 2 π R 2 exp z Vt 2 + x Xb 2 2 R 2
where R is the radius of the laser spot, V is the speed of movement of the laser source, Xb is the coordinate of the middle of the weld bead, and Q is the power of the laser heat source.
The microstructure of the deposited samples was studied using a scanning electron microscope (SEM, Tescan MIRA 3 LMH TESCAN GROUP, a.s., Brno, Czech Republic) equipped with an electron backscatter diffraction (EBSD) detector and a transmission electron microscope (TEM, JEOL JEM-2100) equipped with an energy dispersive spectrometry (EDS) detector. The samples for the SEM observations were prepared by the careful mechanical polishing of a surface aligned with the laser beam direction near the center of the produced specimen. The step size during the EBSD mapping was 3 μm. Samples for the TEM investigations were cut from different layers normal to the laser beam, where level 1 is located near the substrate and level 4 corresponds to the top of the sample (Figure 2). Samples for the TEM analysis were prepared by the conventional twin-jet electro-polishing of mechanically pre-thinned 100 nm foils in a mixture of 90% C4H9OH and 10% HClO4 at 20 V potential at room temperature. The size of the γ grains and the size/fraction of the γ’ precipitates were quantified using at least five SEM or TEM images at low magnification using Digimizer software (version 6). Mechanical properties were evaluated using microhardness tests. Vickers microhardness tests were conducted at room temperature using a 300 g load. At least 20 measurements per data point were made.

3. Results

Thermal cycles measured during DLD and calculated using a simulation for the “large” sample close to the substrate are shown in Figure 3a. The experimental (black line) temperature shows that, at the first stage, an inductor heated the substrate to a temperature above 1000 °C. After this, the deposition process began with heating turned on. Immediately before the start of the deposition, a sharp decrease in temperature was observed. This was due to the starting of the gas flow from the deposition head, providing convective heat transfer from the surface of the substrate. A further laser deposition was carried out while maintaining the temperature above 1000 °C. A comparison of the experimental and calculated (blue line) thermal cycles showed a reasonable agreement. As the evaporation processes were not considered, and the measurement points were rather close to the heat source, the peak temperatures were higher for the calculated results. Yet, the observed discrepancies between the experimental/calculated temperatures at times above 1000 s did not exceed 70 °C.
Taking into account the good correlation between the computed and experimental results for the large “specimen”, the thermal cycles for the samples were calculated using a simulation at the top of the sample (for three last layers) (Figure 3b,c). As expected, the temperature on the surface of the deposited sample turned out to be noticeably higher than that of the substrate.
At the end of the process, samples were cooled in a controlled manner. The average cooling rate of the «large» sample was 10.2 °C/min. Controlled cooling eliminated high temperature gradients and reduced cracking.
Figure 4 shows the appearance of the “large” specimen. The individual layers can be easily recognized on the surface. In addition to this, cracks can be observed on the specimen produced during DLD. The cracks seemingly propagated from the top to the bottom. Such cracks were not observed on the surface of the “small” specimen.
Cross-section EBSD images of both specimens are presented in Figure 5. In the “small” sample, the microstructure is quite uniform and equiaxed. The average grain size was 170 μm. It is interesting to note that in the upper part of the sample, compared to the lower part, the grains were slightly larger. In addition, the presence of numerous pores was noted at the top of the sample. No signs of cracking were detected on the EBSD image of the “small” specimen. The “large” specimen demonstrated a distinctively different behavior—the grains were mostly significantly elongated (width of 3 mm and aspect ratio of 0.09), with some equiaxed grains both on the top and at the bottom of the specimen (the size of the equiaxed grains was ~150 μm). Note that the epitaxial growth of grains with a height exceeding a single layer during the direct laser deposition of Ni-superalloys is well documented in the literature [33,34,35]. Moreover, propagation of the cracks was visible already (Figure 4).
Figure 6 shows SEM images of the microstructure of the “small” specimen. The typical dual-phase γ/γ’ microstructure with a cuboidal shape of the γ’ precipitates was observed. EDS revealed that the bright light particles visible in Figure 6 were carbides rich in Ti, Mo, and W (Cr, Co, Mo, and W were also detected). The size of the carbides was 1.5–2 μm. Further identification of such carbides was continued by TEM studies (see the text below). Some porosity and “lack of fusion” defects (identified with arrow in Figure 6a) were also visible; the sizes of such defects did not exceed 40 μm. Specific attention must be paid to the grain boundaries. They were decorated by different types of precipitates such as eutectic γ/γ’ agglomerates, with γ’ -phase sizes reaching 0.1–0.8 μm (identified with red arrow in Figure 6b) and bulk or film-like carbides (identified with green arrow in Figure 6b).
Figure 7 shows the microstructure of the “large” specimen. It largely resembled the structure of the smaller sample, yet with more evident cracking at the grain boundaries. It should be noted that there were much more noticeable eutectic γ/γ’ agglomerates. The size of such agglomerates was up to 2 μm (red arrow in Figure 7a). Bulk or film-like carbides were also observed (green arrow in Figure 7b).
To obtain more insight on the microstructure formation in the program alloy during the DLD process, TEM studies were performed. The microstructure of the “small” sample at the bottom (level 1) and the top (level 4) are represented in Figure 8. A typical cuboidal γ/γ’ structure was formed. The volume fraction of the γ’ phase was somewhat lower (57%) at the bottom than at the top (63%). Meanwhile, there was a significant gradient in the γ’ particles’ size that decreased from 190 nm at the bottom to 70 nm at the top.
The microstructure at the bottom (level 1) of the “large” sample was represented by an fcc matrix and two types of particles (Figure 9). The size of the large particles (Figure 9a) was about ~1 μm; fine particles had an average size of ~200 nm (Figure 9b). Particles were distributed homogeneously; the volume fraction was about 9%. The large particles were enriched by Ni, Mo, and Cr and corresponded to the Ni3Mo3C carbide phase. The fine particles were mostly oxides of the Cr2O3 types (Figure 9b). There were also particles of a complex chemical composition that could not be identified.
The “classic” dual-phase γ/γ’ structure was formed “higher” along the cross-section in the “large” specimen (Figure 10). In level 2 (Figure 10a), the γ’ particles had an irregular shape, possibly due to their coarse size (≈530 nm). The volume fraction of the particles was 43%. Closer to the top, nearly perfect cuboids of the γ’ phase were observed (Figure 10b,c). The volume fraction of the γ’ phase was 63–65%, and its particles’ sizes further refined from 250 nm at level 3 to 100 nm at the top of the sample (Figure 10b,c).
Finally, Figure 11 shows the microhardness profile of the two specimens. Both profiles showed a similar trend: the continuous increasing in hardness from the bottom (~360–370 HV) to the top, reaching the values of ~510 HV in the “large” sample. One can note the sudden drop in the hardness on the top of the “small” specimen; that drop was most likely associated with the development of porosity (see Figure 5a).

4. Discussion

In the present work, a detailed examination of the microstructure of two samples of the non-weldable ZhS6K fabricated by a similar DLD procedure, yet with a different size, was performed. The samples showed distinctively different behaviors in terms of cracking; namely, the “small” sample was nearly crack-free, while the “large” one was distinctively cracked (Figure 4). Here, an analysis of factors that resulted in the crack formation in the “large” sample and the associated microstructure features was carried out.
The most significant change in the microstructure between the two samples, besides the crack formation, was the transition from the nearly equiaxed granular structure in the “small” sample to the columnar structure in the “large” sample (Figure 5). The formation of the columnar structure during AM processes [36,37], including DLD [38,39], is widely documented, yet the exact physical reasons for the formation of such structures are not fully clear. The complex physical nature of the AM process involves both local super- and undercooling, which affect the solidified microstructure [36]. One of the critical factors that govern the transition of the equiaxed to columnar structure transition is the temperature gradient (G) [37]. Apparently, the induction heating used in the current study reduced the G value and most likely was responsible for the formation of the equiaxed structure in the “small” sample. However, the G will apparently increase in the “large” sample; the increase in the G value will most likely be the reason for the formation of the columnar structure.
The formation of the columnar structure is often considered as one of the undesired outcomes of the AM process since grain boundaries are often considered as mechanically “weak”. The overall appearance of cracks in the “large” sample as mostly long, straight, and aligned with grain boundaries (Figure 5b) suggests solid-state cracking as the most probable mechanism [19,23]. These cracks propagate mostly along the boundaries that serve as the fast tracks. Therefore, it can be suggested that a transition from an equiaxed structure in the “small” to columnar in the “large” one is the main reason for the extensive cracking in the bigger sample. In addition, one can anticipate higher residual stresses in the “large” sample [40] that should stimulate the propagation of cracks.
In addition, in the present case, the grain boundaries were further weakened by γ/γ’ eutectic agglomerates and/or the presence of carbides formed during the DLD process (Figure 6 and Figure 7). In particular, the presence of such defects can be an indication of the so-called liquation cracking, which occurs during the local melting of precipitates with a low melting point like γ/γ’ eutectics and further formation of the liquid film at the grain boundary [19,23,41,42]. The observed morphology of the cracks at the grain boundaries (Figure 6 and Figure 7) agrees well with this suggestion, yet it has to be noted that other (than the presence of the precipitates with a low melting point) signs of liquation such as chemical inhomogeneity were not observed.
Another interesting finding of this work is associated with the significant variation in the size and fraction of the γ’ particles in the as-deposited samples (Figure 8, Figure 9 and Figure 10). The continuous decrease in the size of the γ’ particles from the bottom to the top is likely due to the extended exposure of the lower part at high-temperature conditions. The exposure at a temperature below the solvus temperature of the γ’ phase (1230 °C in the program alloy) will result in its gradual coarsening. This effect was obviously stronger in the “larger” specimen, which can probably be attributed to a longer exposure at high temperature due to a longer printing process. Meanwhile, the absence or very low fraction of the γ’ particles in the bottom of the “large” sample implies that the temperature in this part was very close to or above the solvus temperature of the γ’ phase. In addition, the increase in the fraction of the γ’ particles and corresponding decrease in their size is the most probable reason for the increasing hardness in the samples from the bottom to the top due to an increased efficiency of the operating strengthening mechanisms (Figure 11).

5. Conclusions

The results of this work can be particularly attractive for the fabrication of Ni-based superalloys, which are extensively used for the hot parts of turbine engines, by additive manufacturing processes, including direct laser deposition. The additive manufacturing of many Ni superalloys, especially with a high fraction of the strengthening gamma prime phase, is associated with severe cracking; possible reasons for the cracking formation in deposited samples were discussed. So, the structure of the two high-temperature ZhS6K alloy samples with different dimensions (10 × 10 mm2—the “small” sample and 16 × 16 mm2—the “large” sample) after direct laser deposition with induction heating were studied and the following conclusions were drawn:
(1)
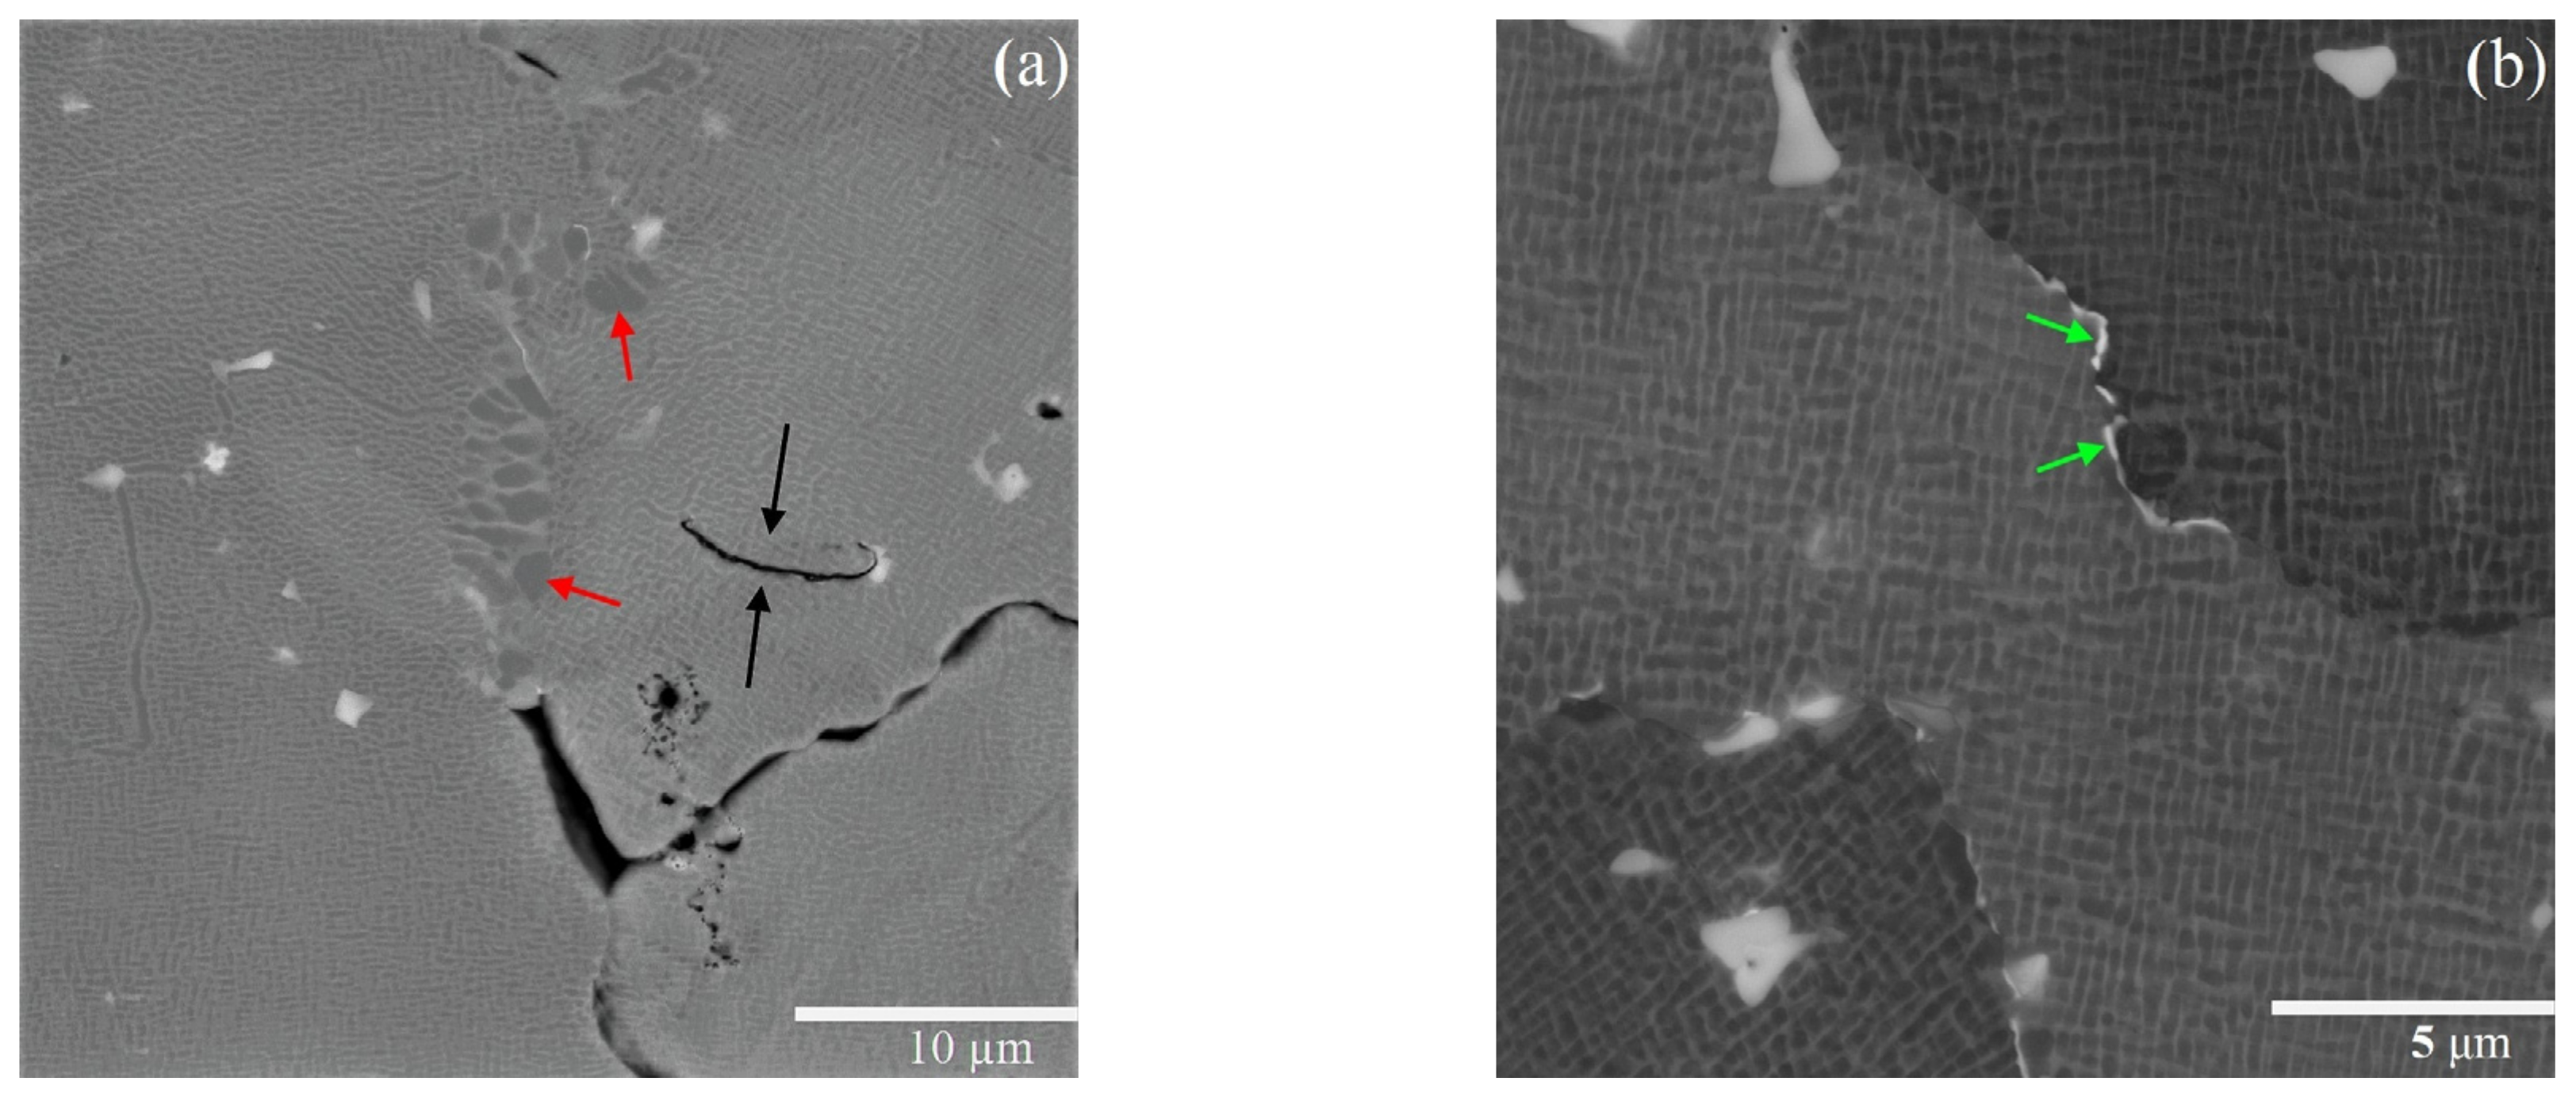
The “small” sample was relatively crack-free, while the “large” underwent extensive cracking. The cracking of the “large” sample was associated with the formation of the columnar structure, which provided the fast tracks for the propagation of solid-state cracks, while the “small” sample had an equiaxed structure. In addition, liquation cracks at the grain boundaries decorated by eutectic γ/γ’ agglomerates and/or carbides were observed in both samples.
(2)
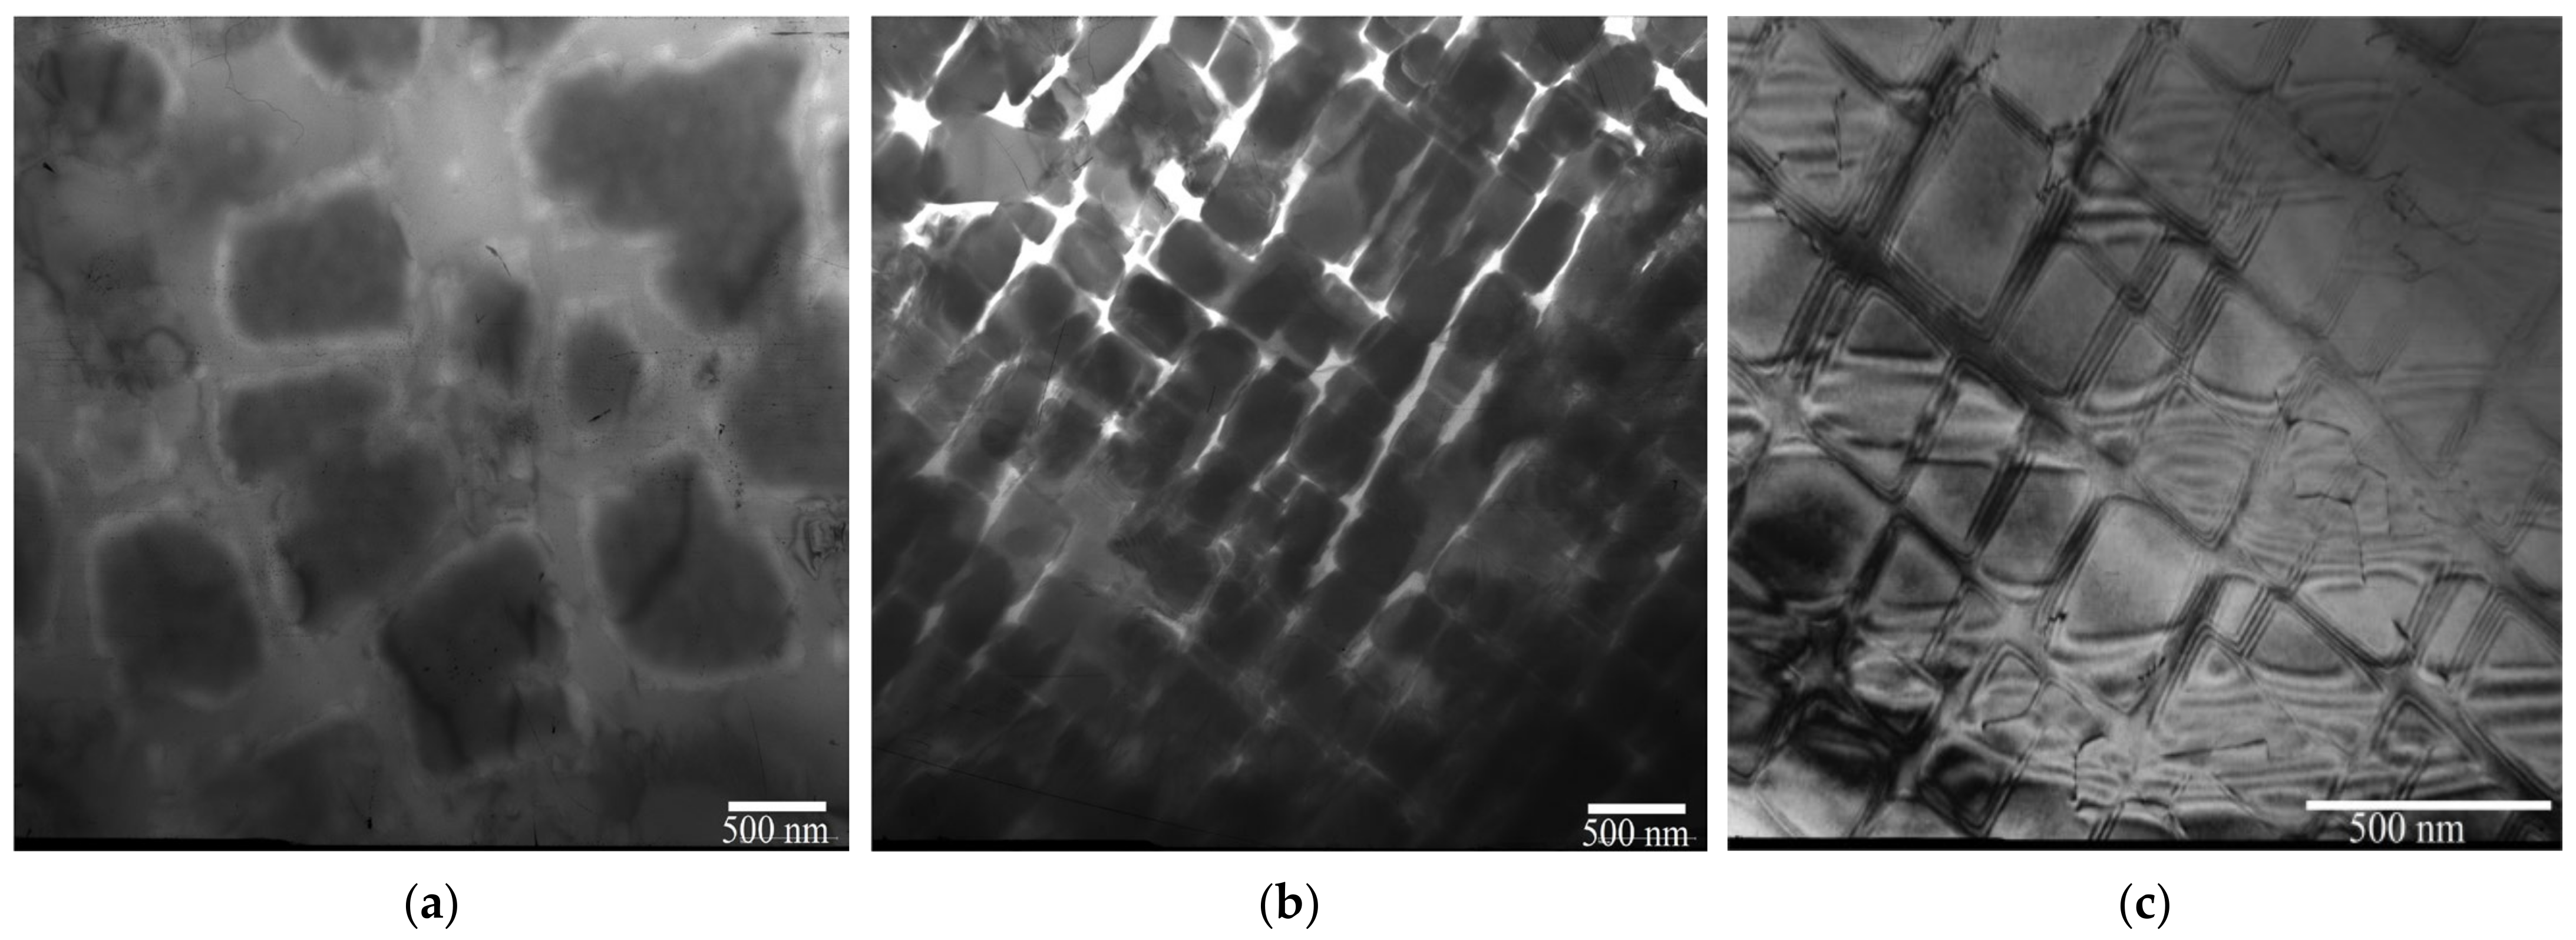
Both the “small” and “large” samples exhibited a strong gradient in the γ’ phase particles’ sizes and fraction from the bottom to the top. In particular, the size of the γ’ particles decreased from 530 nm to 100 nm in the “large” specimen. The fraction of the γ’ phase increased from the bottom to the top; in the “large” specimen this variation was as large as from 0 to 65%. Such changes were associated with the complex thermal history of the samples, revealed both computationally and experimentally, and are likely the reason for the increase in the hardness of the samples.

Author Contributions

A.D.: investigation, writing—review and editing, visualization, and supervision. A.S.: investigation. M.K.: investigation. I.U.: investigation. D.M.: methodology. A.V.: methodology and validation. S.Z.: conceptualization and writing—review and editing. O.K.-K.: supervision. N.S.: writing—original draft, visualization, and funding acquisition. All authors have read and agreed to the published version of the manuscript.

Funding

This research was supported by the Russian Science Foundation, grant no. 23-19-00622 https://rscf.ru/en/project/23-19-00622/ (accessed on 19 May 2024). A part of this research (fabrication of induction-heated DLD setup) was partially funded by the Ministry of Science and Higher Education of the Russian Federation as part of the World-Class Research Center program: Advanced Digital Technologies (Contract no. 075-15-2022-312 dated 20 April 2022).

Data Availability Statement

The raw/processed data required to reproduce these findings cannot be shared at this time as the data also form part of an ongoing study.

Conflicts of Interest

The authors declare no conflicts of interest.

References

  1. ISO/ASTM 52900:2021; Additive Manufacturing—General Principles—Fundamentals and Vocabulary. ISO: Geneva, Switzerland, 2021. Available online: https://www.iso.org/standard/74514.html (accessed on 9 June 2023).
  2. Froes, F.; Boyer, R. Additive Manufacturing for the Aerospace Industry; Elsevier: Amsterdam, The Netherlands, 2019; ISBN 9780128140635. [Google Scholar]
  3. Sefene, E.M. State-of-the-art of selective laser melting process: A comprehensive review. J. Manuf. Syst. 2022, 63, 250–274. [Google Scholar] [CrossRef]
  4. Ahmed, N. Direct metal fabrication in rapid prototyping: A review. J. Manuf. Process. 2019, 42, 167–191. [Google Scholar] [CrossRef]
  5. Feenstra, D.R.; Banerjee, R.; Fraser, H.L.; Huang, A.; Molotnikov, A.; Birbilis, N. Critical review of the state of the art in multi-material fabrication via directed energy deposition. Curr. Opin. Solid State Mater. Sci. 2021, 25, 100924. [Google Scholar] [CrossRef]
  6. Negi, S.; Nambolan, A.A.; Kapil, S.; Joshi, P.S.; Manivannan, R.; Karunakaran, K.P.; Bhargava, P. Review on electron beam based additive manufacturing. Rapid Prototyp. J. 2020, 26, 485–498. [Google Scholar] [CrossRef]
  7. Cunningham, C.R.; Flynn, J.M.; Shokrani, A.; Dhokia, V.; Newman, S.T. Invited review article: Strategies and processes for high quality wire arc additive manufacturing. Addit. Manuf. 2018, 22, 672–686. [Google Scholar] [CrossRef]
  8. Chaturvedi, M.; Scutelnicu, E.; Rusu, C.C.; Mistodie, L.R.; Mihailescu, D.; Arungalai Vendan, S. Wire Arc Additive Manufacturing: Review on Recent Findings and Challenges in Industrial Applications and Materials Characterization. Metals 2021, 11, 939. [Google Scholar] [CrossRef]
  9. Gushchina, M.O.; Klimova-Korsmik, O.G.; Turichin, G.A. Direct laser deposition of Cu-Mo functionally graded layers for dissimilar joining titanium alloys and steels. Mater. Lett. 2022, 307, 131042. [Google Scholar] [CrossRef]
  10. Makarenko, K.I.; Konev, S.D.; Dubinin, O.N.; Shishkovsky, I.V. Mechanical characteristics of laser-deposited sandwich structures and quasi-homogeneous alloys of Fe-Cu system. Mater. Des. 2022, 224, 111313. [Google Scholar] [CrossRef]
  11. Kuzminova, Y.O.; Dubinin, O.N.; Gushchina, M.O.; Simonov, A.P.; Konev, S.D.; Sarkeeva, A.A.; Zhilyaev, A.P.; Evlashin, S.A. The mechanical behavior of the Ti6Al4V/Ti/Ti6Al4V composite produced by directed energy deposition under impact loading. Materialia 2023, 27, 101684. [Google Scholar] [CrossRef]
  12. Reed, R.C.; Roger, C. The Superalloys: Fundamentals and Applications; Cambridge University Press: Cambridge, UK, 2006; ISBN 9780511541285. [Google Scholar]
  13. Pollock, T.M.; Tin, S. Nickel-Based Superalloys for Advanced Turbine Engines: Chemistry, Microstructure and Properties. J. Propuls. Power 2006, 22, 361–374. [Google Scholar] [CrossRef]
  14. Mostafaei, A.; Ghiaasiaan, R.; Ho, I.T.; Strayer, S.; Chang, K.C.; Shamsaei, N.; Shao, S.; Paul, S.; Yeh, A.C.; Tin, S.; et al. Additive manufacturing of nickel-based superalloys: A state-of-the-art review on process-structure-defect-property relationship. Prog. Mater. Sci. 2023, 136, 101108. [Google Scholar] [CrossRef]
  15. Attallah, M.M.; Jennings, R.; Wang, X.; Carter, L.N. Additive manufacturing of Ni-based superalloys: The outstanding issues. MRS Bull. 2016, 41, 758–764. [Google Scholar] [CrossRef]
  16. Basak, A.; Das, S. Additive Manufacturing of Nickel-Base Superalloy René N5 through Scanning Laser Epitaxy (SLE)—Material Processing, Microstructures, and Microhardness Properties. Adv. Eng. Mater. 2017, 19, 1600690. [Google Scholar] [CrossRef]
  17. Moosavy, H.N.; Aboutalebi, M.R.; Seyedein, S.H.; Khodabakhshi, M.; Mapelli, C. New approach for assessing the weldability of precipitation-strengthened nickel-base superalloys. Int. J. Miner. Metall. Mater. 2013, 20, 1183–1191. [Google Scholar] [CrossRef]
  18. Kontis, P.; Chauvet, E.; Peng, Z.; He, J.; da Silva, A.K.; Raabe, D.; Tassin, C.; Blandin, J.J.; Abed, S.; Dendievel, R.; et al. Atomic-scale grain boundary engineering to overcome hot-cracking in additively-manufactured superalloys. Acta Mater. 2019, 177, 209–221. [Google Scholar] [CrossRef]
  19. Guo, C.; Li, G.; Li, S.; Hu, X.; Lu, H.; Li, X.; Xu, Z.; Chen, Y.; Li, Q.; Lu, J.; et al. Additive manufacturing of Ni-based superalloys: Residual stress, mechanisms of crack formation and strategies for crack inhibition. Nano Mater. Sci. 2023, 5, 53–77. [Google Scholar] [CrossRef]
  20. Zhou, Z.; Huang, L.; Shang, Y.; Li, Y.; Jiang, L.; Lei, Q. Causes analysis on cracks in nickel-based single crystal superalloy fabricated by laser powder deposition additive manufacturing. Mater. Des. 2018, 160, 1238–1249. [Google Scholar] [CrossRef]
  21. Chauvet, E.; Kontis, P.; Jägle, E.A.; Gault, B.; Raabe, D.; Tassin, C.; Blandin, J.J.; Dendievel, R.; Vayre, B.; Abed, S.; et al. Hot cracking mechanism affecting a non-weldable Ni-based superalloy produced by selective electron Beam Melting. Acta Mater. 2018, 142, 82–94. [Google Scholar] [CrossRef]
  22. Wei, Q.; Xie, Y.; Teng, Q.; Shen, M.; Sun, S.; Cai, C. Crack Types, Mechanisms, and Suppression Methods during High-energy Beam Additive Manufacturing of Nickel-based Superalloys: A Review. Chin. J. Mech. Eng. Addit. Manuf. Front. 2022, 1, 100055. [Google Scholar] [CrossRef]
  23. Tang, Y.T.; Panwisawas, C.; Ghoussoub, J.N.; Gong, Y.; Clark, J.W.G.; Németh, A.A.N.; McCartney, D.G.; Reed, R.C. Alloys-by-design: Application to new superalloys for additive manufacturing. Acta Mater. 2021, 202, 417–436. [Google Scholar] [CrossRef]
  24. Divya, V.D.; Muñoz-Moreno, R.; Messé, O.M.D.M.; Barnard, J.S.; Baker, S.; Illston, T.; Stone, H.J. Microstructure of selective laser melted CM247LC nickel-based superalloy and its evolution through heat treatment. Mater. Charact. 2016, 114, 62–74. [Google Scholar] [CrossRef]
  25. Zhao, Y.; Ma, Z.; Yu, L.; Liu, Y. New alloy design approach to inhibiting hot cracking in laser additive manufactured nickel-based superalloys. Acta Mater. 2023, 247, 118736. [Google Scholar] [CrossRef]
  26. Murray, S.P.; Pusch, K.M.; Polonsky, A.T.; Torbet, C.J.; Seward, G.G.E.; Zhou, N.; Forsik, S.A.J.; Nandwana, P.; Kirka, M.M.; Dehoff, R.R.; et al. A defect-resistant Co–Ni superalloy for 3D printing. Nat. Commun. 2020, 11, 4975. [Google Scholar] [CrossRef] [PubMed]
  27. Park, J.U.; Jun, S.Y.; Lee, B.H.; Jang, J.H.; Lee, B.S.; Lee, H.J.; Lee, J.H.; Hong, H.U. Alloy design of Ni-based superalloy with high γ′ volume fraction suitable for additive manufacturing and its deformation behavior. Addit. Manuf. 2022, 52, 102680. [Google Scholar] [CrossRef]
  28. Ghoussoub, J.N.; Klupś, P.; Dick-Cleland, W.J.B.; Rankin, K.E.; Utada, S.; Bagot, P.A.J.; McCartney, D.G.; Tang, Y.T.; Reed, R.C. A new class of alumina-forming superalloy for 3D printing. Addit. Manuf. 2022, 52, 102608. [Google Scholar] [CrossRef]
  29. Seidel, A.; Finaske, T.; Straubel, A.; Wendrock, H.; Maiwald, T.; Riede, M.; Lopez, E.; Brueckner, F.; Leyens, C. Additive Manufacturing of Powdery Ni-Based Superalloys Mar-M-247 and CM 247 LC in Hybrid Laser Metal Deposition. Metall. Mater. Trans. A Phys. Metall. Mater. Sci. 2018, 49, 3812–3830. [Google Scholar] [CrossRef]
  30. Lee, Y.S.; Kirka, M.M.; Ferguson, J.; Paquit, V.C. Correlations of cracking with scan strategy and build geometry in electron beam powder bed additive manufacturing. Addit. Manuf. 2020, 32, 101031. [Google Scholar] [CrossRef]
  31. Dang, X.; Li, Y.; Chen, K.; Ramamurty, U.; Luo, S.; Liang, X.; He, W. Avoiding cracks in additively manufactured non-weldable directionally solidified Ni-based superalloys. Addit. Manuf. 2022, 59, 103095. [Google Scholar] [CrossRef]
  32. Lukina, E.A.; Bazaleeva, K.O.; Petrushin, N.V.; Treninkov, I.A.; Tsvetkova, E.V. Effect of the selective laser melting parameters on the structure–phase state of a ZhS6K-VI nickel superalloy. Russ. Metall. (Met.) 2017, 2017, 594–600. [Google Scholar] [CrossRef]
  33. Nie, J.; Chen, C.; Liu, L.; Wang, X.; Zhao, R.; Shuai, S.; Wang, J.; Ren, Z. Effect of substrate cooling on the epitaxial growth of Ni-based single-crystal superalloy fabricated by direct energy deposition. J. Mater. Sci. Technol. 2021, 62, 148–161. [Google Scholar] [CrossRef]
  34. Guan, W.; Chen, C.; Pan, X.; Zhao, R.; Xufei, L.; Tao, H.; Songzhe, X.; Xuan, W.; Panwisawas, C.; Lei, L.; et al. On the control of epitaxial growth and stray grains during laser-directed energy deposited Ni-based single crystal superalloy. Mater. Charact. 2024, 113969. [Google Scholar] [CrossRef]
  35. Meng, G.; Gong, Y.; Zhang, J.; Zhao, J. The microstructural evolution and mechanical response of laser direct energy deposition Inconel 718 alloy based on simulation and experimental methods. Eng. Fail. Anal. 2024, 161, 108334. [Google Scholar] [CrossRef]
  36. Liu, P.; Wang, Z.; Xiao, Y.; Horstemeyer, M.F.; Cui, X.; Chen, L. Insight into the mechanisms of columnar to equiaxed grain transition during metallic additive manufacturing. Addit. Manuf. 2019, 26, 22–29. [Google Scholar] [CrossRef]
  37. Zhao, Y.; Aoyagi, K.; Yamanaka, K.; Chiba, A. A survey on basic influencing factors of solidified grain morphology during electron beam melting. Mater. Des. 2022, 221, 110927. [Google Scholar] [CrossRef]
  38. Shao, J.; Yu, G.; Li, S.; He, X.; Tian, C.; Dong, B. Crystal growth control of Ni-based alloys by modulation of the melt pool morphology in DED. J. Alloy. Compd. 2022, 898, 162976. [Google Scholar] [CrossRef]
  39. Li, H.; Fu, W.; Chen, T.; Huang, Y.; Ning, Z.; Sun, J.; Bai, H.; Dai, X.; Fan, H.; Ngan, A.H.W. Toward tunable microstructure and mechanical properties in additively manufactured CoCrFeMnNi high entropy alloy. J. Alloy. Compd. 2022, 924, 166513. [Google Scholar] [CrossRef]
  40. Li, C.; Liu, Z.Y.; Fang, X.Y.; Guo, Y.B. Residual Stress in Metal Additive Manufacturing. Procedia CIRP 2018, 71, 348–353. [Google Scholar] [CrossRef]
  41. Wang, X.; Carter, L.N.; Pang, B.; Attallah, M.M.; Loretto, M.H. Microstructure and yield strength of SLM-fabricated CM247LC Ni-Superalloy. Acta Mater. 2017, 128, 87–95. [Google Scholar] [CrossRef]
  42. Ojo, O.A.; Richards, N.L.; Chaturvedi, M.C. Contribution of constitutional liquation of gamma prime precipitate to weld HAZ cracking of cast Inconel 738 superalloy. Scr. Mater. 2004, 50, 641–646. [Google Scholar] [CrossRef]
Figure 1. A schematic diagram of direct laser deposition with induction heating.
Metals 14 00610 g001
Figure 2. Dimensions of the deposited samples. The red dot shows the location of the thermocouple. Levels 1–4 identify the planes used for TEM investigations.
Metals 14 00610 g002
Figure 3. Thermal cycles during direct laser deposition with induction heating: comparison between experimental and calculated results for the «large» sample near the substrate (a) and calculated results for the «large» (b) and «small» (c) samples at first and three last layers.
Metals 14 00610 g003
Figure 4. Appearance of the “large” specimen.
Metals 14 00610 g004
Figure 5. EBSD IPF images of the cross-section of the “small” (a) and the “large” (b) samples.
Metals 14 00610 g005
Figure 6. SEM-BSE images of the “small” specimen, middle of the thickness. “Lack of fusion” defect is identified with black arrows in (a). Red and green arrows in (b) identify eutectic γ/γ’ agglomerates and bulk or film-like carbides, respectively.
Metals 14 00610 g006
Figure 7. SEM-BSE images of the “large” specimen, upper half of the specimen. “Lack of fusion” defect is identified with black arrows. (a,b) Red and green arrows identify eutectic γ/γ’ agglomerates and bulk or film-like carbides, respectively.
Metals 14 00610 g007
Figure 8. The microstructure of the “small” sample: at the bottom (a) and at the top (b).
Metals 14 00610 g008
Figure 9. The microstructure of the “large” sample at level 1: particles of Ni3Mo3C phase (a), particles of Cr2O3 phase (b).
Metals 14 00610 g009
Figure 10. The microstructure at level 2 (a); level 3 (b); and level 4 (c) of the “large” sample.
Metals 14 00610 g010
Figure 11. The microhardness profile in the “small” and “large” samples.
Metals 14 00610 g011
Table 1. Deposition mode parameters.
ParametersValue
Laser power (W)1400
Deposition speed (mm/s)25
Powder flow rate (g/min)16.5
Laser spot size (mm)2.5
Width offset (mm)1.67
Height offset (mm)0.8
Pause time (s)0
Table 2. Thermal properties of the Inconel 718 and ZhS6K alloys.
Temperature, °CDensity, kg/m3Heat Capacity, J/(kg·K)Thermal Conductivity, W/m·K
INC718ZhS6KINC718ZhS6KINC718ZhS6K
25819082000.4350.388.98
100816082000.4550.410.89
200811882000.4790.4212.911
300807982000.4970.44515.212
400804082000.5150.4717.414
500800182000.5270.48518.715
600796282000.5580.51520.817
700792582000.5680.5621.919
800788482000.680.6126.922
900784582000.640.6625.824
10007806 0.62 26.7
11007767 0.64 28.3
11707727 0.65 29.3
13367400 0.72 29.6
14007340 0.72 29.6
15007250 0.72 29.6
16007160 0.72 29.6
Disclaimer/Publisher’s Note: The statements, opinions and data contained in all publications are solely those of the individual author(s) and contributor(s) and not of MDPI and/or the editor(s). MDPI and/or the editor(s) disclaim responsibility for any injury to people or property resulting from any ideas, methods, instructions or products referred to in the content.

