
A Review of Fatigue Limit Assessment Using the Thermography-Based Method

Abstract
1. Introduction
2. Fatigue Limit Evaluation Methods
2.1. Temperature-Based Methods
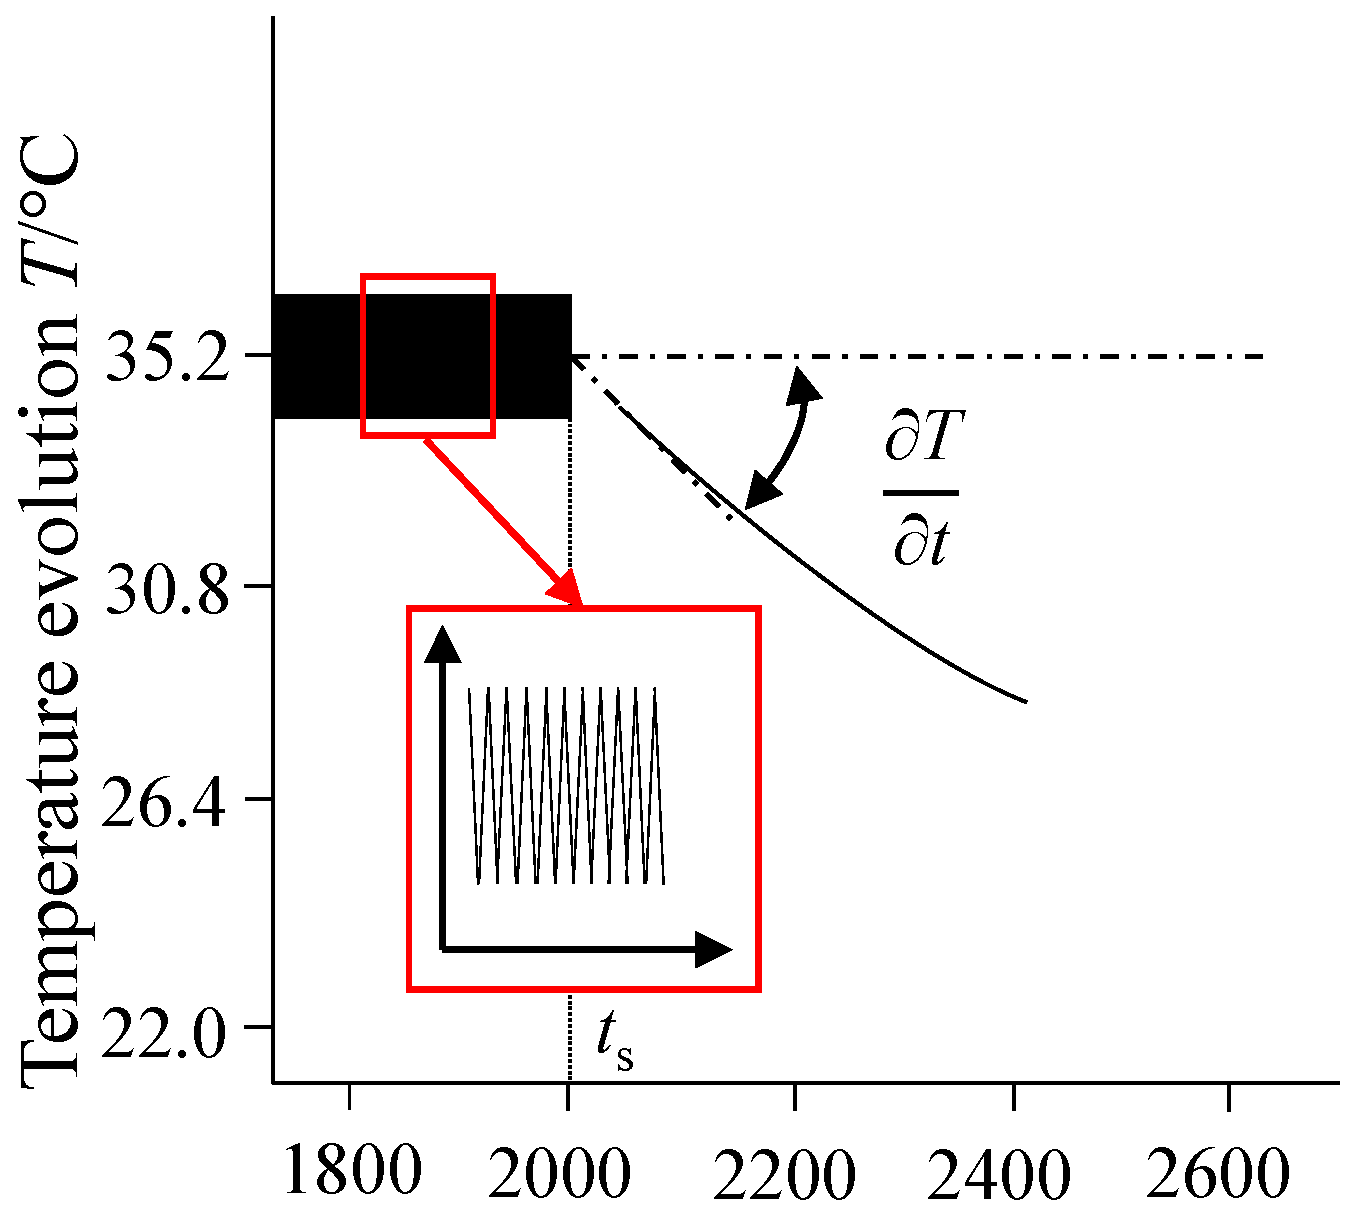
2.1.1. Stabilized Temperature Increment
2.1.2. Initial Temperature Rise Slope
2.1.3. Harmonic Methods
2.2. Energy-Based Methods
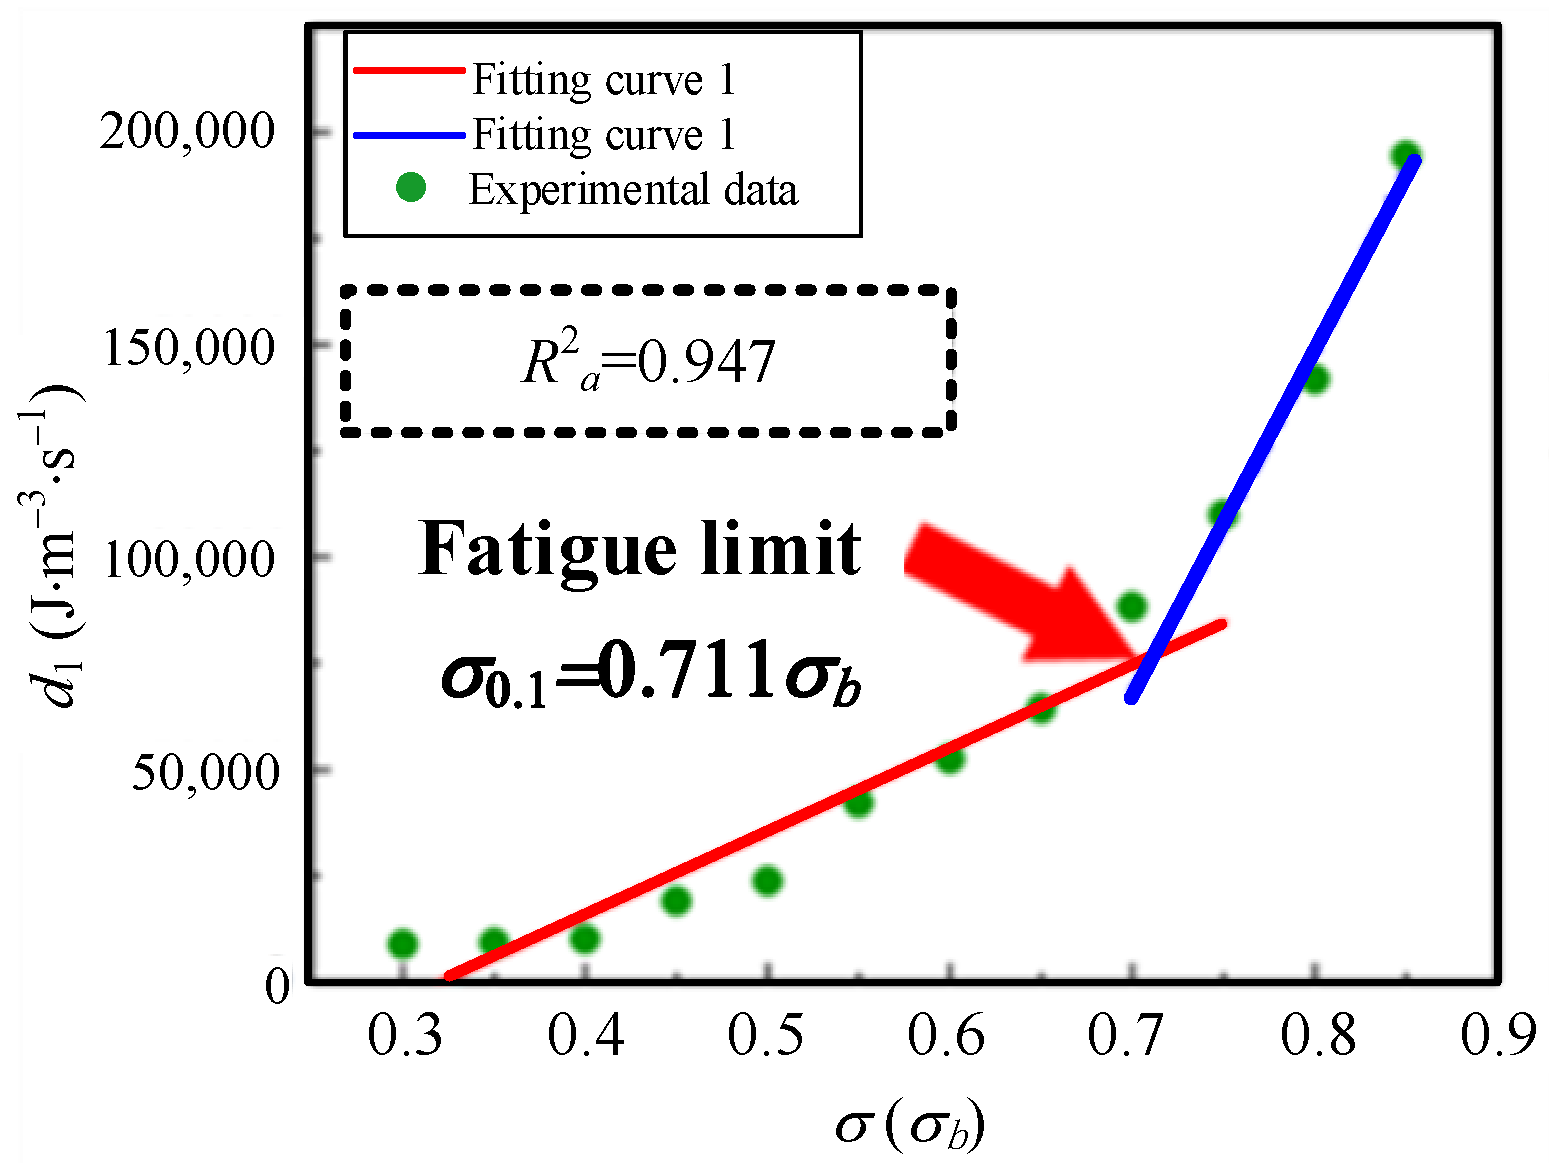
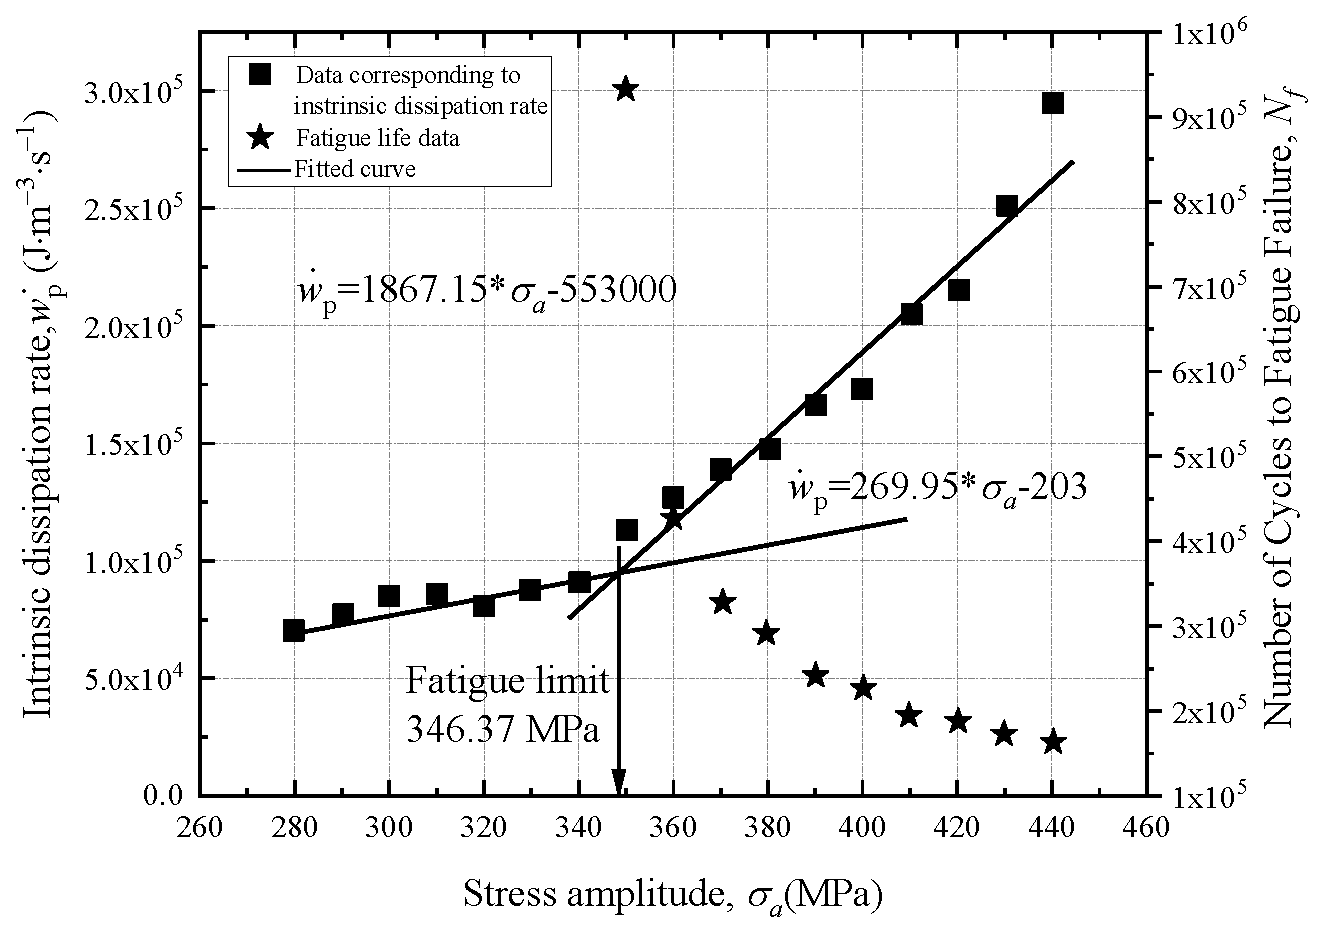
2.2.1. Energy Model Based on the Stabilized Temperature
- ρ, C, and k are not influenced by the self-heating effect;
- The thermoelastic effect does not induce the stabilized temperature increment;
- The coupling heat source and external heat source do not need to be considered.
2.2.2. Energy Model Based on the Initial Temperature Rise Slope
2.2.3. The Energy Model Based on a Sudden Stop of Temperature Rise in Phase II
2.3. Entropy-Based Methods
3. Discussion and Future Perspectives
3.1. Summarization of the Applicability of the Above-Mentioned Methods
- (1)
- Whether it is the threshold-based approach or the bi-linear technique, the fatigue limit prediction method employed in the aforementioned research focuses on identifying the key turning point. However, there are no specific standards to accomplish this. Even though Huang et al., Wei et al. and Li et al. suggested a method for identifying boundary points based on the coefficient of determination, R2, more research and confirmation are required. More details see Table 1.
- (2)
- In many instances, a non-linear or linear non-linear two-stage characteristic is presented regarding the response relationship between infrared thermography data and stress amplitude levels. In Zhang’s work [68], for instance, the data are fitted using the bilinear approach; however, the coefficient of determination, R2, is only around 0.8, which is less than the greater confidence, i.e., 0.95 or a higher value.
3.2. Future Perspectives
- (1)
- Fatigue Limit Prediction Aspect
- The related study generally uses the bilinear approach to estimate a material’s fatigue limit by bilinear fitting; however, there is rarely any consistent standard for this slope turning point.
- One specimen can be used to estimate a material’s fatigue limit using the present thermal imaging approach, demonstrating this approach’s superiority in accurately predicting the fatigue limit. Nonetheless, for engineering applications, at least three specimens should be utilized to determine the fatigue limit, and the mean value should be determined together with the standard deviation because of the inaccuracies caused by the fitting and temperature-measuring processes.
- Currently, these approaches are mainly utilized at the level of metallic specimens within a laboratory scale, and the application of fatigue limit or strength prediction for metallic structures or components with intricate geometries has not been achieved for the time being. Moreover, the measurement of the temperature rise of metallic structures or components requires an accurate thermal emissivity, and applying a black coating on the surface of the corresponding structures is a big challenge.
- The previously mentioned study confined itself to examining the fatigue limit under certain load states, such as constant stress ratio and constant stress amplitude, with an emphasis on the rapid prediction of fatigue limits using the bilinear method. The prediction of material fatigue limit under various load instances, for instance, fluctuating stress amplitude or varying stress ratios, is not well investigated. Also, the effect of the initial condition of materials and environmental aspects on infrared thermography data is worth more study and examination in the future.
- (2)
- Fatigue Life Evaluation Aspect
4. Conclusions
Author Contributions
Funding
Data Availability Statement
Conflicts of Interest
Nomenclature
| Tspecimen | The temperature value of specimen center |
| Tuppergrip | The referenced temperature at the upper grip |
| Tlowergrip | The referenced temperature at the lower grip |
| ∆Tstab | The temperature increment of the specimen |
| θ0D, θ | The temperature rise in Phase II |
| σa or σaj | Stress amplitude |
| σf, σ∞, σy, Σf, | Fatigue limit or endurance limit |
| or dan | Anelastic dissipated energy |
| or din | Inelastic dissipated energy |
| d1 or d1j | Instrinsic energy dissipation |
| dcycle | Instrinsic energy dissipation per unit time |
| df | Energy dissipation corresponding to fatigue limit |
| Σ0 or Σa | Stress amplitude |
| Σmax | Maximum stress within domain |
| Mean fatigue limit | |
| fl or f1 | Experimenal frequency |
| V0 | Materials parameter |
| Veff | An effective volume for the explanation of stress inhomogeneity |
| S0 | Materials parameter |
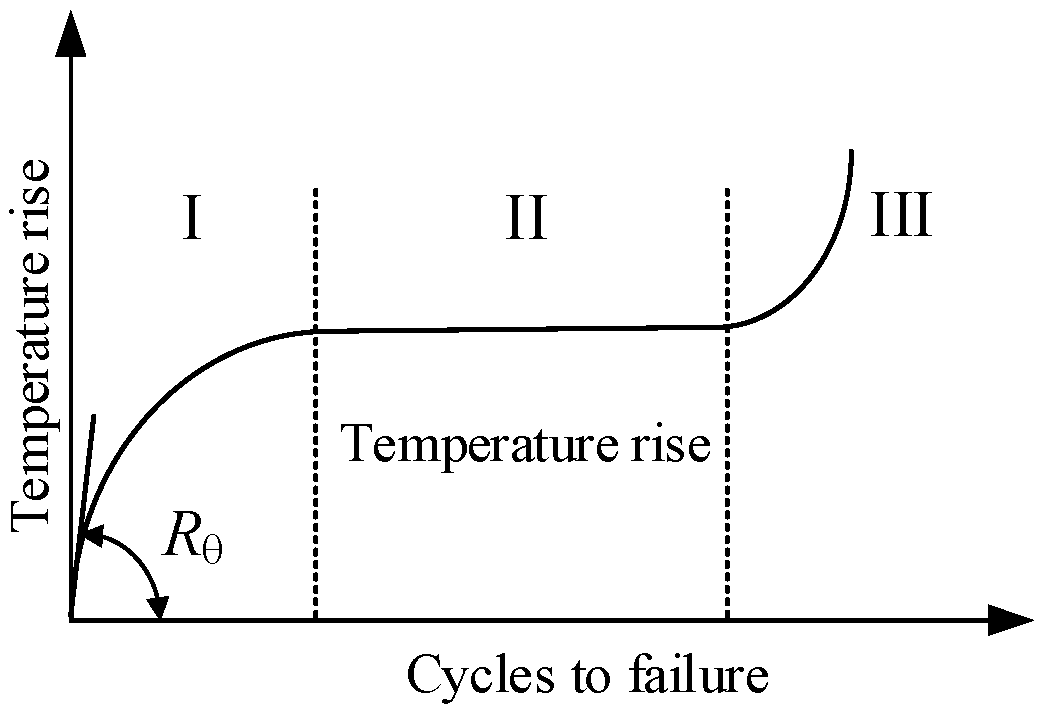
| Rθ | Initial slope of the temperature rise |
| τeq | Characteristic time corresponding to external surroundings |
| C1 | Temperature-dependent coefficient |
| C2 | Temperature-dependent coefficient |
| C3 | Relates to energy dissipation |
| r | Fitted coefficient |
| λ | Fitted coefficient |
| ρ | Density |
| C | Specific heat |
| a | Materials-related coefficient |
| b | Materials-related coefficient |
| A | Materials-related coefficient |
| B | Materials-related coefficient |
| S1 | Materials-related coefficient |
| S2 | Materials-related coefficient |
| Intrinsic energy dissipation rate | |
| Initial slope of the temperature rise | |
| Entropy generation rate |
References
- Qu, Z.; Zhang, Z.; Liu, R.; Xu, L.; Zhang, Y.; Li, X.; Zhao, Z.; Duan, Q.; Wang, S.; Li, S.; et al. High fatigue resistance in a titanium alloy via near-void-free 3D printing. Nature 2024, 626, 999–1004. [Google Scholar] [CrossRef] [PubMed]
- Gao, C.; Pang, J.; Hu, D.; Li, S.; Qi, K.; Wang, B.; Zhang, Y.; Nie, L.; Yang, M.; Zhang, Z. A new method for predicting the fatigue strength at various stress ratios based on damage of metallic materials. Fatigue Fract. Eng. M 2024, 47, 14271. [Google Scholar] [CrossRef]
- Yu, H.; Hu, Y.; Kang, G.; Peng, X.; Chen, B.; Wu, S. High-cycle fatigue life prediction of L-PBF AlSi10Mg alloys: A domain knowledge-guided symbolic regression approach. Philos. Trans. R. Soc. A 2023, 382, 20220383. [Google Scholar] [CrossRef] [PubMed]
- Liu, M.; Zou, T.; Wang, Q.; Jiang, Y.; Wu, H.; Pei, Y.; Zhang, H.; Liu, Y.; Wang, Q. Microstructure evolution, failure mechanism and life prediction of additively manufactured Inconel 625 superalloy with comparable low cycle fatigue performance. Int. J. Fatigue 2023, 181, 108142. [Google Scholar] [CrossRef]
- Teng, Z. Thermo-based fatigue life prediction: A review. Fatigue Fract. Eng. M 2023, 46, 3121–3144. [Google Scholar] [CrossRef]
- Schütz, W. A history of fatigue. Eng. Fract. Mech. 1996, 54, 263–300. [Google Scholar] [CrossRef]
- Horas, C.; De Jesus, A.; Calçada, R. New multiphase methodology for fatigue damage screening of aging metallic railway bridges. Int. J. Fatigue 2023, 169, 107498. [Google Scholar] [CrossRef]
- Movahedi-Rad, A.; Liu, L.; Keller, T. A novel fatigue life prediction methodology based on energy dissipation in viscoelastic materials, synergistic effects of stress level, stress ratio, and temperature. Int. J. Fatigue 2024, 184, 108296. [Google Scholar] [CrossRef]
- Kujawski, D.; Vasudevan, A.; Plano, S.; Gabellone, D. A method to estimate fatigue limit using (1/Nf)-S curve. Int. J. Fatigue 2024, 182, 108205. [Google Scholar] [CrossRef]
- Li, C.; Wu, S.; Zhang, J.; Xie, L.; Zhang, Y. Determination of the fatigue P-S-N curves—A critical review and improved backward statistical inference method. Int. J. Fatigue 2020, 139, 105789. [Google Scholar] [CrossRef]
- Amiri, M.; Khonsari, M. Life prediction of metals undergoing fatigue load based on temperature evolution. Mater. Sci. Eng. A 2010, 527, 1555–1559. [Google Scholar] [CrossRef]
- Fargione, G.; Geraci, A.; La Rosa, G.; Risitano, A. Rapid determination of the fatigue curve by the thermographic method. Int. J. Fatigue 2002, 24, 11–19. [Google Scholar] [CrossRef]
- Luong, M. Fatigue limit evaluation of metals using an infrared thermographic technique. Mech. Mater. 1998, 28, 155–163. [Google Scholar] [CrossRef]
- Khonsari, M.; Amiri, M. Introduction to Thermodynamics of Mechanical Fatigue; CRC Press: New York, NY, USA, 2012. [Google Scholar]
- Skibicki, D.; Lipski, A.; Pejkowski, L. Evaluation of plastic strain work and multiaxial fatigue life in CuZn37 alloy by means of thermography method and energy-based approaches of Ellyin and Garud. Fatigue Fract. Eng. M 2018, 4, 2541–2556. [Google Scholar] [CrossRef]
- Zhang, H.; Wu, G.; Yan, Z.; Guo, S.; Chen, P.; Wang, W. An experimental analysis of fatigue behavior of AZ31B magnesium alloy welded joint based on infrared thermography. Mater. Design. 2014, 55, 785–791. [Google Scholar] [CrossRef]
- Liakat, M.; Khonsari, M.M. An experimental approach to estimate damage and remaining life of metals under uniaxial fatigue loading. Mater. Design. 2014, 57, 289–297. [Google Scholar] [CrossRef]
- Yang, H.; Cui, Z.; Wang, W.; Xu, B.; Xu, H. Fatigue behavior of AZ31B magnesium alloy electron beam welded joint based on infrared thermography. Trans. Nonferrous Met. Soc. 2016, 26, 2595–2602. [Google Scholar] [CrossRef]
- Zhang, L.; Liu, X.; Wu, S.; Ma, Z.; Fang, H. Rapid determination of fatigue life based on temperature evolution. Int. J. Fatigue 2013, 54, 1–6. [Google Scholar] [CrossRef]
- Huang, J.; Pastor, M.-L.; Garnier, C.; Gong, X.-J. A new model for fatigue life prediction based on infrared thermography and degradation process for CFRP composite laminates. Int. J. Fatigue 2019, 120, 87–95. [Google Scholar] [CrossRef]
- De Finis, R.; Palumbo, D.; Ancona, F.; Galietti, U. Fatigue limit evaluation of various martensitic stainless steels with new robust thermographic data analysis. Int. J. Fatigue 2015, 74, 88–96. [Google Scholar] [CrossRef]
- Corigliano, P.; Crupi, V. Fatigue analysis of TI6AL4V/INCONEL 625 dissimilar welded joints. Ocean Eng. 2021, 221, 108582. [Google Scholar] [CrossRef]
- Guo, S.; Liu, X.; Zhang, H.; Yan, Z.; Fang, H. Fatigue Limit Evaluation of AZ31B Magnesium Alloy Based on Temperature Distribution Analysis. Metals 2020, 10, 1331. [Google Scholar] [CrossRef]
- Cao, Y.; Moumni, Z.; Zhu, J.; Zhang, Y.; Zhang, W. Comparative investigation of the fatigue limit of additive-manufactured and rolled 316 steel based on self-heating approach. Eng. Fract. Mech. 2020, 23, 106746. [Google Scholar] [CrossRef]
- Pirinu, A.; Panella, F.W. A new approach for rapid fatigue limit assessment for C45 steel based on contrast damage parameters. Mech. Res. Commun. 2023, 127, 104039. [Google Scholar] [CrossRef]
- Wei, W.; Du, L.; Yang, G.; Zhang, Y.; Sun, Y.; Yang, X. Fatigue reliability evaluation of Q460 welded joints using fracture fatigue entropy method. Eng. Fract. Mech. 2021, 247, 107641. [Google Scholar] [CrossRef]
- Palumbo, D.; De Finis, R.; Ancona, F.; Galietti, U. Damage monitoring in fracture mechanics by evaluation of the heat dissipated in the cyclic plastic zone ahead of the crack tip with thermal measurements. Eng. Fract. Mech. 2017, 181, 65–76. [Google Scholar] [CrossRef]
- Kabir, S.; Yeo, T. Evaluation of an energy-based fatigue approach considering mean stress effects. J. Mech. Sci. Technol. 2014, 28, 1265–1275. [Google Scholar] [CrossRef]
- Wei, W.; Li, C.; Sun, Y.; Xu, H.; Yang, X. Investigation of the Self-Heating of Q460 Butt Joints and an S-N Curve Modeling Method Based on Infrared Thermographic Data for High-Cycle Fatigue. Metals 2021, 11, 232. [Google Scholar] [CrossRef]
- Wei Lee, H.; Fakhri, H.; Ranade, R.; Basaran, C.; Egner, H.; Lipski, A.; Piotrowski, M.; Mroziński, S. Modeling fatigue of pre-corroded body-centered cubic metals with unified mechanics theory. Mater. Design. 2022, 224, 111383. [Google Scholar] [CrossRef]
- Feng, E.; Wang, X.; Jiang, C.; Crupi, V. Quantitative thermographic method for fatigue life prediction under variable amplitude loading. Fatigue Fract. Eng. M 2022, 45, 1199–1212. [Google Scholar] [CrossRef]
- Wei, W.; Sun, Y.; Chen, M.; Zhao, X.; Tang, Y.; Zou, L.; Yang, X. Rapid fatigue life prediction of butt joint using energy dissipation. Int. J. Mech. Sci. 2023, 245, 108109. [Google Scholar] [CrossRef]
- Louge, J.; Moyne, S.; Doudard, C.; Calloch, S.; Weber, B.; Munier, R. Self-heating measurements under cyclic loading to identify history effects on HCF properties of high-strength low-alloy steel: Part II—Modeling. Fatigue Fract. Eng. M 2022, 45, 3524–3534. [Google Scholar] [CrossRef]
- Fan, J.; Zhao, Y. Quantitative thermography for fatigue damage assessment and life prediction of welded components. Mech. Mater. 2022, 164, 104120. [Google Scholar] [CrossRef]
- Hsiao Wei, L.; Cemal, B.; Halina, E.; Adam, L.; Michał, P.; Stanisław, M.; Noushad, B.J.M.; Chebolu, L.R. Modeling ultrasonic vibration fatigue with unified mechanics theory. Int. J. Solids Struct. 2022, 236–237, 111313. [Google Scholar]
- Naderi, M.; Amiri, M.; Khonsari, M. On the thermodynamic entropy of fatigue fracture. Proc. R. Soc. A Math. Phys. Eng. Sci. 2010, 466, 423–438. [Google Scholar] [CrossRef]
- Salimi, H.; Pourgol-Mohammad, M.; Yazdani, M. Metal Fatigue Assessment Based on Temperature Evolution and Thermodynamic Entropy Generation. Int. J. Fatigue 2019, 127, 403–416. [Google Scholar] [CrossRef]
- Zaeimi, M.; De Finis, R.; Palumbo, D.; Galietti, U. Fatigue limit estimation of metals based on the thermographic methods: A comprehensive review. Fatigue Fract. Eng. M 2024, 47, 611–646. [Google Scholar] [CrossRef]
- La Rosa, G.; Risitano, A. Thermographic methodology for rapid determination of the fatigue limit of materials and mechanical components. Int. J. Fatigue 2000, 22, 65–73. [Google Scholar] [CrossRef]
- Crupi, V. An Unifying Approach to assess the structural strength. Int. J. Fatigue 2008, 30, 1150–1159. [Google Scholar] [CrossRef]
- Crupi, V.; Guglielmino, E.; Maestro, M.; Marinò, A. Fatigue analysis of butt welded AH36 steel joints: Thermographic method and design S–N curve. Mar. Struct. 2009, 22, 373–386. [Google Scholar] [CrossRef]
- Fan, J.; Guo, X.; Wu, C. A new application of the infrared thermography for fatigue evaluation and damage assessment. Int. J. Fatigue 2012, 44, 1–7. [Google Scholar] [CrossRef]
- Huang, J.; Pastor, M.; Garnier, C.; Gong, X. Rapid evaluation of fatigue limit on thermographic data analysis. Int. J. Fatigue 2017, 104, 293–301. [Google Scholar] [CrossRef]
- Zhao, A.; Xie, J.; Zhao, Y.; Liu, C.; Zhu, J.; Qian, G.; Wang, S.; Hong, Y. Fatigue limit evaluation via infrared thermography for a high strength steel with two strength levels. Eng. Fract. Mech. 2022, 268, 108460. [Google Scholar] [CrossRef]
- Wu, H.; Bill, T.; Teng, Z.J.; Pramanik, S.; Hoyer, K.P.; Schaper, M.; Starke, P. Characterization of the fatigue behaviour for SAE 1045 steel without and with load-free sequences based on non-destructive, X-ray diffraction and transmission electron microscopic investigations. Mater. Sci. Eng. A 2020, 794, 139597. [Google Scholar] [CrossRef]
- Jia, Z.; Pastor, M.-L.; Garnier, C.; Gong, X. A new method for determination of fatigue limit of composite laminates based on thermographic data. Int. J. Fatigue 2023, 168, 107445. [Google Scholar] [CrossRef]
- Huang, J.; Garnier, C.; Pastor, M.; Gong, X. Investigation of self-heating and life prediction in CFRP laminates under cyclic shear loading condition based on the infrared thermographic data. Eng. Fract. Mech. 2020, 229, 106971. [Google Scholar] [CrossRef]
- Mostofizadeh, P.; Kadkhodaei, M.; Arbab Chirani, S.; Saint-Sulpice, L.; Rokbani, M.; Bouraoui, T.; Calloch, S. Fatigue analysis of shape memory alloys by self-heating method. Int. J. Mech. Sci. 2019, 156, 329–341. [Google Scholar] [CrossRef]
- Balit, Y.; Joly, L.-R.; Szmytka, F.; Durbecq, S.; Charkaluk, E.; Constantinescu, A. Self-heating behavior during cyclic loadings of 316L stainless steel specimens manufactured or repaired by Directed Energy Deposition. Mater. Sci. Eng. A 2020, 786, 139476. [Google Scholar] [CrossRef]
- Bayati, P.; Jahadakbar, A.; Barati, M.; Nematollahi, M.; Saint-Sulpice, L.; Haghshenas, M.; Chirani, S.A.; Mahtabi, M.J.; Elahinia, M. Toward low and high cycle fatigue behavior of SLM-fabricated NiTi: Considering the effect of build orientation and employing a self-heating approach. Int. J. Mech. Sci. 2020, 185, 105878. [Google Scholar] [CrossRef]
- Saint-Sulpice, L.; Legrand, V.; Arbab-Chirani, S.; Calloch, S.; Doudard, C. Fatigue life study of superelastic NiTi Shape Memory Alloys using self-heating under cyclic loading method. Int. J. Fatigue 2022, 165, 107208. [Google Scholar] [CrossRef]
- Bustos, I.; Bergant, M.; Yawny, A. On the suitability of applying thermographic methods for the rapid estimation of the fatigue limit of additively manufactured Ti-6Al-4V. Int. J. Fatigue 2023, 174, 107709. [Google Scholar] [CrossRef]
- Mehdizadeh, M.; Khonsari, M.M. On the role of internal friction in low-and high-cycle fatigue. Int. J. Fatigue 2018, 114, 159–166. [Google Scholar] [CrossRef]
- Colombo, C.; Bhujangrao, T.; Libonati, F.; Vergani, L. Effect of delamination on the fatigue life of GFRP: A thermographic and numerical study. Compos. Struct. 2019, 218, 152–161. [Google Scholar] [CrossRef]
- Cappello, R.; Meneghetti, G.; Ricotta, M.; Pitarresi, G. On the correlation of temperature harmonic content with energy dissipation in C45 steel samples under fatigue loading. Mech. Mater. 2022, 168, 104271. [Google Scholar] [CrossRef]
- Krapez, J.; Pacou, D.; Gardette, G. Lock-in thermography and fatigue limit of metals. Quant. Infrared Thermogr. 2000, 5, 277–282. [Google Scholar]
- Bremond, P.; Potet, P. Lock-in thermography: A tool to analyze and locate thermomechanical mechanisms in materials and structures. Proc. SPIE Int. Soc. Opt. Eng. 2001, 4360, 560–566. [Google Scholar] [CrossRef]
- Colombo, C.; Vergani, L. Thermographic applications for the rapid estimation of fatigue limit. Procedia Struct. Integr. 2019, 24, 658–666. [Google Scholar] [CrossRef]
- De Finis, R.; Palumbo, D.; Galietti, U. A multianalysis thermography-based approach for fatigue and damage investigations of ASTM A182 F6NM steel at two stress ratios. Fatigue Fract. Eng. M 2019, 42, 267–283. [Google Scholar] [CrossRef]
- Meneghetti, G.; Ricotta, M. Estimating the intrinsic dissipation using the second harmonic of the temperature signal in tension-compression fatigue: Part I. Theory. Fatigue Fract. Eng. M 2021, 44, 2168–2185. [Google Scholar] [CrossRef]
- Ricotta, M.; Meneghetti, G. Estimating the intrinsic dissipation using the second-harmonic temperature signal in the tension–tension fatigue. Fatigue Fract. Eng. M 2023, 46, 4218–4238. [Google Scholar] [CrossRef]
- Guo, Q.; Guo, X.; Fan, J.; Syed, R.; Wu, C. An energy method for rapid evaluation of high-cycle fatigue parameters based on intrinsic dissipation. Int. J. Fatigue 2015, 80, 136–144. [Google Scholar] [CrossRef]
- Fan, J.; Zhao, Y.; Guo, X. A unifying energy approach for high cycle fatigue behavior evaluation. Mech. Mater. 2018, 120, 15–25. [Google Scholar] [CrossRef]
- Teng, Z.; Wu, H.; Boiler, C.; Starke, P. A unified fatigue life calculation based on intrinsic thermal dissipation and microplasticity evolution. Int. J. Fatigue 2020, 131, 105370. [Google Scholar] [CrossRef]
- Haghshenas, A.; Jang, J.; Khonsari, M. On the intrinsic dissipation and fracture fatigue entropy of metals. Mech. Mater. 2021, 155, 103734. [Google Scholar] [CrossRef]
- Yang, W.; Guo, Q.; Fan, J.; Guo, X.; Zhao, Y. Effect of aging temperature on energy dissipation and high-cycle fatigue properties of FV520B stainless steel. Eng. Fract. Mech. 2021, 242, 107464. [Google Scholar] [CrossRef]
- Li, A.; Huang, J.; Zhang, C. Enabling rapid fatigue life prediction of short carbon fiber reinforced polyether-ether-ketone using a novel energy dissipation–based model. Compos. Struct. 2021, 272, 114227. [Google Scholar] [CrossRef]
- Zhang, H.; Li, C.; Song, W.; He, N.; Wang, F.; Zhang, Y. Fatigue life evaluation and cellular substructure role of laser powder bed fused 304L steel based on dissipative deformation mechanisms. Addit. Manuf. 2023, 64, 103430. [Google Scholar] [CrossRef]
- Schaefer, F.; Rosar, J.; Wu, H.; Starke, P.; Marx, M. Obtaining a lower estimate of the fatigue limit of metals by a simplified quantitative thermometric approach in a low-cost one-specimen test. Int. J. Fatigue 2022, 159, 106729. [Google Scholar] [CrossRef]
- Jang, J.; Khonsari, M. On the evaluation of fracture fatigue entropy. Theor. Appl. Fract. Mech. 2018, 96, 351–361. [Google Scholar] [CrossRef]
- Nourian-Avval, A.; Khonsari, M. Rapid prediction of fatigue life based on thermodynamic entropy generation. Int. J. Fatigue 2021, 145, 106105. [Google Scholar] [CrossRef]
- Meneghetti, G. Analysis of the fatigue strength of a stainless steel based on the energy dissipation. Int. J. Fatigue 2007, 29, 81–94. [Google Scholar] [CrossRef]
- Meneghetti, G.; Ricotta, M.; Atzori, B. A synthesis of the push-pull fatigue behaviour of plain and notched stainless steel specimens by using the specific heat loss. Fatigue Fract. Eng. M 2013, 36, 1306–1322. [Google Scholar] [CrossRef]
- Meneghetti, G.; Ricotta, M. The use of the specific heat loss to analyse the low- and high-cycle fatigue behaviour of plain and notched specimens made of a stainless steel. Eng. Fract. Mech. 2012, 81, 2–16. [Google Scholar] [CrossRef]
- Meneghetti, G.; Ricotta, M.; Atzori, B. A two-parameter, heat energy-based approach to analyse the mean stress influence on axial fatigue behaviour of plain steel specimens. Int. J. Fatigue 2016, 82, 60–70. [Google Scholar] [CrossRef]
- Yang, W.P.; Fan, J.L.; Guo, Q.; Guo, X.L. Experimental Procedure for Energy Dissipation Estimation during High-Cycle Fatigue Loading of Metallic Material. Exp. Mech. 2020, 60, 695–712. [Google Scholar] [CrossRef]
- Huang, J.; Li, C.; Liu, W. Investigation of internal friction and fracture fatigue entropy of CFRP laminates with various stacking sequences subjected to fatigue loading. Thin Walled Struct. 2020, 155, 106978. [Google Scholar] [CrossRef]
- Amooie, M.A.; Khonsari, M.M. On the effect of environmental temperature on fracture fatigue entropy. Int. J. Fatigue 2023, 168, 107411. [Google Scholar] [CrossRef]
- Mehdizadeh, M.; Khonsari, M.M. On the application of fracture fatigue entropy to multiaxial loading. Int. J. Fatigue 2021, 150, 106321. [Google Scholar] [CrossRef]
- Teng, Z.; Wu, H.; Boller, C.; Starke, P. Thermodynamic entropy as a marker of high-cycle fatigue damage accumulation: Example for normalized SAE 1045 steel. Fatigue Fract. Eng. M 2020, 43, 1–13. [Google Scholar] [CrossRef]
- Hebert, J.; Khonsari, M.M. Effect of surface roughness and polishing orientation on fatigue life and fracture fatigue entropy. Fatigue Fract. Eng. M 2024, 47, 1514–1530. [Google Scholar] [CrossRef]
- Guo, Q.; Zaïri, F.; Yang, W. Evaluation of intrinsic dissipation based on self-heating effect in high-cycle metal fatigue. Int. J. Fatigue 2020, 139, 105653. [Google Scholar] [CrossRef]


| Method | Indices | Determination of the Turning Point | Authors | Using the Standard of R2 |
|---|---|---|---|---|
| Temperature-based methods | Stabilized temperature increment | bi-linear | LaRosa and Risitano [38] Luong [13] | No |
| non-linear threshold | Mostofizadeh et al. [47] Pirinu et al. [25] Balit et al. [48] Louge et al. [33] | No | ||
| Initial temperature rise slope | bi-linear | Mehdizadeh et al. [52] Colombo et al. [53] | No | |
| non-linear threshold | ||||
| Harmonic amplitude | bi-linear | |||
| non-linear threshold | Cappello et al. [54] | No | ||
| Energy-based methods | Based on the stabilized temperature | bi-linear | Guo et al. [61] Fan et al. [62] Haghshenas et al. [64] Yang et al. [65] | No |
| bi-linear | Wei et al. [32] Li et al. [66] Zhang et al. [67] | Yes | ||
| non-linear threshold | ||||
| Based on the initial temperature rise slope | bi-linear | Jang et al. [69] | No | |
| non-linear threshold | Nourian et al. [70] | No | ||
| Based on a sudden stop of temperature rise in Phase II | bi-linear | Meneghetti et al. [71,72,73,74] | No | |
| non-linear threshold | Huang et al. [76] | Yes | ||
| Entropy-based methods | Based on the initial temperature rise slope | bi-linear | Mehdizadeh and Khonsari [52] Nourian and Khonsari [70] Amooie and Khonsari [77] Mehdizadeh and Khonsari [78] | No |
| non-linear threshold | ||||
| Based on stable temperature rise increment | bi-linear | Teng et al. [79] | No | |
| Wei et al. [80] | Yes | |||
| non-linear threshold | ||||
| Based on a sudden stop after stable rise process | bi-linear | Hebert and Khonsari [26] | No | |
| non-linear threshold | Huang et al. [76] | Yes |
Disclaimer/Publisher’s Note: The statements, opinions and data contained in all publications are solely those of the individual author(s) and contributor(s) and not of MDPI and/or the editor(s). MDPI and/or the editor(s) disclaim responsibility for any injury to people or property resulting from any ideas, methods, instructions or products referred to in the content. |
© 2024 by the authors. Licensee MDPI, Basel, Switzerland. This article is an open access article distributed under the terms and conditions of the Creative Commons Attribution (CC BY) license (https://creativecommons.org/licenses/by/4.0/).
Share and Cite
Wei, W.; He, L.; Sun, Y.; Yang, X. A Review of Fatigue Limit Assessment Using the Thermography-Based Method. Metals 2024, 14, 640. https://doi.org/10.3390/met14060640
Wei W, He L, Sun Y, Yang X. A Review of Fatigue Limit Assessment Using the Thermography-Based Method. Metals. 2024; 14(6):640. https://doi.org/10.3390/met14060640
Chicago/Turabian StyleWei, Wei, Lei He, Yang Sun, and Xinhua Yang. 2024. "A Review of Fatigue Limit Assessment Using the Thermography-Based Method" Metals 14, no. 6: 640. https://doi.org/10.3390/met14060640
APA StyleWei, W., He, L., Sun, Y., & Yang, X. (2024). A Review of Fatigue Limit Assessment Using the Thermography-Based Method. Metals, 14(6), 640. https://doi.org/10.3390/met14060640