Article

Failure Mechanism of Rear Drive Shaft in a Modified Pickup Truck

1
State Key Laboratory of Performance Monitoring and Protecting of Rail Transit Infrastructure, East China Jiaotong University, Nanchang 330013, China
2
Jiangxi Jiangling Chassis Co., Ltd., Fuzhou 344000, China
*
Author to whom correspondence should be addressed.
Metals 2024, 14(6), 641; https://doi.org/10.3390/met14060641
Submission received: 10 April 2024 / Revised: 24 May 2024 / Accepted: 26 May 2024 / Published: 28 May 2024
(This article belongs to the Special Issue Failure of Metals: Fracture and Fatigue of Metallic Materials)

Abstract

:
This paper investigates the failure mechanism of the rear drive shaft in a modified pickup truck which had operated for about 3000 km. The investigation included macroscopic and microscopic evaluation to document the morphologies of the fracture surface, measurement of the material composition, metallographic preparation and examination, mechanical testing, and finite element modelling and calculations. The results obtained suggest that rotation-bending fatigue was the primary cause of the drive shaft failure. The crack initiation is located in the root of the machined threads on the drive shaft surface and expanded along the side of the machining line surface. The main cause of fatigue cracks is attributable to a high stress concentration owing to a large unilateral bending impact under overload. Meanwhile, the bidirectional torsional force also produces a higher stress concentration and thus accelerates the fatigue crack to expand radially along the surface. Furthermore, the hardness of the central section of the drive shaft was marginally below standard. This deficiency results in harm to the bearings and other mechanical components, as well as expediting the enlargement of cracks. Finite element analysis revealed significant contact stress between the bearing and drive shaft, with stress levels exceeding the fatigue limit stress of the parent material. This highlights the need for reevaluation of the heat treatment process and vehicle loading quality to enhance the drive shaft’s longevity.

1. Introduction

Shaft components are one of the most critical parts of mechanical drive systems and are widely used in various industrial scenarios such as automotive manufacturing, aerospace, and wind power generation. It is extremely important to fundamentally analyze the failure modes of drive shafts due to their catastrophic effects.
Drive shafts, being essential elements responsible for transmitting torque within mechanical systems, need to possess the capacity to endure cyclic loading, and they must have good fatigue properties. Fatigue fracture, as the most common failure mechanism for shafts, can be directly caused by geometric design errors [1]. In the design of drive shafts, a mismatch of geometrical parameters can lead to localized stress concentration, which can trigger fatigue damage in low, high, or alternating stress environments, thus leading to shaft failure, so stress concentration due to localized features should be avoided in the design [2,3,4,5,6,7,8]. Wang et al. [9] proposed three kinds of current paths for IGBT inverter-powered locomotive and rolling stock bearing failures, which were analyzed theoretically and tested in the laboratory to investigate the root causes of the failures. For electrochemical corrosion fatigue, the basis for recognizing galvanic corrosion such as galvanic corrosion pits and washboards and the corresponding measures to prevent the failure of bogie bearings were proposed. Zhang et al. [10] studied a spiral shaft that failed after six years of use. The results showed that severe stress concentration due to structural discontinuities such as small radii in the transition section and surface roughness was the main cause of crack initiation and extension. Ntritsos et al. [11] investigated the effect of adjacent steps and keyways on DIN CK45 shafts. Xu et al. [12] carried out the failure investigation of locomotive turbocharger spindles. The fracture showed that rotary bending fatigue was the main cause of failure of the spindles. The root fillet of the groove was too small in radius, which resulted in stress concentration and accelerated the fatigue cracks generated in the root fillet region. Ghosh et al. [13] investigated the early failure of a water pump rotor shaft. The results showed that the failure of this shaft was due to torsional fatigue caused by cracks at the root of the threads. Sitthipong et al. [14] performed a failure analysis of a marine metal alloy propeller shaft. The results showed that the geometry of the rounded corners promoted cracks due to poor design of the rounded corners. Yu et al. [15] investigated a cardan shaft that fractured after 360 h of test run, and the fracture morphology showed that the failure mechanism of the cardan shaft was multi-source fatigue fracture.
Alloy steel is generally chosen as the material for manufacturing axle components and substandard material properties can also lead to premature failure [16,17,18,19]. Huda et al. [20] studied the cause of fracture of a front wheel axle of an automobile, and found that the damage to this shaft was caused by shear stresses. In the manufacture of transmission shafts, it is recommended that 25CrMo4/27CD4 type steel be used to meet the requirements of modern automobiles.
Shaft components are subjected to a variety of processes during machining, so the level of manufacturing process also directly affects the mechanical properties of shafts and indirectly influences the failure behavior of shafts [21,22,23,24,25]. Hou et al. [26] analyzed a fractured shaft in a three-way force loading test. The results showed that the failure mechanism of the shaft was fatigue fracture caused by hydrogen-induced intergranular microcracks. And the hydrogen-induced cracks were mainly caused by abnormal pickling during the production process. Nassef et al. [27] studied the failure of rocker arm shafts in passenger cars. The results showed that uneven cooling during quenching in the heat treatment process caused cracks in the failed shaft, and due to the low fracture toughness of martensite, the rapid expansion of the cracks led to premature failure. Nguyen et al. [28] determined the cause of failure of a solid bowl centrifuge conveyor shaft. Muhammad et al. [29] carried out a detailed study of a failed shaft of a water circulating pump in an industrial unit. In modern manufacturing, components are calculated using finite element tools to see if they are up to standard before they are put into use, and shafts as critical components are no exception [30,31,32,33].
Extreme loads and environments can also cause premature destruction of the drive shaft that can disrupt stable operating conditions, such as axial forces, bending loads, torsional loads, or a combination of these loads causing failure [34,35]. Da et al. [36] investigated the effect of steady state torsion on fatigue crack extension under rotating bending conditions. The effect of constant torsion on crack extension retardation was discussed. These authors also explained the effect on fatigue crack extension under mixed mode loading when steady torsion is applied to rotational bending.
Damage to shaft components during use can result in serious consequences. Therefore, it is very important to analyze the premature failure of drive shafts in engineering examples, reveal its mechanism, and on this basis further optimize the design and processing technology of drive shafts. This study presents the failure mechanism of a pick-up truck that experienced a fractured drive shaft after driving 3000 km following modification. The occurrence of such damage in large-scale production has been documented only once. In order to investigate the drive shaft, multiple methodologies were implemented, extensively referencing the research findings of other esteemed scholars. Multi-condition analyses were performed in finite element simulations to expand the potential loads to which the vehicle may be subjected during operation. The influence of multiple load combinations on the drive shaft fracture behavior and mechanism was thoroughly taken into account. By identifying the types of failures and underlying mechanisms, several recommendations are made to effectively minimize the occurrence of future drive shaft failures.

2. Materials and Methods

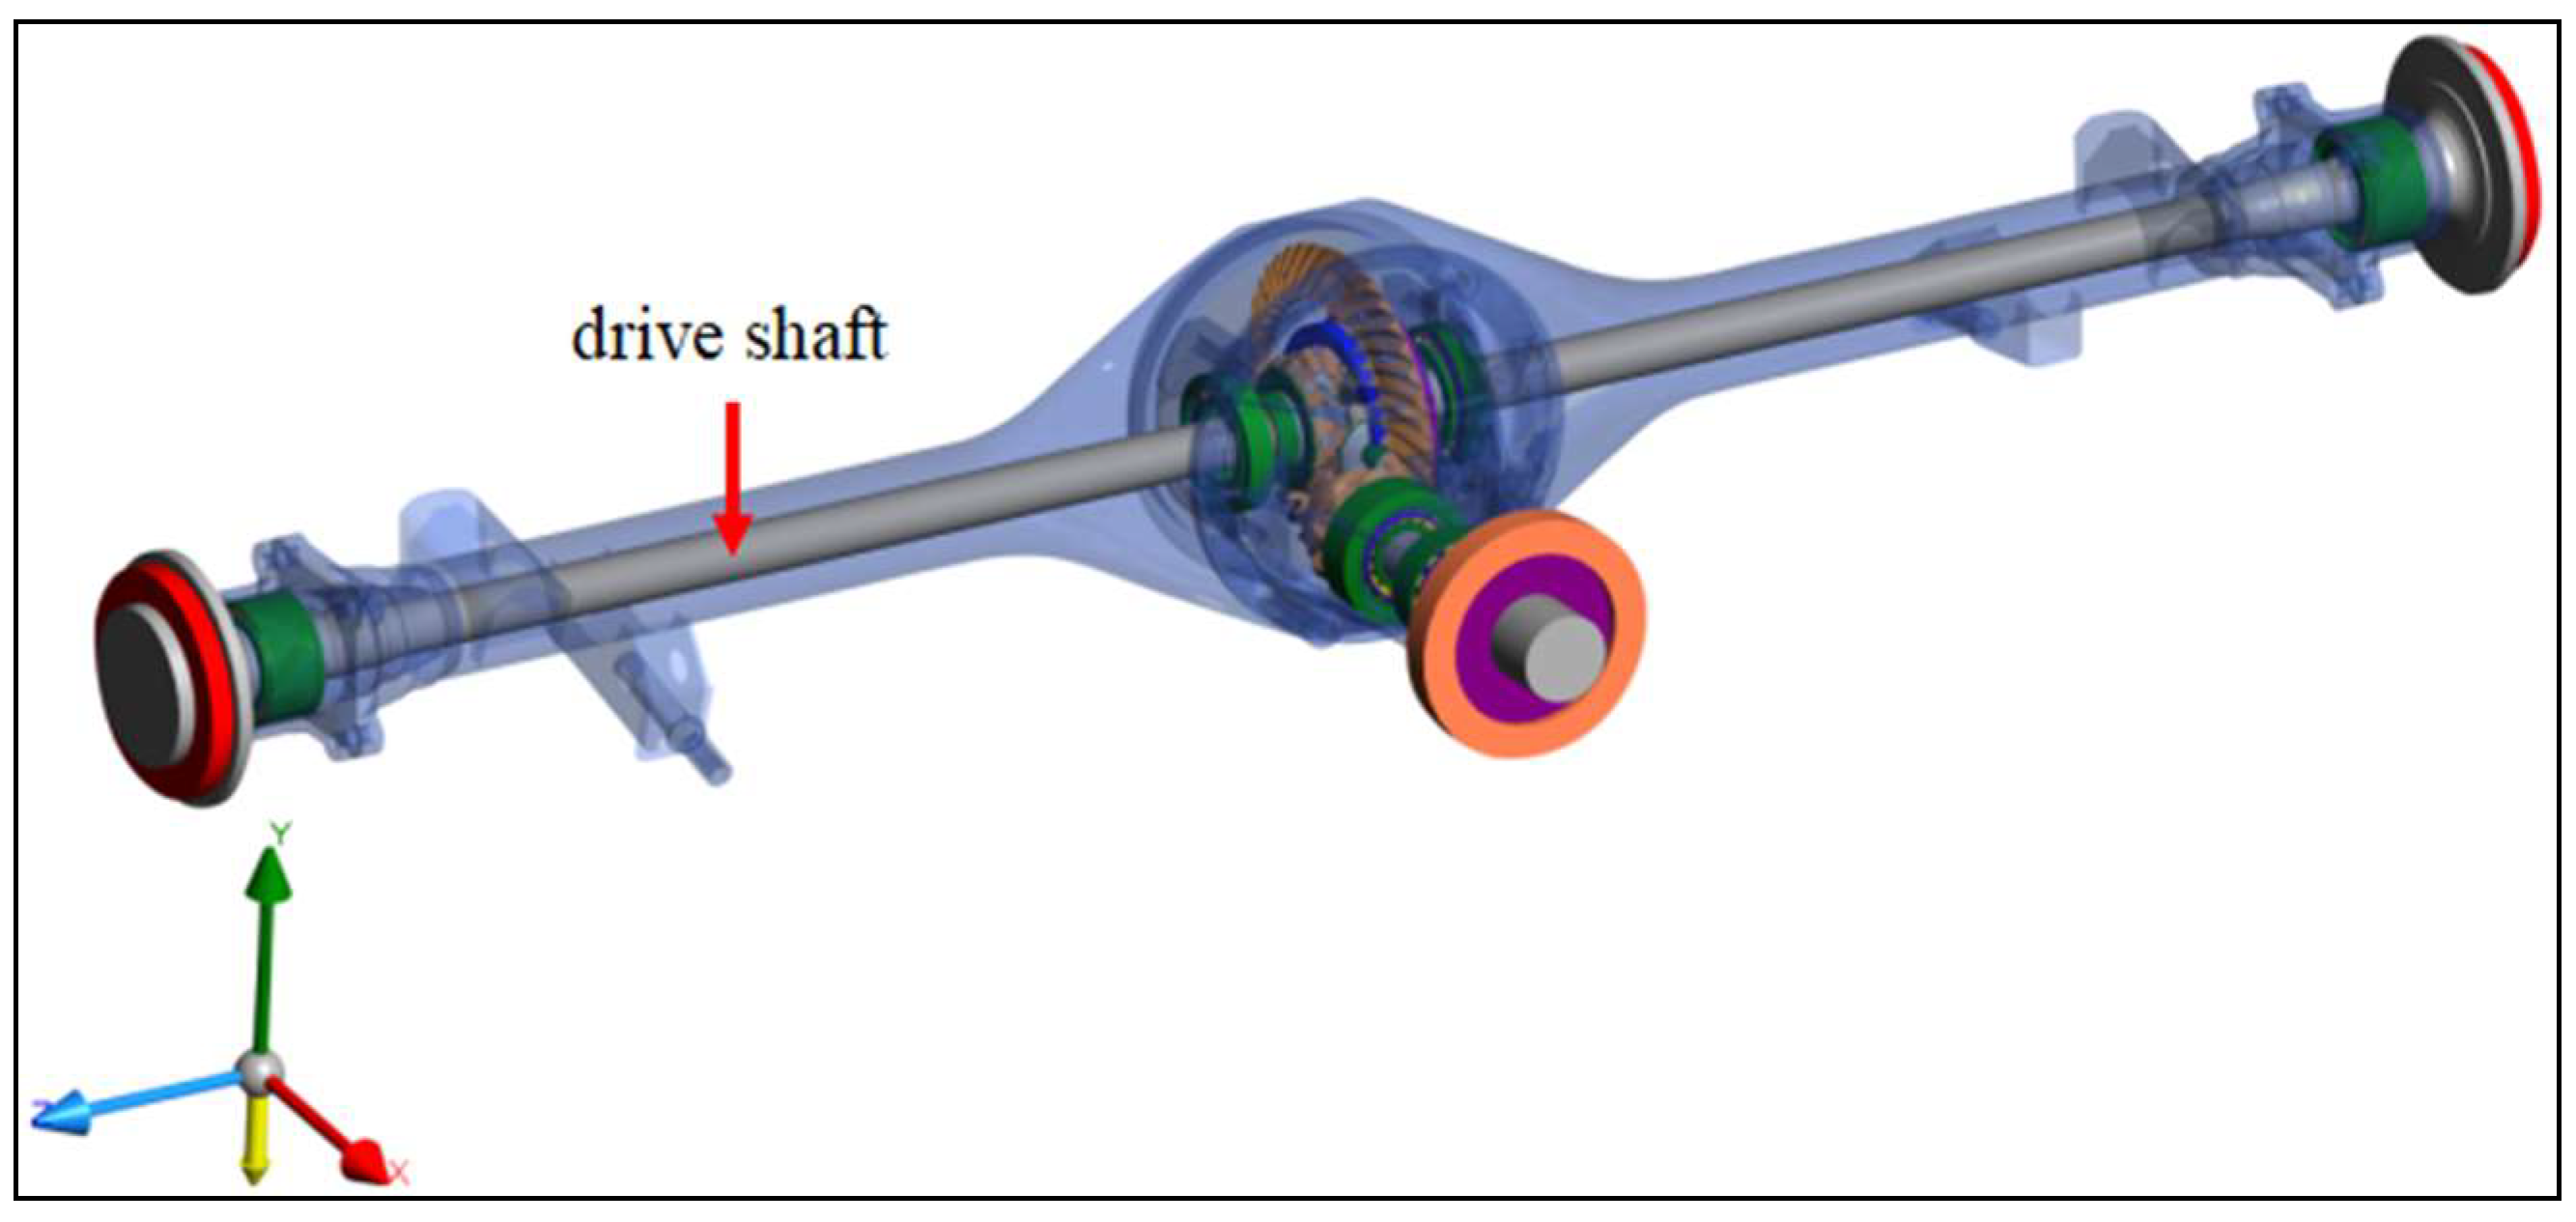
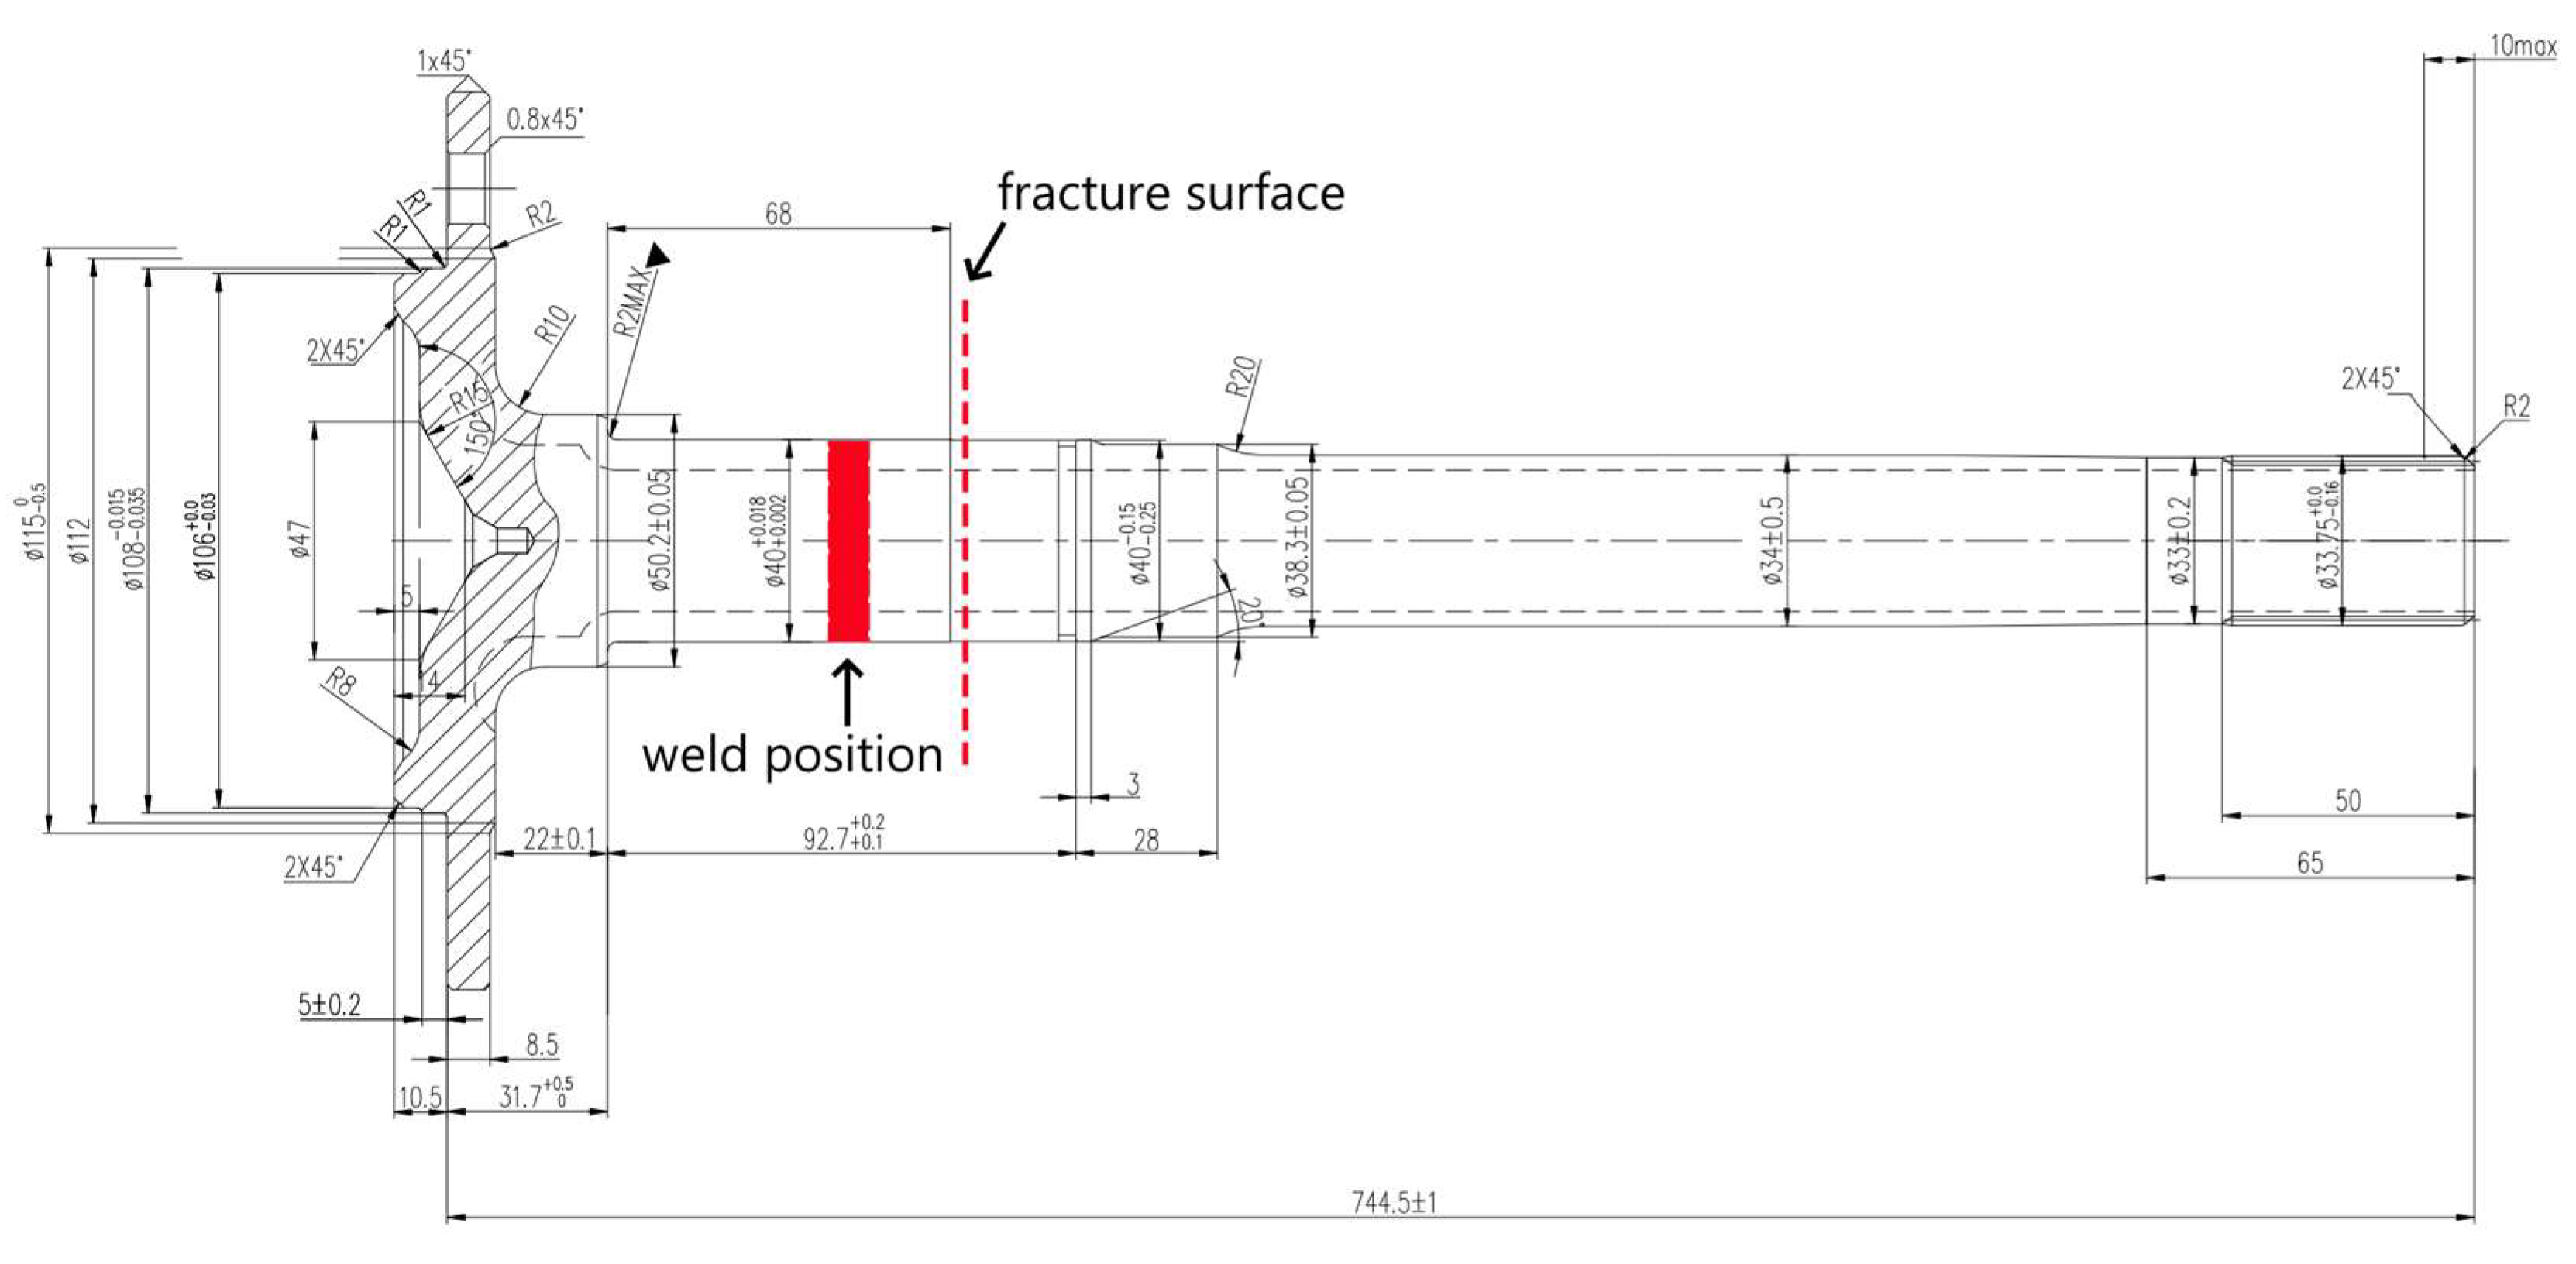
2.1. Drive Shaft and Failure Description

The drive axle assembly is the pivotal system within the automobile chassis and encompasses various components such as the drive axle housing, the main reducer, the differential, the drive shaft, and the wheel reducer. The transmission device mainly includes the main reducing driving gear, the main reducing driven gear, the differential planetary mechanism planet gear, the drive shaft gear, and the wheel planetary reducing planet gear [37]. Figure 1 illustrates the positioning of the drive shaft within the drive axle assembly. The right end of the drive shaft is connected to the differential bearing via an involute spline and gear, while the left end is linked to the rim to transfer the torsional moment. The geometrical parameters of the drive shaft are shown in Figure 2.
The drive shaft consists of 40Cr steel, a material widely used in the manufacture of heavy-duty structural and transmission components for its outstanding strength and fatigue resistance. In Figure 3, the fracture of the drive shaft is depicted. The fracture occurred near the left flange weld during vehicle operation, with residual structures visible on the fracture side.
Upon examination, the fracture exhibited marked wear and a deepened coloration, while no distinct contact or compression marks were discernible, and there were no observed scratches or indications of harm on the splines’ and shaft’s surfaces from drive shaft utilization.

2.2. Investigation Method

To investigate the exact cause of the broken drive shaft, analysis was performed in four parts: fracture surface observation; material verification; mechanical properties test; and finite element analysis. The subsequent sections provide a detailed account of each aforementioned aspect.

2.2.1. Fracture Surface Examination

The origin of the fracture was identified through the macroscopic morphology of the fractured shaft. To enhance the examination of its internal structure, a section of the drive shaft was cut 50 mm away from the fracture, as depicted in Figure 4.
The sample was sectioned and cleaned using ultrasonic technology. A Quanta 200 scanning electron microscope (SEM) was used to analyze the microscopic morphology close to the crack source. In the end, the failure mode and fracture mechanism were identified.

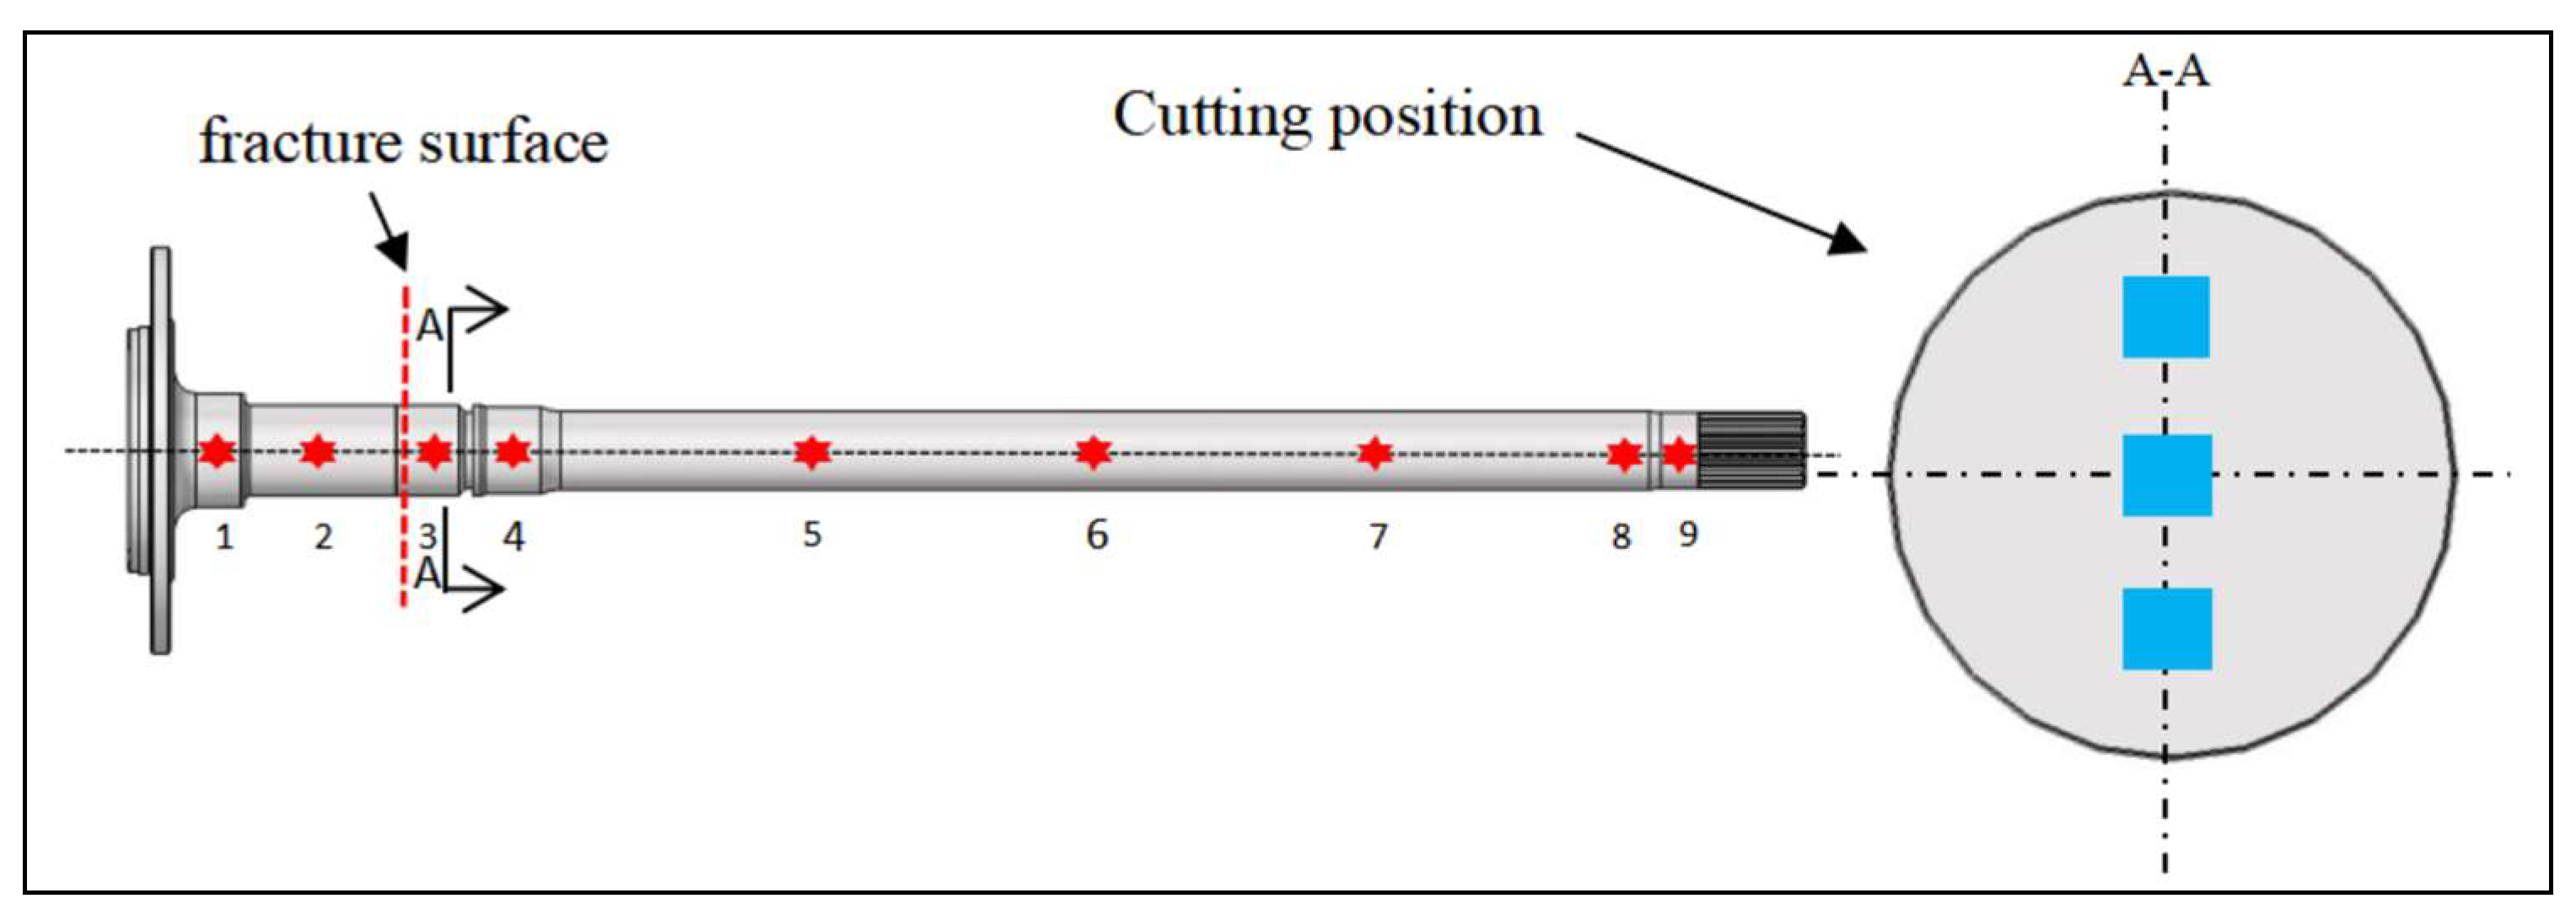
2.2.2. Material Inspection

An investigation was conducted to confirm the suitability of the drive shaft material in terms of its chemical composition. Energy dispersive spectroscopy (EDS) was used to analyze the chemical composition of samples that were taken from the fractured drive shaft surfaces. To observe the fracture, three specimens were taken from the outermost section to the inner core in a radial direction, as depicted in Figure 4. Subsequently, these specimens were treated with a 4% nitric acid alcohol solution for metallographic observation.

2.2.3. Mechanical Properties
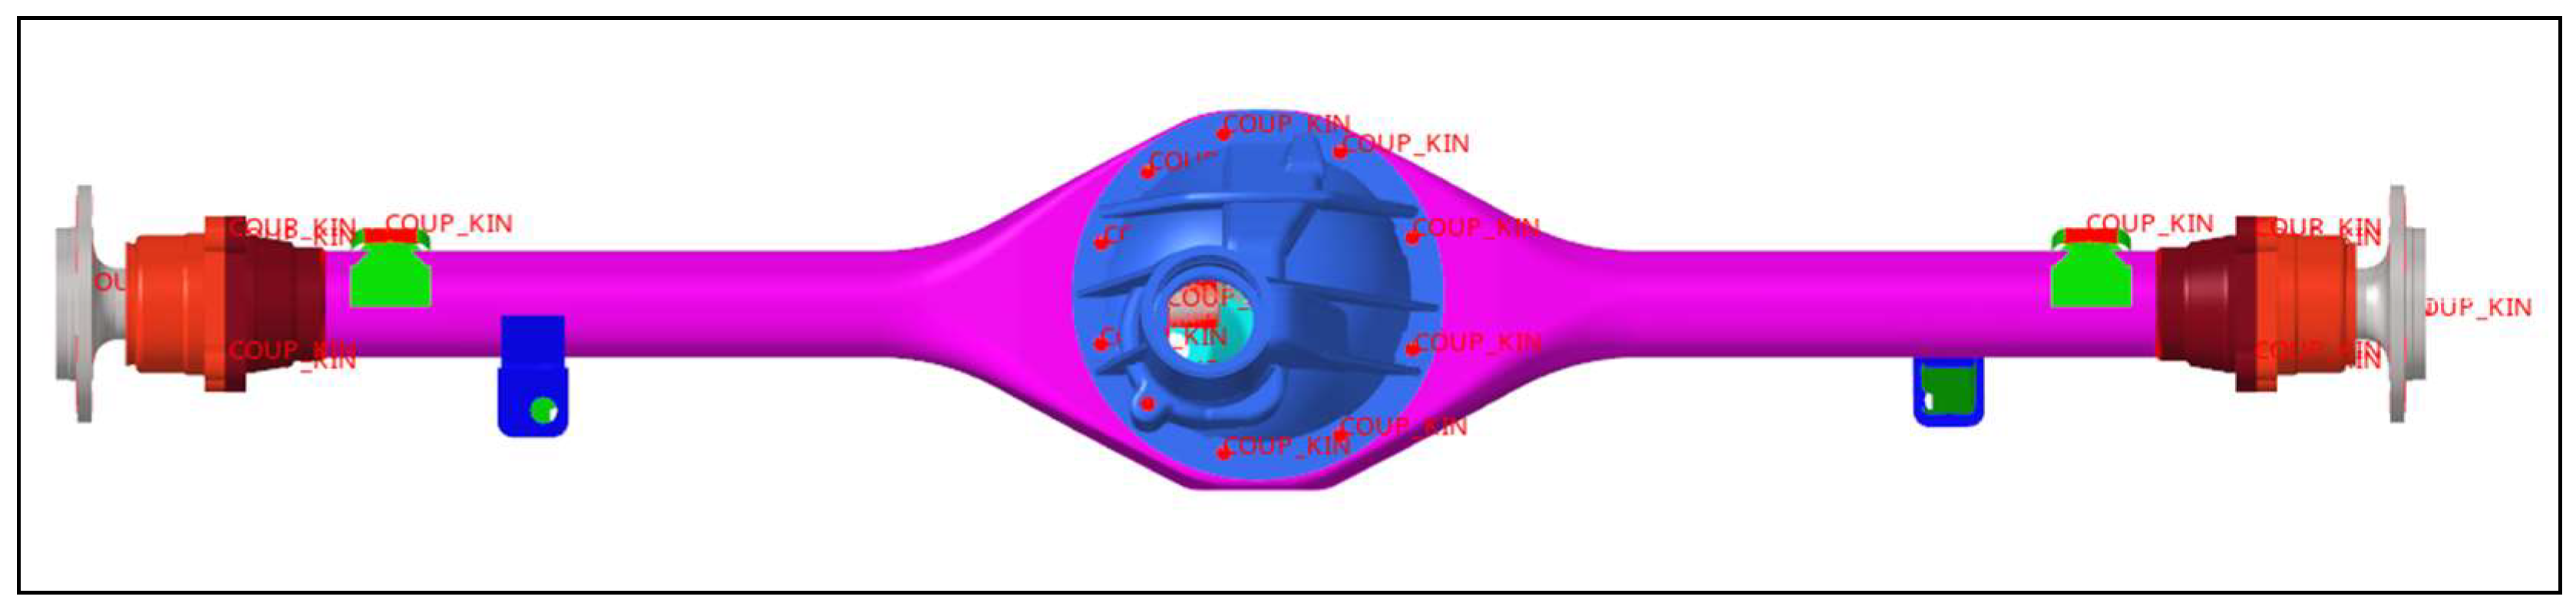
The mechanical properties of the drive shaft, including its design and material, play a significant role in determining its performance within the device assembly. Consequently, it becomes imperative to subject the fractured shaft to tensile and impact tests. Three specimens were machined after sampling from the core of the drive shaft, and then standard dumbbell-shaped tensile samples were made and sandpapered on the surface. Tensile tests were carried out using a tensile testing machine from MTS Systems, USA, which has a maximum loading capacity of 100 kN, as shown in Figure 5. The test was carried out in a 10–35-degree Celsius room-temperature environment. A strain rate of 6.7 × 10⁻³/s was used for the determination of tensile strength and elongation at break.
Additionally, hardness measurements were conducted on both the surface and core of the fractured shaft at corresponding locations, as shown in Figure 4. The microhardness testing was carried out using the HXD-1000TMB/LCD microhardness tester. To ensure accurate results, the specimen’s upper and lower surfaces were made parallel through mechanical grinding and polishing before testing. A load of 0.5 kgf was applied for a holding time of 10 s. The experimental data was then averaged to obtain the micro-Vickers hardness value, which was subsequently converted to Rockwell hardness.

2.2.4. CAE Analysis

The 3D model was created using Hyperworks 2019 software, and meticulous refinement of the grid was implemented at both the weld joint and the flange disc end as shown in Figure 6. There are two types of mesh: one is the shell section, such as axle housing and leaf spring seats, and the other is the solid section, such as the drive shaft [38]. In this paper, a right triangle mesh with a size of 2.0 is set to divide the shell parts, and a tetrahedral mesh is used to divide the solid cells. A total of 388,141 nodes and 1,577,450 mesh cells are delineated. In the finite element model, the connection of the gearbox housing to the axle housing and the connection of the drive shaft to the axle head is simplified using the 1D connection unit COUP-KIN.
In order to analyze the failure process of the drive shaft, the commercial software MASTA 11 and the ABAQUS 2019 platform were utilized. The CAE involved the drive axle assembly, which included simulations for vertical bending, side slip, and vertical impact overload.

3. Results

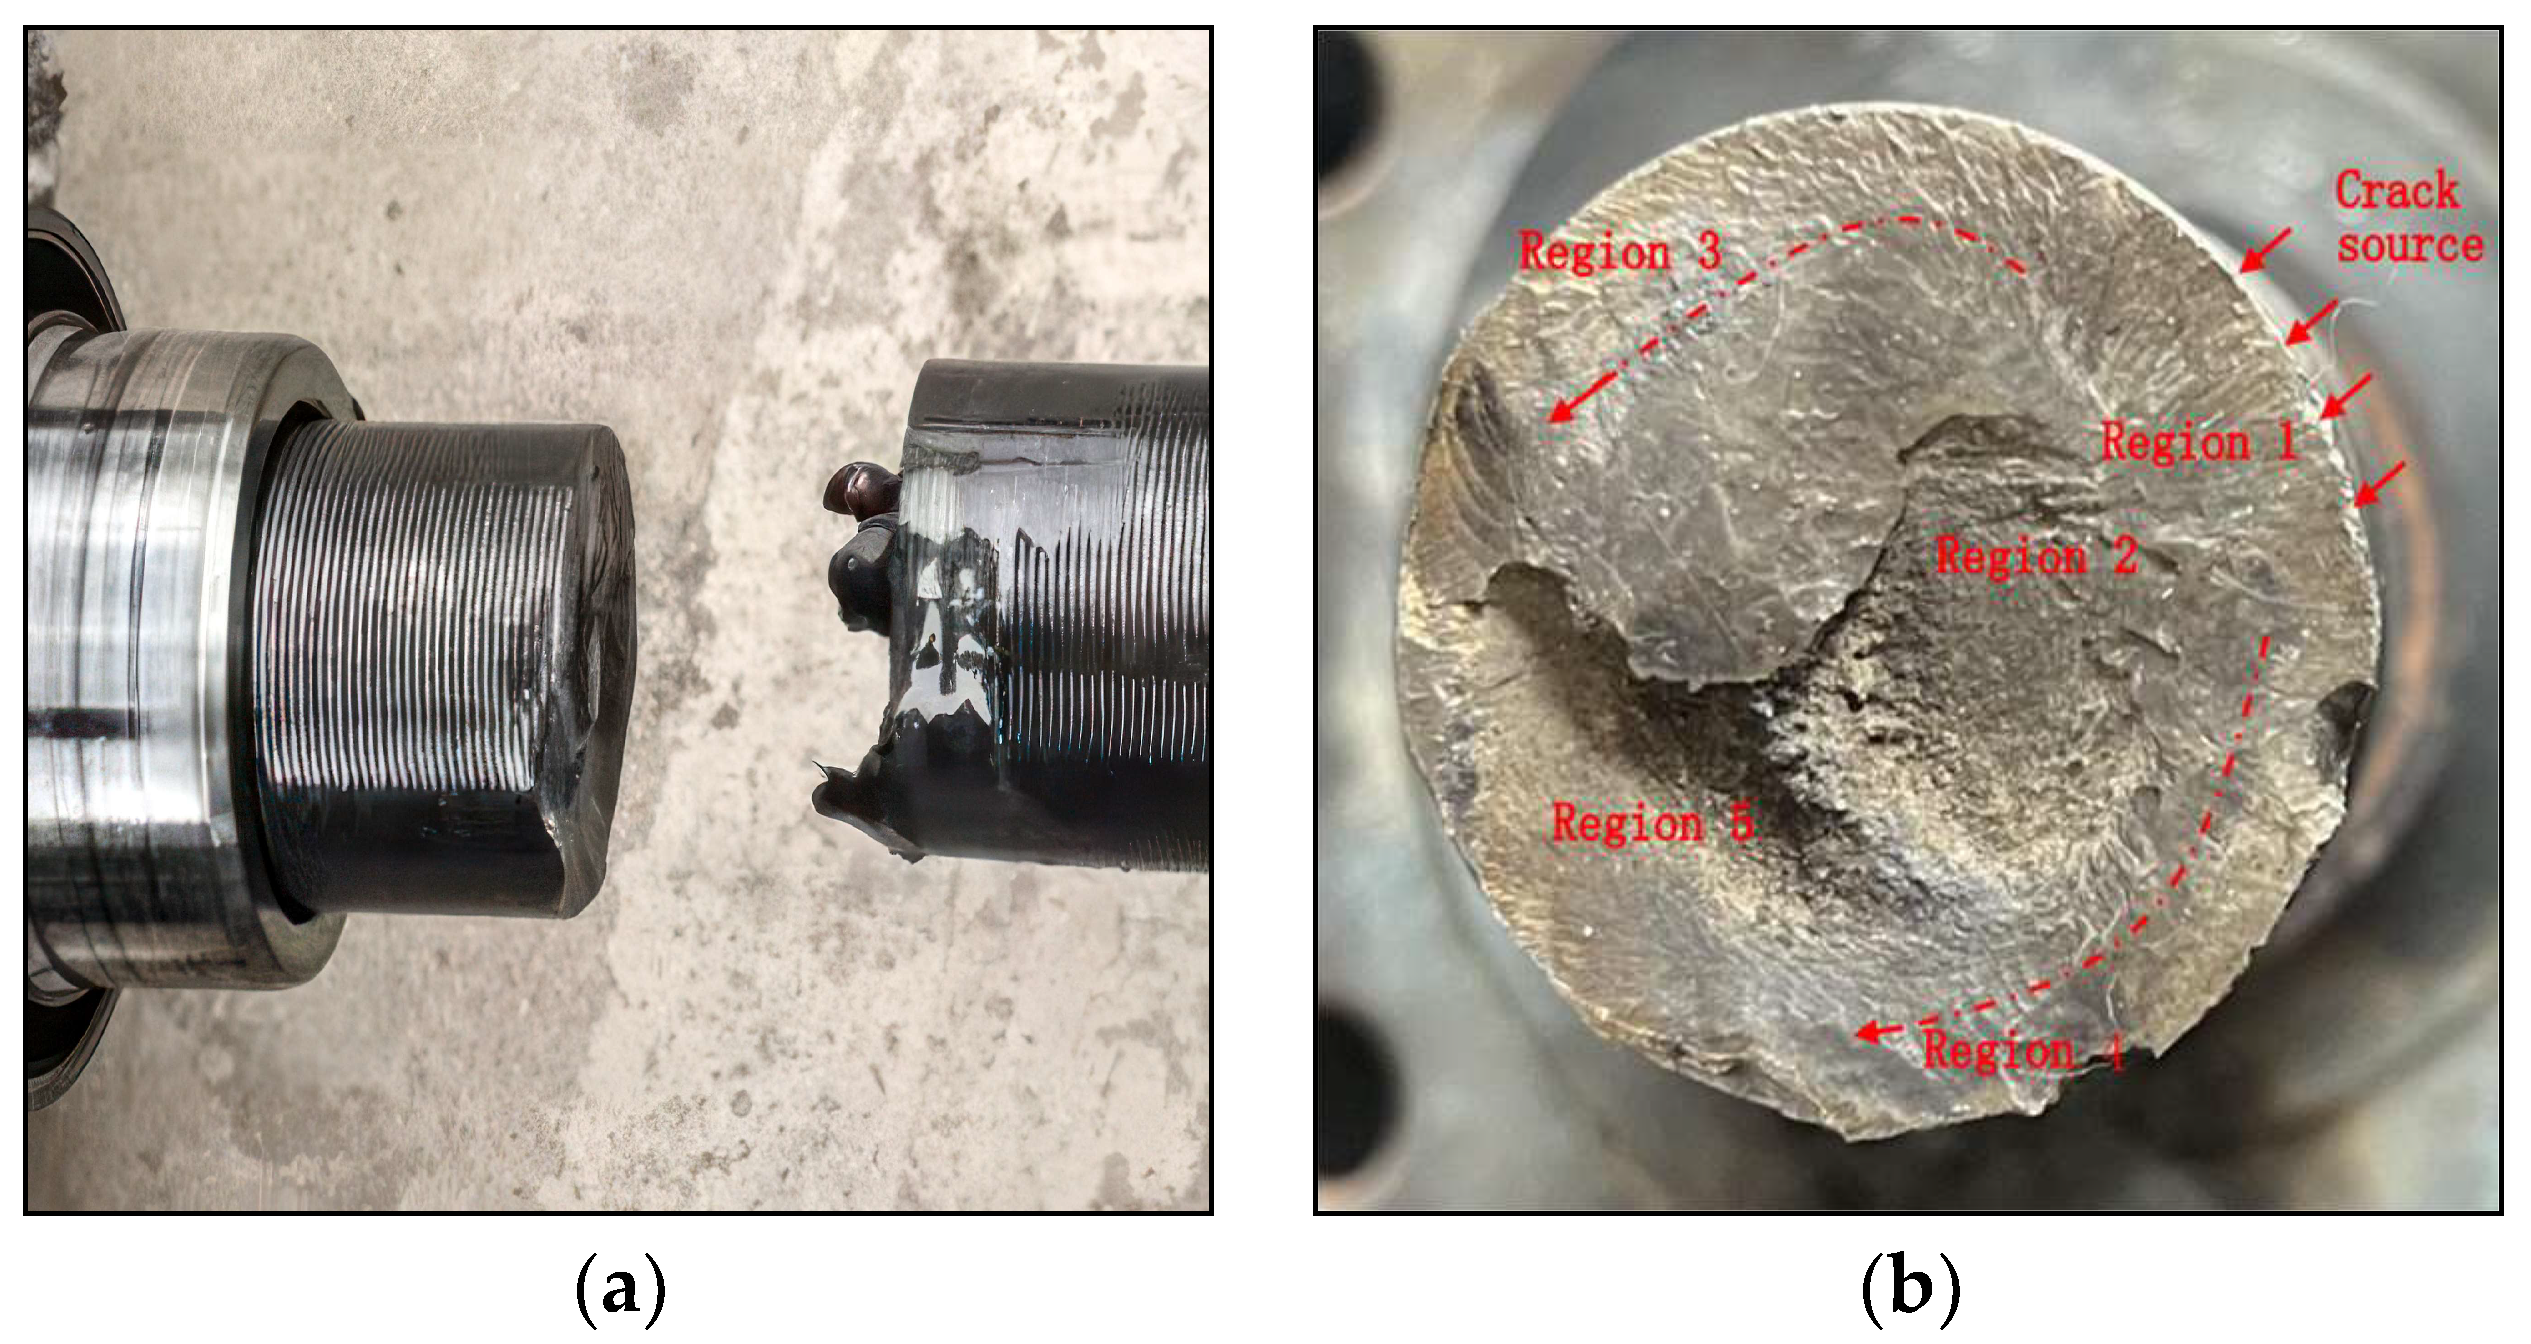
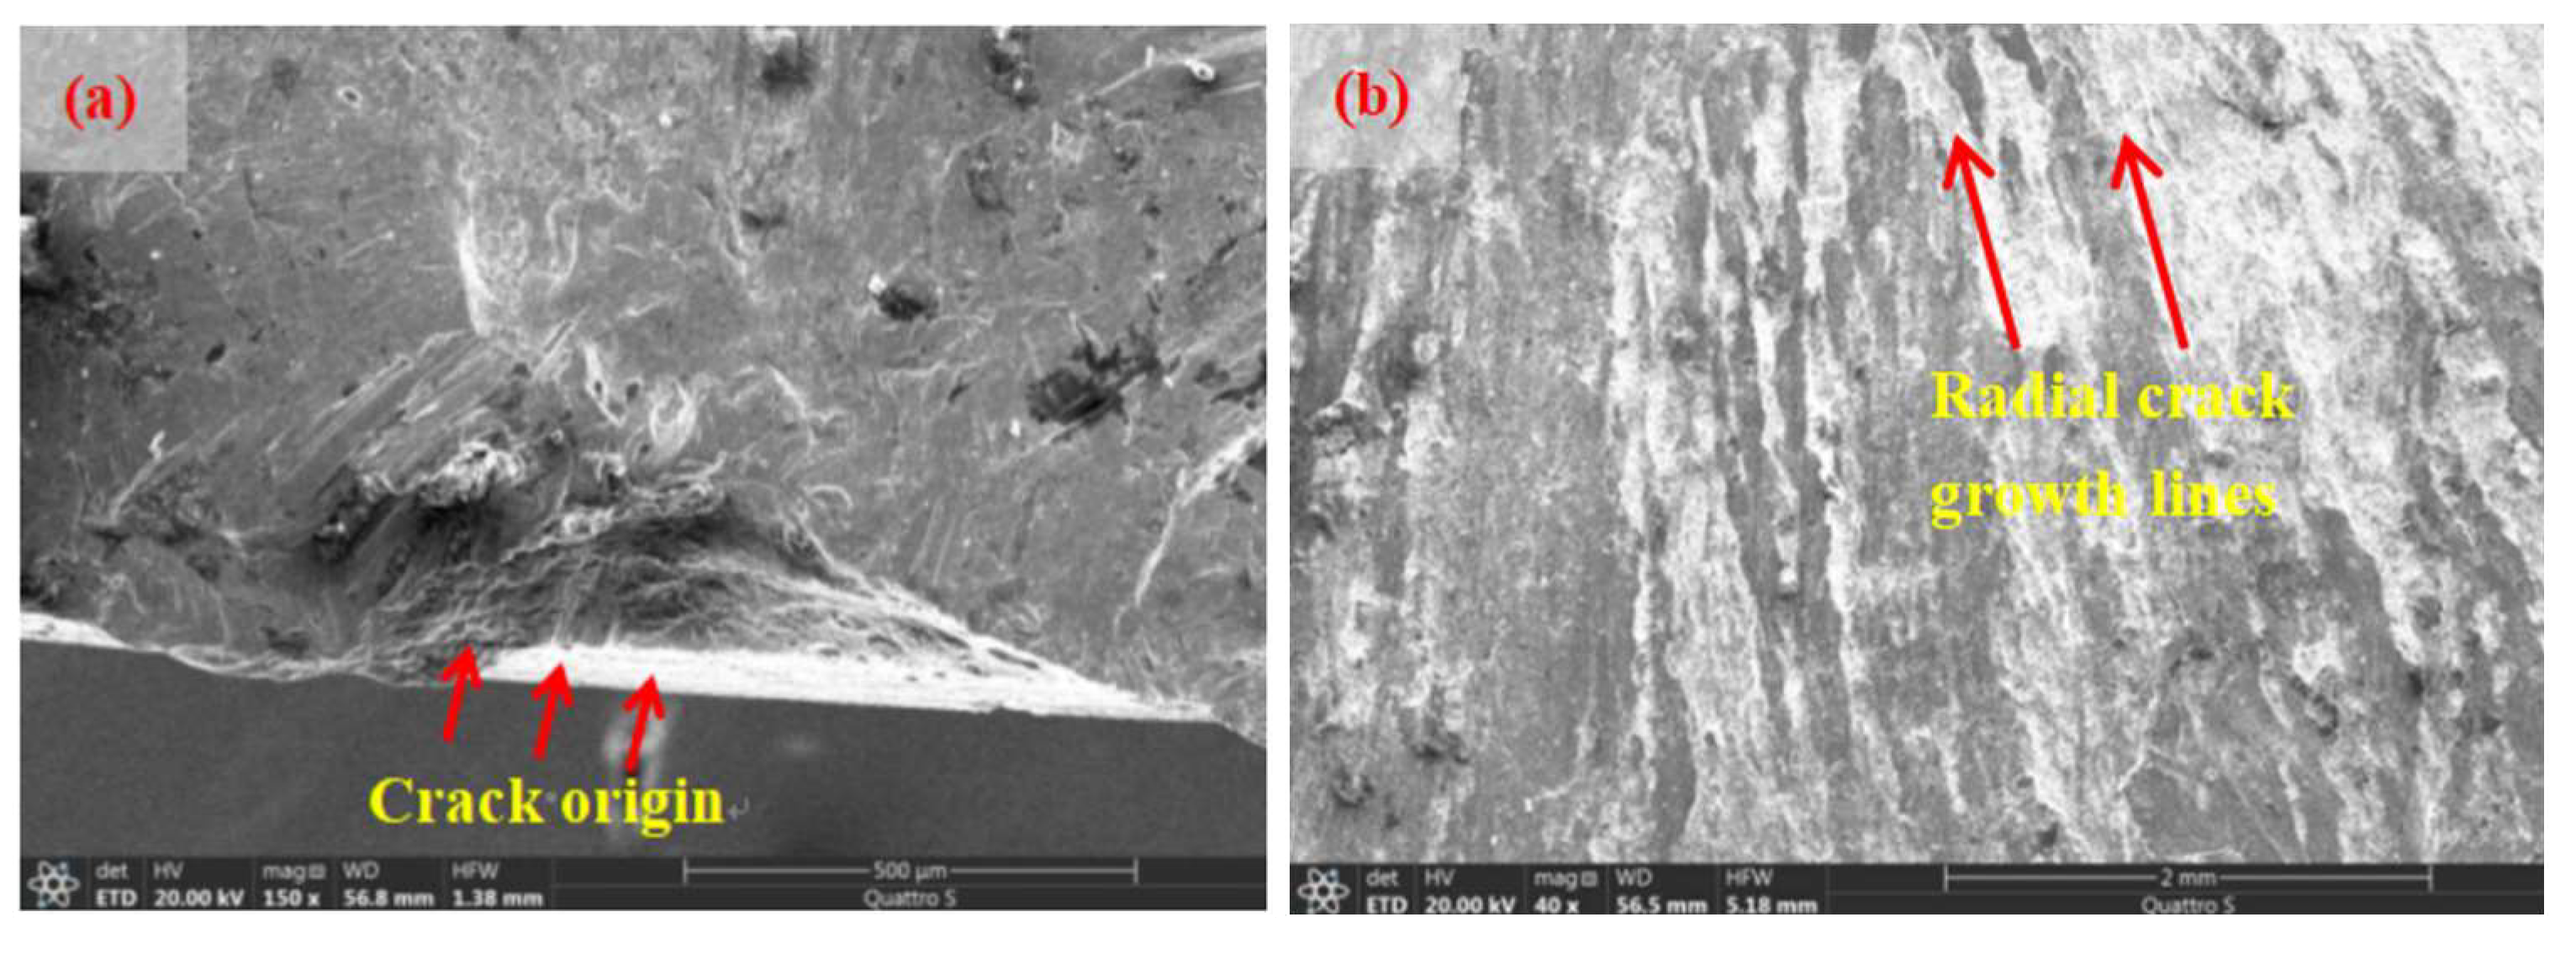
3.1. Fracture Surface

The section depicted can be divided into six distinct regions: region 1, region 2, region 3, region 4, and region 5, as shown in Figure 3b, as well as the crack source area. In Figure 7a, it is evident that the crack originates from the root of the machined grain on the fracture surface, and there is noticeable wear at the crack source. The unworn area exhibits a tearing morphology with no original defects such as cracks, non-metallic material inclusions, or folding. At fracture region 1, as shown in Figure 7b, distinct radial extensions of the radial texture can be observed. Some wear is also present under high magnification, and the microscopic morphology primarily consists of tear contours, indicating that the drive shaft experienced significant bending loads and developed early cracks [39]. In Figure 7c, fracture region 2 exhibits a quasi-cleavage micromorphology, which is a characteristic feature of fatigue crack extension. Fracture regions 3 and 4, located on both sides of the section edge, display a wider fatigue crack extension. Under high magnification, the observation reveals mainly ductile fracture of the tear and tough nests, which represents rapid fatigue crack extension under high load and corresponds to the phenomenon of rapid fatigue fracture under high stress [40].
The examination of micro-morphology reveals that the area where the fracture occurred, known as region 5, exhibits characteristics of toughness fracture and tear deformation toughness fossa, ultimately leading to the final fracture. Microscopic analysis shows that there were no previous crack defects at the crack’s origin. The drive shaft, which experienced a significant unilateral bending force impact, initially developed a crack on one side of the machined grain surface [41]. Subsequently, under the torsional load, the crack underwent expansion and fatigue fracture, leading to the failure of the drive shaft.

3.2. Chemical Composition and Metallographic Structures

Table 1 presents the chemical composition of the material near the fracture of the shaft. The composition of the material satisfies the specifications for a 40 Cr drive shaft, with each element’s content meeting the prescribed standards.
As shown in Figure 8, the evaluation results reveal that the sulfide class, alumina class, silicate class, and spherical oxide class all exhibit a grade of 0.5, whereas the single-particle spherical inclusions have a grade of 0. Upon axial and radial examination, the metallographic structure of the induction quenching zone is characterized by acicular martensite. The depth of the induction quenching layer, as measured using the metallographic method, is approximately 5.9 mm, with slight band segregation present. On the other hand, the metallographic structure of the core tempering zone consists of tempered, otherwise striped, and massive ferrite. From the observations made, it is evident that the non-metallic inclusions in the material are effectively controlled, with no abnormalities detected in either the surface or core structures. Furthermore, the depth of the induction quenching layer meets the technical requirements, and the metallographic structure is uniform.

3.3. Mechanical Properties

Table 2 displays the values of the tensile strength (TS), yield strength (YS), elongation (δ), and shrinkage (ψ) of the fractured shaft. The drive shaft material is 40Cr after mid-frequency quenching, and its symmetric tensile fatigue limit and symmetric bending fatigue limit can be expressed by the following equations.
σ 1 p = 0.23 σ s + σ b ,
σ 1 = 0.27 σ s + σ b ,
σ−1p is the symmetric tensile and compressive fatigue limit of the material, and σ−1 is the symmetric bending fatigue limit [42]. Bringing in σs = 832 (average of measured tensile strengths) and σb = 1024.33 (average of measured yield strengths) yields σ−1p = 426.96 MPa, σ−1 = 501.21 MPa.
40Cr steel is a medium-carbon alloy structural steel, cooled to room temperature at quenching, exhibiting a ferrite/pearlite microstructure, which belongs to the class of low-hardenability alloy tempered steels. The comprehensive mechanical properties of steel are good, so in the automotive industry it is often used in the manufacture of connecting rods, bolts, drive shafts, and other mechanical parts. The 40Cr steel quenching process mainly includes oil quenching, sodium chloride solution quenching, electric pulse quenching, and laser pulse quenching [43,44,45]. In this paper, medium-frequency electric pulse quenching was used to effectively eliminate residual stress, improve the hardness, and significantly strengthen its mechanical properties.
Results of the Rockwell hardness test of the drive shaft are illustrated in Table 3. The hardness of the external surfaces of the fracture exhibits a consistent level, ranging from 48 to 52 HRC. Nevertheless, the hardness within the core falls slightly below the designated upper limit of the material, measuring between 22 and 26 HRC. The drive shaft ends are significantly stiffer than the center, as illustrated in Figure 9.
As shown in Figure 9, among the nine points marked at different locations of the drive shaft, the core hardness of six points is not up to standard. From the metallographic analysis it can be seen that the transverse core tempering area of the drive shaft is organized as tempered sostenite and striated and massive ferrite. Once the block ferrite appears in the tempered sohnite, its hardness and toughness will be reduced, which is the main reason for the reduction of the hardness of the drive shaft core [43].
The evaluation of metal materials’ resistance to impact damage is crucial in assessing the performance of shaft parts. In accordance with GB/T 229-2020 [46], the Charpy pendulum impact test was carried out on the drive shaft samples under environmental conditions of 23 ± 5 °C, and the test results are shown in Table 4. The drive shaft exhibits remarkable mechanical impact properties, surpassing the standard threshold of 47 Joules. This signifies its ability to effectively absorb and withstand impact forces.
According to the specifications given in GB/T 3077-1999 [47], the fractured shaft’s mechanical characteristics match the drive shaft’s design requirements exactly, with the exception of a slightly lower core hardness.

3.4. CAE Evaluation

The mesh quality was checked using the Quality Index function that comes with Hypermesh, and the mesh quality details are shown in Table 5. The mesh quality is evaluated by evaluating the minimum size, maximum size, aspect ratio, warpage, and Jacobi coefficient to determine the quality of the mesh and partially optimize the mesh. The minimum size is usually set to 2.0, and the maximum size to 20.0. The aspect ratio is more important for 3D meshes; it mainly reflects the narrowness of the meshes, which is controlled by the uniformity of the mesh dimensions in different directions, and is usually set to 5. The Jacobi coefficient reacts to the degree to which the hexahedral meshes deviate from the ortho-hexahedron and is usually set to 0.6 for better mesh quality.
Initially, a simulation was conducted on the drive axle assembly with a normal full load of 1860 kg, from which the torsional stress, bending stress, angular displacement, and linear displacement of the drive shaft were derived. Subsequently, the drive axle assembly was subjected to simulations such as 1G load drive axle assembly side slip, 4G load drive axle assembly vertical bending, 4G load drive axle assembly vertical bending under overload conditions, drive axle assembly side slip under overload conditions, side slip simulation after 4G impact under overload conditions, and ultimate side slip simulation under overload conditions. These simulations aimed to scrutinize the plastic deformation and stress distribution of the drive axle casing as well as the drive shaft [48].

3.4.1. Theory of Strength

Strength theories are assumptions about the damage or failure behavior of materials [49]. Four strength theories are commonly used in engineering for brittle fracture and plastic yielding. The first strength theory is also known as the maximum tensile stress theory. The second strength theory is also known as the maximum elongation line strain theory. The third strength theory is also known as the maximum tangential stress theory. The fourth strength theory is also known as the shape change energy density theory. This last theory assumes that the shape change energy density is the factor that causes the material to yield. During shape changes, energy density at one point in the member reaches the limit value of the material, whereupon the material at that point will experience a plastic-yielding phenomenon [50]. The theory was proposed by Ludwig Heinrich Edler von Mises, so the fourth strength theory is also known as the von Mises strength theory. The expression is shown as in Equation (3). σ1, σ2, and σ3 are the three principal stresses at the hazard point of the member.
0.5 σ 1 σ 2 2 + σ 2 σ 3 2 + σ 1 σ 3 2 σ ,
The first and second strength theories are used for brittle fracture, and the third and fourth strength theories are used for plastic yielding. Von Mises stress integrates the first, second, and third principal stresses, and it is an equivalent stress. Von Mises uses the stress contour to represent the stress distribution inside the model, which can clearly describe the resultant changes in the whole model, and at the same time, it can quickly determine the most dangerous areas in the model [51]. A large number of tests have shown that in the plane stress state, the von Mises strength theory is more in line with the test results than the maximum tangential stress theory, so it is more widely used in engineering practice. Therefore, this paper chooses von Mises stress as the stress evaluation standard.

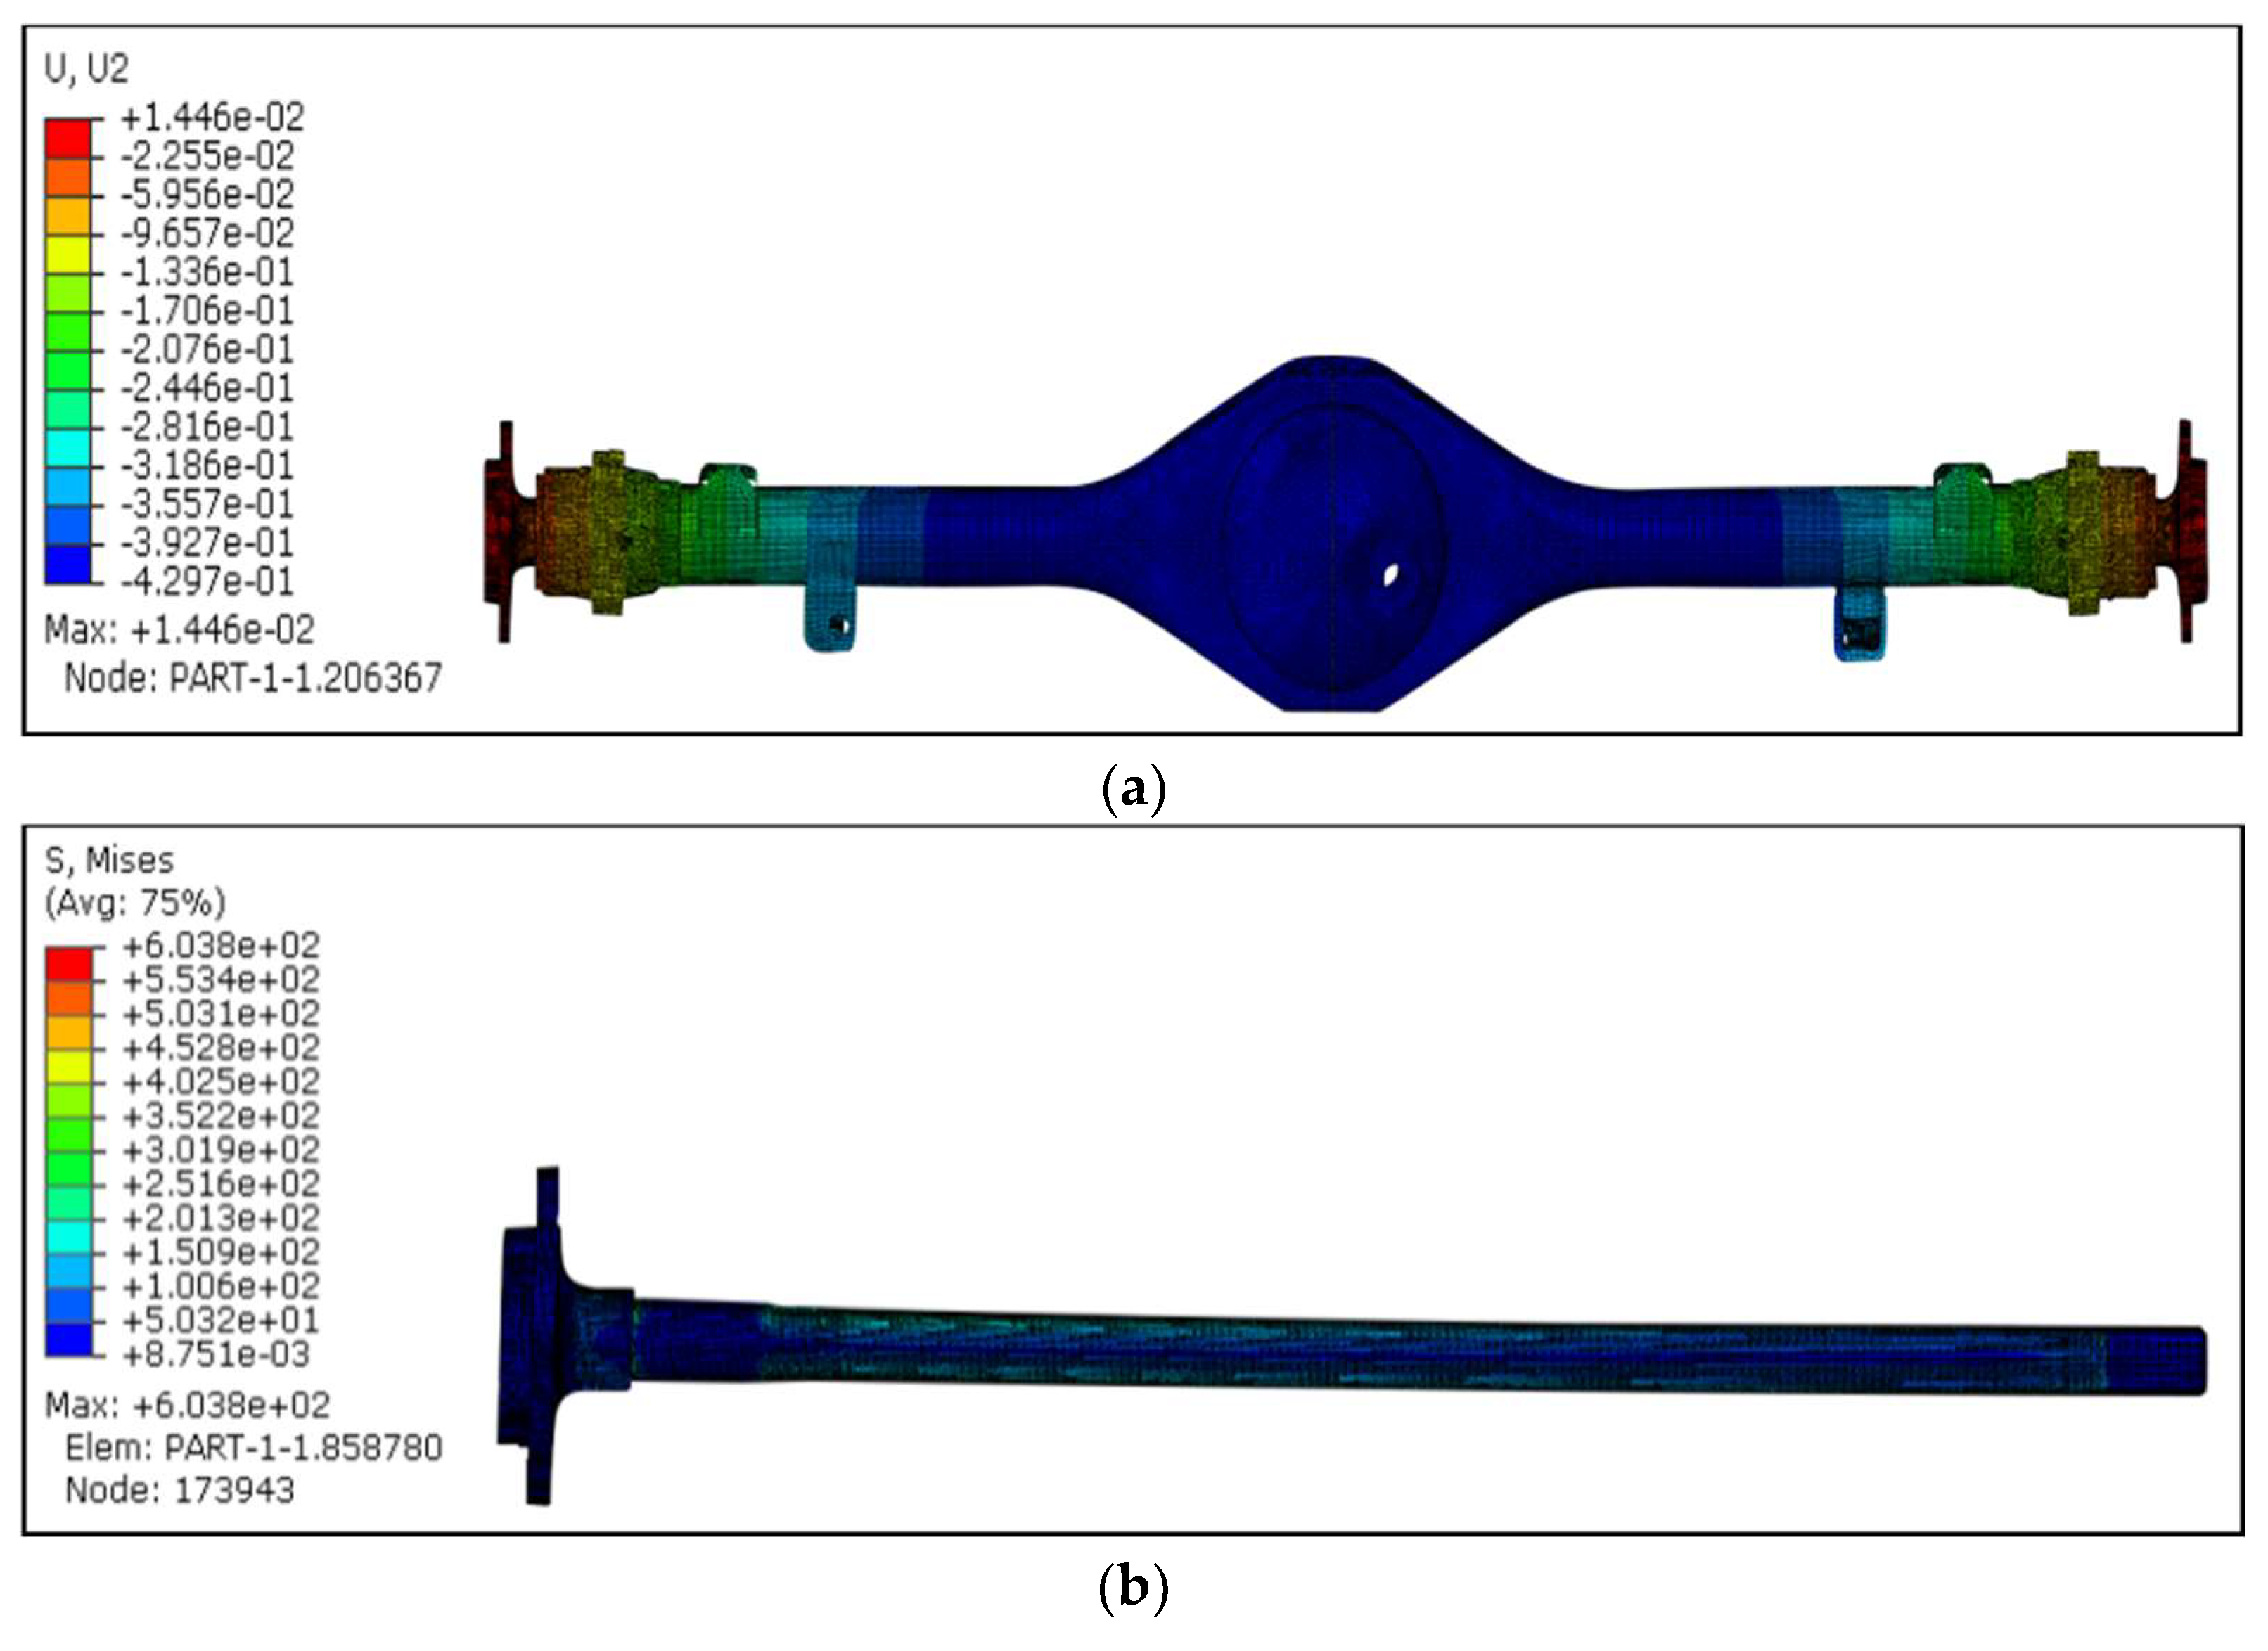
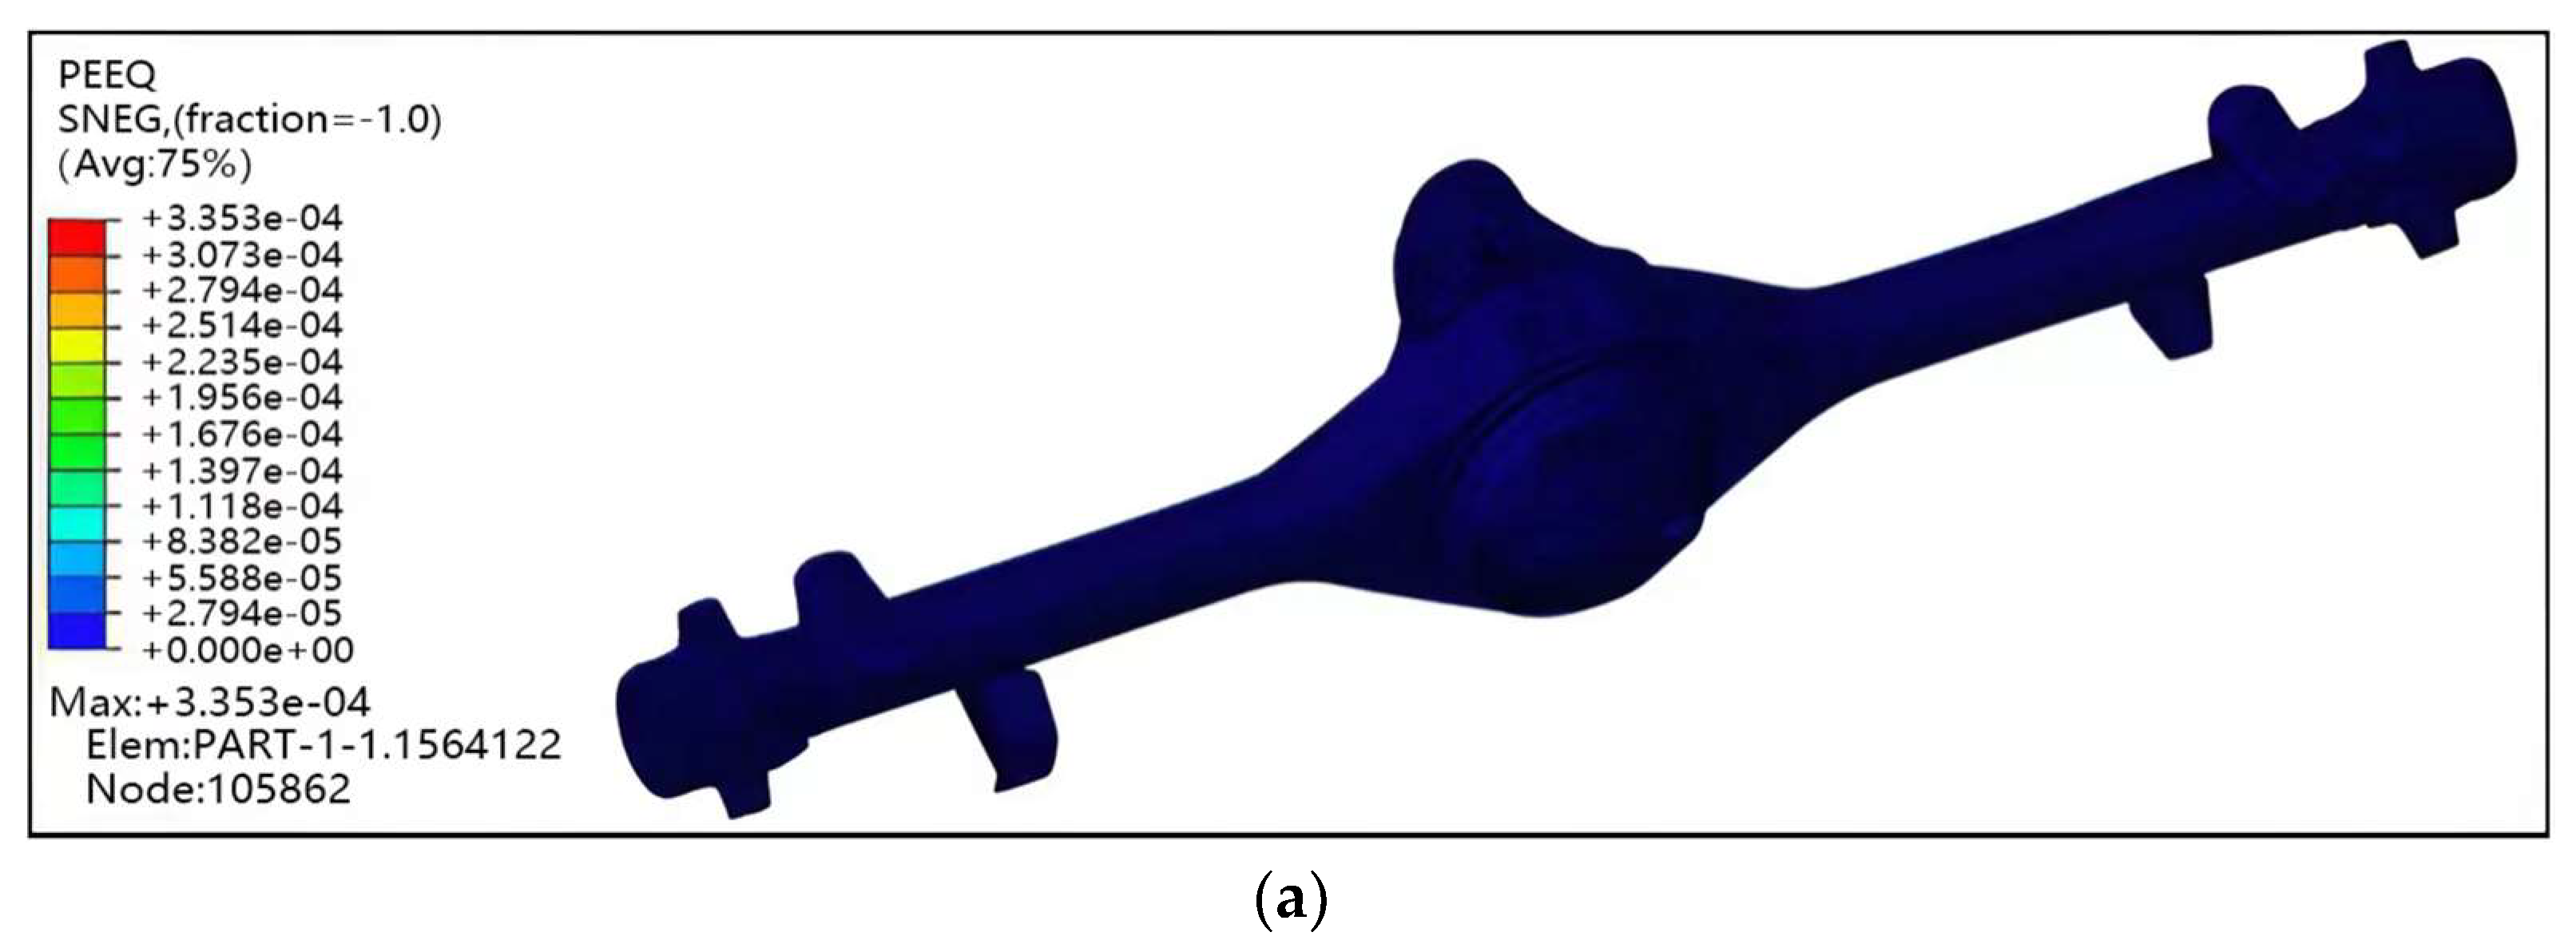
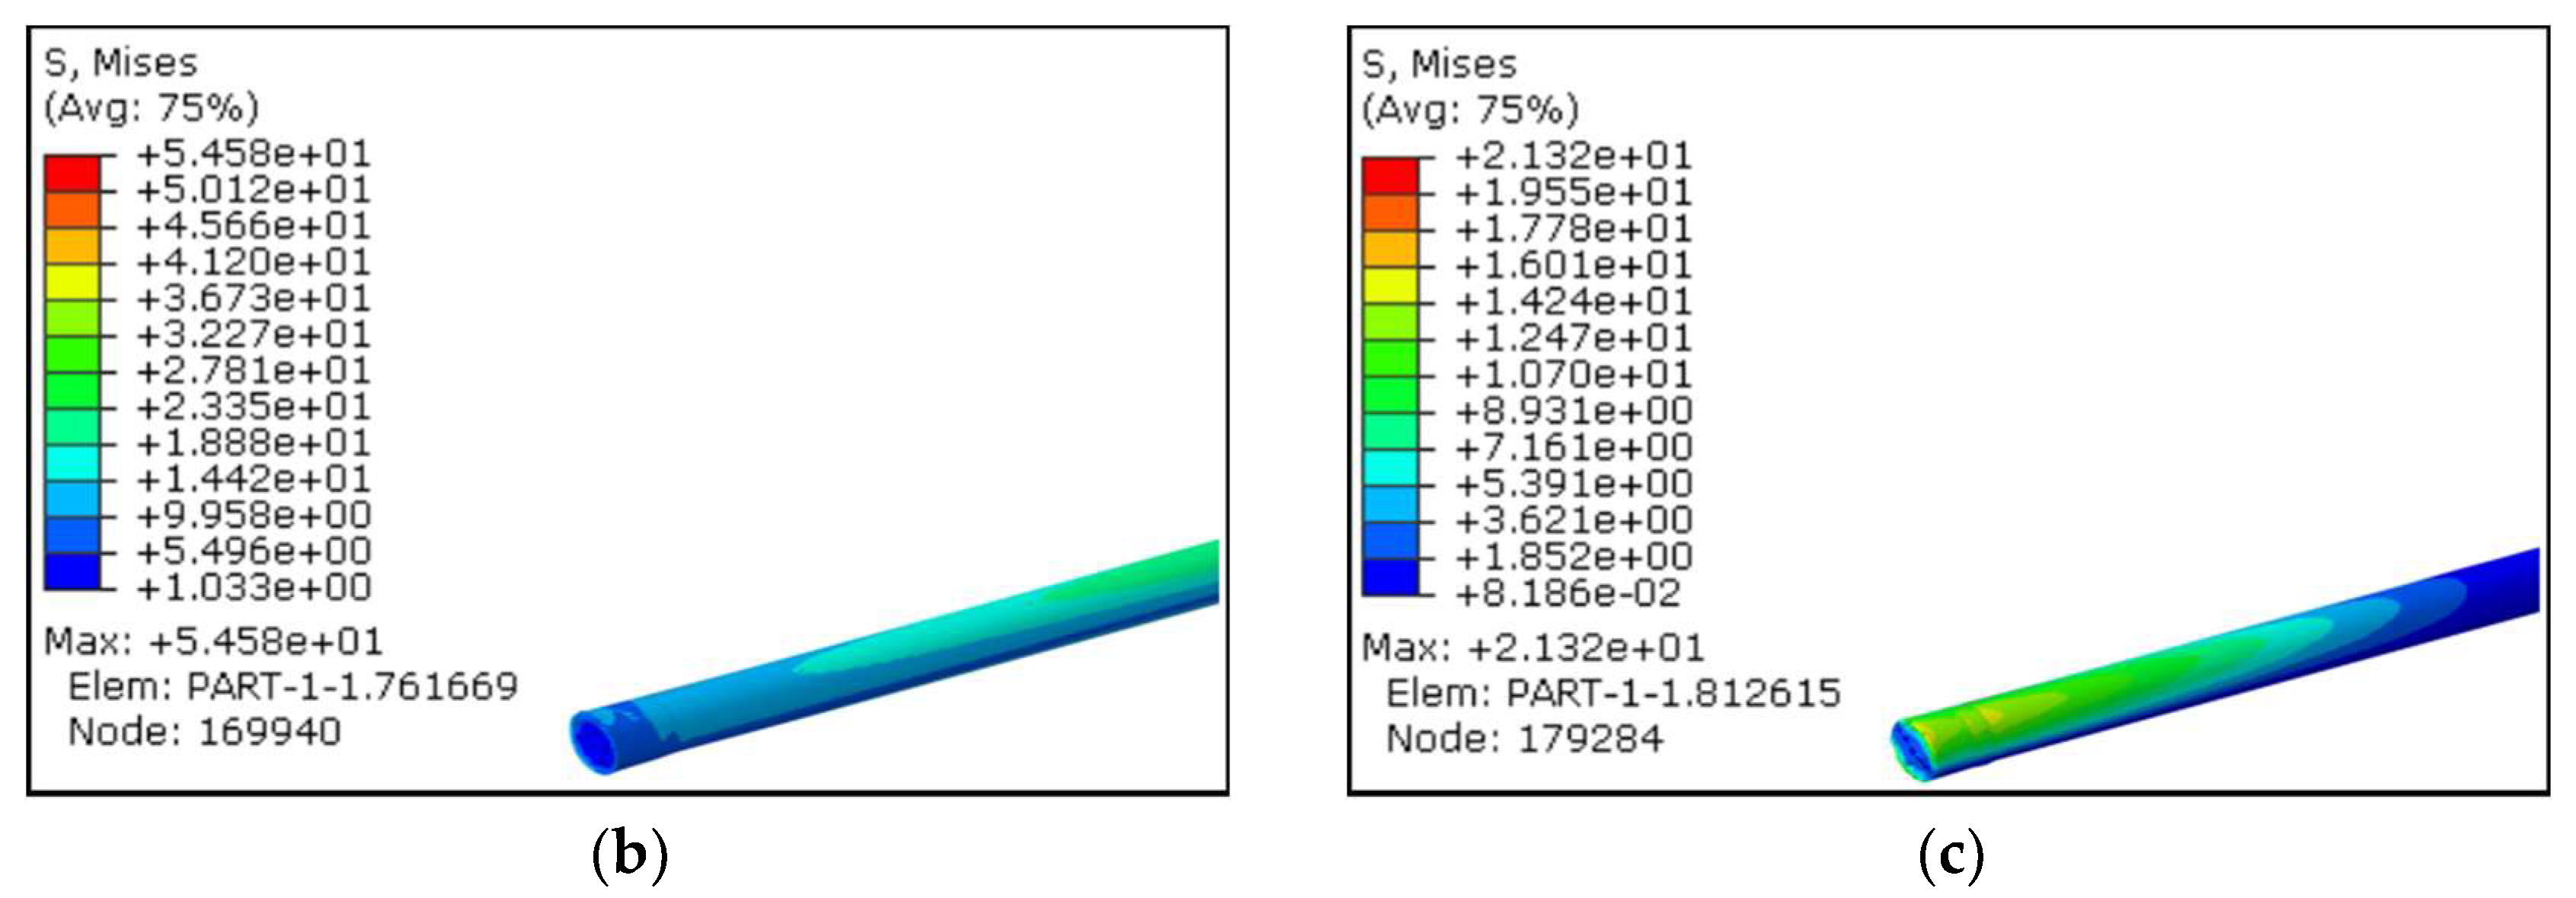
3.4.2. Simulation of 1G Load Operation

The torsional stress experienced by the drive axle under a load of 1860 kg is minimal, measuring only 3.3 MPa at the point of fracture. On the other hand, the bending stress is highest at the flange, reaching 121 MPa, but only 87.5 MPa at the fracture, as depicted in Figure 10. Within the drive axle system, the drive shaft is effectively restrained, resulting in no linear displacement along the X-axis and no angular displacement along the Y-axis. The maximum linear displacement at the point of fracture is a mere 400 μm, while the angular displacement is a mere 0.4°.
These values are insufficient to cause the drive shaft to shift during normal driving conditions, thereby ensuring that the vehicle remains undamaged. However, it is important to consider other factors, such as overload and poor road conditions, when evaluating potential causes of damage.

3.4.3. Side Slip Simulation under 1G Load

Side-slip fatigue strength simulations were conducted to evaluate the side-slip performance of the drive axle assembly. The full load of the drive axle, designated as 1G, was set at 1860 kg, while the tire radius was determined to be 377 mm. Based on the calculations, it was determined that the lateral acceleration of the entire vehicle during turning reaches 0.6 g. The force acting on the wheelbase point of the drive axle is depicted in Figure 11a, and its direction is determined by the turning direction. The forces on the drive axle assembly can be expressed by the following equation.
F r = 0.5 G = 0.5 1860 9.8 = 9114 N ,
F s = 0.6 F r = 5468.4 N ,
There was no rotational movement of the drive shaft in this condition, and the material was considered to be plastic. We used the isotropic plasticity model in finite element analysis. The simulation outcome indicated that during left or right turns, the axle housing assembly and the drive shaft did not undergo any plastic deformation. The maximum stress observed was approximately 101 MPa, near the point of fracture. This result is visually represented in Figure 11b,c.
The drive shaft can be described as a semi-floating drive shaft. It is worth noting that the bending stress at the fracture site remains at a negligible level during regular operation. Hence, the failure resulting from significant bending internal stress in the drive shaft is primarily attributed to the plastic deformation of the axle housing.

3.4.4. Vertical Bending Simulation under 4G Load

The distribution of degrees of freedom and the location of the load can be seen in Figure 12a.
In drive shaft design, the concept of 4G means subjecting the drive bearing to four times its full load, which is the ultimate load required by automotive OEM design. Therefore, the simulation assumes that 4G is the maximum vertical impact that the drive shaft may be subjected to in order to observe the significant plastic deformation that occurs at the critical value. It is required that the axle housing should not deform plastically more than 1.5 mm after unloading at a 4G load. Similarly, the concept of 6G entails subjecting the drive axle to a load six times its full capacity, resulting in complete destruction. Therefore, in order to simulate the vertical bending static strength test of the axle shell assembly, it is necessary to consider the material’s nonlinear loading at 4G. This simulation enables the evaluation of the degree of plastic deformation in the axle shell and the distribution of stress in the drive shaft.
Based on the findings illustrated in Figure 12b–d, it is evident that the axle housing experiences a permanent deformation of 0.0047 mm. It is important to note that the extent of plastic deformation observed is insufficient to induce any form of damage. Furthermore, no plastic deformation is observed in the drive shaft. In addition, the maximum stress recorded in the vicinity of the fracture near the friction welding position is measured at 173.4 MPa, which is significantly lower than the threshold for causing damage.

3.4.5. Simulation of Vertical Bending with 4G Load under Overload

The initial weight of the vehicle at the manufacturing plant is recorded as 3450 kg, with 1860 kg allocated to the drive axle. The user converted the vehicle into a caravan, so it is important to consider the possibility of overloading. The legal limit for vehicle weight overload is set at 110%. Under this circumstance, the weight borne by the drive axle reaches 2466.75 kg. In order to analyze the stress distribution of the drive shaft after undergoing vertical bending load, the axle housing assembly is subjected to plastic deformation by applying a 4G overload and subsequently unloading.
The results of this simulation, as displayed in Figure 13, indicate that upon unloading, the drive axle experiences a permanent deformation of 0.4224 mm. However, when continuously loaded, no plastic deformation occurs in the drive shaft. The stress distribution between the bearing and spline reveals that the maximum stress is concentrated around the friction weld position of the fractured shaft, measuring 232.9 MPa.
The assessment of the drive axle housing’s strength is determined by ensuring that the plastic strain does not surpass 1% within the industry. If the plastic strain exceeds this threshold, it indicates that the load-carrying capacity of the axle housing structure is inadequate, necessitating the re-optimization of the drive axle housing structure. However, it should be noted that the maximum vertical impact load that the drive axle may experience is 4G, which represents the ultimate working condition. Consequently, the drive axle housing has not been optimized accordingly.

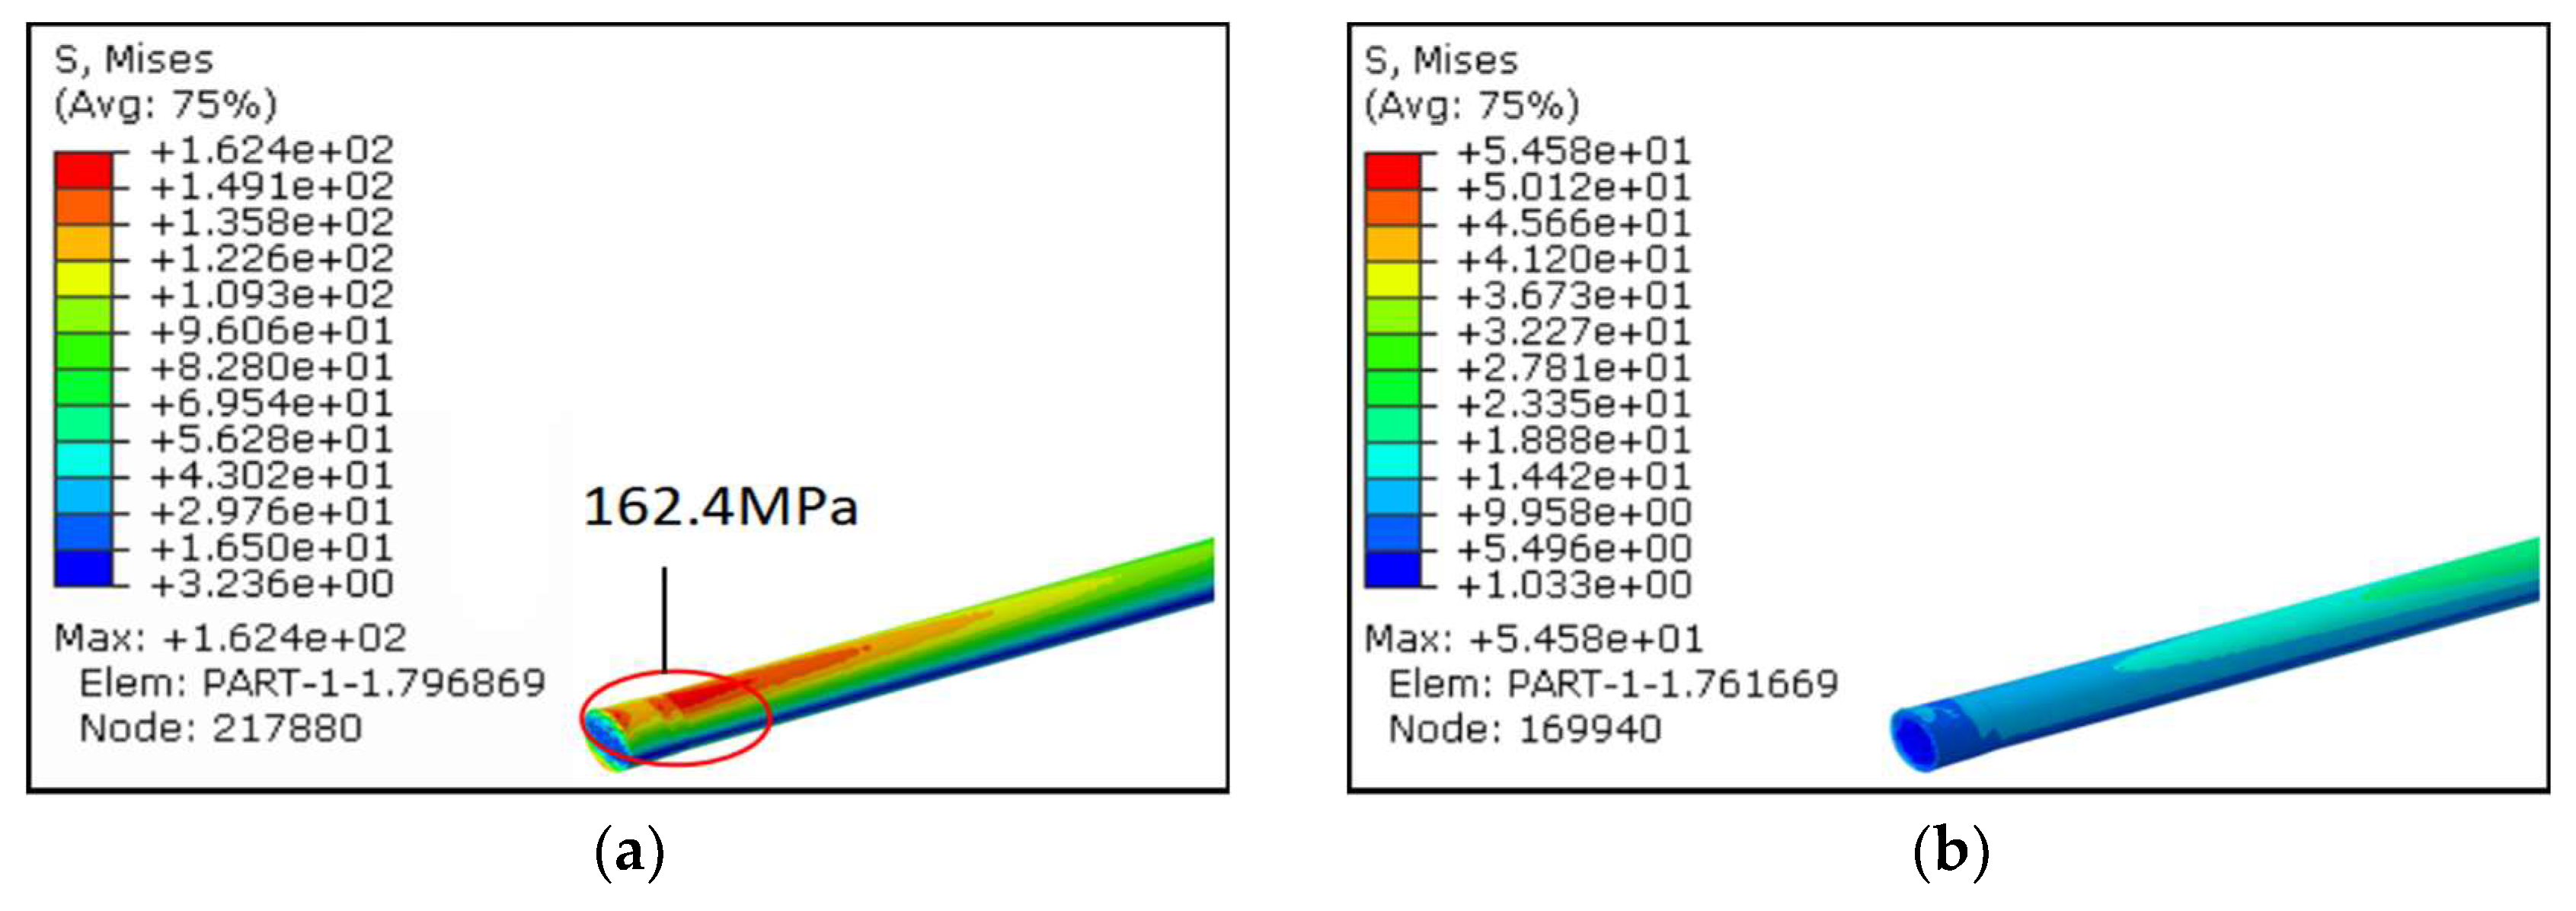
3.4.6. Side Slip Simulation under Overload

In the simulation of the whole vehicle side slip under overload conditions, the forces on the drive axle assembly can be expressed by the following equations.
F r = 0.5 G = 1 / 2 2466.75 9.8 = 12087.08 N ,
F s = 0.6 F r = 7252.245 N ,
Based on the simulation outcomes, it is evident that when the vehicle experiences overload, the axle housing assembly undergoes plastic deformation when the car slides to either the left or right side. However, the drive shaft does not exhibit any plastic deformation. Notably, the maximum stress is concentrated near the fracture, measuring at 134 MPa, as depicted in Figure 14.

3.4.7. Side Slip Simulation of Drive Axle Assembly after 4G Impact under Overload

After considering the sole limiting condition, it is observed that the drive axle housing undergoes plastic deformation. However, this deformation does not directly result in drive shaft failure, as the stress remains below the critical threshold.
To further investigate this phenomenon, a simulation was conducted by combining the left and right side slip limiting conditions after a 4G impact exceeds the normal load. During this simulation, the inner section of the drive shaft was found to no longer experience zero stress, according to theoretical mechanics. Hence, it becomes imperative to account for the deformation of the axle housing caused by the 4G vertical impact condition in the simulation. Subsequently, an analysis was performed to examine the stress distribution of the drive shaft resulting from the superimposition of the side slip condition.
Based on the findings illustrated in Figure 15, it can be observed that the drive shaft remained intact without any plastic deformation during the 4G shock simulation conducted under the side slip limit conditions with overload. Furthermore, the maximum stress experienced by the drive shaft during the left side slip was recorded at 162.4 MPa, which is deemed insufficient to directly induce any damage to the drive shaft.

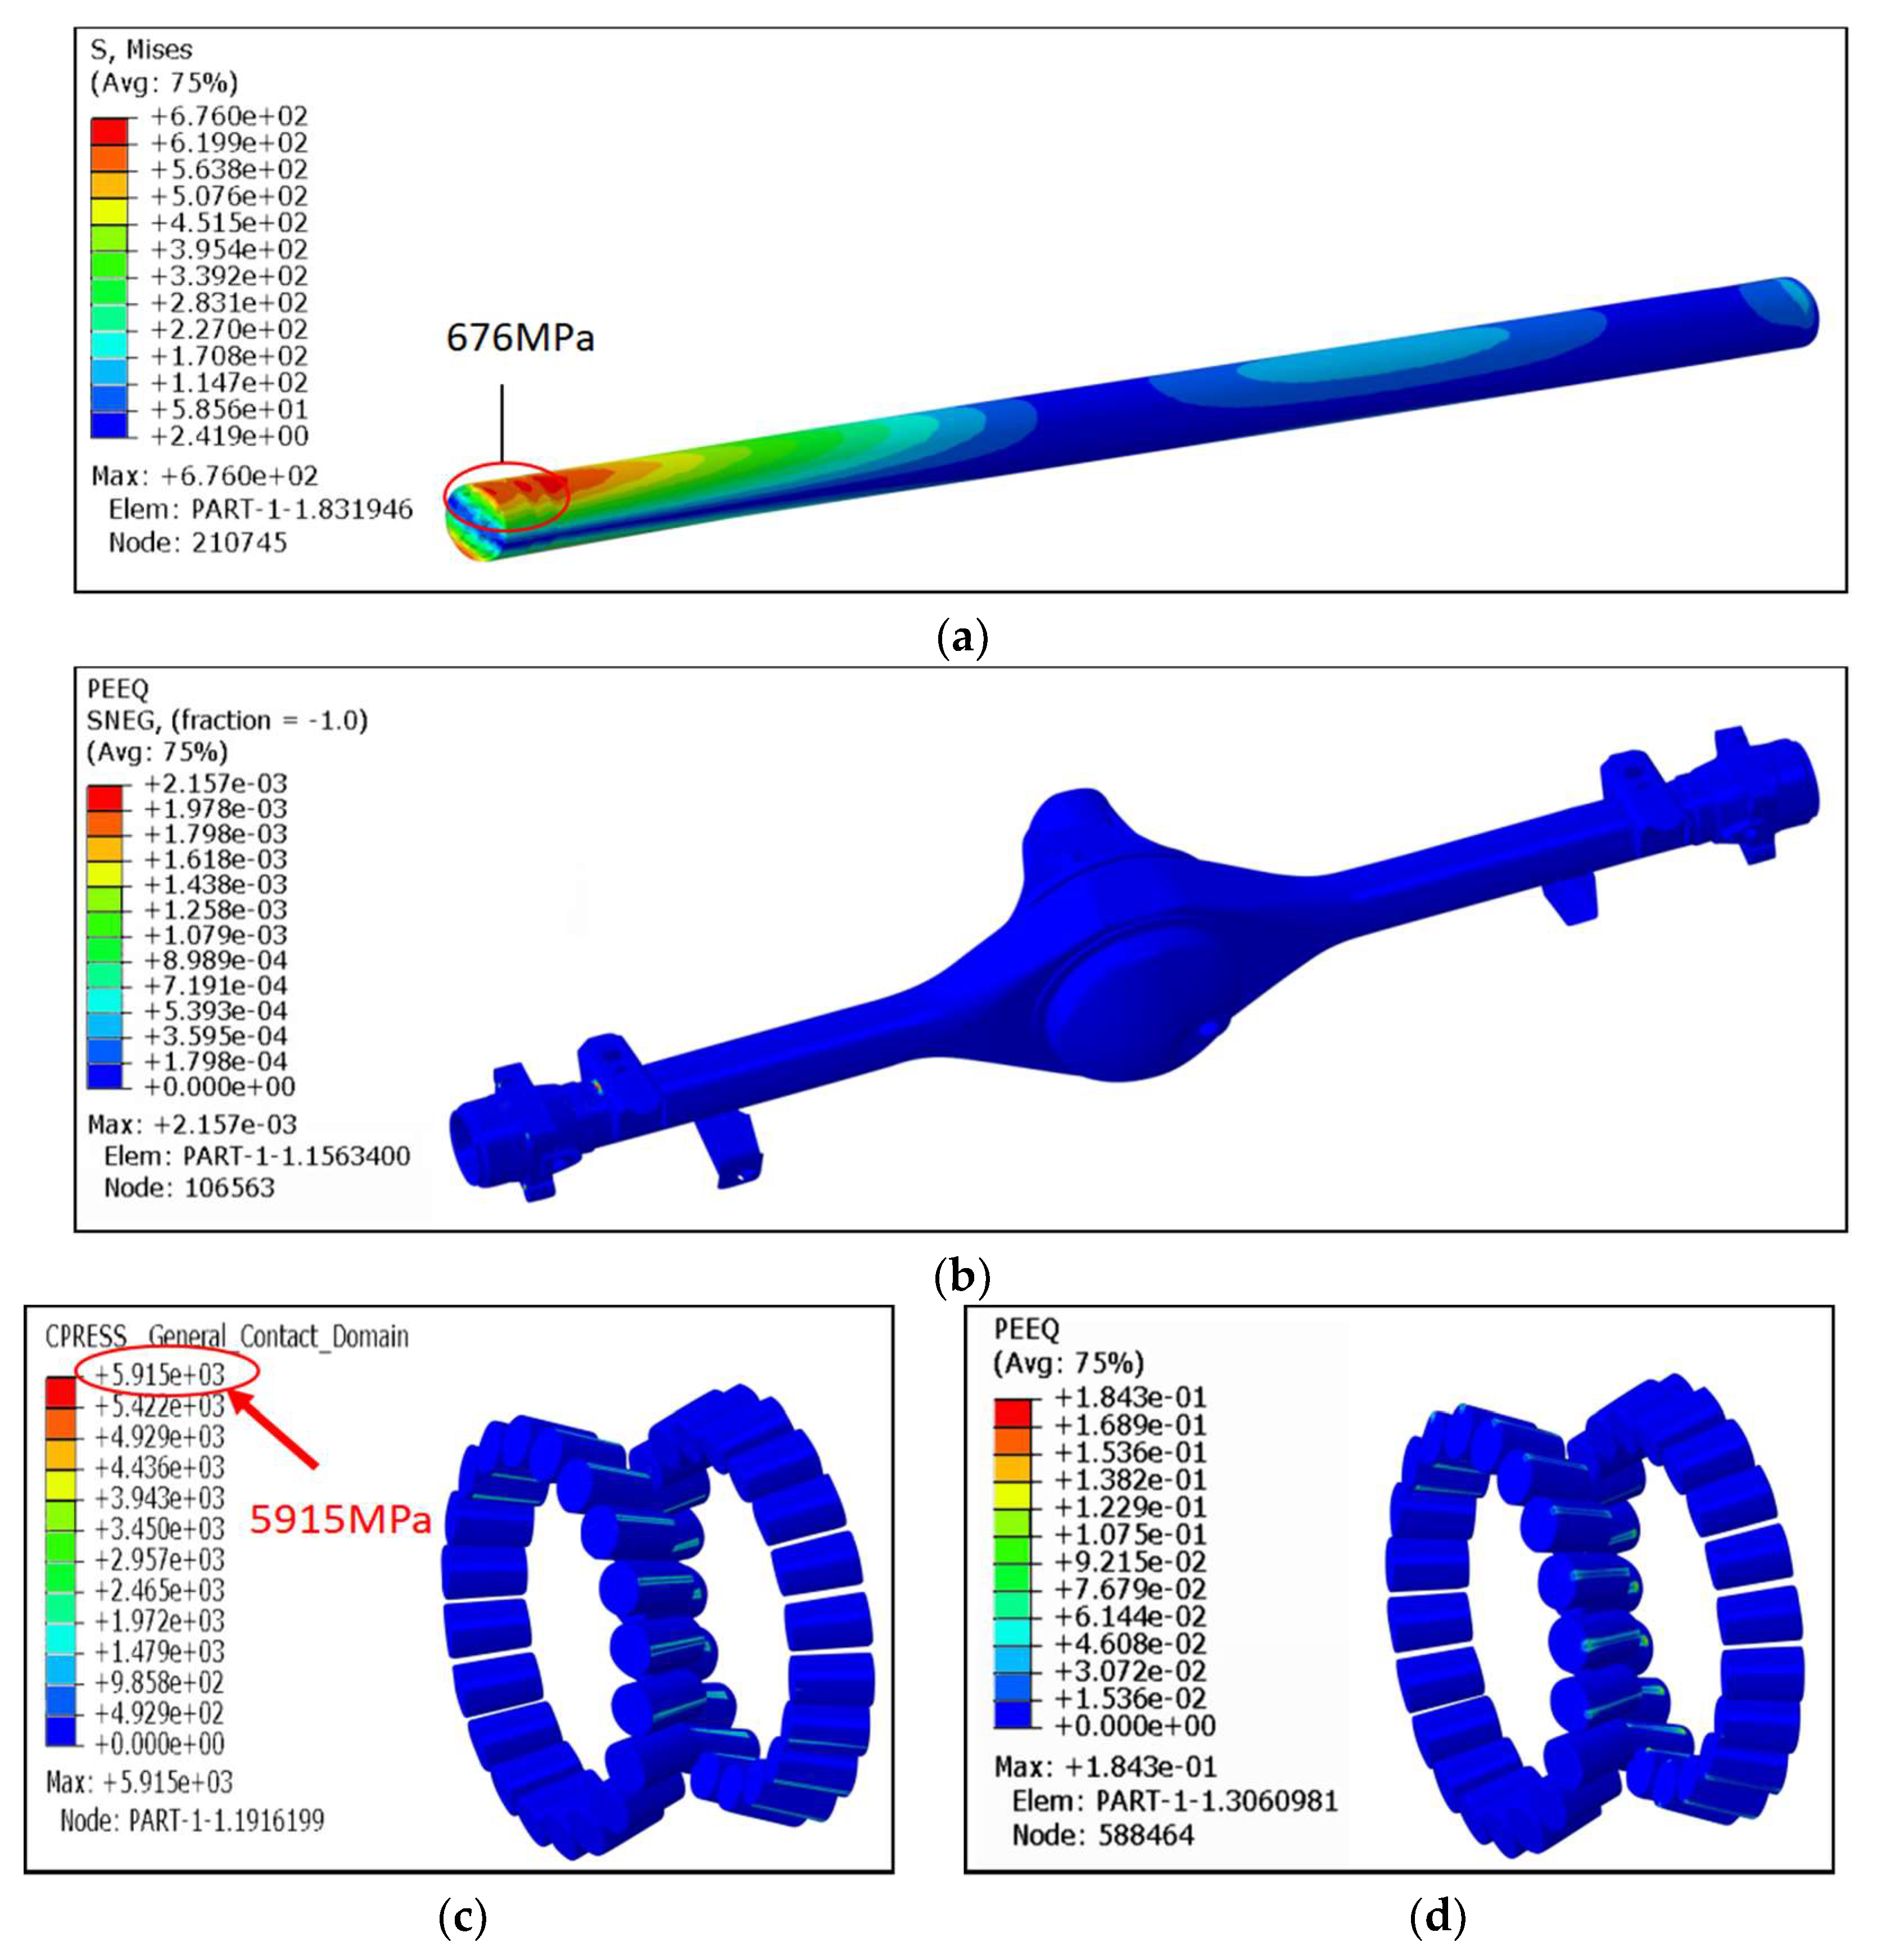
3.4.8. Extreme Side Slip Simulation of Drive Axle Assembly under Overload

When the coefficient of adhesion is taken as 1 under overload condition, the forces on the drive axle assembly can be expressed by the following equations.
F r = 1 G = 1 2466.75 9.8 = 24174.15 N ,
F s = 1 F r = 24174.15 N
In this particular limit condition, as demonstrated by the data presented in Figure 16, it can be observed that the axle housing, drive shaft, and bearing undergo plastic deformation. Specifically, the plastic deformation of the drive axle housing is found to be below 1%, while the bearing experiences plastic deformation exceeding 1%. Furthermore, the contact stress between the drive shaft and the bearing surpasses 4000 MPa.
Notably, the maximum stress value near the friction welding head of the drive shaft inner section reaches 676 MPa, which exceeds the tensile and compressive fatigue limit stress of 426.96 MPa for the parent material quenched at medium frequency and also exceeds the flexural fatigue limit stress of 501.21 MPa.
Consequently, this leads to destructive behavior. It is worth noting that the failure of the drive shaft cannot be attributed solely to single bending fatigue but rather to a combination of extreme operating conditions. Finite element calculations further confirm this conclusion. Although the failure process is complex and cannot be completely replicated through finite element simulation, it can be concluded that the rotation-bending fatigue damage near the inner friction weld head of the drive shaft is primarily caused by the plastic deformation of the drive shaft bearing.

4. Discussion

The fracture morphology of the drive shaft suggests that the failure mode was a unilateral impact-bending fatigue fracture. The crack originated from the transition arc section at the weld root and propagated radially toward multiple source areas, resulting in the observed fracture. Finite element analysis revealed that the maximum torsional and bending stresses at the weld were only 3.3 MPa and 87.5 MPa, respectively, when the drive shaft was operating under normal full load mass. These values are considerably lower than the standard material thresholds and are therefore insufficient to cause the drive shaft to fail under normal operating conditions. Upon analyzing the material properties, it was found that the drive shaft material adhered to the design requirements in terms of chemical composition, metallurgical organization, strength, toughness, and impact properties. However, the core hardness was slightly lower than the standard. Despite possessing high mechanical properties, the drive shaft experienced significantly elevated stress at the processing root when subjected to large impacts, which could easily result in fatigue damage. Consequently, the fatigue failure process of the drive shaft can be described as follows: severe unilateral impacts lead to the initiation of cracks at the root of the machined grain on the weld surface, which then propagates radially, accompanied by severe wear phenomena. The fatigue process is characterized by rapid fatigue under high stress. As the crack depth increases and the solution shape appears, the area of torque distribution in the drive shaft decreases. Eventually, the actual load exceeds the maximum load that the drive shaft can bear, resulting in instantaneous tearing fractures and brittle fractures of the iron-based cross-section of the drive shaft.
In order to simulate the operational conditions of the drive shaft on complex roads and validate the findings of both macro- and micro-analysis, finite element tools have been employed for computational purposes [52]. Results obtained from considering the material rigidity of each component under normal working conditions at full load indicate that the stresses experienced by the drive shaft are considerably lower than the fatigue damage threshold. This suggests that the drive shaft does not exhibit failure behavior in compliance with typical usage. To further investigate the cause of failure, simulations were conducted on the drive axle assembly and the drive shaft under various combined conditions, including vertical bending at four times the load, side slip after a four-times-load impact, and legal overload. Taking into account the material’s plasticity, the results reveal that under such conditions, the drive axle assembly may undergo plastic deformation, but this does not directly lead to the failure of the drive shaft. Additionally, the stress exerted on the drive shaft is significantly below the fatigue limit of the parent material, suggesting that there is no possibility of excessive stress resulting in fracture. Lastly, the impact of the bearing on the fracture of the drive shaft was considered. Through simulation, it was observed that the plastic strain on the bearing and the contact stress with the drive shaft exceeded 1% of the standard value and reached as high as 4000 MPa, respectively. This is sufficient to cause bearing failure and generate a larger impact load. Moreover, the maximum stress value of 676 MPa near the friction-welded head of the inner section of the drive shaft surpassed the fatigue limit stress of the parent material through medium-frequency quenching. This further supports the conclusion that the excessive degree of plastic deformation of the bearing results in high contact stress with the drive shaft, ultimately leading to its failure behavior. After finite element simulation under multiple operating conditions, we determined that the drive shaft fracture was not subjected to a single destructive load but rather a composite variety of loads, similar to rotational bending loads.
To summarize, the drive shaft demonstrates commendable mechanical performance in both typical and demanding operating conditions, meeting industry standards. It withstands extreme conditions without undergoing plastic deformation, indicating its design integrity. However, when subjected to extreme side slip conditions, the drive shaft’s bearing experiences significant plastic deformation and encounters immense contact stress with the drive shaft near the friction welding head. This leads to excessive stress levels that surpass the material’s fatigue limit, resulting in fracture damage. It is believed that the drive shaft fracture occurs when the user operates the vehicle under modified overload driving condition with unknown impact direction and angle, which pushes the drive shaft to its operational limits. At this point, the bearing undergoes plastic deformation and damage due to excessive stress near the friction welding head, causing the material to exceed its fatigue limit. Ultimately, the drive shaft succumbs to fracture damage caused by overload rotation-bending fatigue failure.

5. Conclusions

A broken drive shaft in a modified pickup truck operated at 3000 km was investigated to determine the root cause of its breakage failure, and the following conclusions were drawn:
  • The radial expansion pattern characteristic of the fracture surface indicates that the drive shaft has experienced fatigue failure during service. The main form of failure is rotation-bending fatigue failure.
  • The hardness of the core of the drive shaft was found to be lower than the standard value during the mechanical property test, which was due to the occurrence of massive ferrite in the tempered sostenite organization after quenching, which would reduce the hardness and toughness of the drive shaft.
  • One of the reasons for drive shaft failure is substandard core hardness. Protracted operation will cause damage to the bearings and other mechanical parts, indirectly causing wear and tear on the drive shaft. It should be reassessed in terms of its heat treatment process.
  • Finite element analysis shows that the vehicle has been modified to increase the overall mass significantly; the vehicle was overloaded in the driving process and exceeded the legal overloading limit; overloading aggravates the fatigue fracture of the drive shaft.
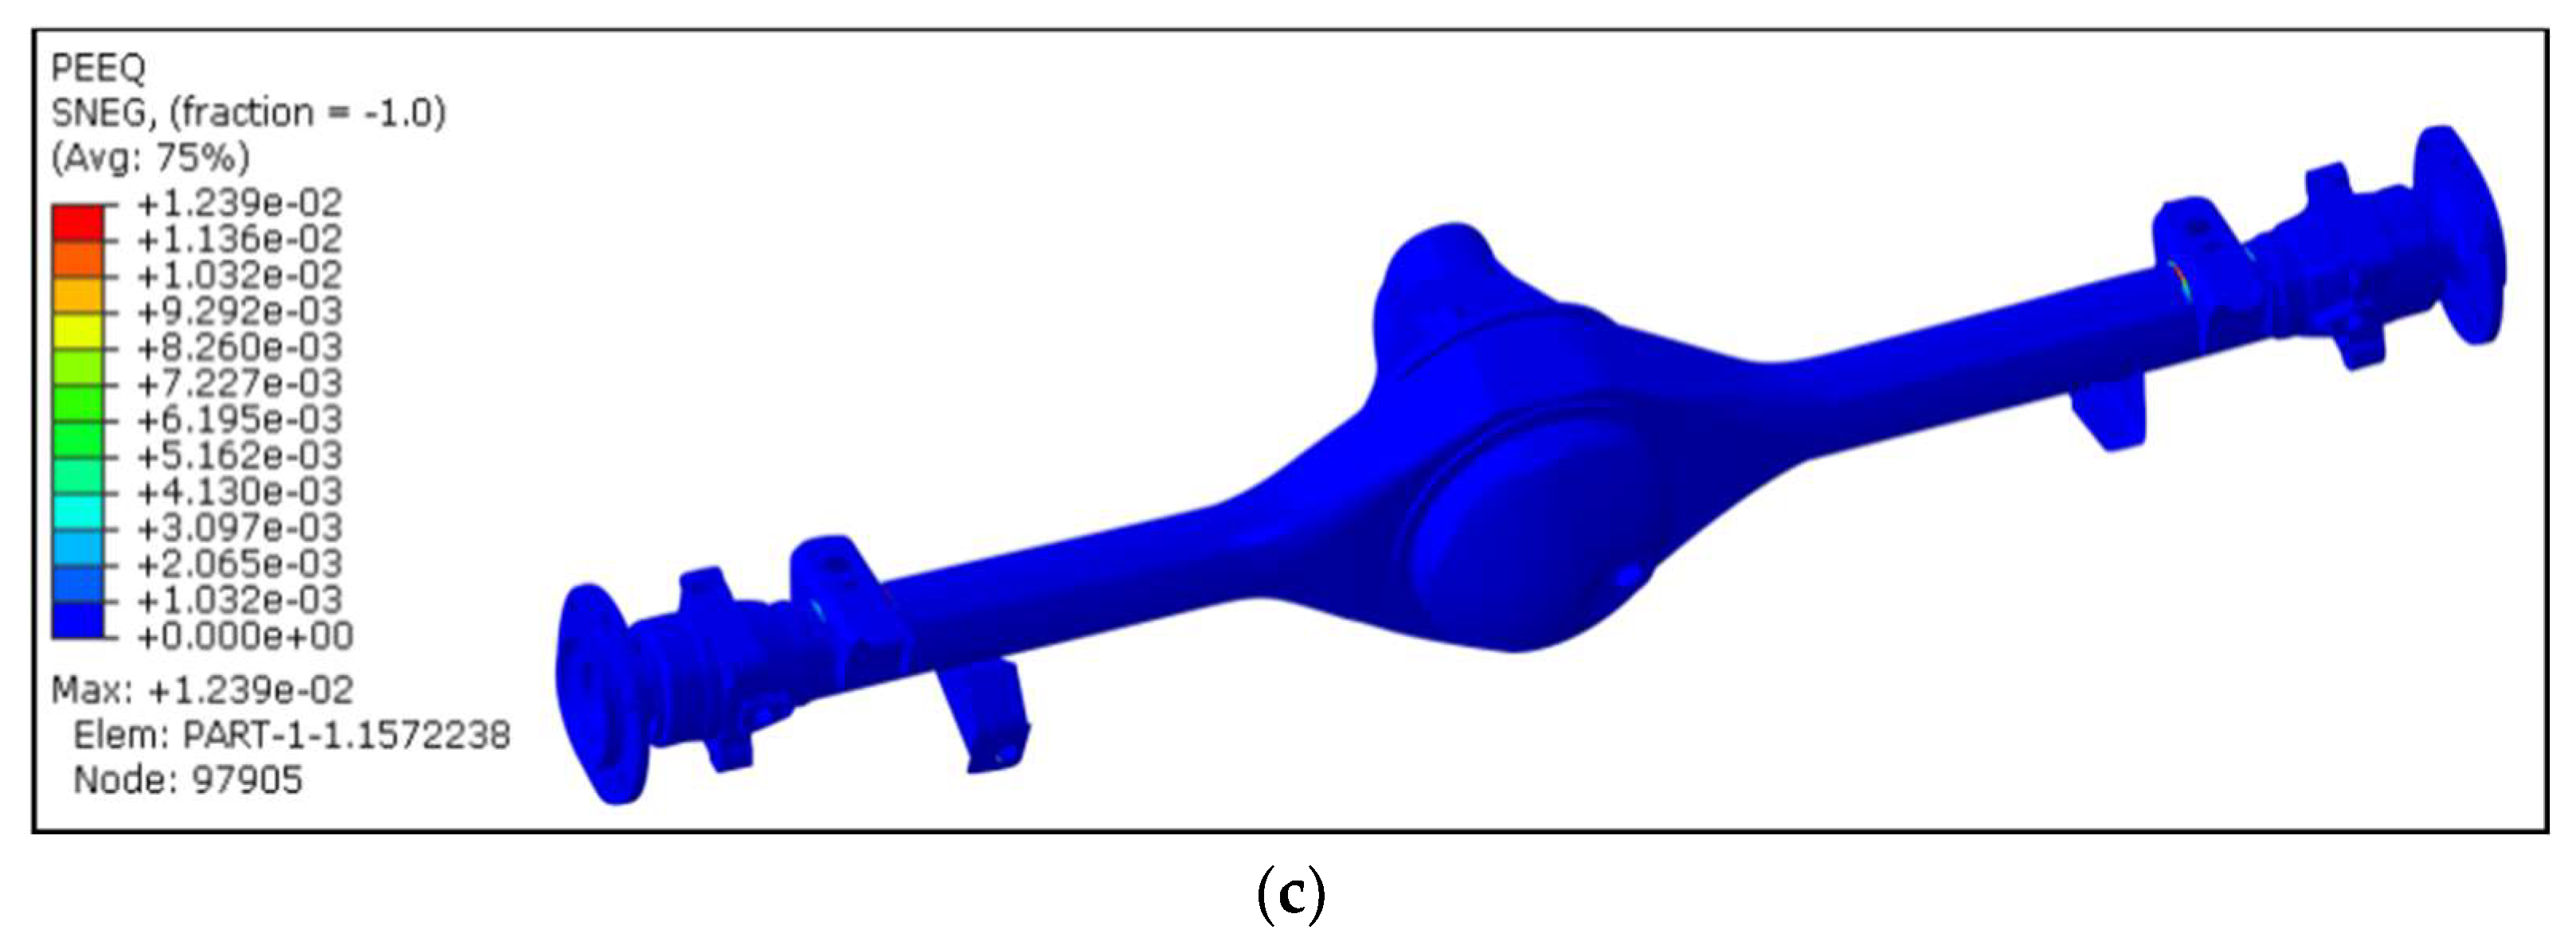
  • The finite element analysis indicates that the drive axle housing undergoes slight plastic deformation, not exceeding 1%. The maximum stress experienced by the drive shaft is 455.2 MPa, which does not lead to noticeable damage or fracture failure. However, under extreme skid conditions, the plastic deformation of the drive axle housing exceeds 1%, and the contact stress between the bearing and the drive shaft reaches 5915 MPa. The maximum stress value near the friction weld joint of the inner segment of the drive shaft is 676 MPa, surpassing the fatigue limit stress of the medium-frequency quenched material. Under this working condition, permanent damage to the drive shaft occurs.
  • OEMs should reassess the overall quality of the vehicle, and the heat treatment process should be reassessed to prevent re-breaking of the drive shaft.

Author Contributions

Conceptualization, Z.H. and J.W.; methodology, Y.J. and Y.H.; software, X.W. and J.W.; validation, Z.H. and Y.H.; Formal analysis, Z.H., J.W., Y.J., Y.X. and X.W.; investigation, Y.H., Y.X., X.W. and Y.J.; resources, Z.H. and Y.H.; data curation, Y.X. and X.W.; writing—original draft preparation, J.W.; writing—review and editing, Z.H. and Y.J.; visualization, Y.X. and X.W.; supervision, Z.H. and Y.H.; project administration, Y.J., Y.X. and X.W. All authors have read and agreed to the published version of the manuscript.

Funding

This research was supported by the Major Scientific and Technological Achievements Ripening and Engineering Research Project of Jiangxi Province (No. 20232AEI92001).

Data Availability Statement

Data are contained within the article.

Acknowledgments

The authors gratefully acknowledge Yihua Hu for his help in supervision, as well as Xiongfei Wan’s efforts in software.

Conflicts of Interest

Authors Yihua Hu, Yong Xu and Xiongfei Wan were employed by the company Jiangxi Jiangling Chassis Co., Ltd. The remaining authors declare that the research was conducted in the absence of any commercial or financial relationships that could be construed as a potential conflict of interest.

References

  1. Hou, N.; Ding, N.; Qu, S.; Guo, W.; Liu, L.; Xu, N.; Tian, L.; Xu, H.; Chen, X.; Zaïri, F.; et al. Failure Modes, Mechanisms and Causes of Shafts in Mechanical Equipment. Eng. Fail. Anal. 2022, 136, 106216. [Google Scholar] [CrossRef]
  2. Zhao, L.H.; Xing, Q.K.; Wang, J.Y.; Li, S.L.; Zheng, S.L. Failure and Root Cause Analysis of Vehicle Drive Shaft. Eng. Fail. Anal. 2019, 99, 225–234. [Google Scholar] [CrossRef]
  3. Anoop, M.S.; Dhanesh, S. Failure Analysis and Design Optimization of Alternator Shaft Used in Rail Coaches. Mater. Today Proc. 2021, 45, 1403–1410. [Google Scholar] [CrossRef]
  4. Cui, T.; Li, Y.; Luo, F.; Wang, C. Fracture Mechanism of Transmission Spindle System for High-Speed Tracked Vehicle. Eng. Fail. Anal. 2022, 136, 106174. [Google Scholar] [CrossRef]
  5. Zhang, Z.; Yin, Z.; Han, T.; Tan, A.C.C. Fracture Analysis of Wind Turbine Main Shaft. Eng. Fail. Anal. 2013, 34, 129–139. [Google Scholar] [CrossRef]
  6. Zhu, C.; He, J.; Peng, J.; Ren, Y.; Lin, X.; Zhu, M. Failure Mechanism Analysis on Railway Wheel Shaft of Power Locomotive. Eng. Fail. Anal. 2019, 104, 25–38. [Google Scholar] [CrossRef]
  7. Xu, Z.; Cui, Y.; Li, B.; Liu, K.; Shi, F.; Cao, P. Impact Analysis of Initial Cracks’ Angle on Fatigue Failure of Flange Shafts. Coatings 2022, 12, 276. [Google Scholar] [CrossRef]
  8. Pantazopoulos, G.; Zormalia, S.; Vazdirvanidis, A. Investigation of Fatigue Failure of Roll Shafts in a Tube Manufacturing Line. J. Fail. Anal. Prev. 2010, 10, 358–362. [Google Scholar] [CrossRef]
  9. Wang, L.; Yang, X.; Yan, X. Avoid Bogie Bearing Failure of IGBT Inverter Fed EMUs and Locomotives. Electronics 2023, 12, 2998. [Google Scholar] [CrossRef]
  10. Zhang, P.; Jiang, Y.; Li, Y.; Gong, J.; Sun, N. Experimental and Simulative Failure Analysis of AISI 316L Stainless Steel Screw Shaft. J. Fail. Anal. Prev. 2018, 18, 799–808. [Google Scholar] [CrossRef]
  11. Ntritsos, D.G.; Tsolakis, A.D.; Giannakopoulos, K.I. Experimental and Analytical Approach of Fatigue Behavior of Stepped CK45 Shaft with Adjacent Key Groove. Procedia Struct. Integr. 2018, 10, 288–294. [Google Scholar] [CrossRef]
  12. Xiaolei, X.; Zhiwei, Y. Failure Analysis of a Locomotive Turbocharger Main-Shaft. Eng. Fail. Anal. 2009, 16, 495–502. [Google Scholar] [CrossRef]
  13. Ghosh, D.; Roy, H.; Mondal, A. Failure Investigation of Condensate Pump Shaft. J. Fail. Anal. Prev. 2014, 14, 450–453. [Google Scholar] [CrossRef]
  14. Sitthipong, S.; Towatana, P.; Sitticharoenchai, A. Failure Analysis of Metal Alloy Propeller Shafts. Mater. Today Proc. 2017, 4, 6491–6494. [Google Scholar] [CrossRef]
  15. Yu, Z.; Xu, X. Fatigue Fracture of a Locomotive Diesel Engine Cardan-Shaft. J. Fail. Anal. Prev. 2014, 14, 405–411. [Google Scholar] [CrossRef]
  16. Liu, Y.; Lian, Z.; Xia, C.; Qian, L.; Liu, S. Fracture Failure Analysis and Research on Drive Shaft of Positive Displacement Motor. Eng. Fail. Anal. 2019, 106, 104145. [Google Scholar] [CrossRef]
  17. Klinger, C.; Bettge, D. Axle Fracture of an ICE3 High Speed Train. Eng. Fail. Anal. 2013, 35, 66–81. [Google Scholar] [CrossRef]
  18. Guimaraes, A.V.; Brasileiro, P.C.; Giovanni, G.C.; Costa, L.R.O.; Araujo, L.S. Failure Analysis of a Half-Shaft of a Formula SAE Racing Car. Case Stud. Eng. Fail. Anal. 2016, 7, 17–23. [Google Scholar] [CrossRef]
  19. Zangeneh, S.; Ketabchi, M.; Kalaki, A. Fracture Failure Analysis of AISI 304L Stainless Steel Shaft. Eng. Fail. Anal. 2014, 36, 155–165. [Google Scholar] [CrossRef]
  20. Huda, Z.; Taib, N.I. Failure of car’s drive shaft under torsion. Mater. Technol. 2011, 26, 52–57. [Google Scholar] [CrossRef]
  21. Diler, A.A.; Gurgen, S.; Sert, A. Failure analysis of an axle shaft in an airport ground support vehicle. Proc. Inst. Mech. Eng. Part L J. Mater.-Des. Appl. 2023, 237, 925–940. [Google Scholar] [CrossRef]
  22. Bian, X.; Liu, Y.; Zhang, J. Fracture Analysis on Involute Spline of Large Tunnel Boring Machine. Eng. Fail. Anal. 2022, 142, 106728. [Google Scholar] [CrossRef]
  23. Maurya, P.; Mulani, N.; Michael, C.; Jebaseelan, D. Failure Analysis of Drive Axle Shaft Failed under Torsional Stress. IOP Conf. Ser. Mater. Sci. Eng. 2021, 1128, 012011. [Google Scholar] [CrossRef]
  24. Kowalski, S.; Barta, D.; Dižo, J.; Dittrich, A. Assessment of the Wear of a Repeatedly Disassembled Interference-Fit Joint Operating under Rotational Bending Conditions. Appl. Sci. 2023, 13, 3902. [Google Scholar] [CrossRef]
  25. Miranda, R.S.; Cruz, C.; Cheung, N.; Cunha, A.P.A. Fatigue Failure Analysis of a Speed Reduction Shaft. Metals 2021, 11, 856. [Google Scholar] [CrossRef]
  26. Hou, X.Q.; Li, Y.; Liu, C.K.; He, Y.H. Fracture Failure Analysis of a 30CrMnSiA Steel Shaft. J. Fail. Anal. Prev. 2012, 12, 485–489. [Google Scholar] [CrossRef]
  27. Nassef, G.A.; Elkhatib, A.; Yakout, M. Analysis of a Failed Rocker Arm Shaft of a Passenger Car Engine. Case Stud. Eng. Fail. Anal. 2016, 5–6, 10–14. [Google Scholar] [CrossRef]
  28. Nguyen, T.; Romios, M.; Es-Said, O.S. Failure of a Conveyor Trunnion Shaft on a Centrifuge. Eng. Fail. Anal. 2004, 11, 401–412. [Google Scholar] [CrossRef]
  29. Muhammad, W.; Mairaj Deen, K. Failure Analysis of Water Pump Shaft. J. Fail. Anal. Prev. 2010, 10, 161–166. [Google Scholar] [CrossRef]
  30. Sun, S.; Yu, X.; Chen, X. Study of Component Structural Equivalent Fatigue Based on a Combined Stress Gradient Approach and the Theory of Critical Distance. Eng. Fail. Anal. 2016, 60, 199–208. [Google Scholar] [CrossRef]
  31. Trifkovic, D.; Stupar, S.; Bosnjak, S.; Milovancevic, M.; Krstic, B.; Rajic, Z.; Dunjic, M. Failure Analysis of the Combat Jet Aircraft Rudder Shaft. Eng. Fail. Anal. 2011, 18, 1998–2007. [Google Scholar] [CrossRef]
  32. Negru, R.; Muntean, S.; Pasca, N.; Marsavina, L. Failure Assessment of the Shaft of a Pumped Storage Unit. Fatigue Fract. Eng. Mater. Struct. 2014, 37, 807–820. [Google Scholar] [CrossRef]
  33. Lee, D.W.; Lee, S.J.; Cho, S.S.; Joo, W.S. Failure of Rocker Arm Shaft for 4-Cylinder SOHC Engine. Eng. Fail. Anal. 2005, 12, 405–412. [Google Scholar] [CrossRef]
  34. Chaudhary, S.K.; Rajak, A.K.; Ashish, K. Failure Analysis of Rear Axle Shaft of a Heavy Vehicle. Mater. Today Proc. 2021, 38, 2235–2240. [Google Scholar] [CrossRef]
  35. Godec, M.; Mandrino, D.; Jenko, M. Investigation of the fracture of a car’s drive shaft. Eng. Fail. Anal. 2009, 16, 1252–1261. [Google Scholar] [CrossRef]
  36. Hamandi, F.; Whatley, S.; Simon, G.; Venkatarayappa, I.; Goswami, T. Failure Analysis of a Femoral Cephalomedullary Nail. Metals 2023, 13, 506. [Google Scholar] [CrossRef]
  37. Li, J.; Wu, T.; Chi, W.; Hu, Q. Teenhang Meen Integrated Analysis of Influence of Multiple Factors on Transmission Efficiency of Loader Drive Axle. Energies 2019, 12, 4540. [Google Scholar] [CrossRef]
  38. Domazet, Ž.; Lukša, F.; Bugarin, M. Failure of Two Overhead Crane Shafts. Eng. Fail. Anal. 2014, 44, 125–135. [Google Scholar] [CrossRef]
  39. Azevedo, T.F.; Sampaio WR, V.; Câmara EC, B.; Lima, G.D.; dos Santos Silva, W.F.; da Silva Ramos, S. Failure Analysis of a Sugarcane Loader Rear Shaft. Eng. Fail. Anal. 2020, 109, 104326. [Google Scholar] [CrossRef]
  40. Fonte, M.; Freitas, M. SEMI-ELLIPTICAL FATIGUE CRACK GROWTH under ROTATING or REVERSED BENDING COMBINED with STEADY TORSION. Fatigue Fract. Eng. Mater. Struct. 1997, 20, 895–906. [Google Scholar] [CrossRef]
  41. Yu, Z.; Xu, X.; Guo, X. Failure Investigation of a Locomotive Turbocharger Main Shaft and Bearing Sleeve. J. Fail. Anal. Prev. 2010, 11, 167–174. [Google Scholar] [CrossRef]
  42. Shu, D.L. Mechanical Properties of Engineering Materials, 3rd ed.; China Machine Press: Beijing, China, 2016. [Google Scholar]
  43. Yin, P.; Zang, H.; Zhao, Y.; Wu, C.; Xu, X.; Pan, D.; Jiang, W. Superior Mechanical Properties of 40Cr Steel Obtained by Quenching and Microstress Relieving under Electropulsing. Mater. Sci. Eng. A 2020, 772, 138782. [Google Scholar] [CrossRef]
  44. Li, H.; Zhou, H.; Zhang, D.; Zhang, P.; Zhou, T.; Su, W. Comparative Study of Induction Quenching and Laser Surface Texturing on Anti-Wear Performance of 40Cr Steel. J. Mater. Eng. Perform. 2021, 30, 2238–2244. [Google Scholar] [CrossRef]
  45. Hu, J.J.; Zhang, G.B.; Xu, H.B.; Chen, Y.F. Microstructure Characteristics and Properties of 40Cr Steel Treated by High Current Pulsed Electron Beam. Mater. Technol. 2012, 27, 300–303. [Google Scholar] [CrossRef]
  46. GB/T 229-2020; Charpy Pendulum Impact Test Method for Metallic Materials. PRC National Bureau of Standards (NBS): Beijing, China, 2020.
  47. GB/T 3077-1999; Alloy Structural Steel. PRC National Bureau of Standards (NBS): Beijing, China, 1999.
  48. Liu, Y.; Lian, Z.; Zou, J.; Deng, C.; He, Y. Fracture Failure Analysis and Research on Thread Joint of Drive Shaft Shell of Positive Displacement Motor. Eng. Fail. Anal. 2020, 118, 104805. [Google Scholar] [CrossRef]
  49. Sun, X.F.; Guan, L.T.; Fang, X.S. Mechanics of Materials, 5th ed.; Higher Education Press (PRC): Beijing, China, 2009. [Google Scholar]
  50. Maslak, T.; Karuskevich, M. Introduction of Crystallographic Factor into the von Mises Equivalent Stress Calculation. Fatigue Fract. Eng. Mater. Struct. 2022, 46, 1211–1214. [Google Scholar] [CrossRef]
  51. Wang, Y.Z.; Li, G.Q.; Wang, Y.B.; Lyu, Y.F. Simplified Method to Identify Full von Mises Stress-Strain Curve of Structural Metals. J. Constr. Steel Res. 2021, 181, 106624. [Google Scholar] [CrossRef]
  52. Xu, L.; Yu, X.; Hou, Z. Analysis of the Causes of Driving Gear Shaft Fractures in Gear Pumps. J. Fail. Anal. Prev. 2020, 20, 242–248. [Google Scholar] [CrossRef]
Figure 1. Drive Axle Assembly.
Metals 14 00641 g001
Figure 2. Geometry of the axle shaft.
Metals 14 00641 g002
Figure 3. The broken drive shaft. (a) Macro-rupture; (b) fracture surface zoning.
Metals 14 00641 g003
Figure 4. 3D model of the drive shaft with cutting position and metallographic structure plane.
Metals 14 00641 g004
Figure 5. Tensile testing machines and samples.
Metals 14 00641 g005
Figure 6. Finite element model of drive axle assembly.
Metals 14 00641 g006
Figure 7. Magnified SEM micrograph of regions. (a) Crack source region; (b) Region 1; (c) Region 2; (d) Region 3; (e) Region 4; (f) Region 5.
Metals 14 00641 g007aMetals 14 00641 g007b
Figure 8. Metallographic organization near the fracture. (a) Induction quenching layer 100×; (b) induction quenching layer 500×; (c) core tempering zone 100×; (d) core tempering zone 500×.
Metals 14 00641 g008
Figure 9. Rockwell hardness of the drive shaft.
Metals 14 00641 g009
Figure 10. Simulation of 1G load operation. (a) Torsional stress; (b) bending stress; (c) line displacement; (d) angular displacement.
Metals 14 00641 g010
Figure 11. Side slip simulation under 1G load. (a) Boundary condition of drive axle; (b) stress of drive shaft at left side slip; (c) stress of drive shaft at right side slip.
Metals 14 00641 g011
Figure 12. Vertical bending simulation under 4G load. (a) Boundary condition of drive axle assembly; (b) displacement of drive axle assembly; (c) stress of drive shaft; (d) stress near fracture.
Metals 14 00641 g012
Figure 13. Simulation of vertical bending with 4G load under overload. (a) Displacement of drive axle assembly; (b) stress of drive shaft; (c) plastic strain of drive axle assembly.
Metals 14 00641 g013aMetals 14 00641 g013b
Figure 14. Side slip simulation under overload. (a) Plastic strain of drive axle assembly; (b) stress of drive shaft at left side slip; (c) stress of drive shaft at right side slip.
Metals 14 00641 g014aMetals 14 00641 g014b
Figure 15. Side slip simulation after 4G impact under overload. (a) Stress of drive shaft at left side slip; (b) stress of drive shaft at right side slip.
Metals 14 00641 g015
Figure 16. Extreme side slip simulation under overload. (a) Stress of drive shaft; (b) plastic strain of drive axle housing; (c) contact stresses on bearing; (d) plastic strain of bearing.
Metals 14 00641 g016
Table 1. Chemical composition of drive shaft material (wt%).
ElementCSSiMnPCr
Specification0.37–0.44≤0.0350.17–0.370.50–0.80≤0.0350.80–1.10
Actual0.390.0070.260.550.0110.93
Table 2. Mechanical properties of the drive shaft material.
IndexTS (MPa)YS (MPa)Δ (%)Ψ (%)
Stretch 1 #101282323.065
Stretch 2 #103684622.566
Stretch 3 #102582723.065
Standard requirements≥980≥785≥9≥45
Table 3. Testing results of the hardness (HRC).
Index123456789Standard Requirements
hardness of surface48.451.5525251.75251.549.149.848–61
hardness of core23.1222222.524.824.125.622.522.224–32
Table 4. Testing results of the impacts.
IndexImpact 1 #Impact 2 #Impact 3 #
KU 2 (J)144152148
Standard requirements≥47
Table 5. Mesh quality details.
Evaluation IndicatorsFailure StandardNumber of Failed Mesh CellsPercentage of Failed Mesh Cells
Min size2.02000.33
Max size20.00.0070
Aspect ratio5.000
Warpage15.000
Skew40.000
Jacobian0.600
Trias15.018483.1
Disclaimer/Publisher’s Note: The statements, opinions and data contained in all publications are solely those of the individual author(s) and contributor(s) and not of MDPI and/or the editor(s). MDPI and/or the editor(s) disclaim responsibility for any injury to people or property resulting from any ideas, methods, instructions or products referred to in the content.

