Article

Electrochemical Behaviour of an Au-Ge Alloy in an Artificial Saliva and Sweat Solution

1
Faculty of Sciences, University of Novi Sad, 21000 Novi Sad, Serbia
2
Faculty of Mechanical Engineering, University of Maribor, 2000 Maribor, Slovenia
3
Zlatarna Celje d.o.o., 3000 Celje, Slovenia
4
School of Dental Medicine, University of Belgrade, 11158 Belgrade, Serbia
*
Author to whom correspondence should be addressed.
Metals 2024, 14(6), 668; https://doi.org/10.3390/met14060668
Submission received: 7 May 2024 / Revised: 30 May 2024 / Accepted: 2 June 2024 / Published: 5 June 2024
(This article belongs to the Special Issue Feature Papers in Extractive Metallurgy)

Abstract

:
In modern times, more and more different materials (including alloys) are in direct contact with human electrolytes (sweat, saliva, lymph, blood, etc.). One of the most important properties for the use of these materials is therefore their chemical inertness or resistance to corrosion when they are in contact with human electrolytes. Consequently, during the development of such new materials, it is necessary to study and understand their basic electrochemical behaviour in a given environment. The purpose of this research was to monitor the electrochemical behaviour of the new Au-Ge alloy in artificial sweat and artificial saliva solutions, depending on the electrolyte composition and exposure time. This new alloy represents a potential material for use in dentistry or for jewellery. The obtained results of the study show that the immersion time and the pH value have a significantly greater influence on the corrosion resistance of the new Au-Ge alloy than the composition of the electrolyte solution. The results of the SEM/EDX analysis additionally confirm the main results of the electrochemical measurements.

1. Introduction

Nowadays, metals and alloys, apart from having significant and well-known applications as structural materials, increasingly find their role in our daily life as coins, zippers, buttons, in the form of various fashion accessories (jewellery, piercings, eyeglass frames, wrist watches, etc.), as a different type of orthopaedic and dental amalgam, implants, or prostheses, etc. All the above bring metals and alloys into short- or long-term contact with various physiological fluids (electrolytes), like sweat, saliva, lymph, blood, etc. Contacts between alloys and different types of human electrolytes can lead to electrochemical reactions (electrochemical corrosion). These electrochemical reactions are very important, because, on the one hand, they can change the metals’ (alloys) features, and they could also have an impact on human tissue characteristics and properties [1,2]. Because of this, one of the most important contacts for the usage of new materials is their chemical inertness or corrosion resistance during contact with human electrolytes. Consequently, during the development of new materials (alloys), it is essential to examine and understand their basic electrochemical behaviour in the given environment.
For a long time, nickel-based alloys have been used widely for the above purposes, but it is well known that nickel ions, which are formed through electrochemical corrosion under the influence of human sweat, can cause a strong allergic reaction in a high percentage of the population [3,4]. Consequently, many studies have been conducted so far with the aim of achieving an economically affordable and sustainable alternative to the conventional nickel alloy. Developing gold alloys for fashion accessories without nickel presents a challenge, as nickel provides the strength and hardness of the resulting alloy and has favourable casting characteristics for lost-wax casting, providing ease of flow and useful shrinkage during solidification, as well as good mechanical properties for rolling and machining during production. It is also a whitening element, suitable for producing commercially more interesting white gold products, which have increased in popularity on the jewellery market in the last few decades. Alternatives for nickel include palladium, platinum, or titanium, which increase the price of the alloy or the technological difficulty of production.
An alternative alloying element was found in Germanium during an attempt to produce a gold alloy with characteristics suitable for production, such as with the case of using nickel [5]. The design of the new Au-Ge alloy is aimed at achieving properties that are important for use in dentistry as a carrier alloy for porcelain dental reconstructions, and for use in jewellery for the production of a white Au pre-alloy. In both cases, the new Au-Ge alloy will need to have good mechanical characteristics and high biocompatibility with corrosion resistance. In jewellery, most manufacturers of white Au alloys use Ni as a key element for the final colouring, and some also use Pd. In the case of using Ni, the key issue is the release of nickel ions, which cause skin allergies, such as the Au-Ge alloy, which is said to have high electrical and thermal conductivity and corrosion resistance due to the Au content. Using Ge decreases the hardness, increases the flowability of the alloy, decreases shrinkage during alloy casting, and is more economically favourable than using other precious metals. This alloying element is a potentially appropriate component in the conventional gold–copper–zinc alloys for established production techniques in jewellery manufacturing companies. High amounts of germanium produce brittleness and decrease hardness in gold alloys, which is not practical for mechanical treatment. As such, a gold alloy containing a small amount of Ge, labelled as an Au-Ge alloy, was produced to investigate its properties as a substitute for nickel. On the other hand, the crucial information is that Ge compounds are relatively less toxic when compared to other metalloids and metals [6]. Based on this, Ge is used for medical purposes as different agents to repair bones with infected bone defects [7]. Ge is not cytotoxic at a low doping level and is not carcinogenic [8], and even appears to inhibit inflammatory processes in the effective clinical treatment for mastitis and other inflammatory diseases [9,10]. He has been considered biocompatible, and, in the antimicrobial surface coatings, has been recommended as a bio-implant material for the first time [11]. The aim of this research was to investigate the electrochemical behaviour of one new Au-Ge alloy as potential jewellery or dental materials in an artificial sweat and artificial saliva solution. Human sweat has a complex composition (different types of electrolytes, organic acids, carbohydrates, amino acids, etc.) [12,13], which varies greatly in the function of different physical, environmental, and pharmacological conditions, such as age and sex, body weight, general body condition, etc. Human saliva, like sweat, can vary a lot in its composition, also depending on the age and gender of the patient, but oral hygiene and eating habits, such as the time of day, often have an additional effect [14,15]. Because of that, different types of artificial saliva are usually used in investigations [16]. The most used artificial saliva for the investigation of the electrochemical properties of dental metals and alloys is a modified Fusayama’s solution [17].

2. Materials and Methods

The Au-Ge alloy was produced with raw materials with a high purity as follows: Au 99.99%, Cu 99.99%, Zn 99.99%, Ge 99.99%, and Ir 99.99% (Legor Group S.p.A., Bressanvido, Italy), with a proprietary final composition [5]. The casting of the alloy was performed in a protective atmosphere of Ar 5.0 with a clay graphite crucible at 1100 °C. The casting was performed with a rod with a diameter of 20 mm, which was then rolled through steps of deformation into a square profile strip with a thickness of 1 mm by 10 mm width. The strip was then cut into tiles with a length of 10 mm each. The final tiles, with the dimensions 10 × 10 × 1 mm, were used as samples for the artificial saliva and sweat solution testing.
The artificial sweat composition used was as follows: 20 g/L NaCl, 17.5 g/L, NH4Cl, 5 g/L acetic acid, and 15 g/L lactic acid. The artificial sweat solution pH value was adjusted to 4.7 by NaOH [18,19].
The used artificial saliva (modified Fusayama’s solution) composition was as follows: 0.400 g/L NaCl, 0.400 g/L KCl, 0.795 g/L CaCl2∙2H2O, 0.690 g/L NaH2PO4∙H2O, 0.005 g/L Na2S∙9H2O, and 1.000 g/L urea. The original pH of the solution was 4.81. In human saliva, there is often a short-term decrease in the pH value that occurs during the intake of acidic foods and drinks, as well as due to the secretion of stomach acid. In order to obtain information about the effect of lowering the pH value on the electrochemical behaviour of the investigated alloy, in addition to the original artificial saliva solution, research was also conducted on the artificial saliva solution in which the pH was adjusted to 2.51 using lactic acid [14].
A three-electrode cell was used for the electrochemical measurements, with the Au-Ge alloy as the working electrode, the saturated calomel electrode (SCE) as the reference electrode, and the platinum as the counter electrode. The working electrode was constructed from an Au-Ge alloy plate, with an exposed area of 0.5 cm2, embedded in an epoxy resin. The electrode was wet polished with SiC papers (grit sizes of 800 and 1200), rinsed with acetone and double distilled water, and then immersed into the electrolyte solution. A PC controlled VoltaLab PGZ 301 (Radiometer Analytical SAS, Villeurbanne, France) was applied for electrochemical measurements. The potentiodynamic measurements were performed after immersion times of 1 h, 24 h, 72 h, and after 7 days at room temperature (approximately 25 °C). The potential was scanned between OCP and −700 mV/SCE in the cathodic direction and back to the anodic direction (+700 mV/SCE) at a scan rate of 1 mV/s.
The measurements of electrochemical impedance spectra (EIS) were also performed after immersion times of 1 h, 24 h, 72 h, and after 7 days at the open-circuit potential, (OCP) and at room temperature. The EIS measurements were carried out over a frequency range of 0.01 Hz–10 kHz, using 10 mV amplitude of sinusoidal voltage.
An additional scanning electron microscopy/energy-dispersive X-ray spectrometry (SEM/EDX) analysis was performed on the Au-Ge alloy samples after 24 h of immersion time in artificial sweat and saliva in order to determine the potential changes of the alloying elements on the surface of the alloy samples during the electrochemical measurements. The SEM used was an FEI Sirion 400 NC (FEI Technologies Inc., Hillsboro, OR, USA), equipped with an INCA 350 (Oxford Instruments, Oxfordshire, UK) microchemical spectrometer.

3. Results and Discussion

3.1. Artificial Sweat

3.1.1. Open-Circuit Potential Measurement—Artificial Sweat

Figure 1 shows the open-circuit potential (OCP) of the tested Au-Ge alloy as a function of the immersion time in the artificial sweat solution.
From Figure 1, it is evident that the open-circuit potential in all the investigated periods was very stable, and, during the given measurement (60 min), did not change significantly. On the other hand, the increase in the immersion time (from one hour to 7 days) caused a significant shift in the open-circuit potential towards the anodic direction (Table 1). The increases in the OCP values in the function of the immersion time and absence of potential drops associated with surface activation suggest that the natural corrosion products formed on the Au-Ge alloy surface are kinetically resistant to chemical dissolution [14,20], and can improve the Au-Ge alloy corrosion protection ability in an artificial sweat solution.

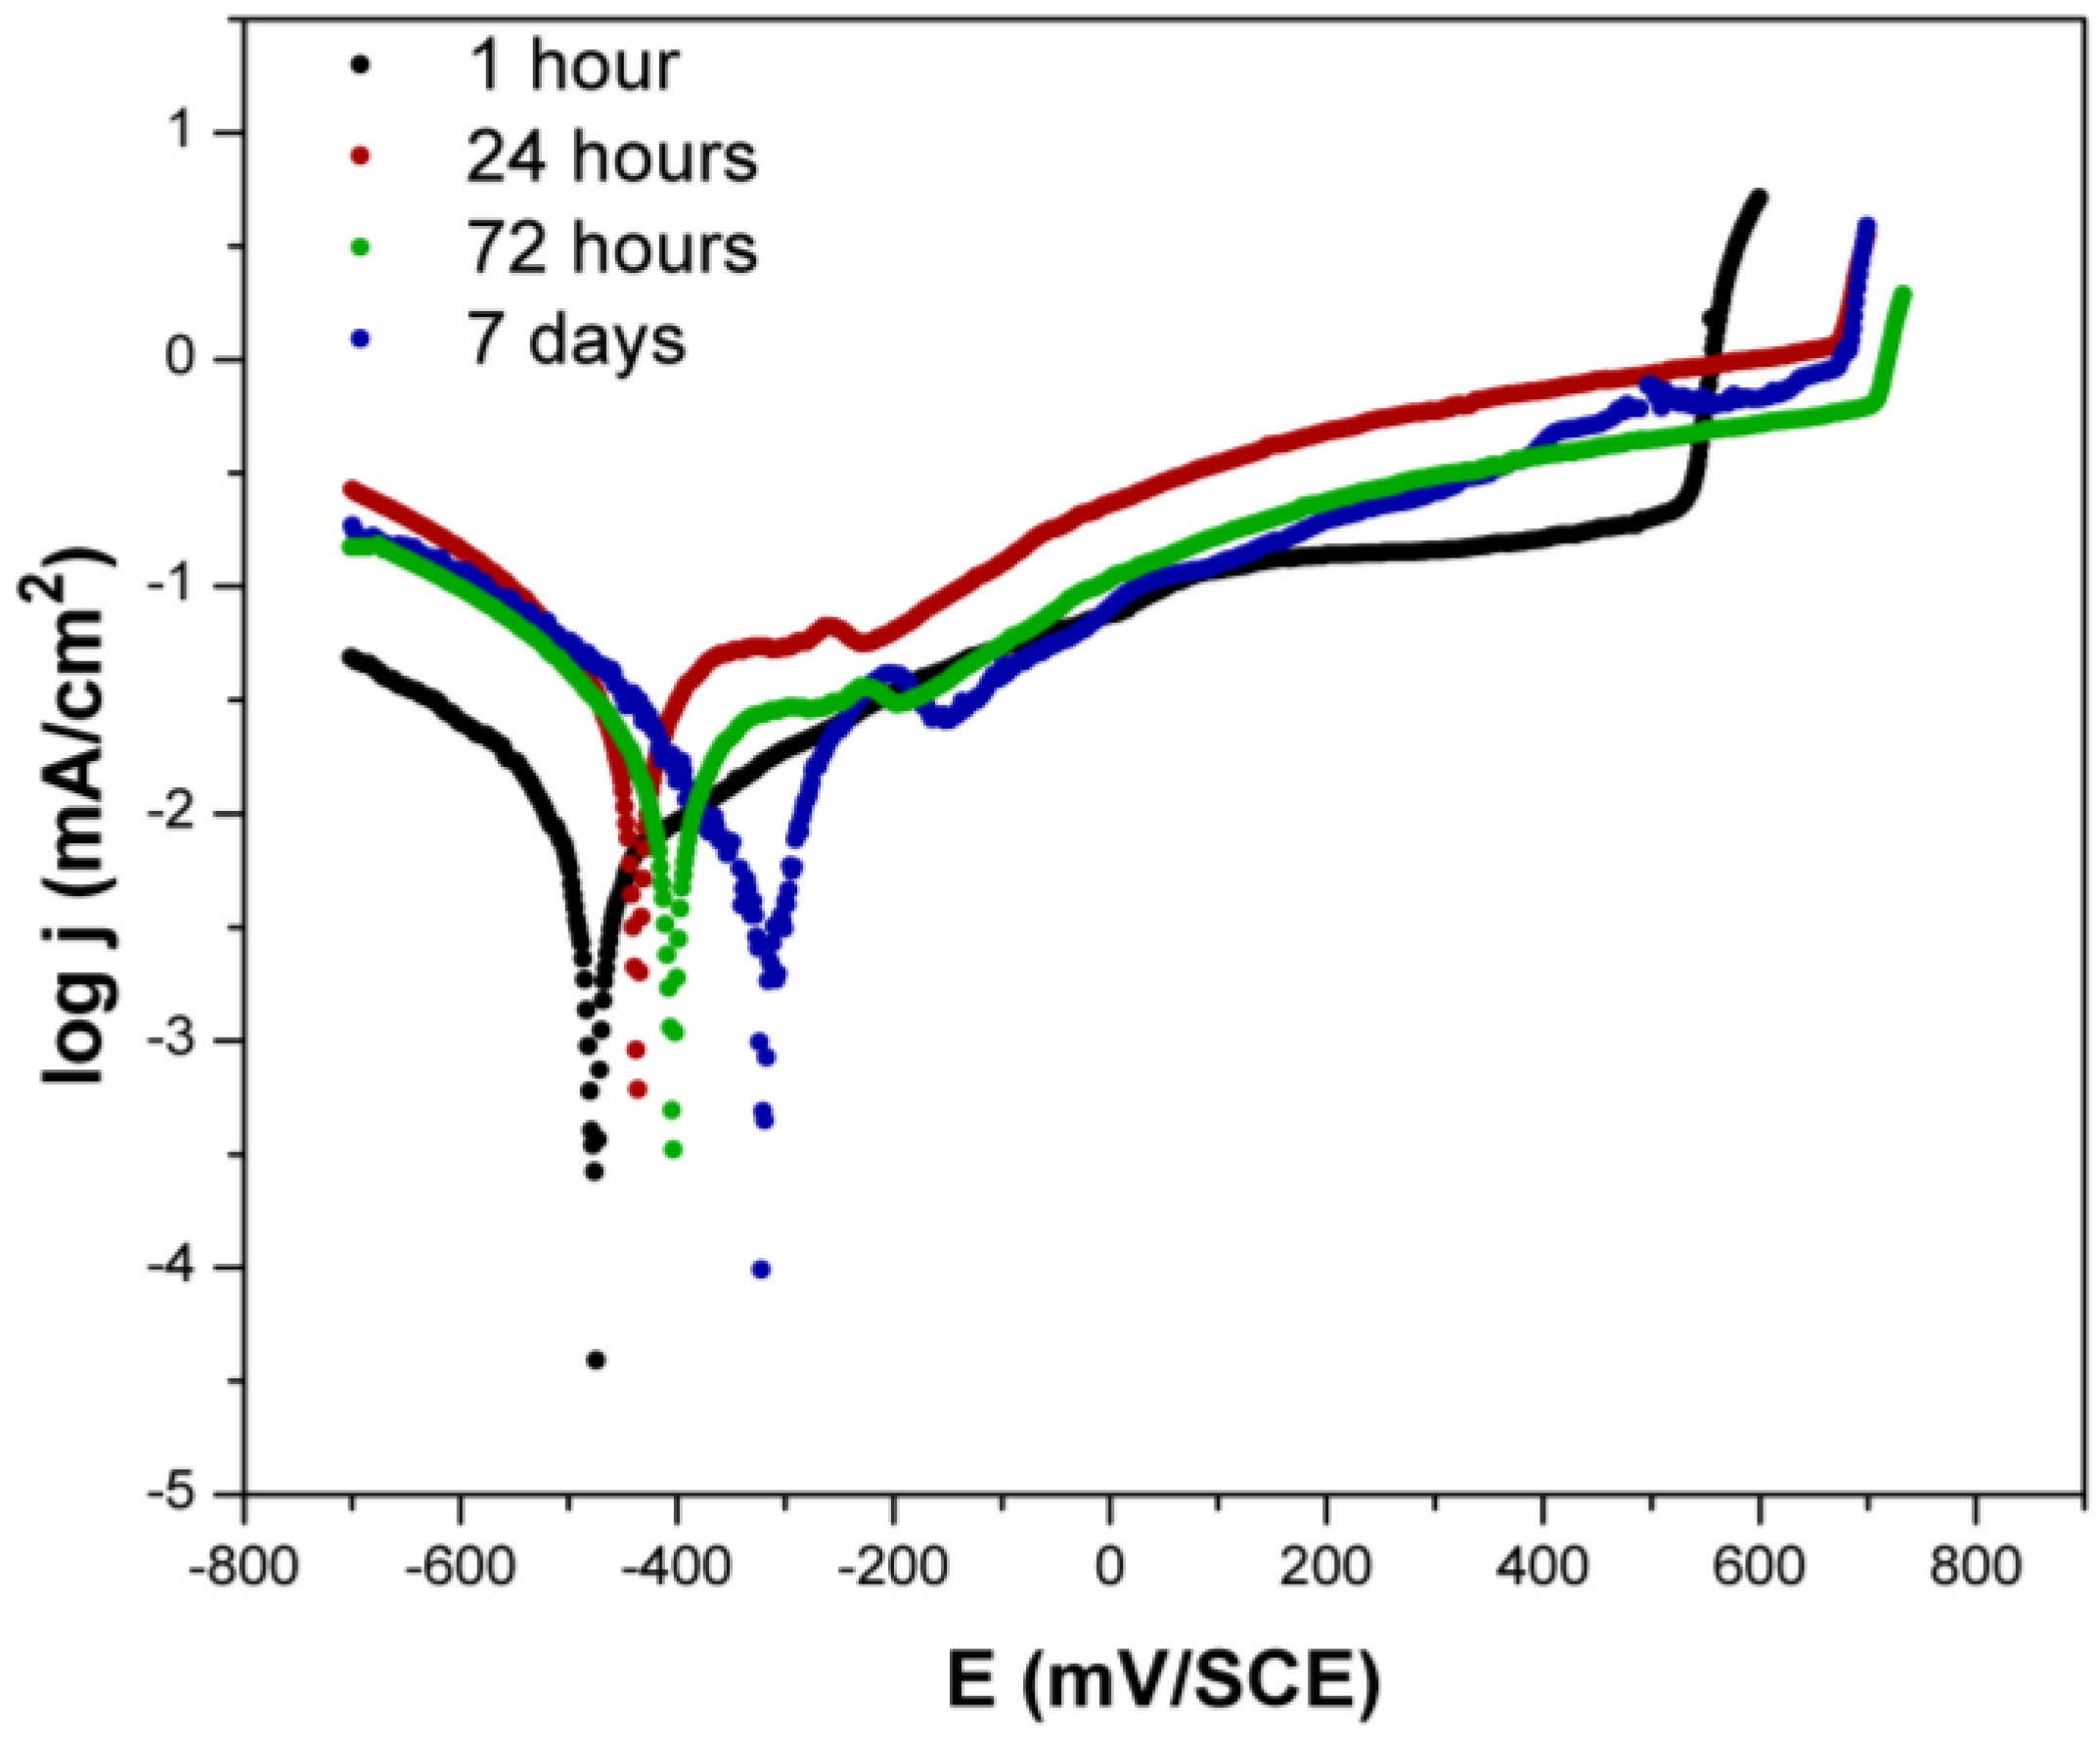
3.1.2. Potentiodynamic Measurements—Artificial Sweat

The potentiodynamic polarisation curves of the tested Au-Ge alloy immersed at different times in the artificial sweat solution are shown in Figure 2.
The corrosion parameters, namely corrosion potential (Ecorr), and corrosion current density (jcorr), are given in Table 1.
As can be seen from Figure 2 and from the data in Table 1, increasing the immersion time also led to a shift in the corrosion potential in the anodic direction and to a significant increase in the corrosion current density. This kind of behaviour suggests that the layer formed on the alloy’s surface in the artificial sweat solution formed a kind of insulating barrier, but it was, nevertheless, permeable to ions’ N exchange, which is especially pronounced during the electrode polarisation.
During all measurements, the passive current density can be registered in the anodic part of the polarisation curve up to about 600 mV, when active dissolution started again. The shape of the polarisation curves was the same in all cases; only the length of the Tafel’s, mixed (active-diffusion control, slight passivation) and passive region, as well as the value of the passive current density and breakdown potential, changed with the immersion time (Table 2). The shortest passive region was registered after 7 days of immersion, and the highest passive current density was registered after 24 h of immersion (Table 2). This behaviour of the alloy in the artificial sweat solution may indicate that it takes time for the Au-Ge surface to stabilise. On the other hand, the characteristics and protective properties of the Au-Ge alloy surface change slightly over time.

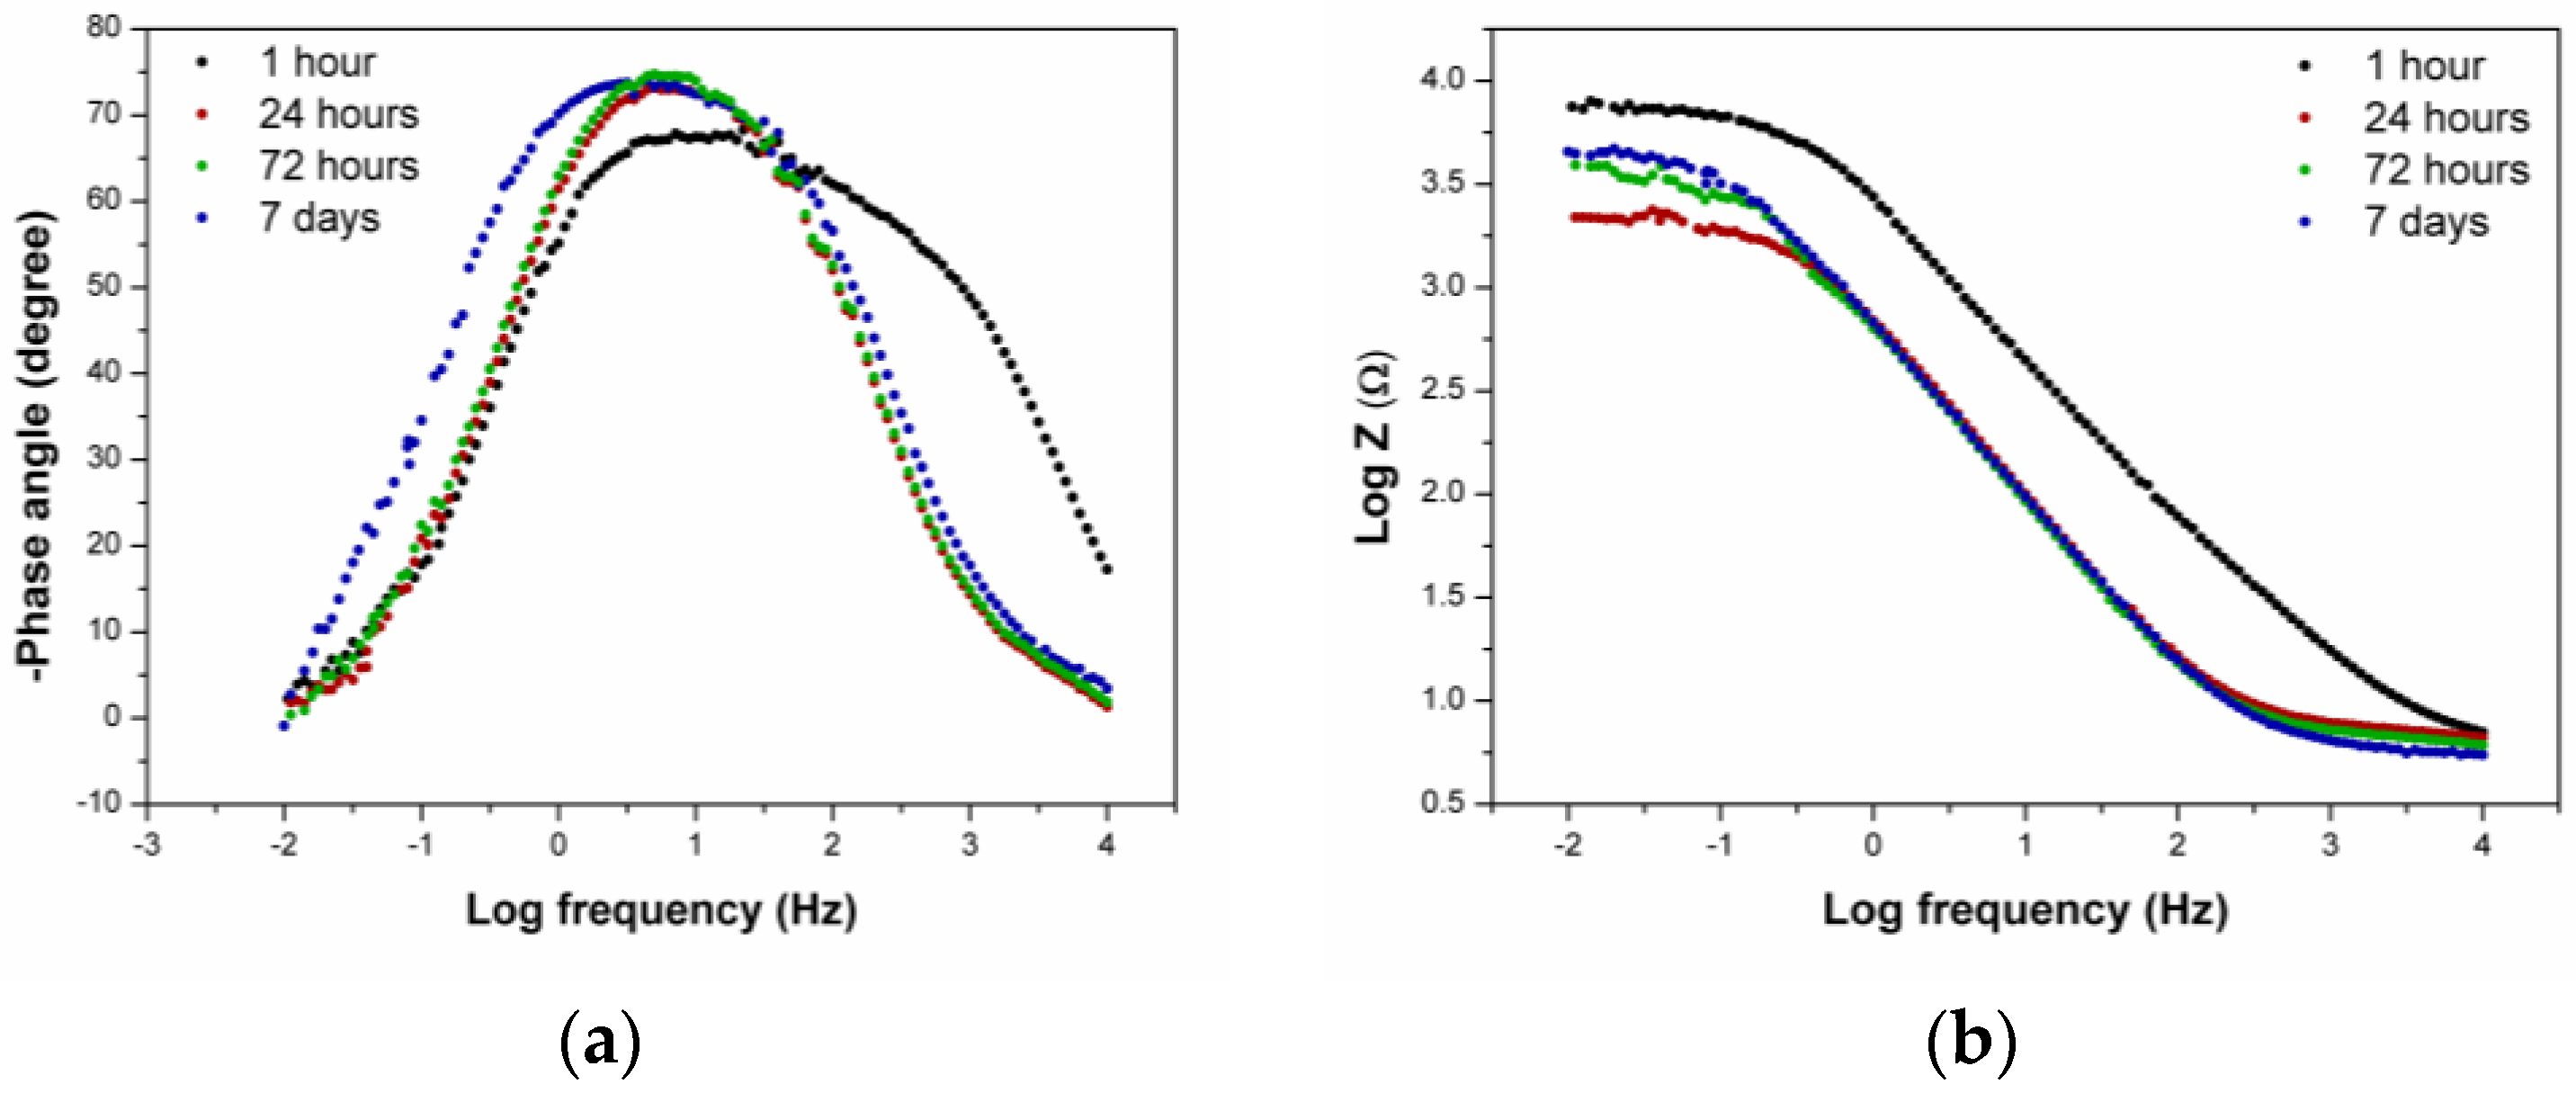
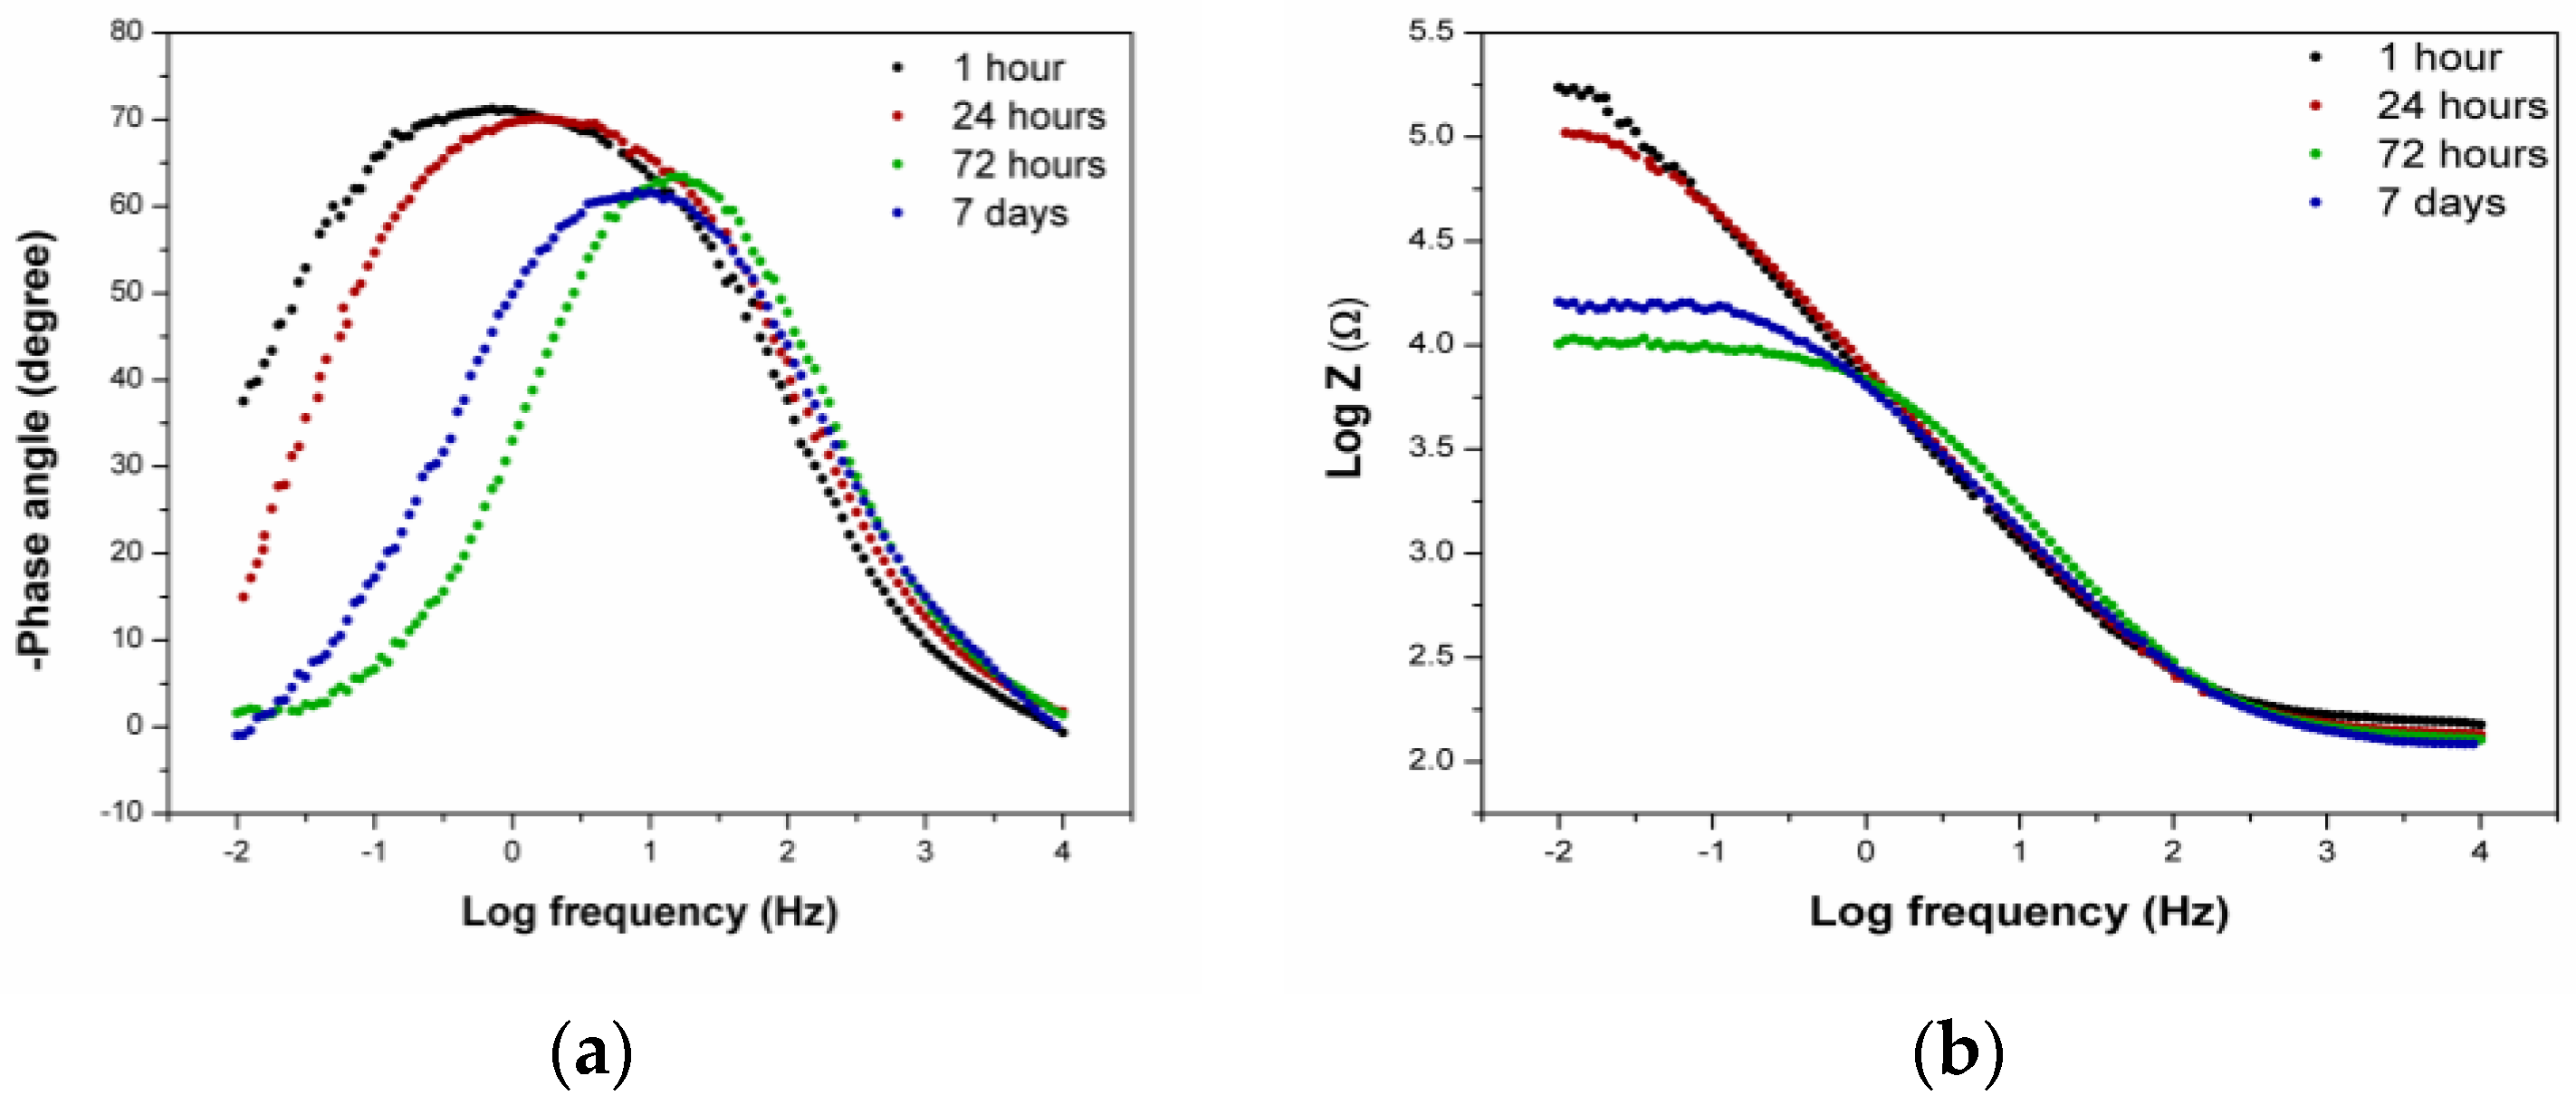
3.1.3. EIS Measurements—Artificial Sweat

The impedance spectra of the tested Au-Ge alloy in the artificial sweat solution at different open-circuit potentials are presented as the Bode phase (Figure 3a) and Bode magnitude (Figure 3b).
The Bode phase plots (Figure 3a) show a deviation in the behaviour of the alloy after 1 h of immersion and a similar behaviour after 24 h. After one hour of immersion in the Bode phase plots, two time constants can be registered, in contrast to the later measurements where only one time constant occurred (after 24 h). One of the time constants was at the low intermediate frequency region (phase angle approaching 0°), where the maximum phase angle (66°) was located at approximately 10 Hz. The second time constant was observed in the high intermediate frequency region with a phase angle which was not approaching 0°, and the maximum phase angle was ~58° at approximately 300 Hz. This time constant, at the intermediate frequency region, may correspond to the presence of the viscous film on the alloy’s surface, and could be associated with the formation of a corrosion product on the alloy’s surface [12,21,22].
During the immersion, after 24 h, a slight increase in the phase angle was registered, but it did not change further as a function of time. A slight increase in the phase angle at the beginning of the immersion time indicates that it takes time (approximately 24 h) to form and stabilise the actual performance of the Au-Ge alloy surface toward the corrosion process. The phase angle plots revealed only one peak for measurements after 24 h, indicating the involvement of a single time constant that now exists in the system. The maximum phase angles noticed in the range of approximately 70° to 80° in the low frequency range (~5 Hz) are typically characteristic of capacitive behaviour, corresponding to the good corrosion resistance of the materials [23], and are an indication of the presence of a layer on the alloy’s surface [14,24,25].
The Bode magnitude (Figure 3b) showed that, in all the measurements in the low frequency’s region, the high impedance values (log Z~45) for the tested alloys suggested a good corrosion resistance. The lowest impedance value was registered for the immersion time of 24 h. Furthermore, it should also be noted that, in the Bode absolute (Figure 3b) at high frequencies, for an immersion time of one hour, the modulus of impedance was in a decreasing trend, in contrast to the more or less constant modulus of impedance for other immersion times, which is characteristic behaviour based on the literature [26,27,28]. The non-constant behaviour of the constant modulus at high frequencies certainly confirms that, after one hour in artificial sweat, the film formed on the Au-Ge alloy surface was still rough and porous [23]. In other measurements (except after one hour), the slopes of Z as a function of frequency were approximately 0.8. This means that the protective layer formed on the alloy’s surface in the artificial sweat solution formed a kind of insulating barrier, but it was still permeable to ions from the solution [12,29].
Based on the EIS data, it is possible to establish which equivalent circuit is suitable for modelling the electrochemical behaviour of the tested Au-Ge alloy in artificial sweat solutions. Because of the fact that in the impedance spectra (Figure 3a,b), a non-ideal frequency response was evident, a constant phase element (Q) was used in the equivalent circuit, which was then converted to the double layer capacitance using the usual equation [12,23,30]. The obtained impedance spectra were fitted using the Rs (Rp Qdl) circuits, except for the 1 h immersion time, where the Rs (Rp Qdl) (Rf Cf) model was used. Table 3 gives the values of electrochemical parameters as follows: Rs (solution resistance), Rp (polarisation resistance), Cdl (double layer capacitance), Rf (film resistance), Cf (film capacitance), and n (constant phase exponent) obtained from the fitting of the EIS data.
As already stated, the immersion time of 1 h differs in the behaviour when compared to other times, and was described by a model with two time constants (Table 3). The second time constant relates to the presence of a film or corrosion products on the alloy’s surface. As can be seen from the results (Table 3) in periods from 24 h to 7 days, with the increase in the immersion time, there was a slight increase in the polarisation resistance (Rp) and the double layer capacitance (Cdl). The obtained results, as in the case of the polarisation measurements, indicate that it takes time to stabilise the Au-Ge alloy’s surface and form permanent properties. Between the immersion times of 72 h and 7 days, there was no noticeable difference in the alloy behaviour.

3.2. Artificial Saliva

3.2.1. Open-Circuit Potential Measurement—Artificial Saliva

As in the case of the investigation with the artificial sweat solution, the open-circuit potential was very stable during the tested period in the artificial saliva, and did not change significantly during the given measurement (60 min). Increasing the immersion time (from one hour to 7 days) caused a significant shift in the open-circuit potential, unlike the sweat solution, towards the cathodic direction (Table 4). This kind of behaviour suggests that the layer formed on the alloy’s surface blocked the active cathodic part, and therefore the reduction reaction was shifted to a more negative potential range.

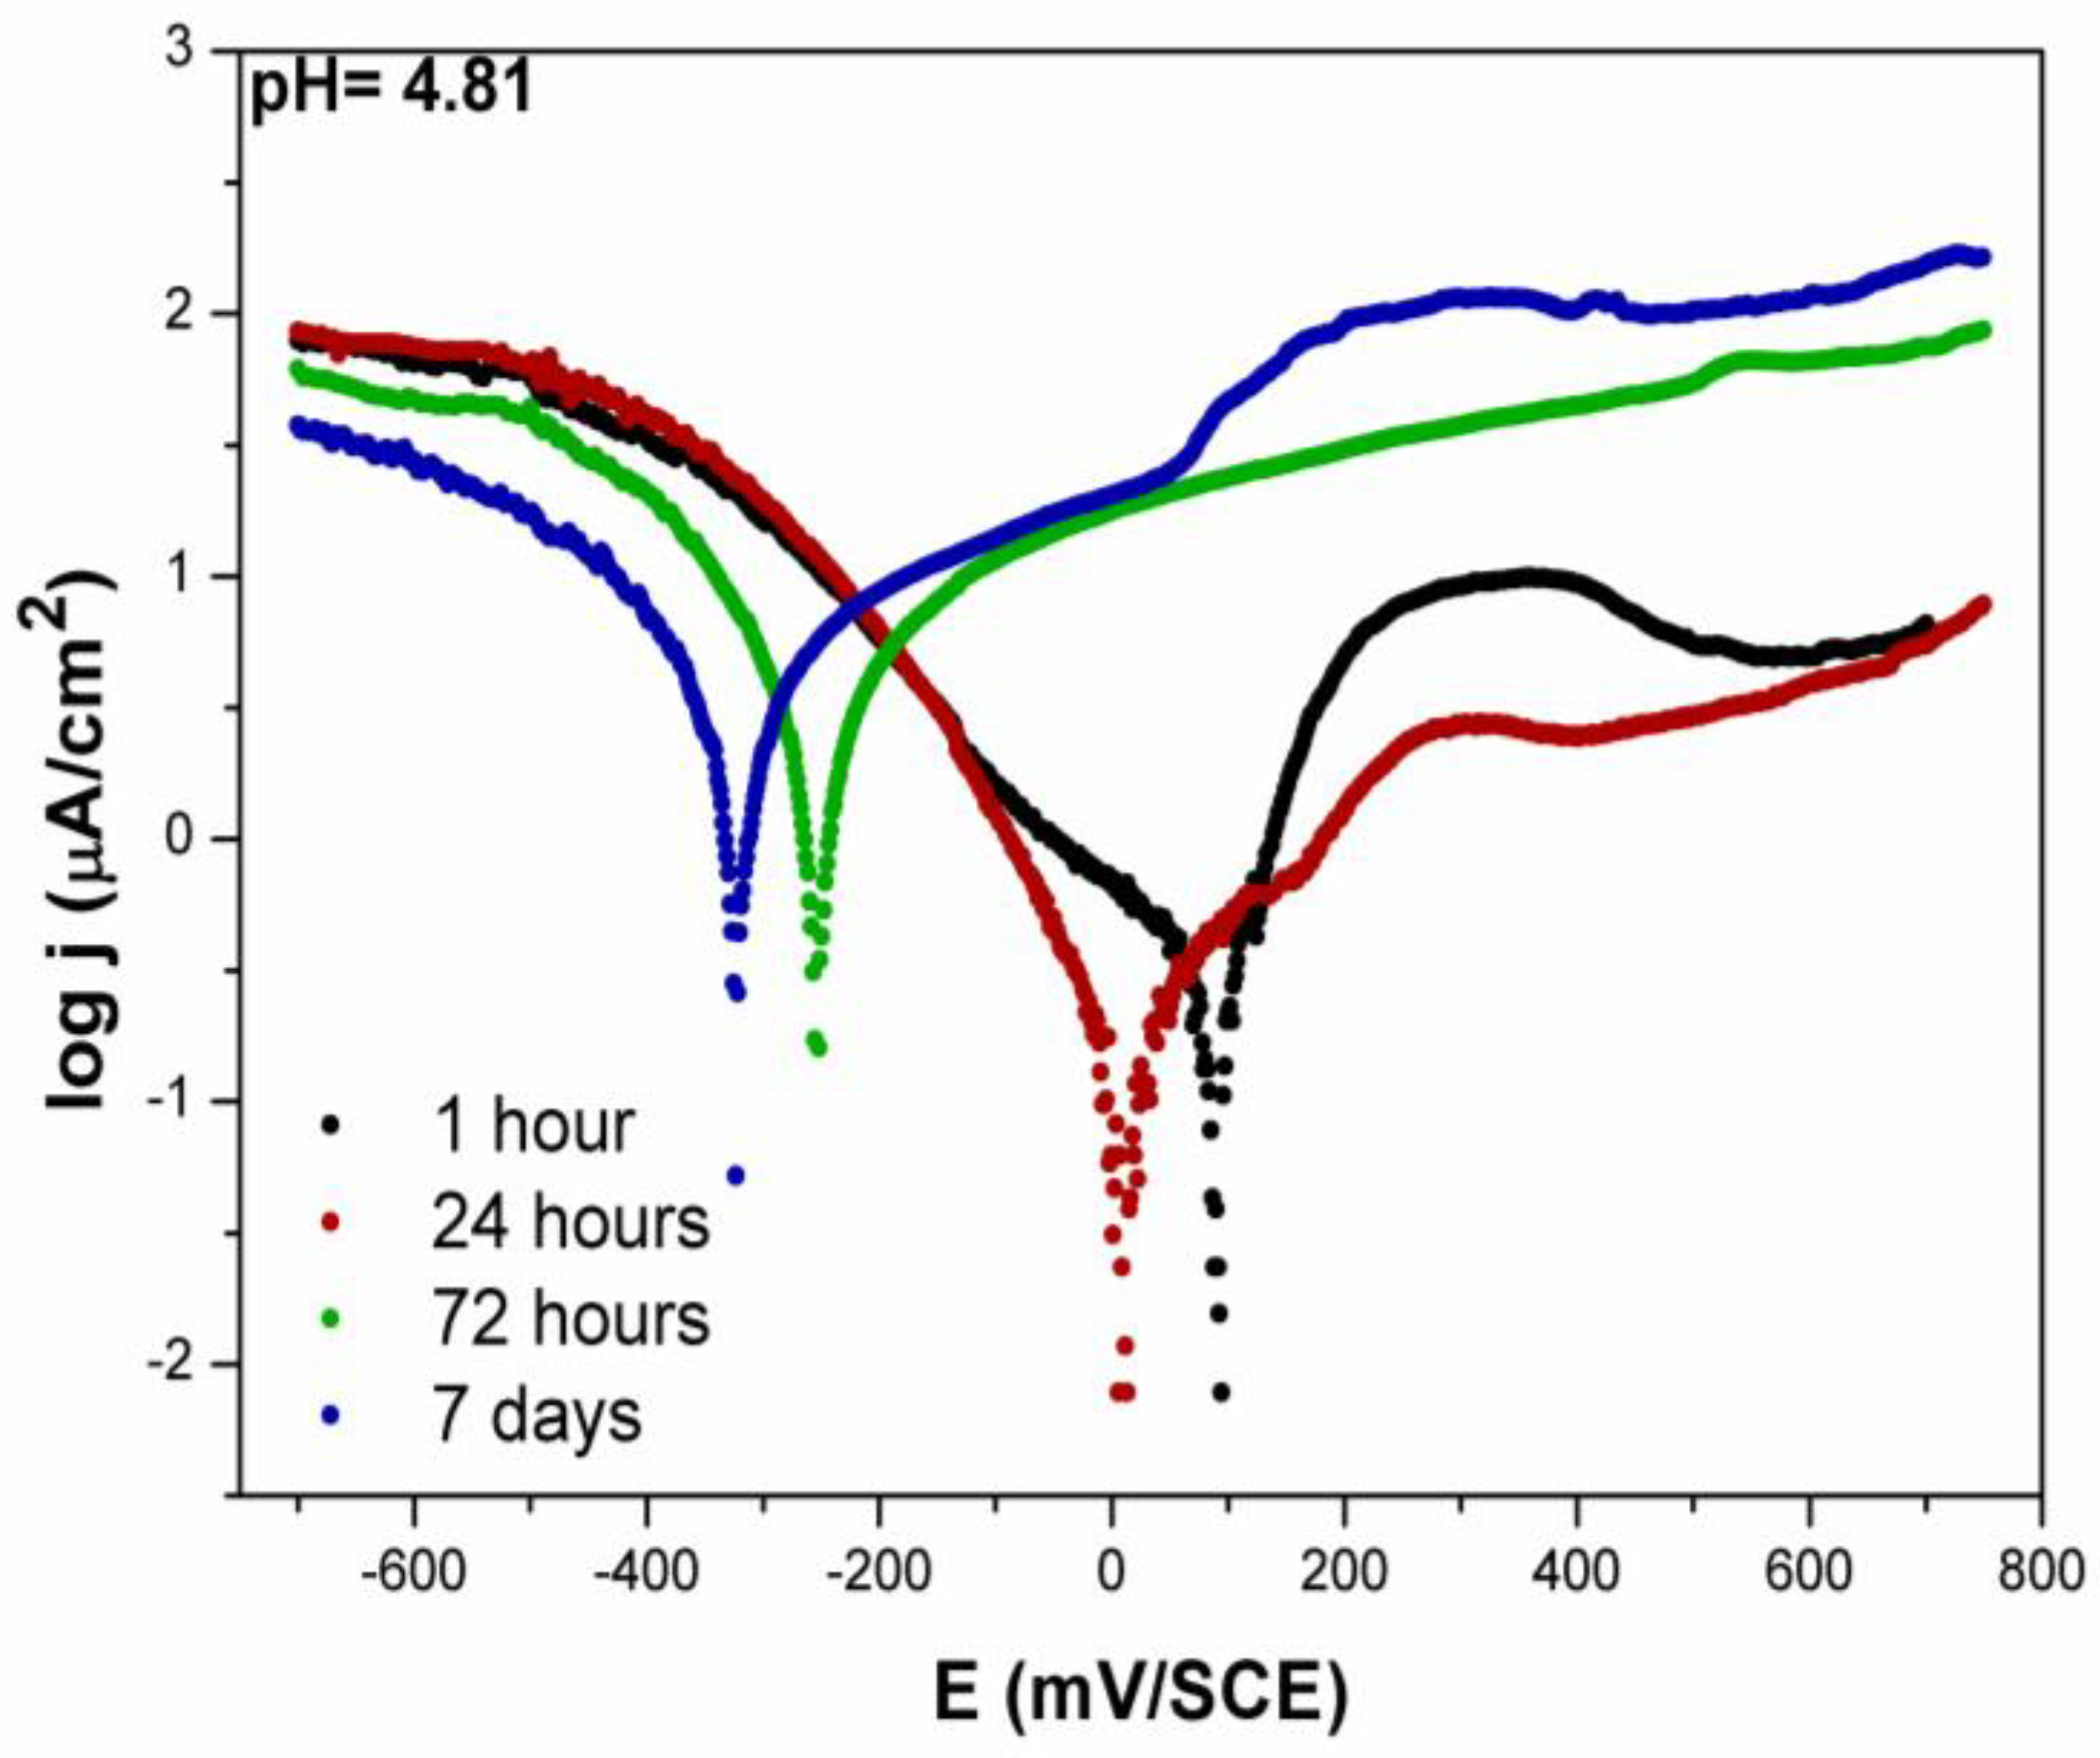
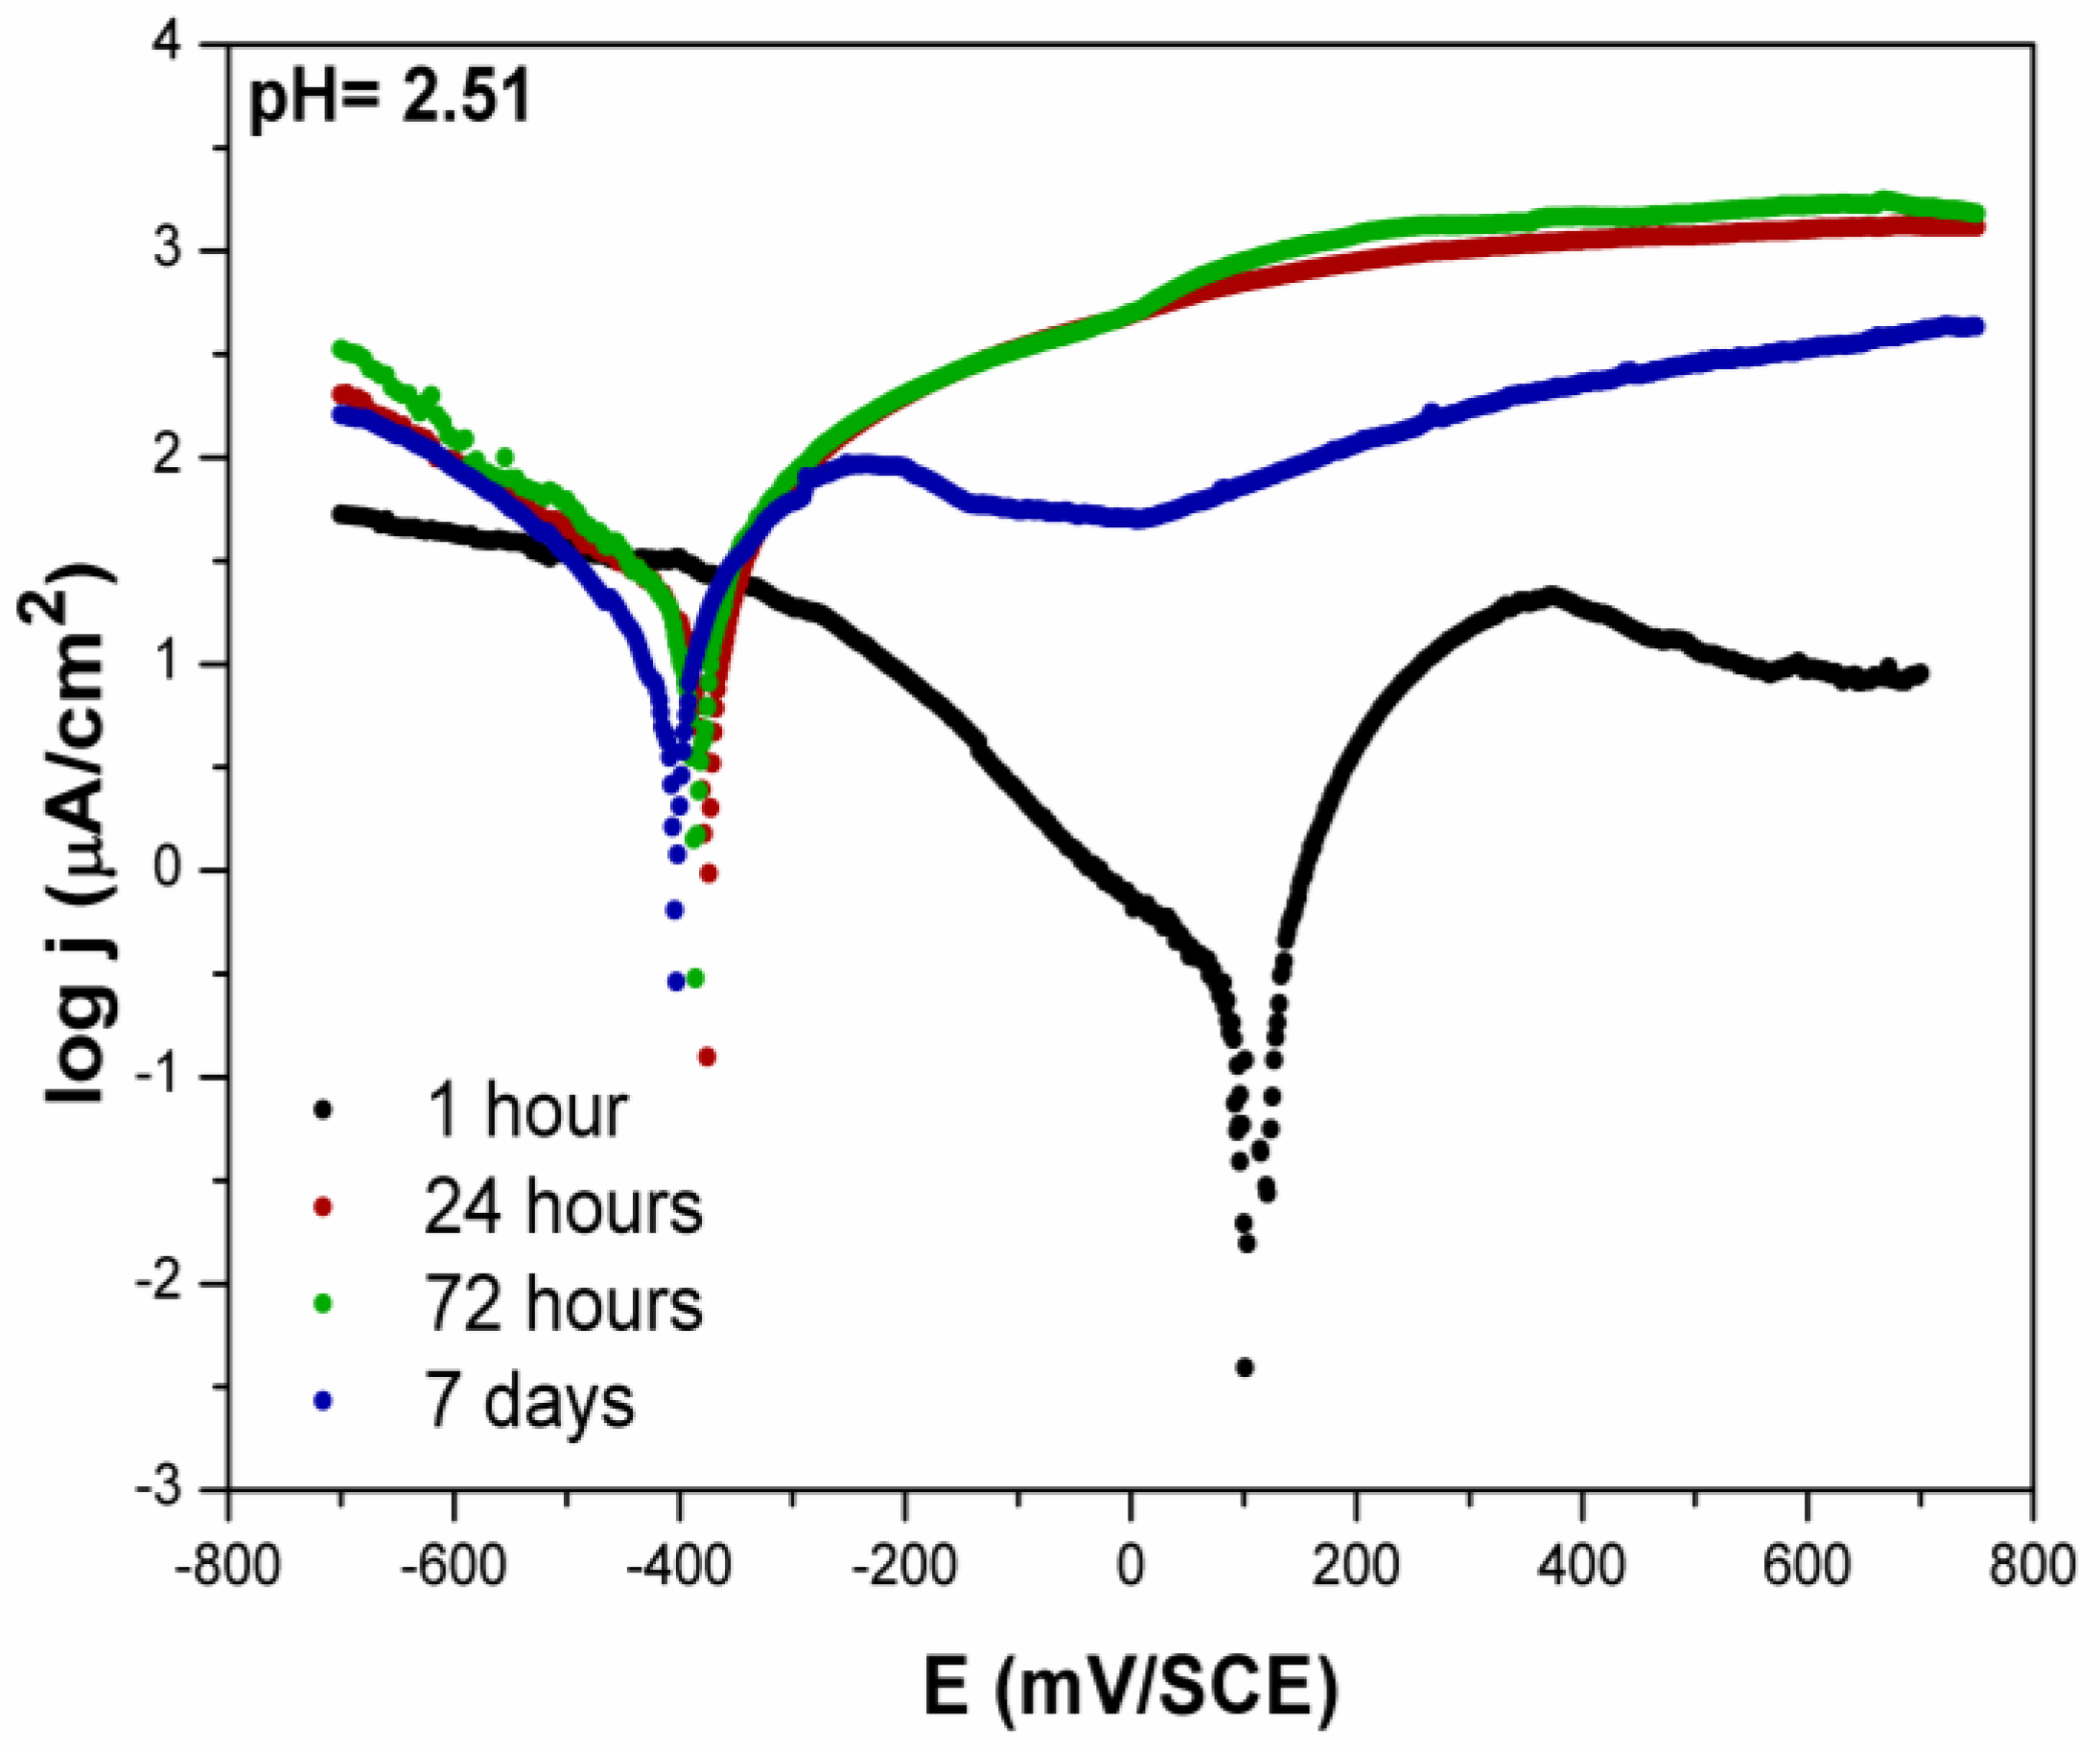
3.2.2. Potentiodynamic Measurements—Artificial Saliva

The potentiodynamic polarisation curves of the tested Au-Ge alloy immersed in the artificial saliva solution at pH 4.81 and 2.51 for different times are shown in Figure 4 and Figure 5, respectively. The corrosion parameters, namely the corrosion potential (Ecorr) and corrosion current density (jcorr), are given in Table 4.
As can be seen from Figure 4 and Figure 5 and from the data shown in Table 4, increasing the immersion time led to a shift in the corrosion potential in the cathodic direction and an increase in the corrosion current density in both saliva solutions (pH = 4.81 and pH = 2.51). The difference was that the balance was established much faster in the acidic solution. Namely, after 24 h, no major changes in the corrosion potential were observed, while, in the original saliva solution (pH = 4.81), it took longer. The corrosion potential in both solutions after 7 days was not much different, but, in the acidic saliva solution, the corrosion current density was significantly higher than in the original artificial saliva solution (Table 4).
As in the case of the artificial sweat solution, the expressed passive current density was obtained in the anodic part of the polarisation curve. In all the measurements, after the Tafel’s region, a passive region appeared up to the range of measurements we performed (Table 5). In both saliva solutions, an increase in the passive current density was registered when increasing the immersion time. In the acidic saliva solution, on the other hand, the passive area started at a significantly more negative potential, but with a much higher passive current density (Table 5).

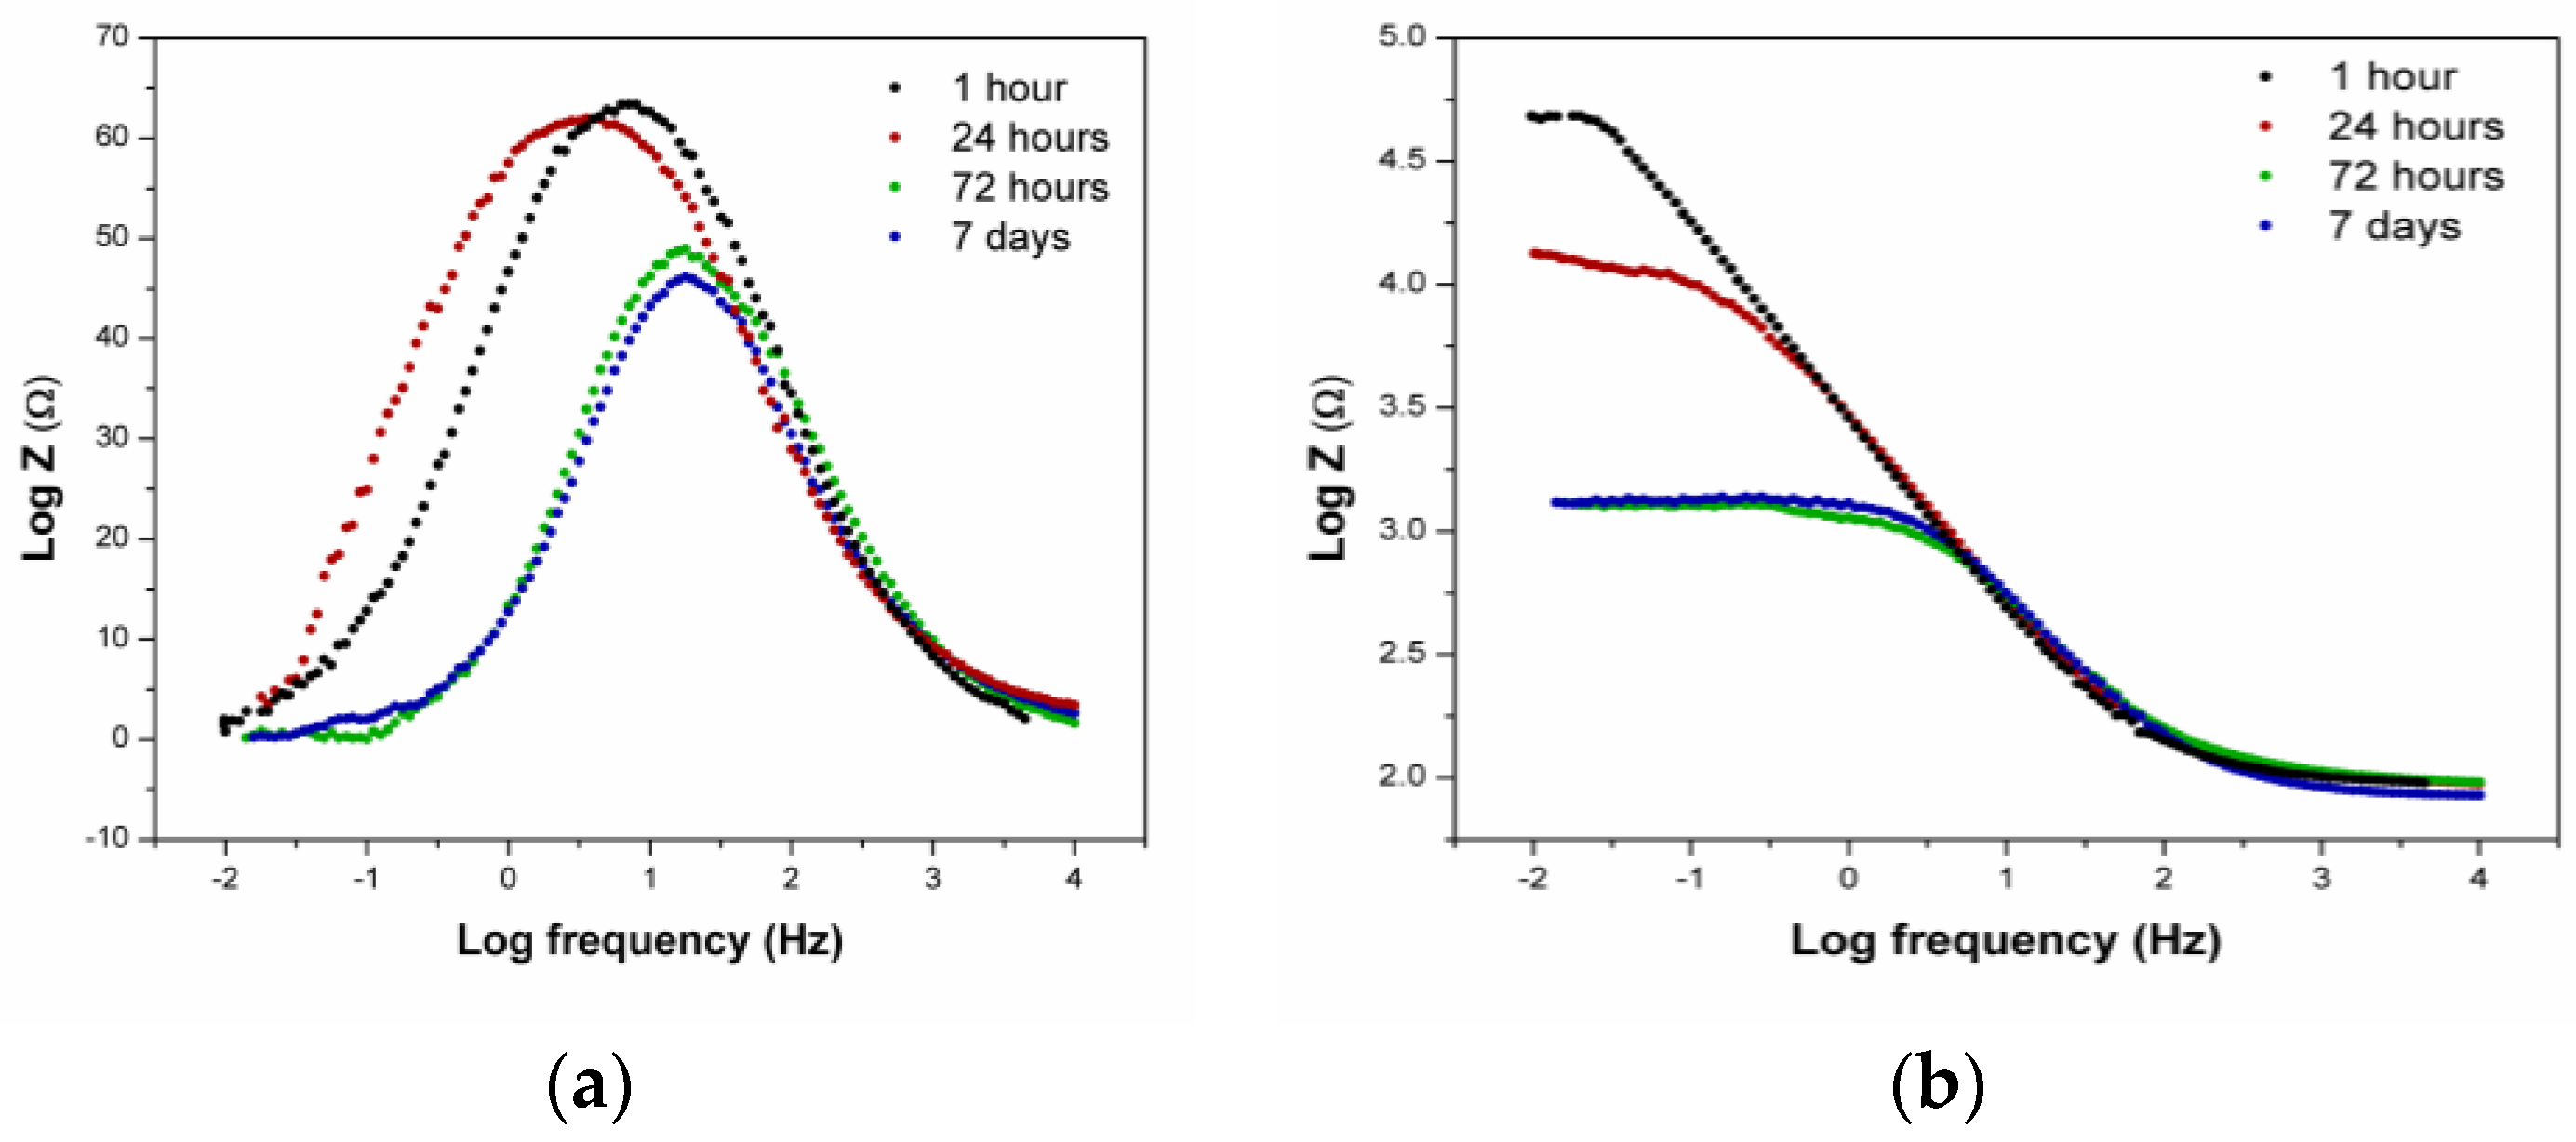
3.2.3. EIS Measurements—Artificial Saliva

The impedance spectra of the Au-Ge alloy measured at the open-circuit potential, after immersion at different times in the artificial saliva solution at pH 4.81, are shown as the Bode phase and Bode magnitude in Figure 6a and Figure 6b, respectively, and at pH 2.51 in Figure 7a and Figure 7b, respectively. The impedance parameters are given in Table 6.
From the data shown (Figure 6a and Figure 7a), in both the tested saliva solutions, independent of the immersion time, only one time constant appeared, and that was at the low intermediate frequency region. In the original saliva solution (pH = 4.81), the highest value of the phase angle, when compared to the acidic solution, was registered (Table 3). In the original saliva solution, a slight shift in the phase maximum as a function of immersion time can be registered towards higher frequencies, but the maximum value remained in the intermediate frequency region (Figure 6a). As mentioned earlier, this frequency region (the intermediate frequency region) describes the capacitive behaviour corresponding to the corrosion resistance of materials [23], and was an indication of the presence of a layer on the alloy’s surface [14,24].
The lower phase angle values indicated that the corrosion resistance of the tested alloy decreased with the increasing immersion time, as well as a decrease in the pH values.
In the high frequency region, all the Bode magnitudes (Figure 6b and Figure 7b) showed a plateau when the phase angle approached 0°, which is an indication of electrolyte resistance.
In the intermediate frequency region, the linear slope in log Z as a function of log (f) was approximately −0.8 for the original saliva solution (pH = 4.81), with the phase angle decreasing as a function of time from 72° to 62°. In the case of the acidic saliva solution (pH = 2.51), the linear slope was significantly lower, about −0.5, with an additional lower phase angle that decreased as a function of time from 63° to 46°. A slope of −0.5 and phase angle of about 45° is characteristic of the system via diffusion control [12] (acidic saliva solution after 72 h, Table 6). This kind of behaviour indicates that the corrosion resistance of the tested alloy was not perfect in the artificial saliva, and that it decreased further during the immersion time. In the acidic saliva solution (pH = 2.51), the decrease was more pronounced.
In the low frequency region, in the case of all measurements, another plateau was registered, with the phase angle approaching 0° (except for the immersion times of 1 h and 24 h at pH = 4.81), which describes the charge transfer processes. The deviation of the behaviour (immersion times of 1 and 24 h at pH = 4.81) may indicate the existence of processes in the pores of the surface film [12]. Since this deviation disappeared with time, it may be a sign that the time of 24 h was insufficient for the Au-Ge alloy surface to stabilise and form permanent properties.
As in the case of the artificial sweat solution, the obtained impedance spectra in the saliva solution were fitted using the Rs (RpQdl) circuits. The electrochemical parameters Rs, Rp, Cdl, and n, obtained from the fitting of the EIS data, are given in Table 7.
For both saliva solutions, an increase in the immersion time led to a considerable decrease in the polarisation resistance (Rp) of the tested Au-Ge alloy, which was much more pronounced in the case of the acidic saliva solution (Table 7). The difference appeared in the tendency to change the double layer capacitance (Cdl). Namely, in the case of the original saliva (pH = 4.81), with increasing time, the value of Cdl decreased slightly. On the other hand, increasing the time in the case of an acidic saliva solution caused an increase in the value of Cdl, similar to the case of the sweat solution. This behaviour indicates the possibility of a higher ion exchange in the double layer, due to which the corrosion resistance of the alloy is reduced significantly in the acidic saliva solution when compared to the original saliva solution.

3.3. SEM/EDX Analysis

The SEM/EDX analysis was performed on samples after 24 h of immersion in artificial sweat and saliva to monitor the changes of the alloying elements on the surfaces of the alloy samples during electrochemical measurements. The normalised values of the alloy surface’s constituent elements are shown in Figure 8.
Oxygen was detected with the EDX analysis, showing the oxidation of the sample surfaces during electrochemical testing. The sample exposed to artificial sweat had a somewhat lower Cu content and higher Au content as compared to the sample exposed to the artificial saliva. In correlation with the EIS measurements, the difference in composition on the alloy sample surface may correspond to the formation of the corrosion-resistant layer. The less noble elements of Cu and Zn may have been dissociated into the acidic surrounding medium more easily, while the Au remained on the sample surface. The corrosion products formed on the alloy surface had a higher Au content, which was inherently more corrosion-resistant, making the surface layer less susceptible to continued chemical dissolution. In the artificial saliva solution, the metallic element dissociation took longer to form the final film on the alloy’s surface, and the EDX analysis showed only a slightly altered Cu and Au content from the initial chemical alloy composition.
The SEM images show several scratches and dark spots. The scratches are the result of surface preparation before exposure to the artificial media, while the dark spots are mostly contamination and impurities from handling the samples with artificial saliva and sweat. Some dark spots are burrs and edges of the scratches, holes, or imperfections on the sample surface. Examining the effects of exposure to the artificial media has shown that very little corrosion damage was obtained on the sample surfaces.

4. Conclusions

The electrochemical behaviour of the Au-Ge alloy at different immersion times in the artificial sweat and artificial saliva solutions (different pH values) was studied using potentiodynamic polarisation measurements, electrochemical impedance spectroscopy, and SEM/EDX analysis.
Artificial sweat solution:
-
The obtained results showed that the polarisation curves of the tested alloy were similar in all measurements, suggesting that the main corrosion mechanism was the same, regardless of the immersion times. The difference in behaviour occurred only in the length of the Tafel’s, mixed, and passive region, as well as in the value of the passive current density.
-
As a function of immersion time, a shift in EOCP and Ecorr towards the anodic direction was also recorded, as well as an increase in the corrosion current density. This kind of behaviour suggests that the layer formed on the alloy’s surface in the artificial sweat solution formed a kind of insulating barrier, but it was, nevertheless, permeable to ions’ exchange.
-
The EIS measurements confirmed that, after one hour in the artificial sweat solution, the Au-Ge alloy surface did not stabilise. Because of that, the immersion time of 1 h differed in the behaviour when compared to the later period, and was described by a model with two time constants in contrast to the later measurements, where only one time constant occurred.
-
The slight increase in the polarisation resistance and the double layer capacitance over time also suggests that the layer formed on the alloy’s surface in the artificial sweat solution behaved as a kind of insulating barrier, but it was still permeable to ions from the solution.
Artificial saliva solution:
-
The potentiodynamic polarisation measurement showed that, in both saliva solutions during the immersion time, a shift in the EOCP and Ecorr towards the cathodic direction was recorded, as well as an increase in the corrosion current density.
-
After 7 days, the corrosion potential in both solutions was not much different, but, in the acidic saliva solution, the corrosion current density was significantly higher (higher corrosion rate) than in the original artificial saliva solution.
-
Only one time constant appeared in the EIS measurements of both tested saliva solutions, independent of the immersion time.
-
The results obtained at different immersion times showed that the corrosion resistance of the tested alloy decreased as a function of time.
-
The results also showed that, in the acidic saliva solution (pH = 2.51), the corrosion rate of the studied alloy was higher, which was accompanied by a decrease in the impedance (Z), phase angle, and polarisation resistance, and an increase in the double layer capacitance over time when compared to the original saliva solution (pH = 4.81).
-
The SEM/EDX analysis results are in good agreement with the results obtained through the electrochemical measurements in the artificial sweat and the artificial saliva solutions.

Author Contributions

Conceptualisation, G.V. and R.R.; methodology, G.V., P.M. and R.R.; software, G.V. and P.M.; validation, G.V., V.L. and R.R.; formal analysis, G.V. and P.M.; investigation, G.V., R.R. and P.M.; resources, V.L. and R.R.; writing—original draft preparation, G.V. and P.M.; writing—review and editing, R.R.; supervision, R.R.; project administration, P.M.; funding acquisition, V.L. and R.R. All authors have read and agreed to the published version of the manuscript.

Funding

The authors gratefully acknowledge the financial support of the Ministry of Science, Technological Development and Innovation of the Republic of Serbia (Grants Nos. 451-03-66/2024-03/200125 and 451-03-65/2024-03/200125) and The Bilateral Projects Serbia—Slovenia (337-00-110/2023-05/26).

Data Availability Statement

The original contributions presented in the study are included in the article, further inquiries can be directed to the corresponding author.

Conflicts of Interest

Authors Peter Majerič and Rebeka Rudolf were employed by the company Zlatarna Celje d.o.o. The remaining authors declare that the research was conducted in the absence of any commercial or financial relationships that could be construed as a potential conflict of interest.

References

  1. Nikpour, S.; Henderson, J.D.; Matin, S.; Nie, H.-Y.; Hedberg, J.; Dehnavi, V.; Hosein, Y.K.; Holdsworth, D.W.; Biesinger, M.; Hedberg, Y.S. Effect of Passivation and Surface Treatment of a Laser Powder Bed Fusion Biomedical Titanium Alloy on Corrosion Resistance and Protein Adsorption. Electrochim. Acta 2024, 475, 143650. [Google Scholar] [CrossRef]
  2. Atapour, M.; Sanaei, S.; Wei, Z.; Sheikholeslam, M.; Henderson, J.D.; Eduok, U.; Hosein, Y.K.; Holdsworth, D.W.; Hedberg, Y.S.; Ghorbani, H.R. In Vitro Corrosion and Biocompatibility Behavior of CoCrMo Alloy Manufactured by Laser Powder Bed Fusion Parallel and Perpendicular to the Build Direction. Electrochim. Acta 2023, 445, 142059. [Google Scholar] [CrossRef]
  3. Caporali, S.; Bardi, U. Corrosion Mechanism in Artificial Sweat Solution of In-Bearing White Bronze Alloy. Corrosion 2012, 68, 025001-1–025001-8. [Google Scholar] [CrossRef]
  4. Markel, K.; Silverberg, N.; Pelletier, J.L.; Watsky, K.L.; Jacob, S.E. Art of Prevention: A Piercing Article about Nickel. Int. J. Women’s Dermatol. 2020, 6, 203–205. [Google Scholar] [CrossRef] [PubMed]
  5. Rudolf, R.; Majerič, P.; Lazić, V.; Grgur, B. Development of a New AuCuZnGe Alloy and Determination of Its Corrosion Properties. Metals 2022, 12, 1284. [Google Scholar] [CrossRef]
  6. Cho, J.M.; Chae, J.; Jeong, S.R.; Moon, M.J.; Shin, D.Y.; Lee, J.H. Immune Activation of Bio-Germanium in a Randomized, Double-Blind, Placebo-Controlled Clinical Trial with 130 Human Subjects: Therapeutic Opportunities from New Insights. PLoS ONE 2020, 15, e0240358. [Google Scholar] [CrossRef] [PubMed]
  7. Ji, Y.; Yang, S.; Sun, J.; Ning, C. Realizing Both Antibacterial Activity and Cytocompatibility in Silicocarnotite Bioceramic via Germanium Incorporation. J. Funct. Biomater. 2023, 14, 154. [Google Scholar] [CrossRef] [PubMed]
  8. Zemek, J.; Jiricek, P.; Houdkova, J.; Ledinsky, M.; Jelinek, M.; Kocourek, T. On the Origin of Reduced Cytotoxicity of Germanium-Doped Diamond-Like Carbon: Role of Top Surface Composition and Bonding. Nanomaterials 2021, 11, 567. [Google Scholar] [CrossRef]
  9. Wang, Y.; Teng, G.; Zhou, H.; Dong, C. Germanium Reduces Inflammatory Damage in Mammary Glands During Lipopolysaccharide-Induced Mastitis in Mice. Biol. Trace Elem. Res. 2020, 198, 617–626. [Google Scholar] [CrossRef]
  10. Elango, J.; Bushin, R.; Lijnev, A.; De Aza, P.N.; Martínez, C.P.-A.; Marín, J.M.G.; Hernandez, A.B.; Olmo, L.R.M.; Val, J.E.M.S. De The Effect of Germanium-Loaded Hydroxyapatite Biomaterials on Bone Marrow Mesenchymal Stem Cells Growth. Cells 2022, 11, 2993. [Google Scholar] [CrossRef]
  11. Kurt, M.Ş.; Arslan, M.E.; Yazici, A.; Mudu, İ.; Arslan, E. Tribological, Biocompatibility, and Antibiofilm Properties of Tungsten–Germanium Coating Using Magnetron Sputtering. J. Mater. Sci. Mater. Med. 2021, 32, 6. [Google Scholar] [CrossRef] [PubMed]
  12. Porcayo-Calderon, J.; Rodríguez-Díaz, R.A.; Porcayo-Palafox, E.; Martinez-Gomez, L. Corrosion Performance of Cu-Based Coins in Artificial Sweat. J. Chem. 2016, 2016, 9542942. [Google Scholar] [CrossRef]
  13. Chen, Y.-L.; Kuan, W.-H.; Liu, C.-L. Comparative Study of the Composition of Sweat from Eccrine and Apocrine Sweat Glands during Exercise and in Heat. Int. J. Environ. Res. Public Health 2020, 17, 3377. [Google Scholar] [CrossRef] [PubMed]
  14. Mareci, D.; Chelariu, R.; Dan, I.; Gordin, D.-M.; Gloriant, T. Corrosion Behaviour of β-Ti20Mo Alloy in Artificial Saliva. J. Mater. Sci. Mater. Med. 2010, 21, 2907–2913. [Google Scholar] [CrossRef] [PubMed]
  15. Lima, A.R.; Pinto, A.M.P.; Toptan, F.; Alves, A.C. Impact of Simulated Inflammation and Food Breakdown on the Synergistic Interaction between Corrosion and Wear on Titanium. Corros. Sci. 2024, 228, 111839. [Google Scholar] [CrossRef]
  16. Bodunrin, M.O.; Chown, L.H.; Van Der Merwe, J.W.; Alaneme, K.K.; Oganbule, C.; Klenam, D.E.P.; Mphasha, N.P. Corrosion Behavior of Titanium Alloys in Acidic and Saline Media: Role of Alloy Design, Passivation Integrity, and Electrolyte Modification. Corros. Rev. 2020, 38, 25–47. [Google Scholar] [CrossRef]
  17. Begum, A.A.S.; Vahith, R.M.A.; Mohamed, M.K.V.; Kotra, V.; Shaik, B.; Al-Kahtani, A. Corrosion Mitigation on Orthodontic Wire Made of SS 18/8 Alloy Using Esomeprazole Tablet (Esiloc-40 Mg) in Artificial Saliva. J. Saudi Chem. Soc. 2023, 27, 101681. [Google Scholar] [CrossRef]
  18. ISO 3160-2:2015; Watch-Cases and Accessories—Gold Alloy Coverings. International Organization for Standardization: Geneva, Switzerland, 2015.
  19. Rathish, R.J.; Rajendran, S.; Christy, J.L.; Devi, B.S.; Johnmary, S.; Manivannan, M.; Rajam, K.; Rengan, P. Corrosion Behaviour of Metals in Artificial Sweat. Open Corros. J. 2010, 3, 38–44. [Google Scholar] [CrossRef]
  20. Jimenez-Marcos, C.; Mirza-Rosca, J.C.; Baltatu, M.S.; Vizureanu, P. Effect of Si Contents on the Properties of Ti15Mo7ZrxSi Alloys. Materials 2023, 16, 4906. [Google Scholar] [CrossRef]
  21. Porcayo-Calderon, J.; Rodriguez-Diaz, R.A.; Porcayo-Palafox, E.; Colin, J.; Molina-Ocampo, A.; Martinez-Gomez, L. Effect of Cu Addition on the Electrochemical Corrosion Performance of Ni3Al in 1.0 M H2SO4. Adv. Mater. Sci. Eng. 2015, 2015, 209286. [Google Scholar] [CrossRef]
  22. Canto, J.; Rodríguez-Díaz, R.A.; Martinez-de-la-Escalera, L.M.; Neri, A.; Porcayo-Calderon, J. Corrosion Inhibition in CO2-Saturated Brine by Nd3+ Ions. Molecules 2023, 28, 6593. [Google Scholar] [CrossRef] [PubMed]
  23. Dutta Chowdhury, N.; Ghosh, K.S. Electrochemical Behaviour of Dental Amalgam in Natural, Artificial Saliva and in 0.90 Wt.% NaCl Solution. Corros. Sci. 2018, 133, 217–230. [Google Scholar] [CrossRef]
  24. Falodun, O.E.; Oke, S.R.; Solomon, M.M.; Bayode, A. Microstructural Evolution and Electrochemical Corrosion Characteristics of Ti–Ni Matrix Composite in NaCl and HCl Solutions. Ceram. Int. 2024, 50, 15124–15133. [Google Scholar] [CrossRef]
  25. Torbati-Sarraf, H.; Ding, L.; Khakpour, I.; Daviran, G.; Poursaee, A. Unraveling the Corrosion of the Ti–6Al–4V Orthopedic Alloy in Phosphate-Buffered Saline (PBS) Solution: Influence of Frequency and Potential. Corros. Mater. Degrad. 2024, 5, 276–288. [Google Scholar] [CrossRef]
  26. Fekry, A.M.; El-Sherif, R.M. Electrochemical Corrosion Behavior of Magnesium and Titanium Alloys in Simulated Body Fluid. Electrochim. Acta 2009, 54, 7280–7285. [Google Scholar] [CrossRef]
  27. Arrieta-González, C.D.; Perez-Arizmendi, F.J.; Dorta-Leon, M.A.; Porcayo-Calderón, J. Effect of Temperature on the Corrosion Resistance of Ni5Al Coating Deposited by Electric Arc in 3.5% NaCl Solution. Coatings 2023, 13, 1349. [Google Scholar] [CrossRef]
  28. Alves, V.A.; Reis, R.Q.; Santos, I.C.B.; Souza, D.G.; de Gonçalves, F.T.; Pereira-da-Silva, M.A.; Rossi, A.; da Silva, L.A. In Situ Impedance Spectroscopy Study of the Electrochemical Corrosion of Ti and Ti–6Al–4V in Simulated Body Fluid at 25 °C and 37 °C. Corros. Sci. 2009, 51, 2473–2482. [Google Scholar] [CrossRef]
  29. Matemadombo, F.; Nyokong, T. Characterization of Self-Assembled Monolayers of Iron and Cobalt Octaalkylthiosubstituted Phthalocyanines and Their Use in Nitrite Electrocatalytic Oxidation. Electrochim. Acta 2007, 52, 6856–6864. [Google Scholar] [CrossRef]
  30. Shao, P.; Xiao, H.; Liu, K.; Chen, X.; Hou, M.; Zhang, Q.; Qian, C.; Huang, S. Influence of Annealing Temperature on the Mechanical Properties and Corrosion Behavior of Ti-5.5Al-2.0Zr-1.5Sn-0.5Mo-1.5Nb Alloy. Arab. J. Chem. 2024, 17, 105790. [Google Scholar] [CrossRef]
Figure 1. Open-circuit potential value as a function of different immersion times.
Metals 14 00668 g001
Figure 2. Potentiodynamic polarisation curves of the Au-Ge alloy immersed in artificial sweat at different periods.
Metals 14 00668 g002
Figure 3. (a) The Bode phase angle and (b) Bode magnitude of the Au-Ge alloy immersed in artificial sweat at different periods.
Metals 14 00668 g003
Figure 4. Potentiodynamic polarisation curves of the Au-Ge alloy immersed in artificial saliva (pH = 4.81) at different periods.
Metals 14 00668 g004
Figure 5. Potentiodynamic polarisation curves of the Au-Ge alloy immersed in artificial saliva (pH = 2.51) at different periods.
Metals 14 00668 g005
Figure 6. (a) The Bode phase angle and (b) Bode magnitude of the Au-Ge alloy immersed in artificial saliva (pH = 4.81) at different periods.
Metals 14 00668 g006
Figure 7. (a) The Bode phase angle and (b) Bode magnitude of the Au-Ge alloy immersed in artificial saliva (pH = 2.51) at different periods.
Metals 14 00668 g007
Figure 8. SEM/EDX analysis of the Au-Ge alloy samples after 24 h of immersion in the artificial sweat and artificial saliva solution during electrochemical testing.
Metals 14 00668 g008
Table 1. The corrosion parameters of the Au-Ge alloy at different immersion times in artificial sweat.
TimeEOCP (mV)Ecorr (mV)jcorr (µA/cm2)
1 h−333 ± 10−423 ± 59.42 ± 1.20
24 h−307 ± 8−404 ± 735.2 ± 2.10
72 h−289 ± 4−383 ± 417.4 ± 1.50
7 days−230 ± 5−325 ± 516.6 ± 1.80
Table 2. The passivation parameters of the Au-Ge alloy at different immersion times in artificial sweat.
TimeTafel reg. (mV)
from Ecorr to
Mixed reg. (mV)
from Tafel reg. to
Passive reg. (mV)
from Mix. reg. to
jpass (µA/cm2)
1 h−400 ± 25+100 ± 25530 ± 100.14 ± 0.07
24 h−360 ± 15+200 ± 10670 ± 50.80 ± 0.18
72 h−320 ± 20+200 ± 20700 ± 60.40 ± 0.20
7 days−200 ± 15+450 ± 15670 ± 80.70 ± 0.16
Table 3. EIS parameters of the Au-Ge alloy at different immersion times in artificial sweat.
TimeRs (Ohm/cm2)Rp (kOhm/cm2)Cdl
(mF/cm2)
nRf
(kOhm/cm2)
Cf
(µF/cm2)
χ2·10−3
1 h15 ± 1.05.80 ± 0.021.05 ± 0.100.85 ± 0.0052.0 ± 0.22.0 ± 0.022.20
24 h5 ± 0.52.15 ± 0.033.67 ± 0.110.87 ± 0.001--1.15
72 h5 ± 0.54.53 ± 0.104.55 ± 0.210.84 ± 0.002--2.82
7 days5 ± 0.54.85 ± 0.084.45 ± 0.180.85 ± 0.002--1.87
Table 4. The corrosion parameters of the Au-Ge alloy at different immersion times in artificial saliva.
pH = 4.81pH = 2.51
TimeEOCP (mV)Ecorr (mV)jcorr (µA/cm2)EOCP (mV)Ecorr (mV)jcorr (µA/cm2)
1 h−24 ± 596 ± 100.30 ± 0.1520 ± 8112 ± 100.26 ± 0.10
24 h−50 ± 38 ± 50.15 ± 0.09−362 ± 10−361 ± 1012.94 ± 1.85
72 h−268 ± 7−247 ± 91.56 ± 0.50 −367 ± 7−372 ± 714.09 ± 1.26
7 days−339 ± 4−320 ± 41.95 ± 0.80−376 ± 9−388 ± 99.37 ± 0.98
Table 5. The passivation parameters of the Au-Ge alloy at different immersion times in artificial saliva.
pH = 4.81pH = 2.51
TimeTafel reg. (mV)
from Ecorr to
jpass (µA/cm2)Tafel reg. (mV)
from Ecorr to
jpass (µA/cm2)
1 h230 ± 125.0 ± 2.0370 ± 209.0 ± 1.8
24 h280 ± 253.2 ± 1.8 −270 ± 181100 ± 50
72 h−100 ± 1439 ± 7.0−270 ± 161400 ± 75
7 days−220 ± 8110 ± 2.0−240 ± 10250 ± 10
Table 6. The impedance and phase value of the Au-Ge alloy at different immersion times in artificial saliva.
pH = 4.81pH = 2.51
TimeLog Z−phaseLog Z−phase
1 h5.2 72 4.7 63
24 h5.2 70 4.0 62
72 h4.2 64 3.1 48
7 days4.0 62 3.0 46
Table 7. EIS parameters of the Au-Ge alloy at different immersion times in artificial saliva.
pH = 4.81pH = 2.51
TimeRs
(Ohm/cm2)
Rp (kOhm/cm2)Cdl
(mF/cm2)
nχ2·10−3Rs
(Ohm/cm2)
Rp (kOhm/cm2)Cdl
(mF/cm2)
nχ2·103
1 h5 ± 1280 ± 0.20.43 ± 0.010.84 ± 0.0025.25 ± 2270 ± 0.41.10 ± 0.020.83 ± 0.0011.1
24 h5 ± 1120 ± 1.00.37 ± 0.020.84 ± 0.0012.580 ± 52.50 ± 0.11.24 ± 0.0170.81 ± 0.0014.3
72 h15 ± 0.210.25 ± 0.50.24 ± 0.010.80 ± 0.0031.880 ± 41.30 ± 0.082.37 ± 0.0320.86 ± 0.0015.9
7 days15 ± 0.216.00 ± 0.40.11 ± 0.0080.80 ± 0.0012.280 ± 51.20 ± 0.152.51 ± 0.0220.81 ± 0.0022.1
Disclaimer/Publisher’s Note: The statements, opinions and data contained in all publications are solely those of the individual author(s) and contributor(s) and not of MDPI and/or the editor(s). MDPI and/or the editor(s) disclaim responsibility for any injury to people or property resulting from any ideas, methods, instructions or products referred to in the content.

