Abstract
To address the problem of tribological failure in an aircraft piston pump valve plate pair, the friction and wear properties of the valve plate pair materials (W9Mo3Cr4V-HAl61-4-3-1) of an axial piston pump at a certain speed and load were studied using a disc-ring tester under lubrication with No. 15 aviation hydraulic oil. The results show that the friction coefficient (COF) fluctuated in the range of 0.019~0.120 when the load (L) increased from 30 N to 120 N, and the speed increased from 100 r/min to 500 r/min. With the increase in the rotational speed, the COF of the valve plate pair decreased first and then increased. When the rotation speed (V) was 300 r/min, the relative COF was the smallest. Under L lower than 60 N, abrasive wear was the main wear mechanism. Under L higher than 90 N, the main wear mechanism was adhesive wear but mild oxidation wear also occurred. In addition, based on the V, L, radius (R), and test duration (T), which affected COF, the random forest regression (RFR) algorithm, the bagging regression (BR) algorithm, and the extra trees regression (ETR) algorithm were used as machine learning methods to predict the COF of the valve plate pair. Mean absolute error (MAE), root mean square error (RMSE), and coefficient of determination (R2) were used to evaluate its performance, with the results showing that the ETR prediction model was the best method for predicting COF. The results of the machine learning also showed that the contributions of V, L, R, and T were 43.56%, 36.76%, 13.13%, and 6.55%, respectively, indicating that V had the greatest influence on the COF of the W9Mo3Cr4V/HAl61-4-3-1 friction pair. This study is expected to provide support for the rapid development of new valve plate pair materials.
1. Introduction
Axial piston pumps are a common type of hydraulic component widely used in aerospace, industry, and other fields due to their compact structure, high working pressure, good efficiency, and ease of achieving variability [1,2]. The working fluid of hydraulic systems is typically provided by axial piston pumps, which convert mechanical energy into hydraulic energy to transmit the fluid power. The efficiency of energy conversion depends on the mechanical and volumetric losses of the axial piston pumps [3]. Specifically, the mechanical loss in an axial piston pump is primarily attributed to the wear of important friction pairs. In particular, the valve plate pair, as the key component with the largest contact area in an axial piston pump, directly impacts the overall operational efficiency and lifespan of the pump [4,5]. The valve plate pair needs to have certain characteristics such as a low friction coefficient (COF) and minimal wear rate to enhance the operational efficiency and service life of the pump.
In recent years, with the development of high-speed and high-pressure aviation axial piston pumps, the design of internal friction pairs has been considered one of the most important limiting factors [6,7,8,9]. Researchers have conducted extensive research on the friction and wear characteristics of valve plate pairs in axial piston pumps [10,11,12]. In terms of numerical simulation, Jiao et al. [13] simulated the movement and tribological properties of a valve plate pair during the running-in process using a ring block test. They also conducted mixed lubrication modeling of the valve plate pair and analyzed the impact of loading pressure on the tribological performance of the valve plate pair. Huang et al. [14] used friction modeling to simulate the contact modes between the valve plate and the cylinder body (CuPb15Sn5 and 38CrMoAl/42CrMo) in axial piston pumps, analyzing the COF, wear rates, and surface morphology of different types of friction samples at different speeds to evaluate their tribological performance. That study found that at 1800 r/min, the contact surfaces of samples were more prone to adhesive wear than at 500 r/min. In terms of experimental exploration, Li et al. [15] conducted wear experiments on the friction pairs of cylinder blocks and valve plates in axial piston pumps using a vertical universal friction and wear testing machine. The results showed that the COF of the friction pair using sintered copper and 38CrMoAl as a matching material was lower and had the smallest amount of wear. Fu et al. [16] built an optimized friction simulation test device and found that within a wide speed range (300–6000 rpm), using hard-to-hard materials could significantly increase the wear resistance of the interface. The wear depth of TiAlN/TiAlN (hard-to-hard) matched materials was only 28.6% to 34.7% of the wear depth of tin bronze/TiAlN (soft-to-hard) matched materials. Furthermore, compared with traditional tin bronze/nitride (soft-to-hard) matched materials, hard-to-hard matched materials had improved friction and wear performances. Huang et al. [17] carried out friction and wear experiments on the key friction pairs of axial piston pumps, exploring the effects of various factors on the friction and wear performance and the wear mechanism of the friction pair under normal stress. The research results were used to determine the matching materials of the friction pair. In Milojević et al. [18], the results of a laboratory study on an experimental engine were presented with discussion of a series of specific parameters (characteristics), such as compression ratio, fuel injection timing, engine speed, and the influence of load on the combustion process and exhaust emissions. Xu et al. [19] studied the variation in COF of the swash plate through dry and wet wear tests, finding that the sample wore unevenly in dry friction tests, the COF increased rapidly, and the sample failed due to wear. However, the use of a lubricating oil significantly reduced the COF: the higher the speed, the lower the COF; the larger the load, the higher the COF. Regarding the effect of the load, Ren Xiao et al. [20] studied the friction and wear performances of a lead–tin bronze alloy under different PV values and oil lubrication conditions with ZCuPb20Sn5-45 steel as the friction pair.
Traditional design and optimization of piston pump valve plate pairs usually rely on empirical formulas and experimental verification. However, the friction and wear characteristics of piston pump friction pairs are influenced by various factors [14], including four important features (namely rotation speed (V), load (F), radius (R), and test duration (T)). According to current numerical and experimental studies, each feature has a nonlinear relationship with the COF. However, when complex tribological relationships exist, studying the tribological performance of a valve plate pair interface through separate friction and wear experiments is often influenced by changes in multiple parameters and scales [13], and qualitative research is insufficient to meet practical needs and cannot effectively guide engineering practice. This process is time-consuming and labor-intensive. To more accurately explore the relationships between multiple factors, a data-driven approach can be adopted to establish quantitative relationships within the data [21], predict the tribological behavior of friction pair materials, and thereby help improve the tribological performance of piston pump valve plate pairs. Therefore, choosing suitable data analysis and modeling methods is necessary to improve the utilization and accuracy of data. Nowadays, machine learning is increasingly being applied as a new scientific research tool. Machine learning (ML) encompasses a wide range of algorithms and modeling tools for data processing tasks [22,23], offering excellent time efficiency and accuracy in data prediction, thus allowing machine learning technology to replace traditional methods. The application of ML methods in tribology represents a new research field called tribology informatics [24]. Recently, tribology informatics has proposed using ML to study the friction and wear characteristics of piston pump valve plate pair materials. Through employing data-driven machine learning methods, successful regression models have been established to determine the optimal features for predicting properties [25].
Efficient ML techniques possess nonlinear and adaptive characteristics, effectively addressing multi-factorial, complex, stochastic, and nonlinear engineering problems, with widespread applications in predicting material friction and wear performance. Kordijazi et al. [26] used three different statistical data analysis methods to establish the correlation between contact angle (CA) on ductile cast iron and components, roughness (grain size), time between sample preparation and CA measurement, and drop size. Nosonovsky et al. [21] explored a topological data analysis and various ML algorithms, applying them to various aspects of friction data analysis and friction instability. Prasanth et al. [27] predicted the COF of AA7075–graphene nanocomposites using five ML regression models. Kolev et al. [28] investigated the tribological behavior of porous AlSi10Mg–SiC composites and used three different ML models to predict the COF of the composite materials, evaluating their performance on validation and test sets using R2, MSE, RMSE, and MAE metrics. Hasan et al. [24] studied the correlation between a metal alloy and its composite structure, friction testing conditions, and frictional wear using ML algorithms. Verma et al. [29] studied the application of ML methods in analyzing and predicting the tensile properties of AA6082 friction-stir-welded joints. ML-based models were used to analyze real data and predict data absurdities, with random forest regression considered the best ML method for predicting FSW joint tensile behavior. Furthermore, ML methods can automatically learn and make decisions from large datasets., optimizing experimental parameters to enhance experimental design efficiency and accuracy, thereby reducing experimentation time and costs.
To the best of the authors’ knowledge, few studies have reported on the study of piston pump valve plate tribological behavior using machine learning techniques. The mapping relationship between the COF and wear mechanisms of friction pair materials is also not fully clear. Furthermore, studies exploring the use of machine learning models to predict the results of valve plate pair wear tests are lacking. Therefore, this study focuses on a W9Mo3Cr4V/HAL61-4-3-1 valve plate/cylinder block as the research subject. Friction and wear tests were conducted under different conditions to predict changes in COF. The surface morphology of the wear was examined using scanning electronic microscopy (SEM) and DES spectroscopy to analyze the elemental compositions, experimentally validating the optimal operating conditions for wear of the friction pair. Four tribological features were selected, and the accuracy of the three ML methods (random forest regression (RFR), bagging regression (BR), and extra trees regression (ETR)) was quantitatively checked. Data preprocessing was performed using randomization and normalization techniques to improve the predictive effectiveness and efficiency. Additionally, an ML model was further developed to predict the COF of the axial piston pump valve plate pair.
Through comparing the feature relevance, preventing overfitting, and calculating the mean absolute error (MAE), root mean square error (RMSE), and coefficient of determination (R2), the error and precision of the prediction model are discussed and analyzed. This work mainly studies the wear mechanism of piston pump valve plate pair materials under different tribological conditions and predicts the COF based on machine learning methods. In this paper, the wear failure modes of valve plate pair materials are accurately identified, aiming to provide more big data technology for the development of wear-resistant materials in valve plate pair components.
2. Experimental and Methodology
2.1. Experimental Design
- Experimental Equipment
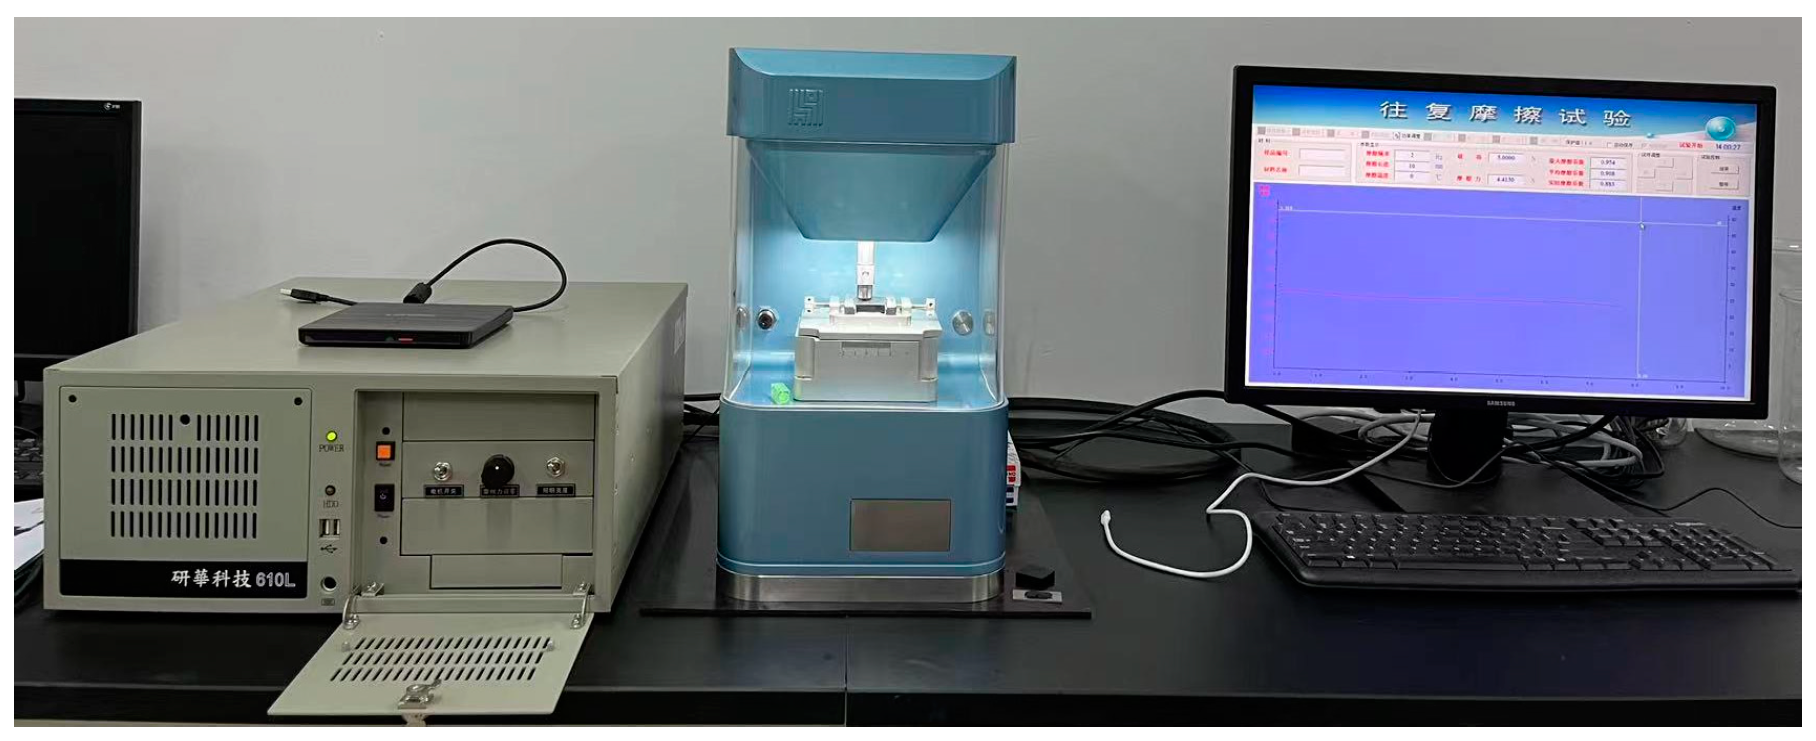
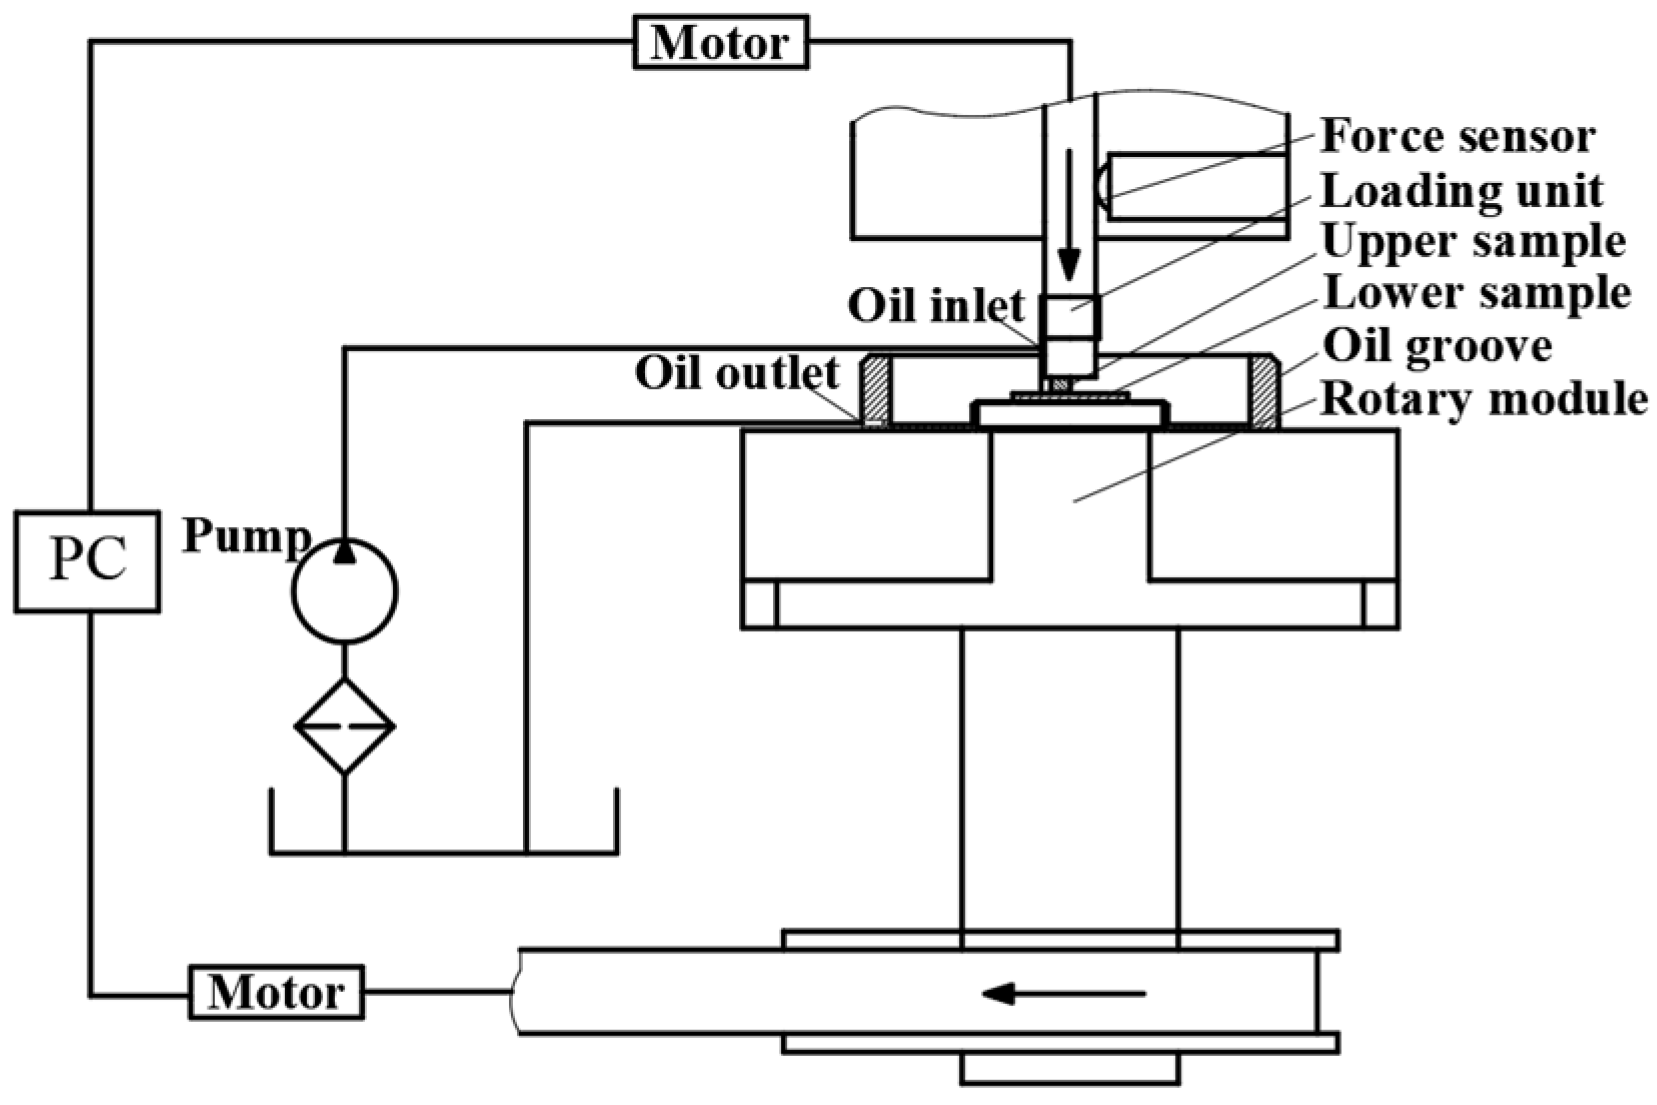
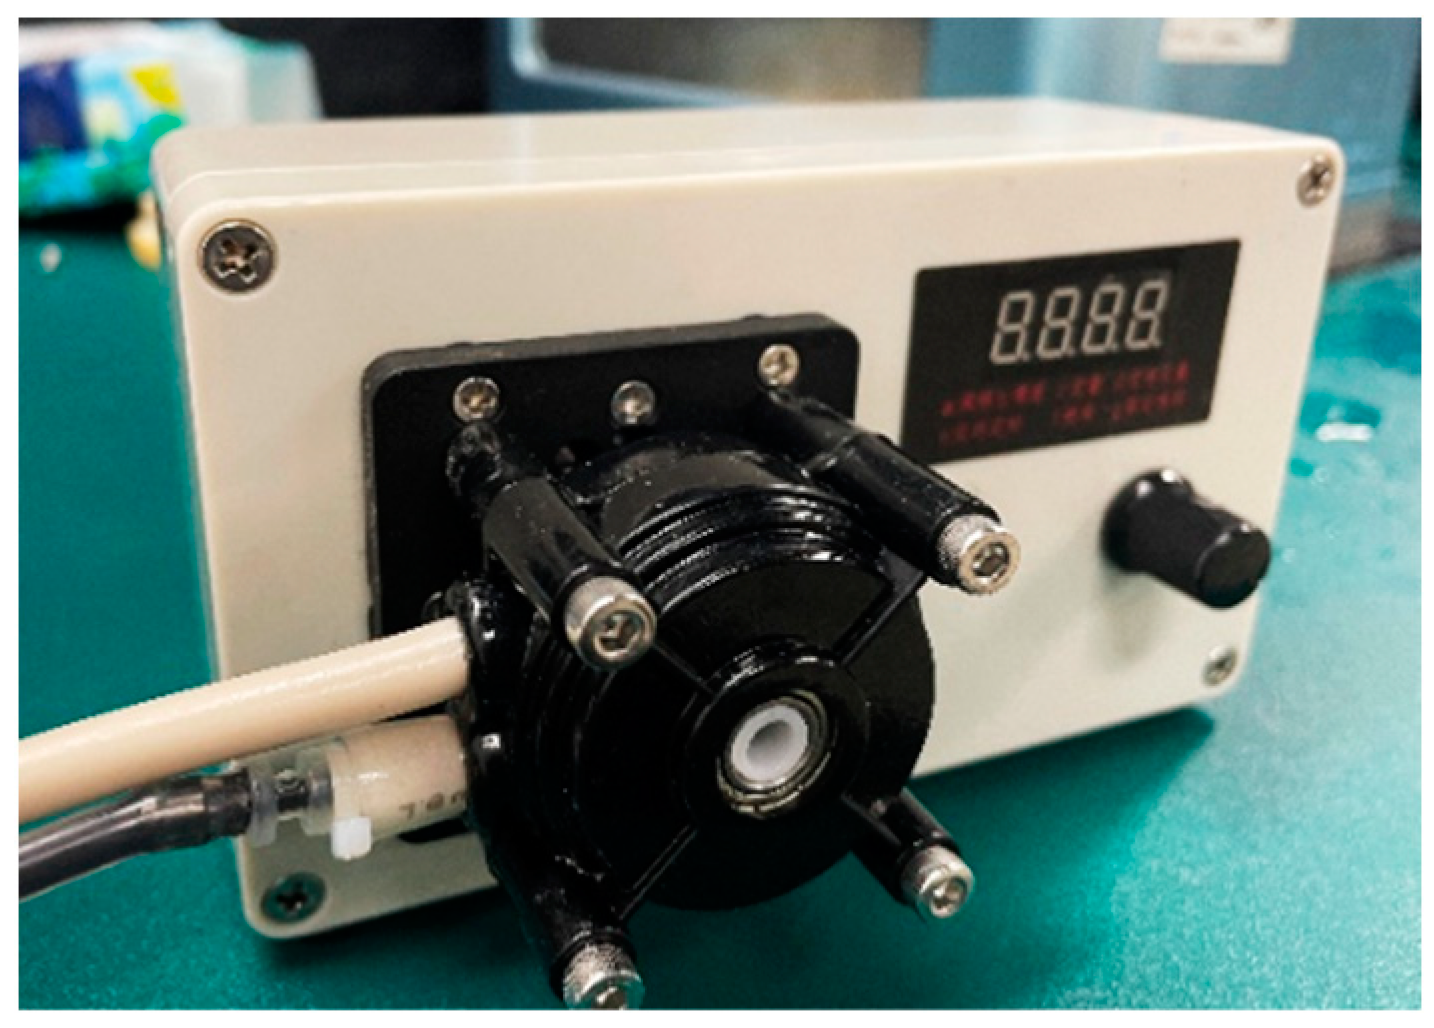
The experiment used the MS-M9000 multifunctional friction tester (connected to a computer) to simulate the sliding friction conditions of the valve plate pair system, testing the friction and wear characteristics of the valve plate pair materials under different operating conditions. As shown in Figure 1 and Figure 2 the upper specimen (simulating the cylinder body) was mounted on a friction pair loading rod driven by a servo motor, with a friction force sensor on one side to detect the friction force between the friction pair. The lower specimen was mounted on the rotating module of the test machine, driven by a servo motor for rotational motion at a speed range of 0–2000 r/min. The lubricant used was No. 15 aviation hydraulic oil, with a density of ρ = 8.73 × 10⁻⁸ kg/mm3, and dynamic viscosities of v1 = 20.19 mm2/s at 40 degrees Celsius and v2 = 5.03 mm2/s at 100 degrees Celsius. The lubricant was supplied through a lubricating oil pump via pipelines, as shown in Figure 3, with adjustable flow rates, and the return oil flowed back to the oil bottle through a tube. During the experiment, the COF was indirectly calculated using a computer based on real-time data measured with the friction force sensor, with experiment force, speed control, and data collection all controlled via the computer at a sampling frequency of 9 Hz.
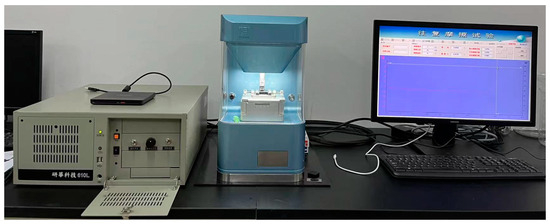
Figure 1.
Friction wear test system.
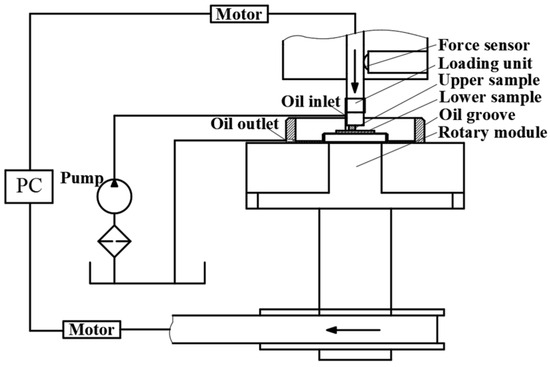
Figure 2.
Schematic diagram of the test machine.
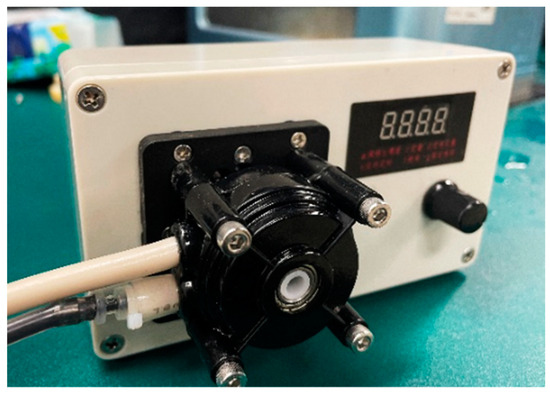
Figure 3.
Peristaltic pump.
- Sample Parameters
To meet the friction requirements of the axial piston pump valve plate pair, the upper specimen was made of HAl61-4-3-1, one of the commonly used copper materials for an axial piston pump valve plate, to simulate a cylinder body, while the lower specimen was made of W9Mo3Cr4V, a common material for valve plates.
The surface roughness of the lower specimen followed the processing technique for piston pump valve plate, with a surface roughness of 0.4 μm. The surface hardness of the lower specimen was of uniform Rockwell hardness, which measures hardness at five points per specimen and calculates the average as its representative value. The surface hardness of the upper specimen was measured at 203 HV using a Vickers hardness tester. The material parameters of the specimens are detailed in Table 1, and actual photos of the upper and lower specimens are shown in Figure 4.

Table 1.
Material characteristic parameters.
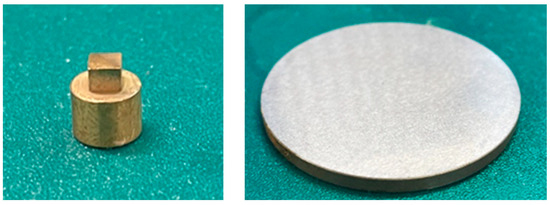
Figure 4.
Friction specimen physical diagram.
- Experimental process
The experiments were conducted through controlling the variables, with all tests performed under fixed time durations (totaling 7200 s), and varying loads and pressures per the predetermined conditions listed in Table 2.
Table 2.
Friction experiment parameters.
The loading forces were set at 30 N, 60 N, 90 N, and 120 N, while the speeds were set at 100 r/min, 300 r/min, and 500 r/min. Prior to the experiment, the specimens’ surfaces were cleaned of impurities using an ultrasonic CNC cleaning machine. During the experiment, a load was applied to the upper specimen using a variable loading mechanism, while the lower specimen rotated according to the preset parameter values of the rotating module. A small lubricating oil pump was activated to circulate the oil in the oil cup. After the experiment, the specimens were removed, cleaned again using an ultrasonic CNC cleaning machine, air-dried, and observed for friction and wear morphology on the surface using SEM. Based on the obtained friction force signals during the experiment, post-amplification and input into the computer through A/D conversion allowed the COF data from the friction force signals to be calculated, with the COF μ calculated using Equation (1) [19]. The variation curve of the COF of the valve plate pair materials was plotted, and the results were analyzed using machine ML models.
where μ represents the friction coefficient, F represents the friction force, and N represents a positive pressure (load).
2.2. ML Research Methods
In tribology research, the process of establishing ML models can be divided into four stages—data collection, data preprocessing, model construction, and model evaluation—as shown in Figure 5.
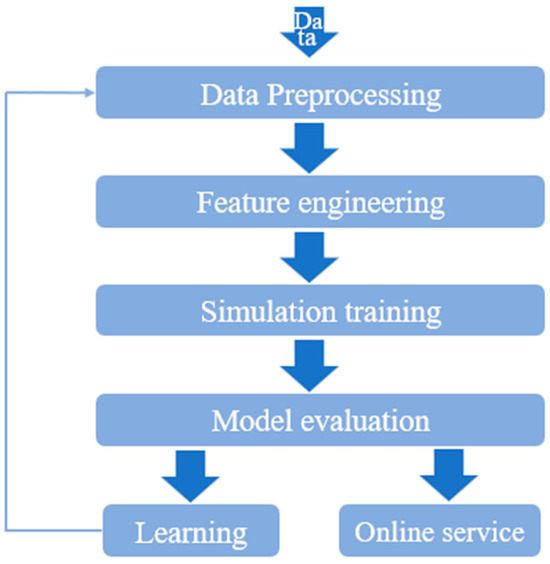
Figure 5.
Flowchart of machine learning (ML) algorithm modeling.
2.2.1. Database Construction and Data Preprocessing
Based on the research results for friction and wear, friction and wear experiments were conducted through varying the experimental speeds, times, and load sizes to analyze and organize the collected experimental data. After removing abnormal data, the COF data under various parameter combinations were obtained, as shown in Table 3. To ensure the accuracy of the model, a normalization method was used to map the sample data to [0,1] to reduce relative relationships and impacts between different orders of magnitude, as shown in Equation (2) [30]:
where xmax and xmin represent the maximum and minimum values of the sample data, respectively, x represents the values of the sample data before normalization, and x′ represents the corresponding values of the sample data after normalization. After training, the transformed data were restored to their original values using Equation (3) [31]:
Table 3.
Dataset feature parameters.
2.2.2. Introduction of Prediction Models
This study treated the COF of axial piston pump valve plate pair materials as a regression problem. To determine the optimal model for predicting the COF of axial piston pump valve plate pair materials, three machine learning (ML) methods were employed: tree ensemble methods (such as RFR and ETR) and ensemble methods implemented in the Scikit-Learn package (such as BR) [32]. To achieve data-driven prediction of the COF, 623 targets were divided into two distinct sets: a test set with a size of 25% and a training set with a size of 75%. In the model optimization process, Monte Carlo cross-validation was used. Four sets of features were selected to predict the corresponding performance, with low redundancy among the dataset features.
- RFR Model
Random forest regression (RFR) aims to establish a reliable and accurate predictive model for tasks involving regression. In the RFR model, each decision tree independently fits the input data, producing a regression prediction value. The model then takes the average of these prediction values as the final predicted result [31].
- 2.
- BR Model
BR is an ensemble learning technique that enhances prediction accuracy and stability through combining multiple base learners. Its objective is to decrease the correlation among base learners, thereby reducing the variance of the entire ensemble model and improving its generalization capability. A flowchart of the BR algorithm is shown in [33], outlining the process that must be followed to achieve the desired outcome.
- 3.
- ETR Model
ETR [34] is utilized to obtain evidence weights for models based on decision trees. The model consists of numerous independent trees, each utilizing the complete training dataset. It employs a top-down learning approach starting from the root node and gradually determines the splitting rules via leveraging random feature subsets and partial random split points in the regression of each decision tree. This iterative process continues at each subsequent child node until the traversal reaches a leaf node, encapsulating the decision process within the decision tree [35]. ETR is further refined using random splits. An enhancement method is gradient boosting, which creates an additional model with continuously improving performance [36].
2.2.3. Evaluation Metrics for Prediction Models
To obtain a reliable and interpretable ML model, the balance between MAE, RMSE, R2, and computational complexity was discussed. MAE and RMSE are widely used to evaluate the performance of regression models [37]. The MAE and RMSE differences between the predicted values and true values were computed for each experiment and then averaged to obtain the average MAE and RMSE values as well as their residuals. Using Equations (4) [36], (5) [38], and (6) [25], MAE, RMSE, and R2 were utilized to represent the model fitness and the errors between actual data points and predictions.
The actual COF value is denoted as , while the predicted COF value is denoted as , where represents the mean value, and n is the total number of samples. To determine the degree of match between the predicted values and actual values, MAE was used to calculate the absolute difference between and the corresponding predicted value [39], quantifying the average error estimate. The lower the results for Equations (4) and (5), the closer the prediction results are to the true values [40], whereas R2 is the complete opposite; the numerator of the second term in Equation (6) determines the average error of the squared sum of residual prediction errors, while the denominator represents the variance [41,42].
3. Analysis of Experimental Results
3.1. Comparison of Friction Characteristics under Different Conditions
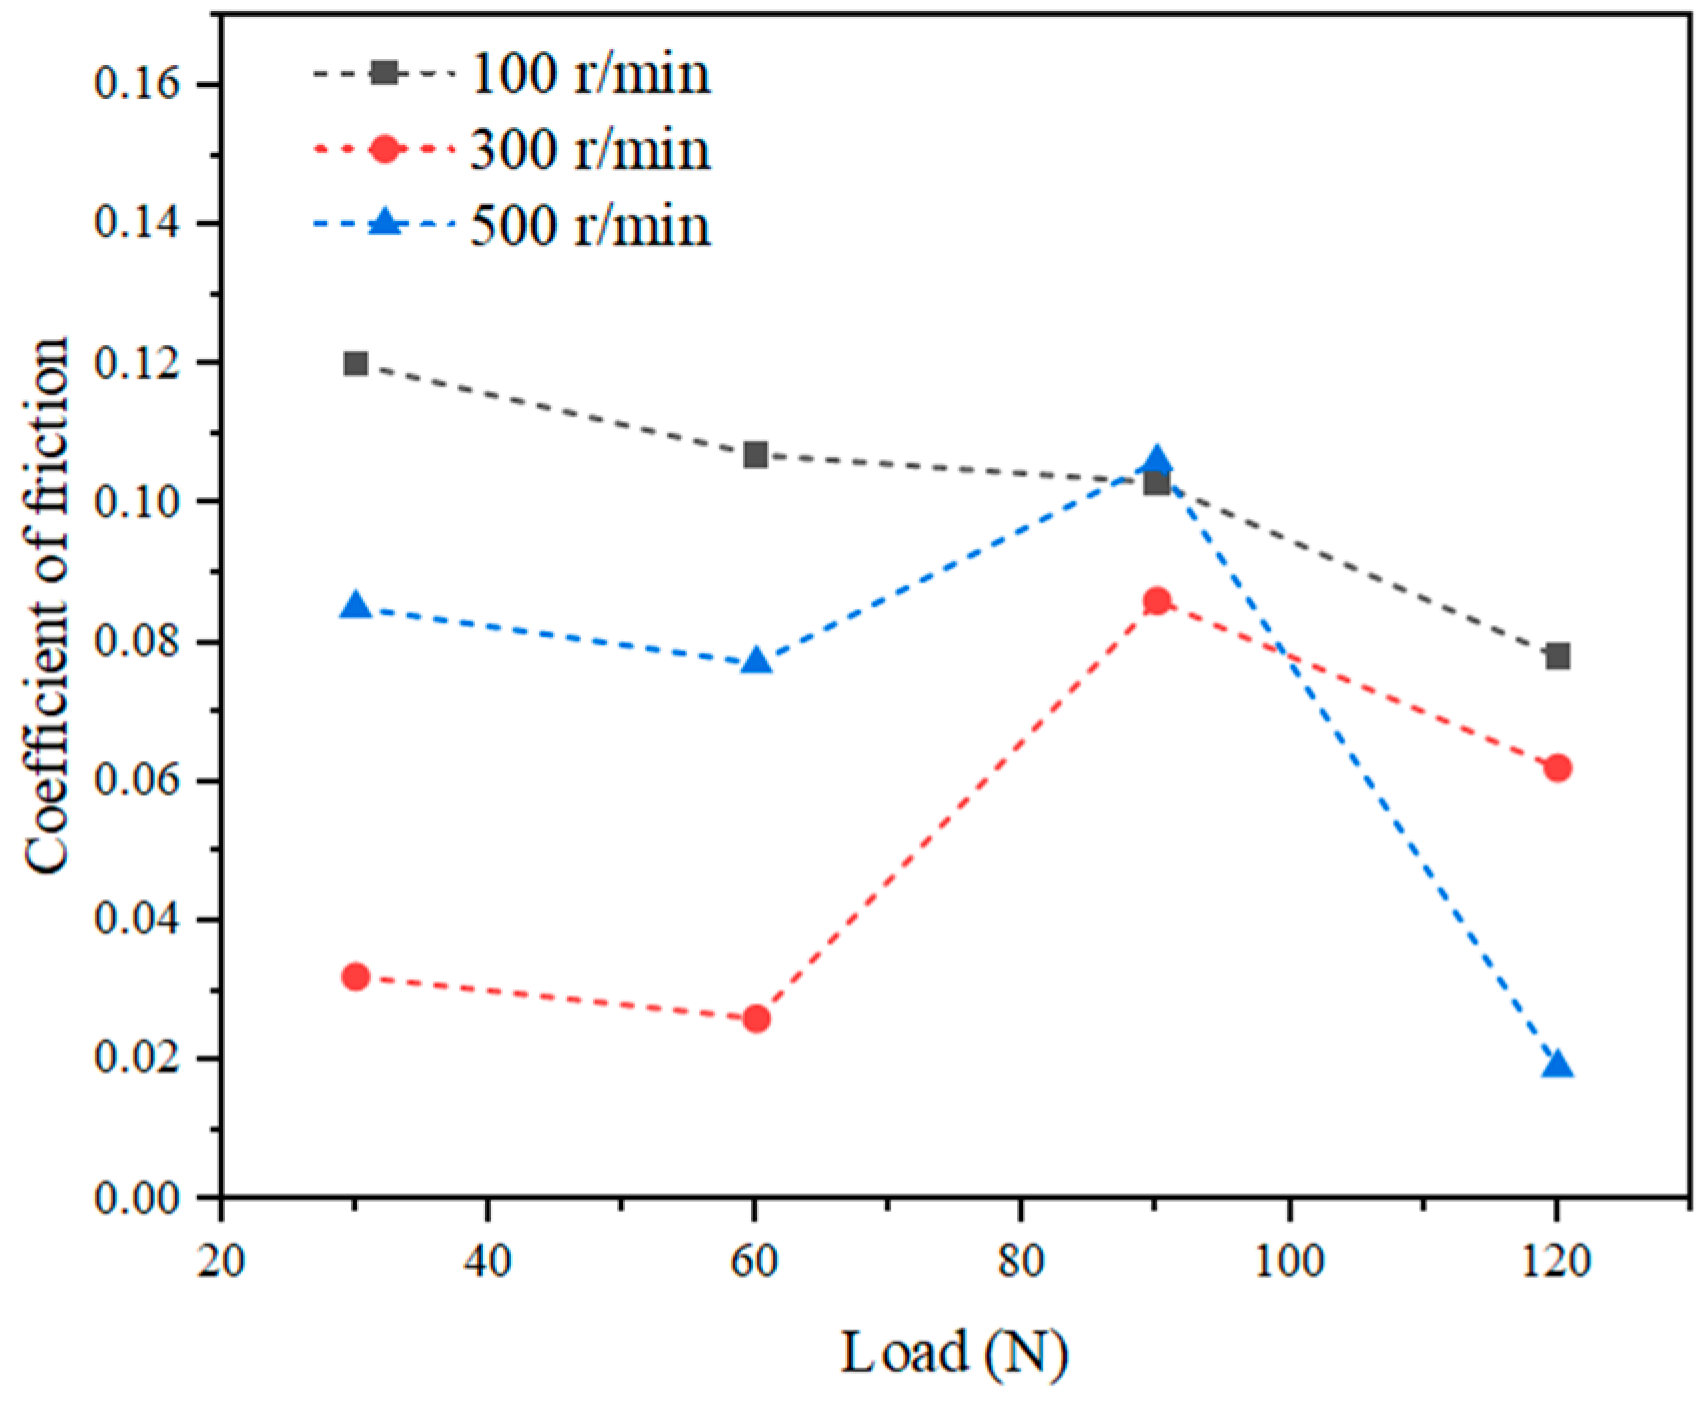
Figure 6 shows the friction curve under conditions of constant speed and variable load conditions (when the speed is constant, with comparison of different loads). As the load increased from 30 N to 120 N and the linear velocity changed from 100 r/min to 500 r/min, the COF fluctuated within the range of 0.010 to 0.120. At a speed of 100 r/min, the COF decreased with an increase in load, with a 35% decrease as the load increased from 30 N to 120 N. Under conditions of 300 r/min and 500 r/min, with an increasing load, the COF showed a trend of first slowly decreasing, then increasing, and finally decreasing again. The results indicate that at 300 r/min and loads less than 120 N, the COF was minimal.
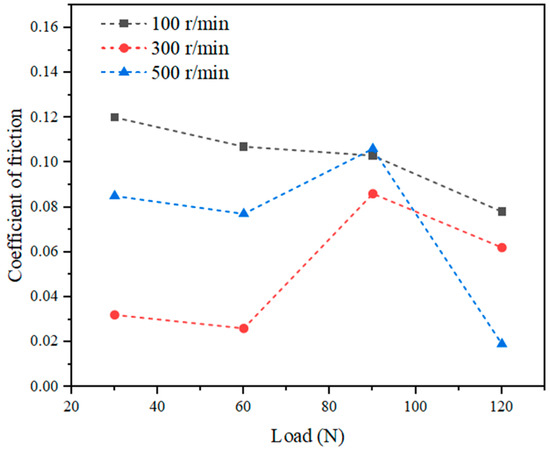
Figure 6.
COF of the sample under conditions of constant speed and variable load.
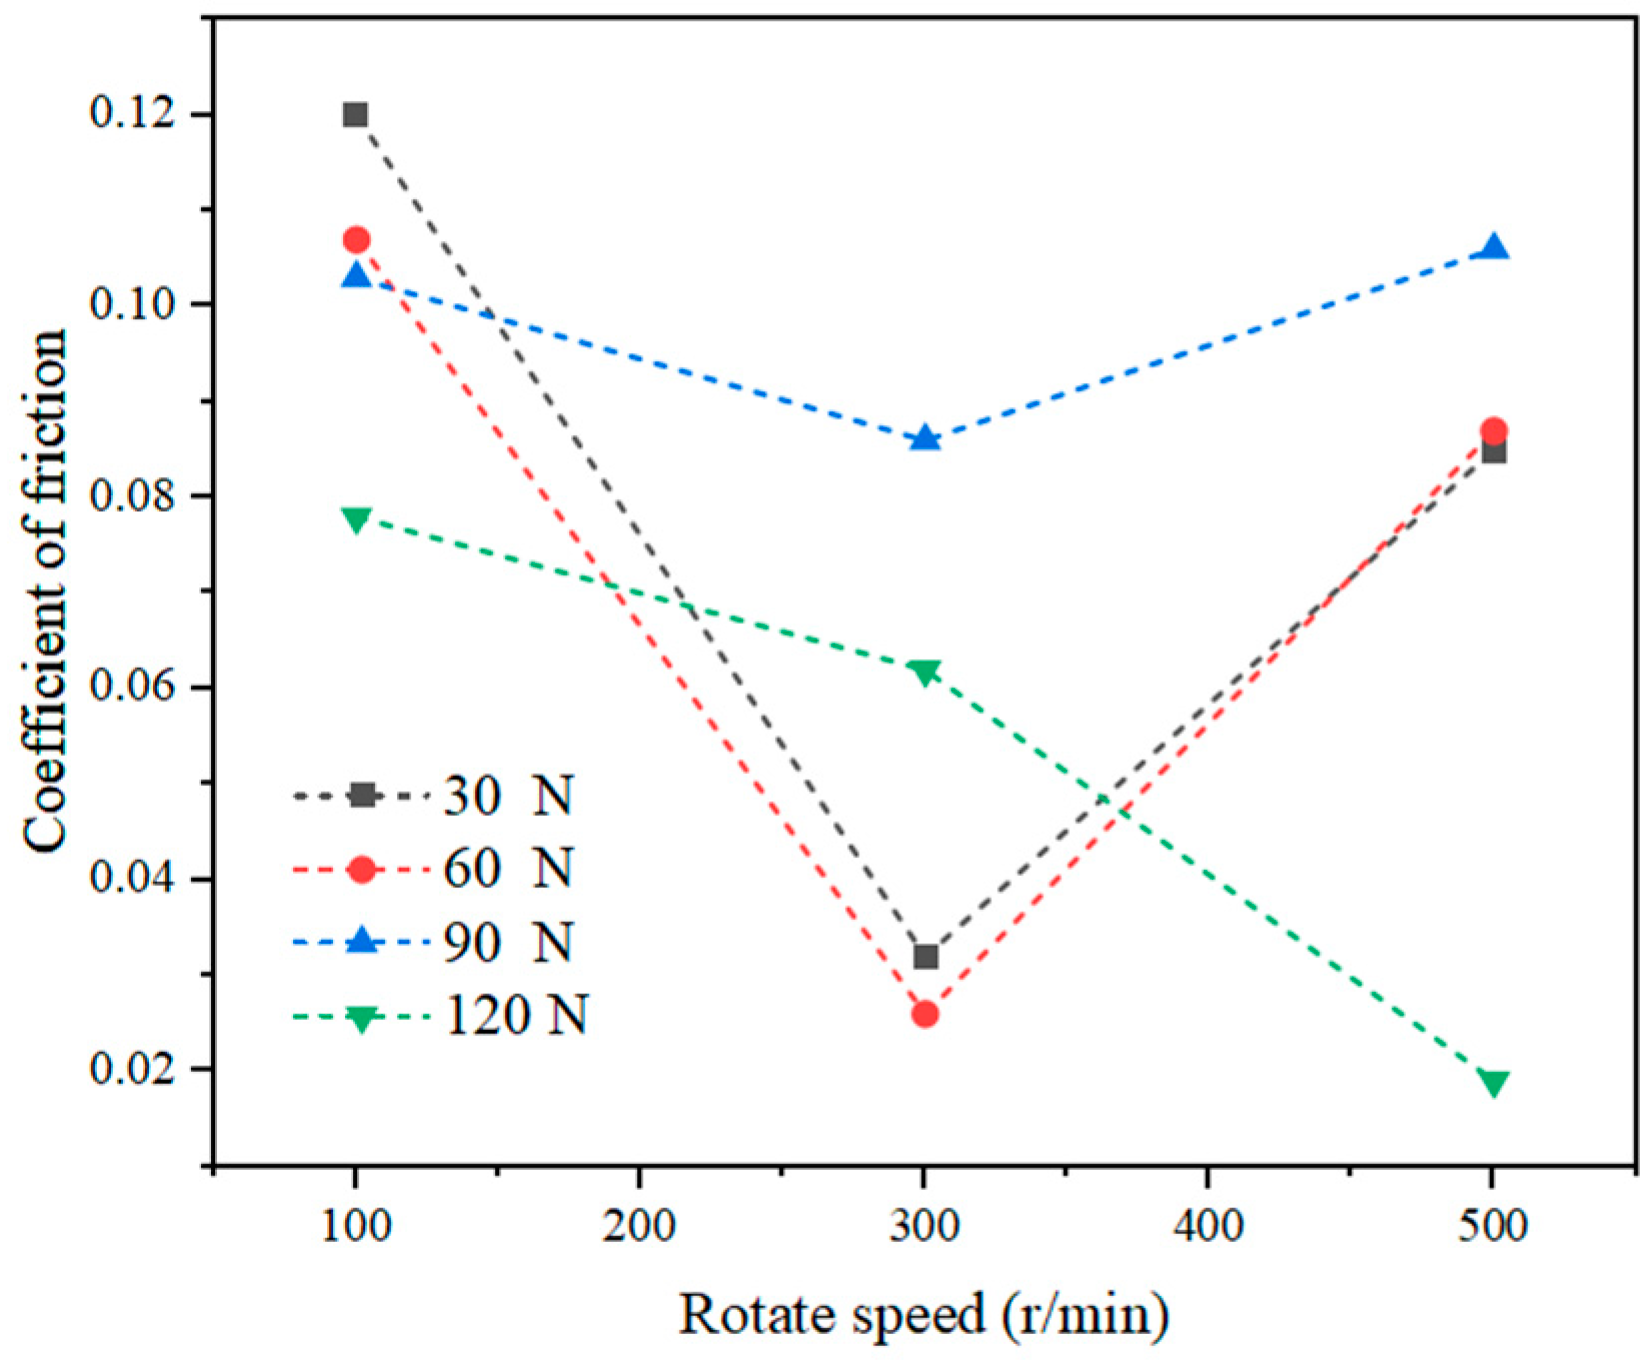
Figure 7 shows the variation in the COF under conditions of constant load and variable speed (constant loads, with comparison of different speeds). As the linear velocity increased from 100 r/min to 500 r/min, the COF under conditions with loads less than 120 N showed a trend of initially decreasing and then increasing, indicating that speed had a significant impact on the COF of the valve plate pair material. Under different load conditions, the COF was minimal at a speed of 300 r/min; under the condition of 500 r/min, the COF at a load of 120 N was lower than at a load of 30 N. Larger loads did not correspond to larger coefficients of friction, a phenomenon that is explained in Section 3.2 through surface morphology and wear mechanisms.
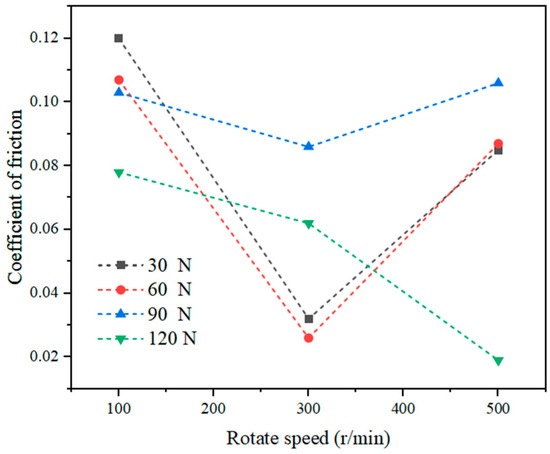
Figure 7.
COF of the sample under conditions of constant load and variable speed.
3.2. Friction Mechanism Analysis
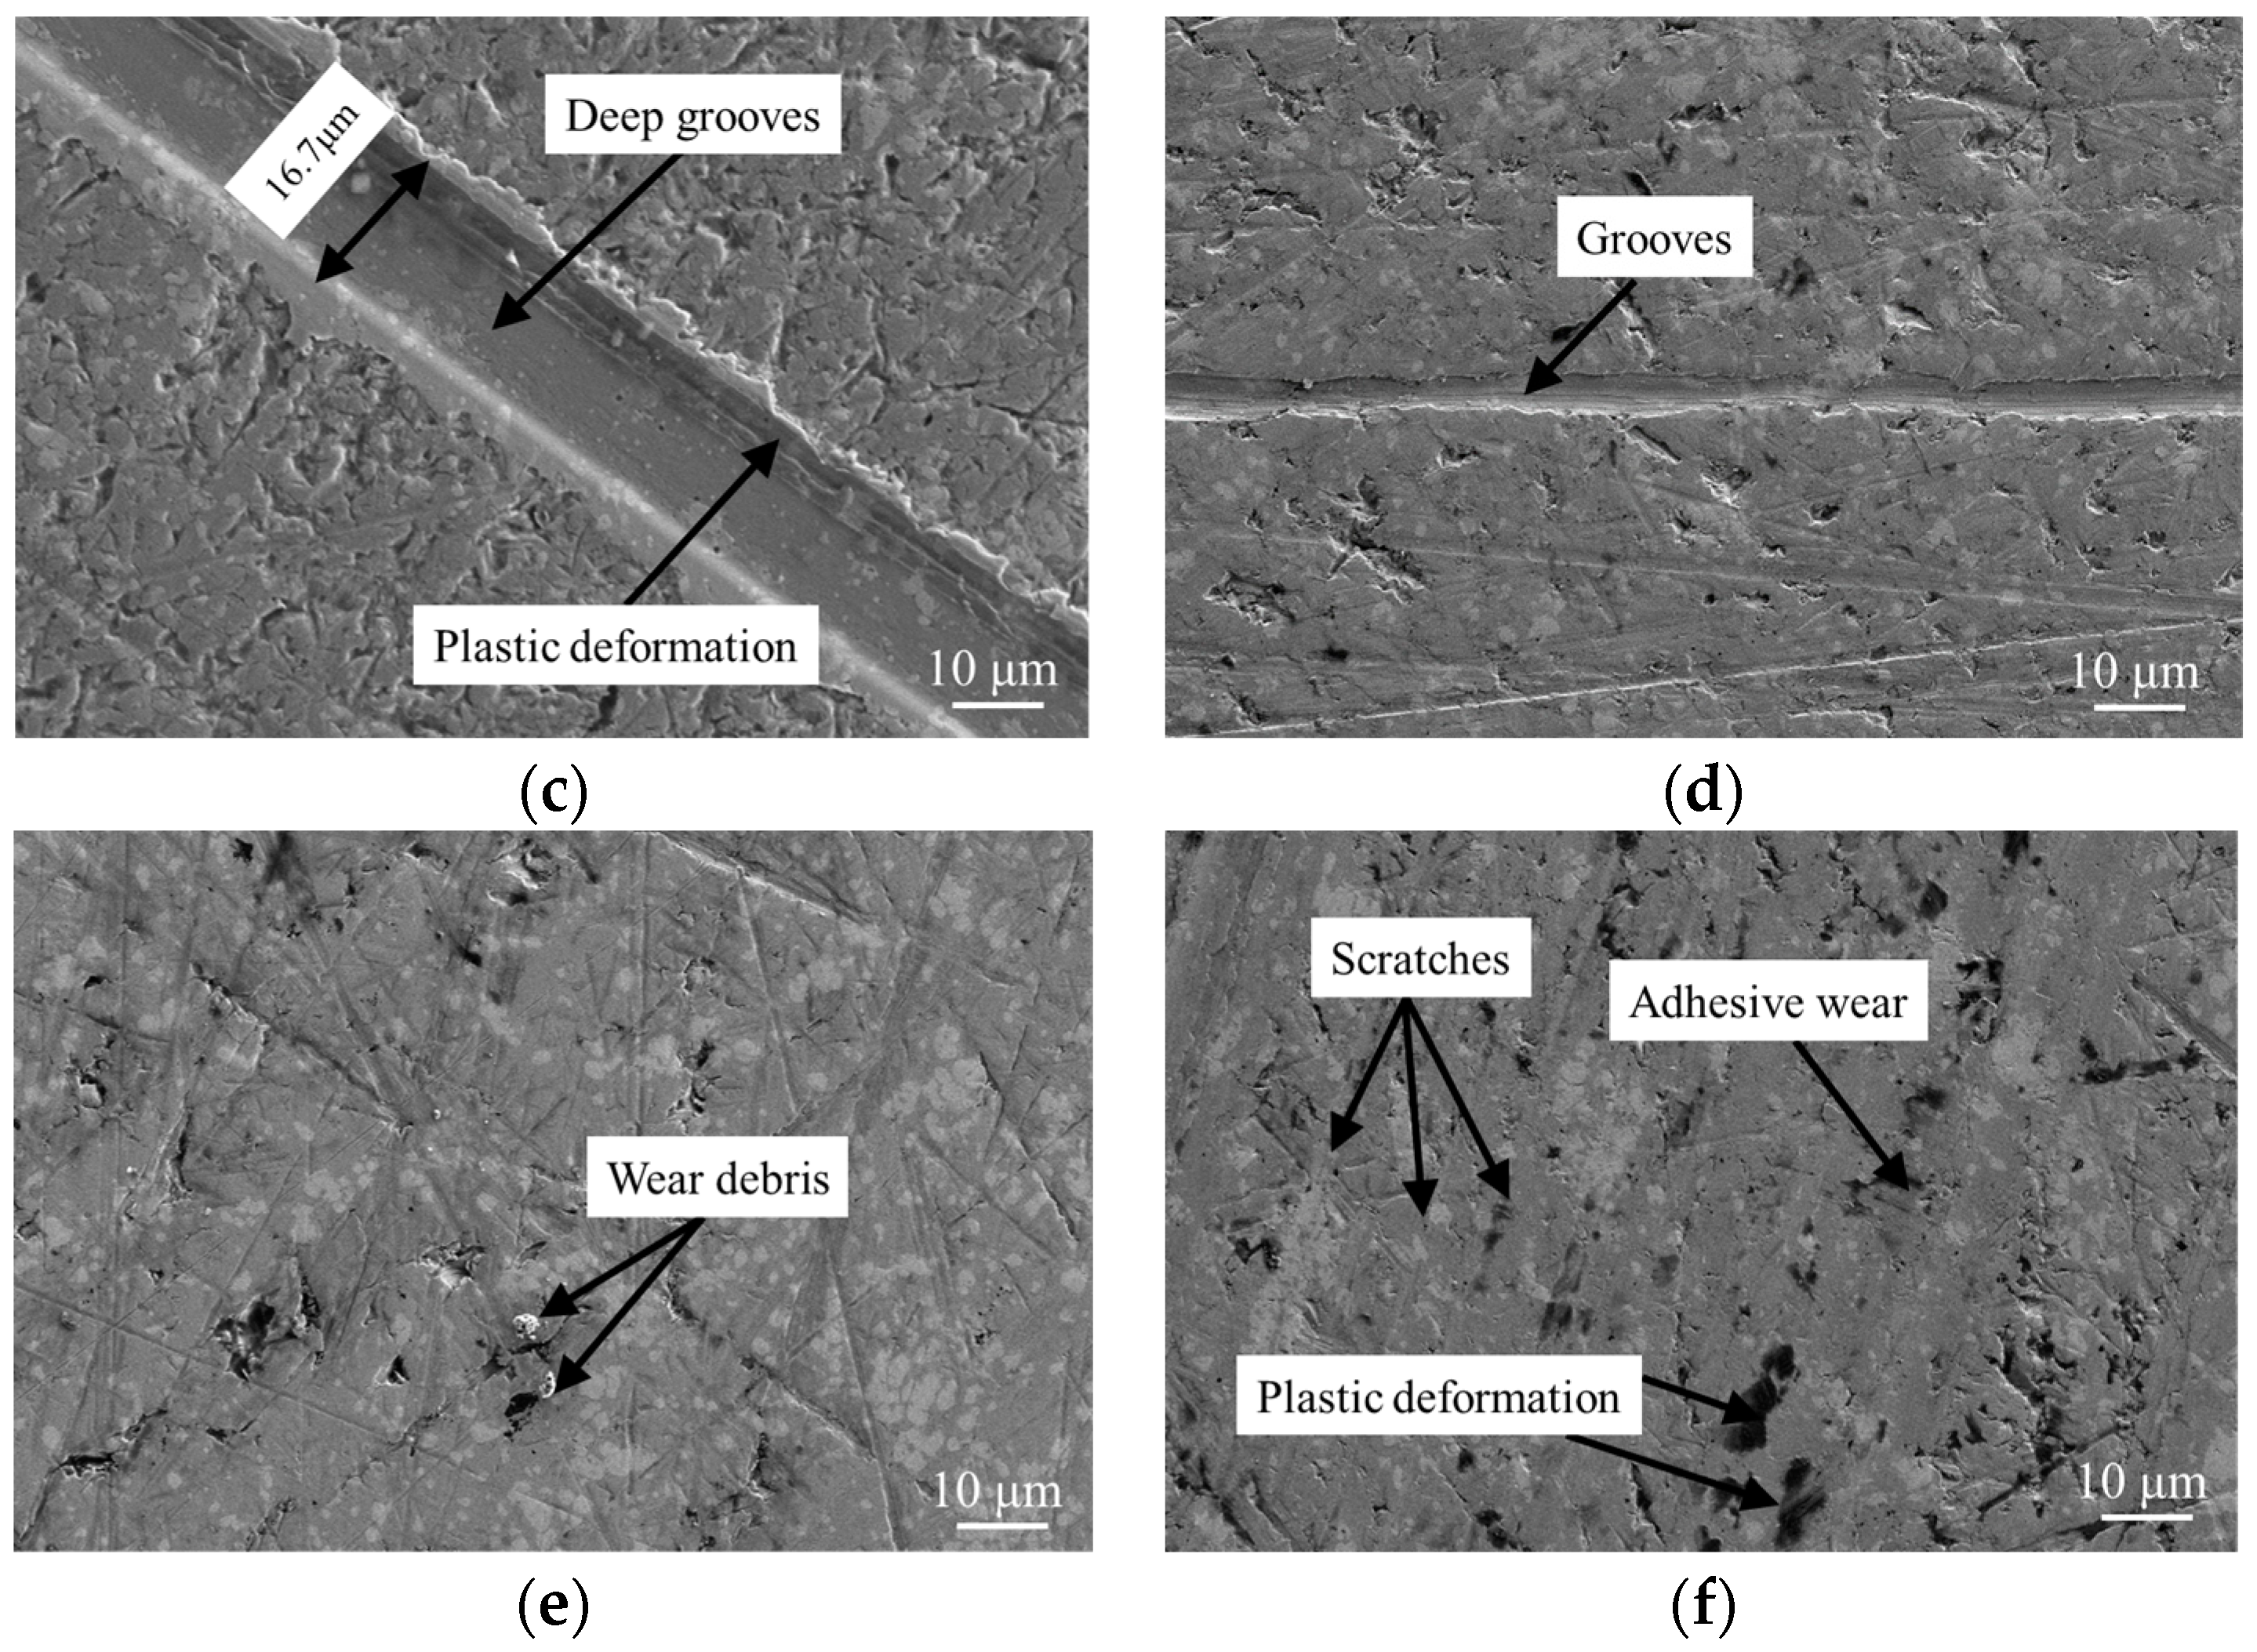
Figure 8 gives the surface morphology of the W9 steel disc friction pair under different loads and speeds. As shown in Figure 8a–f, clear wear marks were observed under all experimental conditions. At 100 r/min, fine scratches and grooves were visible, indicating mild abrasive wear (Figure 8a,d). However, at a speed of 500 r/min, due to the presence of deep grooves, mild abrasive wear transitioned to severe abrasive wear (Figure 8c), with scratches produced by abrasives exceeding 16 μm. The presence of grooves parallel to the sliding direction is a sign of abrasive wear [43,44,45]. At 300 r/min, micro-cutting dominated, with some areas showing signs of micro-fatigue and shallow pits formed through delamination (Figure 8b) [46], indicating abrasive wear in the form of grooves under these conditions, accompanied by adhesive wear. Although the ploughed sections caused by micro-grooving and micro-cutting appeared similar, the difference was in the fact that micro-cutting formed less compressed debris than micro-grooving, making the debris from micro-cutting easier to peel off [47]. Micro-cutting created deeper furrows on the worn surface. As shown in Figure 8e (load of 60 N, speed of 300 r/min), small pits and worn debris were found on the worn surface, with minor adhesive wear present. Compared with Figure 8e, under conditions of 60 N and 500 r/min, as shown in Figure 8f, the sample surface appears to have undergone severe adhesive wear, along with significant plastic deformation and scratches.
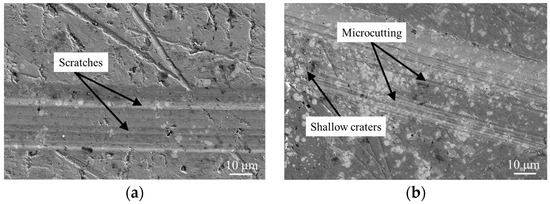
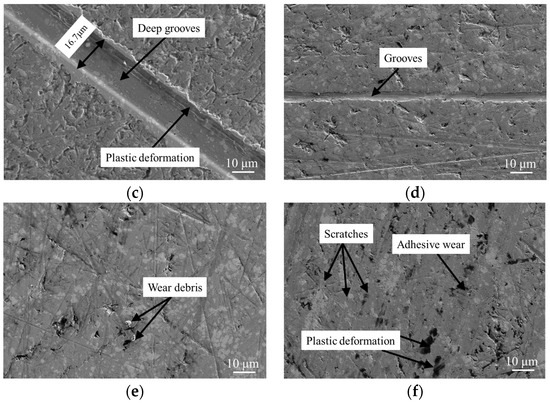
Figure 8.
SEM images of the worn surface of W9 samples under different conditions: (a) 30 N, 100 r/min; (b) 30 N, 300 r/min; (c) 30 N, 500 r/min; (d) 60 N, 100 r/min; (e) 60 N, 300 r/min; (f) 60 N, 500 r/min.
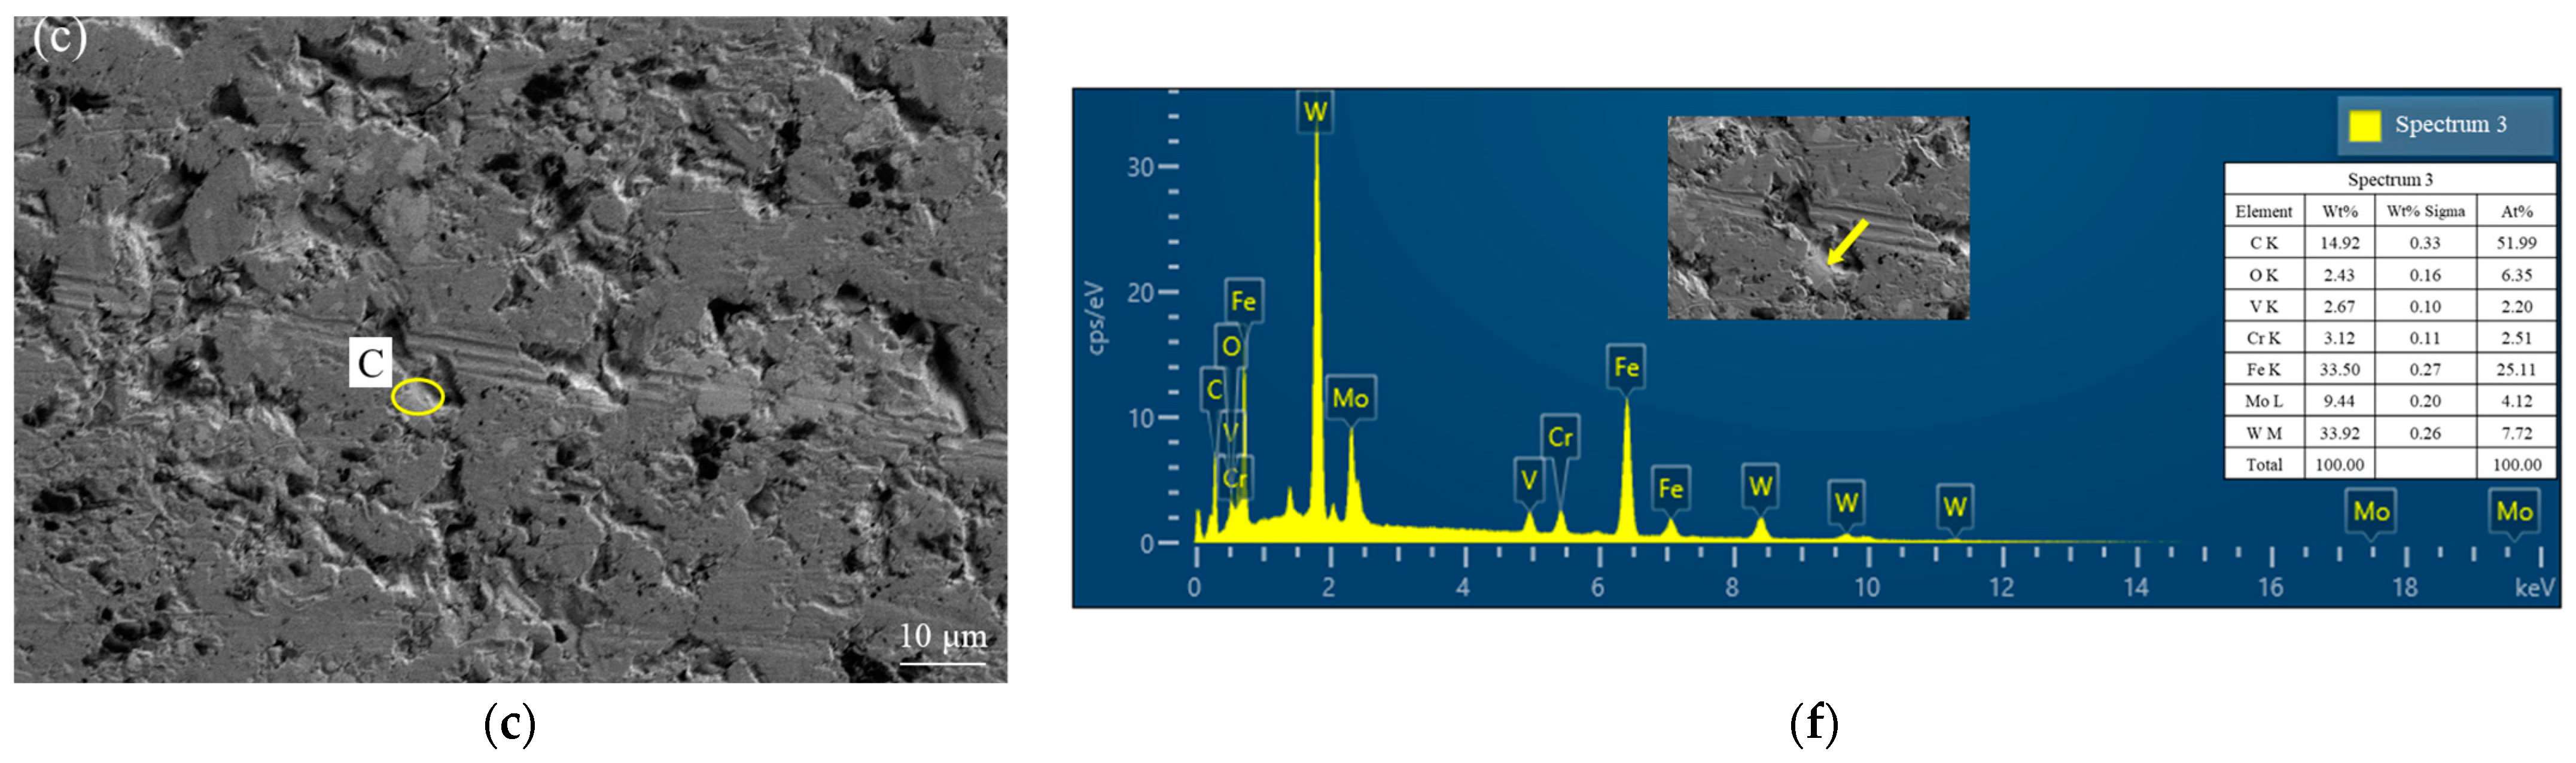
As can be observed from the previous analysis results, under different load conditions, the COF was the smallest at a speed of 300 r/min. The morphology of the specimen’s frictional material wear patterns under conditions of 300 r/min and various loads was analyzed as shown in Figure 9. The EDS spectrum data for points A, B, and C in Figure 9 are presented in subfigures (d), (e), and (f), respectively.
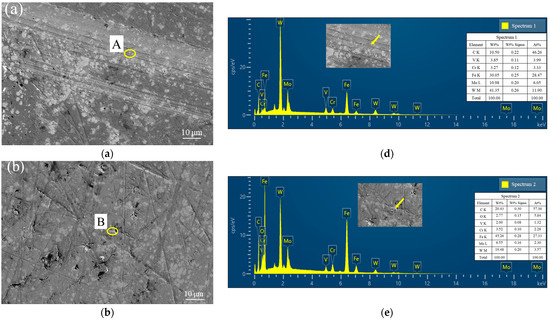

Figure 9.
Morphology and composition of the samples at 300 r/min: (a) 30 N; (b) 60 N; (c) 90 N; (d) EDS spectrum of A; (e) EDS spectrum of B; (f) EDS spectrum of C.
As can be seen from Figure 9, when the load was 30 N, the worn surface of the W9 steel disc exhibited small pores, slight abrasions, and a minimal amount of micro-fatigue. The reason for this can be analyzed as follows: when the experimental load was within a lower range, the mating surface of the valve plate pair material was neither smooth nor flat, with both surfaces displaying relatively high micro-peaks. This reduced the actual contact area of the W9 steel disc friction pair, resulting in the actual contact area experiencing pressures far greater than the given pressure, leading to a relatively large macroscopic COF. Additionally, the continuous formation of high-hardness micro-peaks on the sample created grooves, resulting in scratch formation and generation of wear debris. This eventually led to surface delamination, with abrasive wear as the predominant wear mechanism. As the load increased from 30 N to 60 N, due to the increase in contact load, larger micro-peaks on the specimen’s surface were sheared off, reducing the number of micro-peaks. As a result, the effective contact area of the friction pair increased, leading to a reduction in surface roughness and COF during the wear process. The surface showed fewer signs of adhesive wear, as depicted in Figure 9b. Moreover, as shown in Figure 9d, EDS data revealed a minimal oxygen content on the scratched surface, suggesting insignificant oxidative wear. However, as shown in Figure 9e, under a load of 90 N, the oxygen content increased, indicating the presence of oxidative wear during high-load friction processes. Figure 9c demonstrates that when the load reached 90 N, adhesive traces and shallow pits formed on the surface, signifying adhesive wear occurring on the sample’s surface due to strong contact pressures causing the material of the W9 surface to fail to withstand the strong shear forces in the wear process that affected the friction pair. This led to material flaking at certain locations on the W9 surface, subsequently resulting in an increase in COF, peaking at 0.086. At this point, adhesive wear became predominant, with slight oxidative wear.
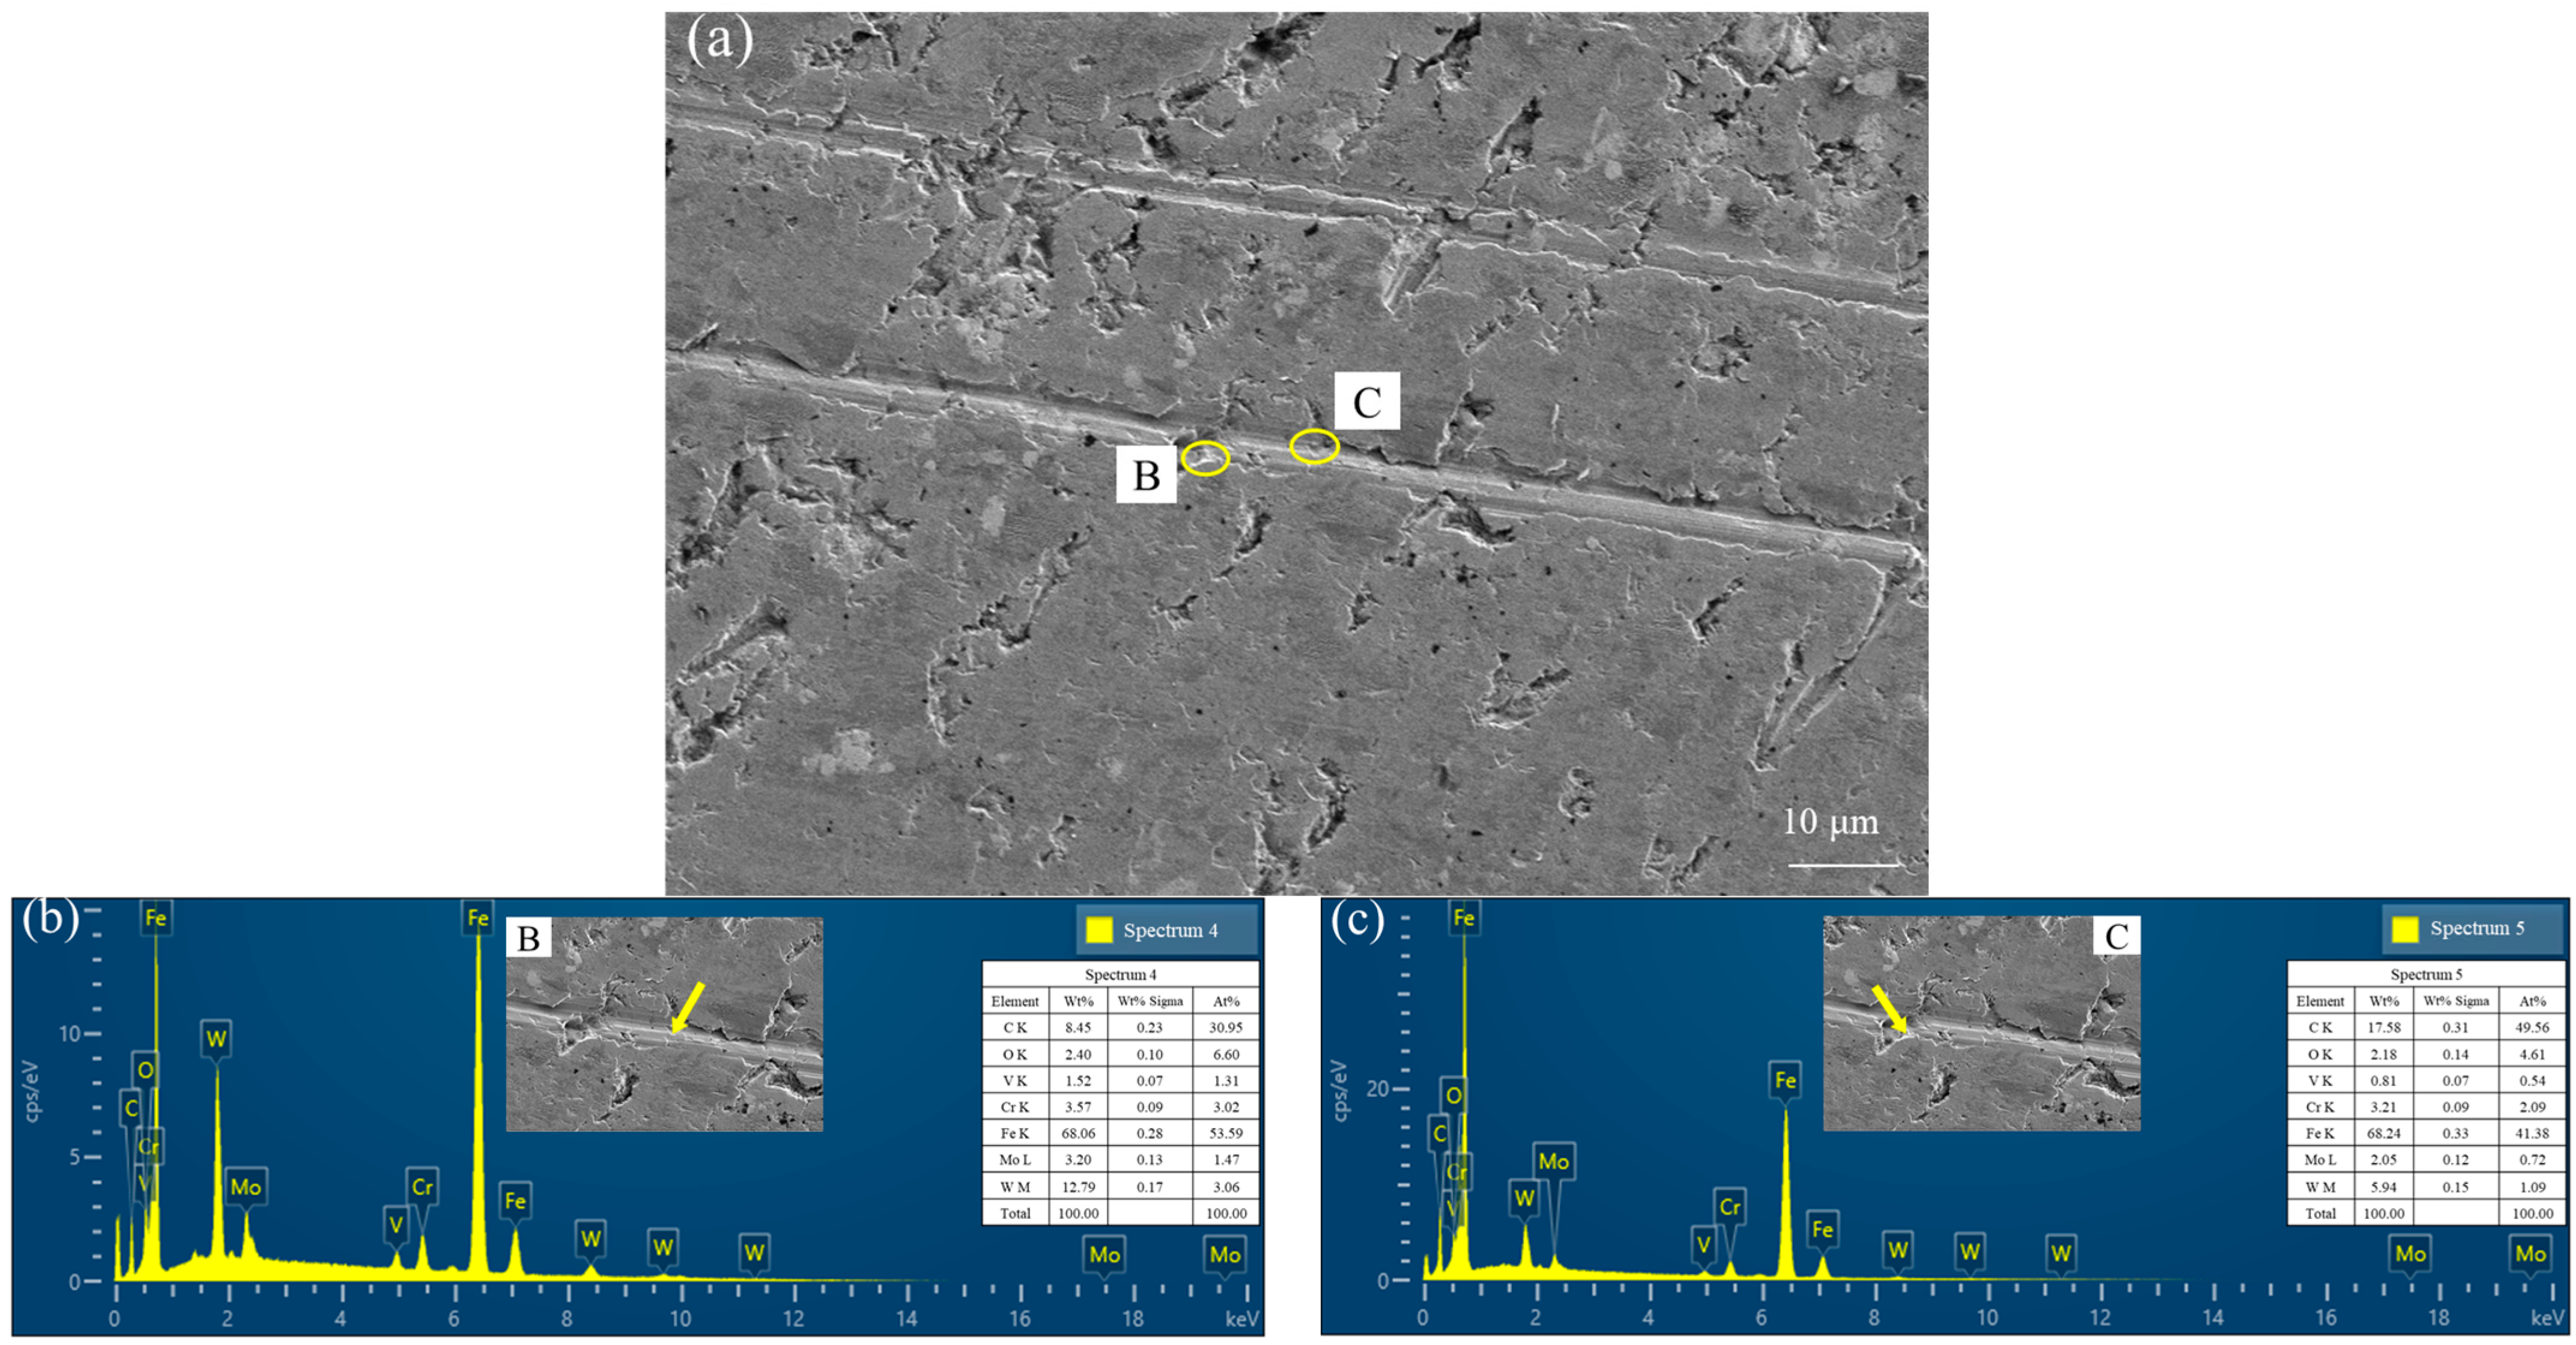
With an increase in speed, the friction pair’s surface temperature increased rapidly, and the instantaneous heat generated by friction could not dissipate promptly. After the speed reached 300 r/min, material transfer occurred in parts of the friction pair, leading to adhesive wear. To confirm this, the morphology of the W9 steel disc surface under conditions of 120 N and 500 r/min was analyzed, as shown in Figure 10, where subfigures (b) and (c) represent the EDS data spectra for points B and C in Figure 10a, respectively. As seen in Figure 10b, deep scratches and plastic deformation areas were visible on the W9 disc, with surface material detachment forming pits and featuring the primary elements of the sampled material along with a minor amount of oxygen. This further confirmed the occurrence of adhesive wear and a small amount of oxidative wear during the wear process.

Figure 10.
(a) SEM image of W9 steel plate surface morphology at 120 N, 500 r/min; (b) EDS spectrum of B; (c) EDS spectrum of C.
Compared with different load conditions, under a load of 120 N and a speed of 500 r/min, the minimum COF was observed, with a value of 0.019. For loads less than 120 N, the COF was relatively minimal at a speed of 300 r/min, reaching a low of 0.026. In conclusion, the primary wear mechanism for the W9 steel disc friction pair at low loads and speeds was abrasive wear. With increasing speed and load, the specimen’s surface micro-peaks were sheared off and their numbers decreased. Under high loads, the surface could not withstand the strong shear forces in the friction pair, leading to a delamination mechanism causing wear debris to detach and create adhesive wear. At a load of 90 N, adhesive wear was predominant, along with slight oxidative wear.
Of note from the former section, the different COFs of the friction pair materials under various conditions corresponded to different surface wear mechanisms. Abrasive wear generated under low conditions was found to possibly lead to an increase in the COF; conversely, adhesive wear under high loads resulted in a smaller COF and oxidation of the specimen. Therefore, an evaluation of the COF for a valve plate pair material can indirectly provide insights into its wear mechanism characteristics and is of great significant when developing new valve plate pair materials.
4. ML Prediction Analysis
In this study, based on the results of friction tests, the data were analyzed and organized. After removing outliers, the experimental data were divided into training and testing sets, in proportions of 75% and 25%, respectively. Machine learning (ML) methods were then used to select the best predictive model for a quantitative research analysis of the COF of valve plate pair materials.
4.1. Comparison of Friction Characteristics under Different Conditions
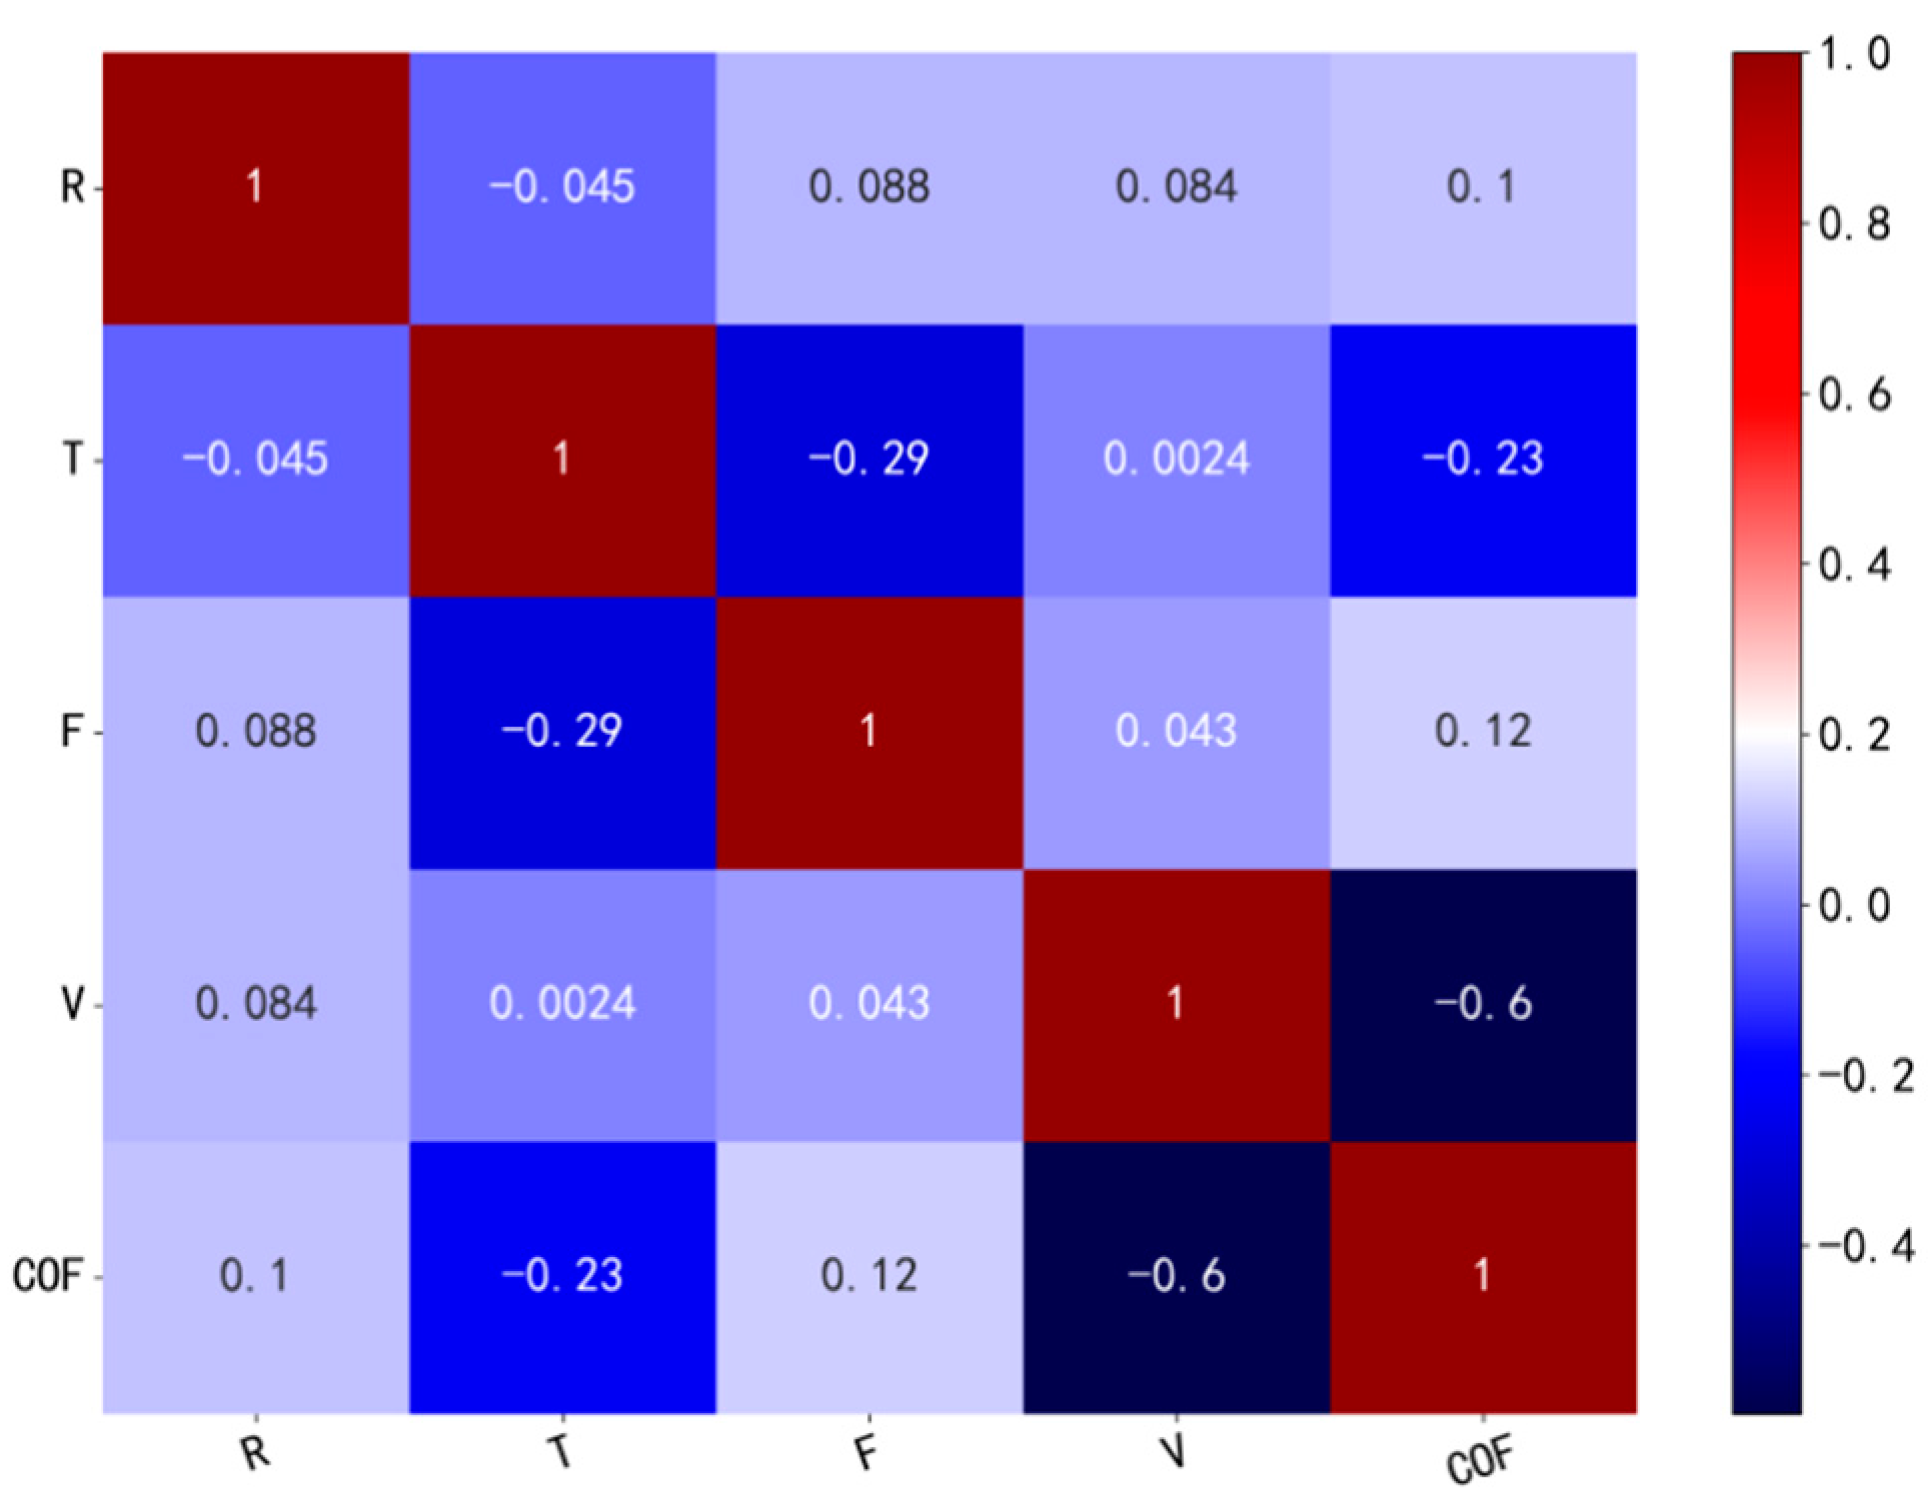
Usually, dataset features can be extracted based on experience, but in large datasets, redundant data remain inevitable. The correlation between tribological features directly impacts the accuracy of the method applied. Therefore, a Pearson correlation analysis was conducted between pairs of features, with the correlation heatmap shown in Figure 11. All four features listed in Table 4 were selected as they showed no strong correlations amongst one another, indicating that the features chosen for ML training were not redundant.

Figure 11.
Correlation heat maps for the primary features in the dataset.
Table 4.
Performance comparison of ML methods for COF prediction.
4.2. Establishment of a COF Prediction Model
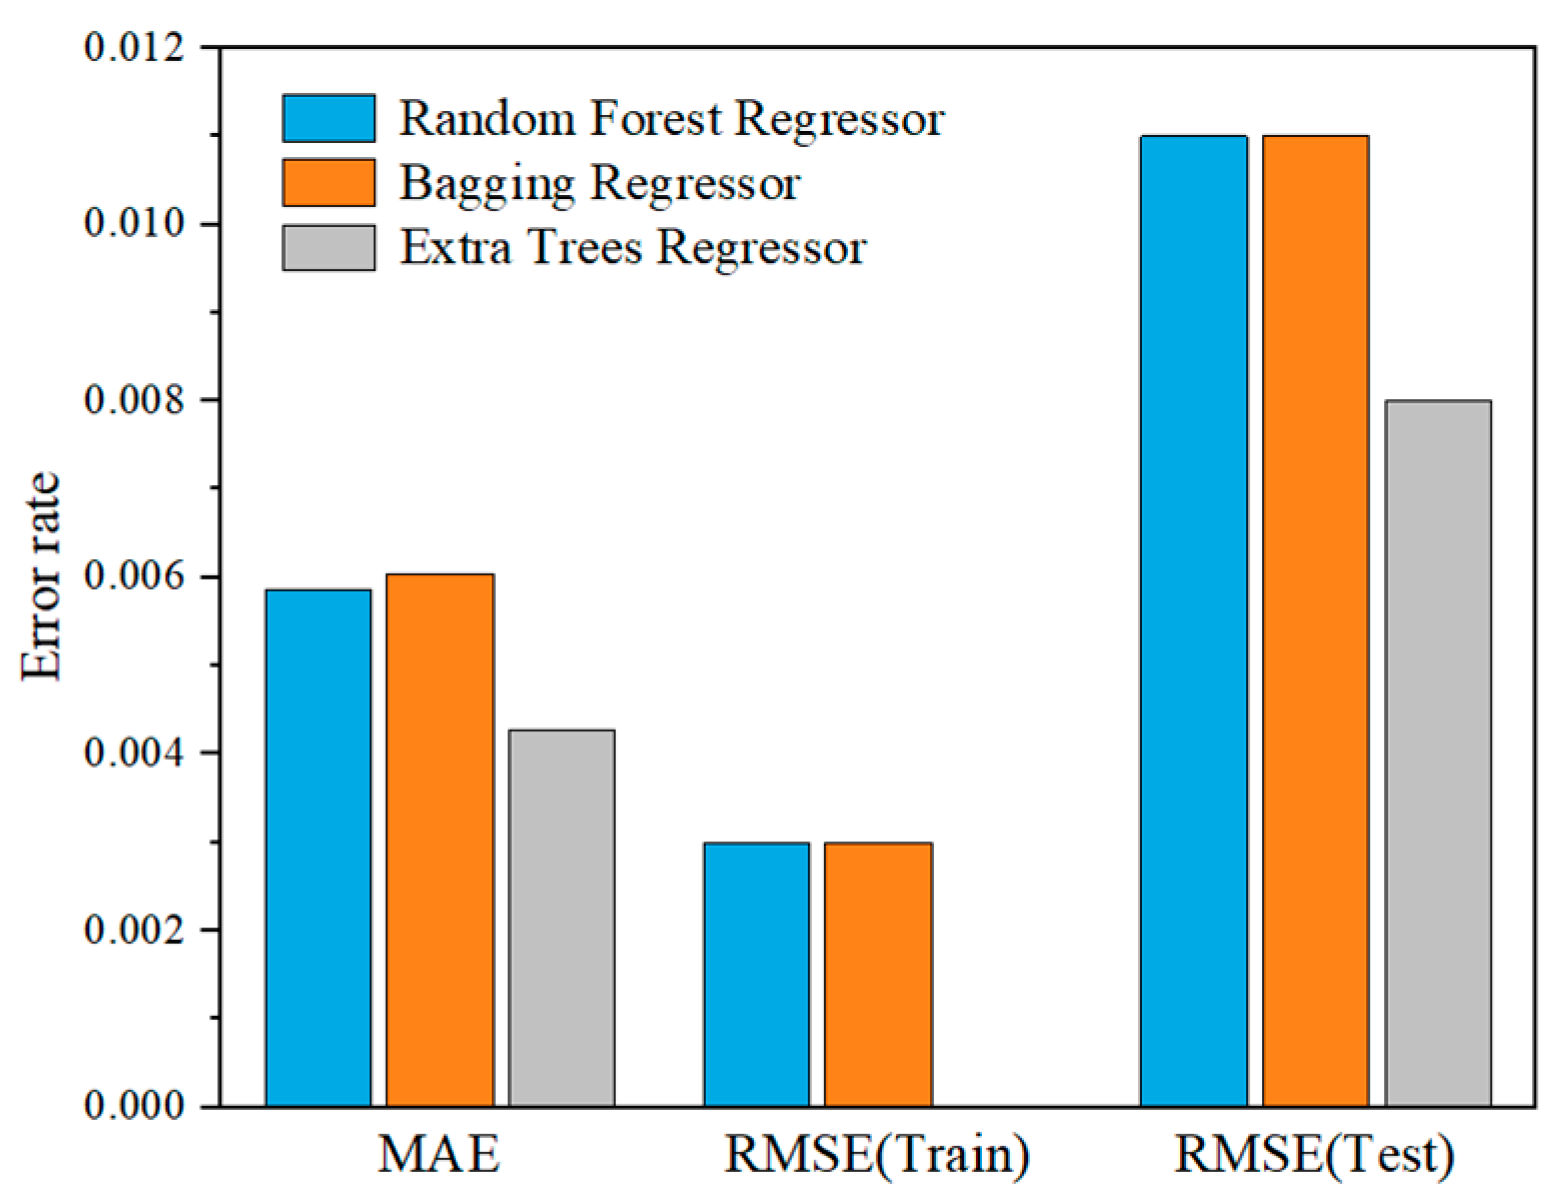
To obtain the optimal ML model for predicting the COF, three ML methods (RFR, BR, and ETR) were built using the Scikit-Learn machine learning library in Python to test the COF dataset. In subsequent analyses of tree ensemble methods, 100 trees were used as the final ensemble model for RFR. Figure 12 displays the predictive performance of the three ML methods in a single random experiment, with 75% of the dataset (blue) and 25% of the dataset (green) used as training and testing sets. The X-axis represents the COF of the experimental data, the Y-axis represents the values predicted by these ML methods, and the deviations from the line X = Y represent the magnitude of prediction errors. To reduce errors, 40 random experiments were conducted, with 25% left for testing. The graphical results of the average MAE and RMSE for the 25% test sets across the 40 experiments are shown in Figure 13.
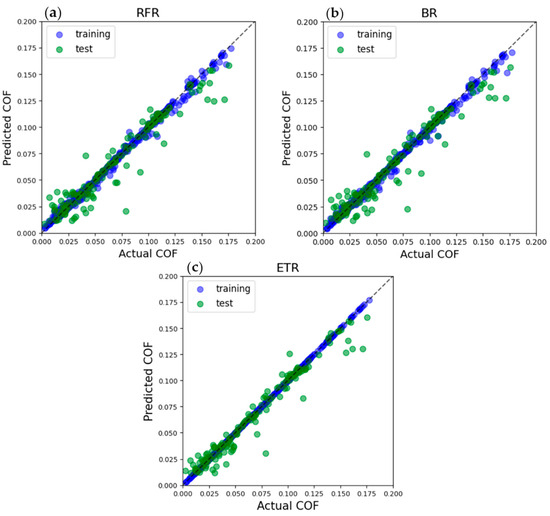
Figure 12.
Actual COF values and values predicted with the (a) RFR, (b) BR, and (c) ETR methods. The color code is as follows: blue, training set = 75%; green, test set = 25%.

Figure 13.
Training and testing errors of different ML models.
The numerical results of MAE, RMSE, and R2 for the models of the three ML methods are presented in Table 4. For the RFR model for predicting COF, the R2 value was 0.93744, with MAE, RMSE (Train), and RMSE (Test) values of 0.00587, 0.003, and 0.011, respectively. The BR model for predicting COF had an R2 value of 0.93398, with corresponding values of 0.00604, 0.003, and 0.011 for MAE, RMSE (Train), and RMSE (Test). The ETR model for predicting COF had an R2 value of 0.9632, with MAE, RMSE (Train), and RMSE (Test) values of 0.00428, 0.000, and 0.008, respectively. These results show that the established models (RFR, BR, and ETD) accurately described the relationships between feature values and target values. Among them, the ETR model had the smallest scheme error and the best predictive accuracy. The ETR model was ultimately selected as the best method for estimating the COF for a piston pump valve plate pair.
4.3. Study on the Importance of Features in Predicting COF
Considering the four input (tribological) features involved in this study, permutation importance was used to determine the importance ranking of features. The feature importance test results for the RFR, BR, and ETR algorithms are shown in Figure 14 and Table 5, where the X-axis represents the feature importance score and the Y-axis represents the feature names. Notably, the overall feature importance followed a similar trend in each of the three datasets (V > F > R > T), with subtle variations observed within these categories. The average contributions of V, F, R, and T to the target prediction were found to be 43.56%, 36.76%, 13.13%, and 6.55%, respectively. V made the largest contribution among the input features, indicating that variations in this feature significantly impacted the frictional wear characteristics of the valve plate friction pair. This study confirms the critical role of V in the material friction process of a valve plate pair, consistent with the experimental analysis results.
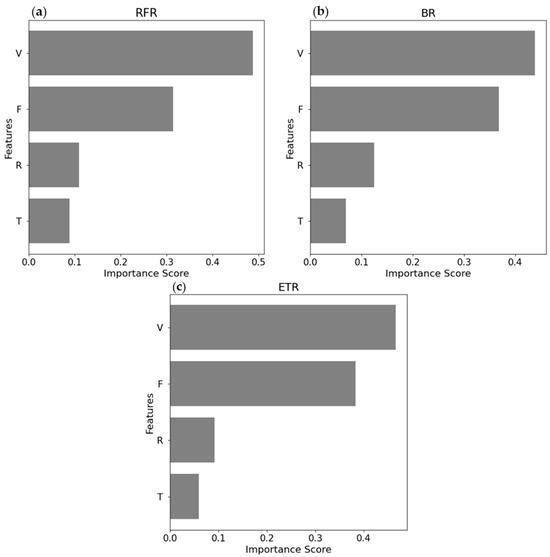
Figure 14.
Ranking of feature importance determined using ML: (a) RFR algorithm, (b) BR algorithm, and (c) ETR algorithm.
Table 5.
Feature importance scores.
4.4. Model Validation and Evaluation
Due to the utilization of multiple explanatory variables in the model, the linear regression (or more accurately, a hyperplane) cannot be visualized in a 2D graph. However, residuals (the differences or vertical distances between actual and predicted values) and their corresponding sample numbers were evaluated through plotting residuals in the regression model. To verify the predictive accuracy of the COF prediction models, as shown in Figure 15, the residual predictions of the test dataset based on three ML methods were plotted. The red dashed lines in the figure respectively represent the residual values equal to 0.02 and −0.02. This aided in detecting non-linearity and outliers while checking whether these errors were randomly distributed. It was observed that for residual values between predicted and actual values, the ETR model’s residuals fluctuated slightly near 0, with fewer outliers deviating from the center. Therefore, a good random distribution error was obtained for the ETR model, indicating that the trained ETR model performed well on the test set without overfitting the training data. It studied the relationship between the inputs and outputs effectively, making the ETR model the best choice for predicting variations in the COF.
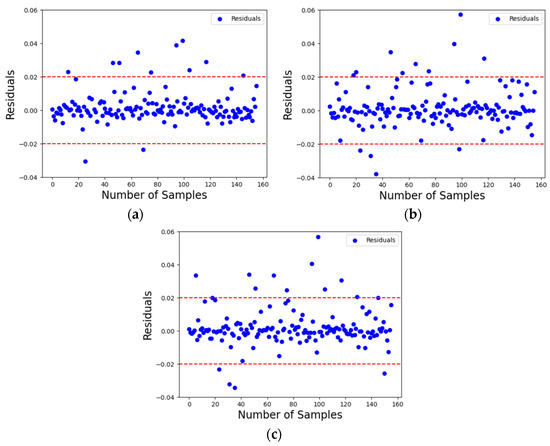
Figure 15.
Residual plot of COF obtained using ML models: (a) residuals of ETR; (b) residuals of RFR; (c) residuals of BR.
5. Conclusions
In this study, the issues of friction and wear during the counter grinding process of a valve plate pair were addressed. A tribological test was established for the materials of the valve plate/cylinder block of an axial piston hydraulic pump. Then, the test data were collected, and the effects of different L and V on COF and wear mechanisms were analyzed, showing the potential presence of two wear modes: abrasive wear and adhesive wear.
- Under constant V but different L conditions and constant L but varying V conditions, as L (or V) increased, COF initially decreased and then increased. After V reached 300 r/min, COF increased significantly. At an L of 120 N and a V of 500 r/min, COF was the lowest, with an average value of 0.019. At an L of 60 N and a V of 300 r/min, COF was relatively small, at 0.026.
- At a V of 300 r/min, abrasive wear was the dominant mechanism under L conditions of 30 N and 60 N, while adhesive wear occurred as V increased under 90 N and 120 N L conditions.
The experimental results indicated that the wear mechanism pattern on the sample’s surface changed with variations in the COF values under different conditions. The friction data were utilized to train RFR, BR, and ETR models for predicting COF, and these ML models’ performances were evaluated on validation and test sets using various metrics. The results showed that the ETR model performed best when predicting COF (MAE of 0.00428, RMSE of 0.08, and R2 value of 0.9632); for COF prediction, the V magnitude was the most critical parameter. Thus, the ETR model was the most suitable for predicting the COF of valve plate pair materials in piston pumps. Data-driven machine learning can serve as a valuable tool for studying COF in the valve plate pairs of piston pumps, providing a reference for evaluating wear mechanisms in valve plate pairs. Our future research will delve into a wider range of operating conditions and conduct experiments on piston pump valve plate pair materials with a wider range of parameters such as L, V, R, etc., to analyze and predict their tribological performance. This research is expected to accelerate the development of wear-resistant materials for valve plate pairs.
Author Contributions
Conceptualization and methodology, Y.W., R.N. and Y.L.; software and validation, Y.W. and R.N.; investigation, Y.W. and S.W.; writing—original draft preparation, Y.W. and Y.L.; writing—review and editing, Y.W., R.N., X.L., S.W. and Y.L.; supervision, R.N. and Y.L.; funding acquisition, R.N. and X.L. All authors have read and agreed to the published version of the manuscript.
Funding
This research was funded by the National Natural Science Foundation of China [Grant No. 52105062] and the NIT Natural Science Foundation [Grant No. NBQN202106002].
Data Availability Statement
The data will be made available upon request.
Acknowledgments
The authors gratefully acknowledge the test equipment and support provided by Ningbo Institute of Technology, Beihang University.
Conflicts of Interest
The authors declare no conflicts of interest.
References
- Ye, S.; Zhang, J.; Xu, B.; Hou, L.; Xiang, J.; Tang, H. A Theoretical Dynamic Model to Study the Vibration Response Characteristics of an Axial Piston Pump. Mech. Syst. Signal Process. 2021, 150, 107237. [Google Scholar] [CrossRef]
- Chen, Y.; Zhang, J.; Xu, B.; Chao, Q.; Liu, G. Multi-Objective Optimization of Micron-Scale Surface Textures for the Cylinder/Valve Plate Interface in Axial Piston Pumps. Tribol. Int. 2019, 138, 316–329. [Google Scholar] [CrossRef]
- Chao, Q.; Shao, Y.; Liu, C.; Zhao, J. New analytical leakage models for tribological interfaces in axial piston pumps. P. I. Mech. Eng. C-J. Mec. 2023, 237, 4581–4592. [Google Scholar] [CrossRef]
- Hu, M. Study on Power Losses and Design Technology for the Surface Topography of Friction Pairs of Axial Piston Pump. Ph.D. Thesis, Zhejiang University, Hangzhou, China, 2017. [Google Scholar]
- Huang, J.; Yan, Z.; Quan, L.; Gao, Y. Characteristics of delivery pressure in the axial piston pump with combination of variable displacement and variable speed. P. I. Mech. Eng. I-J. Sys. 2015, 229, 599–613. [Google Scholar] [CrossRef]
- Mong, G.; Nafz, T. Swash Plate Pumps the Key to the Future. In Proceedings of the 10th International Fluid Power Conference, Dresden, Germany, 8–10 March 2016. [Google Scholar]
- Ou, X.; Wang, T.; Fang, X. Research Status of the High Speed Aircraft Piston Pump. Chin. Hydraul. Pneum. 2018, 2, 1–8. [Google Scholar]
- Chen, J.; Li, Y.; Miao, L.; Huang, J. Research of High Pressure and High Speed Hydraulic Pump for Civil Aircraft. J. Hydraul. Pneum. Seals 2019, 39, 32–35. [Google Scholar]
- Guo, S.; Chen, J.; Lu, Y.; Wang, Y.; Dong, H. Hydraulic Piston Pump in Civil Aircraft: Current Status, Future Directions and Critical Technologies. J. Chin. J. Aeronaut. 2019, 33, 16–30. [Google Scholar] [CrossRef]
- Wang, Z.; Wu, Y.; Huang, J. A study on the high–speed tribological performance of port plates in axial piston pumps. Chin. Hydraul. Pneum. 2019, 8, 27–32. (In Chinese) [Google Scholar]
- Schenk, A. Predicting Lubrication Performance between the Slipper and Swashplate in Axial Piston Hydraulic Machines. Ph.D. Thesis, Purdue University, West Lafayette, IN, USA, 2014. [Google Scholar]
- Zhang, J.; Chen, Y.; Xu, B.; Chao, Q.; Zhu, Y.; Huang, X. Effect of surface texture on wear reduction of the tilting cylinder and the valve plate for a high–speed electro–hydrostatic actuator pump. Wear 2018, 414, 68–78. [Google Scholar] [CrossRef]
- Jiao, W.; Liu, W.; Zhu, Z.; Xia, Y.; Ma, H.; Xia, S. Effect of Loading Pressure on Tribological Properties for Valve Plate Pair during the Running-In Process. Tribol. Trans. 2024, 67, 247–258. [Google Scholar] [CrossRef]
- Huang, J.; Dong, Z.; Wang, Z.; Niu, L. Tribological Properties of Cylinder Block/Valve Plate Interface of Axial Piston Pump on the Tribometer. Chin. J. Mech. Eng. 2021, 34, 122–138. [Google Scholar] [CrossRef]
- Li, S.; Bao, S.; Yang, P.; Li, Y. Experimental Study on Wear of Friction Pair Materials of Axial Piston Pump Valve Plate. J. Hydraul. Pneum. Seals 2021, 41, 1–3+8. [Google Scholar]
- Fu, J.; Lyu, D.; Kang, J.; Li, Y.; Zhao, J. Tribological characteristics of hard-to-hard matching materials of cylinder block/valve plate interface in electro-hydrostatic actuator pumps. P. I. Mech. Eng. C-J. Mec. 2024, 238, 2393–2406. [Google Scholar] [CrossRef]
- Huang, J.; Zhang, Q.; Zhou, W.; Wang, T. Study on wear characteristics of friction pair in high pressure and high-speed axial piston pump. In Proceedings of the CSAA/IET International Conference on Aircraft Utility Systems, Nanchang, China, 17–20 August 2022. [Google Scholar]
- Milojević, S.; Savić, S.; Marić, D.; Stopka, O.; Krstić, B.; Stojanović, B. Correlation between emission and combustion characteristics with the compression ratio and fuel injection timing in tribologically optimized diesel engine. Tehnički Vjesnik 2022, 29, 1210–1219. [Google Scholar]
- Xu, L.; Lu, Y.; Liu, Q.; Lin, L.; Mu, J. Experimental study on frictional pairs of piston pumps. J. Fail. Anal. Prev. 2022, 22, 738–749. [Google Scholar] [CrossRef]
- Ren, X.; Zhang, G.; Xu, H.; Sun, F.; Kang, Y.; Wang, M.; Niu, J. Research on Wear Resistance of ZCuPb20Sn5 Alloy. J. Tribol. 2020, 40, 467–476. [Google Scholar]
- Nosonovsky, M.; Aglikov, A. Triboinformatics: Machine learning methods for frictional instabilities. In Proceedings of the International Workshop “Interplay of Mechanics, Tribology, and Materials Science”, Samarkand, Uzbekistan, 4–6 September 2023. [Google Scholar]
- Carleo, G.; Cirac, I.; Cranmer, K.; Daudet, L.; Schuld, M.; Tishby, N.; Vogt-Maranto, L.; Zdeborová, L. Machine learning and the physical sciences. Rev. Mod. Phys. 2019, 91, 045002. [Google Scholar] [CrossRef]
- Biehl, M.; Mietzner, A. Statistical mechanics of unsupervised learning. Europhys. Lett. 1993, 24, 421. [Google Scholar] [CrossRef]
- Hasan, M.; Nosonovsky, M. Triboinformatics: Machine learning algorithms and data topology methods for tribology. Surf. Innov. 2022, 10, 229–242. [Google Scholar] [CrossRef]
- Monareng, K.; Maphanga, R.; Ntoahae, P. Machine learning models for predicting density of sodium-ion battery materials. In Proceedings of the MATEC Web of Conferences, Cape Town, South Africa, 15 December 2023. [Google Scholar]
- Kordijazi, A.; Roshan, H.; Dhingra, A.; Povolo, M.; Rohatgi, P.; Nosonovsky, M. Machine-learning methods to predict the wetting properties of iron-based composites. Surf. Innov. 2020, 9, 111–119. [Google Scholar] [CrossRef]
- Prasanth, I.; Jeevanandam, P.; Selvaraju, P.; Sathish, K.; Hasane Ahammad, S.; Sujatha, P.; Kaarthik, M.; Mayakannan, S.; Sasikumar, B. Study of friction and wear behavior of graphene-reinforced AA7075 nanocomposites by machine learning. J. Nanomater. 2023, 2023, 15. [Google Scholar] [CrossRef]
- Kolev, M.; Drenchev, L.; Petkov, V. Fabrication, experimental investigation and prediction of wear behavior of open-cell AlSi10Mg-SiC composite materials. Metals 2023, 13, 814. [Google Scholar] [CrossRef]
- Verma, S.; Misra, J.; Popli, D. Modeling of friction stir welding of aviation grade aluminium alloy using machine learning approaches. Int. J. Model. Simul. 2022, 42, 1–8. [Google Scholar] [CrossRef]
- Naderpour, H.; Rafiean, A.; Fakharian, P. Compressive strength prediction of environmentally friendly concrete using artificial neural networks. J. Build. Eng. 2018, 16, 213–219. [Google Scholar] [CrossRef]
- Shen, K. Study on Friction and Wear Performance of Copper/Graphene Composite Materials Based on Machine Learning. Master’s Thesis, Donghua University, Shanghai, China, 2023. [Google Scholar]
- Pedregosa, F.; Varoquaux, G.; Gramfort, A.; Michel, V.; Thirion, B.; Grisel, O.; Blondel, M.; Prettenhofer, P.; Weiss, R.; Duchesnay, É. Scikit-learn: Machine Learning in Python. J. Mach. Learn. Res. 2011, 12, 2825–2830. [Google Scholar]
- Tiwari, D.; Agarwal, S.; Singh, S. Bagging Regressor with XGBoost Regressor as Base Estimator for Predictions in Indian Power-Energy Trading Market. In Proceedings of the 15th International Conference on Science, Technology and Management, New Delhi, India, 25 June 2023. [Google Scholar]
- Polamuri, S.; Srinivas, K.; Mohan, A.K. Stock market prices prediction using random forest and extra tree regression. Int. J. Recent Technol. Eng. 2019, 8, 1224–1228. [Google Scholar] [CrossRef]
- Aziz, T.; Camana, M.; Garcia, C.; Hwang, T.; Koo, I. REM-Based Indoor Localization with an Extra-Trees Regressor. Electronics 2023, 12, 4350. [Google Scholar] [CrossRef]
- Géron, A. Hands-on Machine Learning with Scikit-Learn and TensorFlow Concepts, Tools, and Techniques to Build Intelligent Systems, 1st ed.; O’Reilly Media, Inc.: Sevastopol, CA, USA, 2017. [Google Scholar]
- LeCun, Y.; Bengio, Y.; Hinton, G. Deep learning. Nature 2015, 521, 436–444. [Google Scholar] [CrossRef]
- Kristipadu, R.T.; Lawrence, D. Development of machine learning based predictive analytical models for the surface interaction studies of tribological pairs. In AIP Conference Proceedings; AIP Publishing: New York, NY, USA, 2021; Volume 2336, pp. 1–10. [Google Scholar]
- Schneider, P.; Xhafa, F. Anomaly detection classification and CEP with ML methods. In Anomaly Detection and Complex Event Processing over IoT Data Streams; Academic Press: Cambridge, MA, USA, 2022; pp. 193–233. [Google Scholar]
- Ahmad, M.; Mourshed, M.; Rezgui, Y. Trees vs neurons: Comparison between random forest and ANN for high-resolution prediction of building energy consumption. Energy Build. 2017, 147, 77–89. [Google Scholar] [CrossRef]
- Klemme, F.; Amrouch, H. Scalable machine learning to estimate the impact of aging on circuits under workload dependency. IEEE Trans. Circuits Syst. Regul. Pap. 2022, 69, 2142–2155. [Google Scholar] [CrossRef]
- Parmar, J.; Patel, S.K.; Katkar, V.; Natesan, A. Graphene-based refractive index sensor using machine learning for detection of mycobacterium tuberculosis bacteria. IEEE Trans. Nanobiosci. 2022, 22, 92–98. [Google Scholar] [CrossRef] [PubMed]
- Abbas, A.; Huang, S.; Ballóková, B.; Sülleiová, K. Tribological effects of carbon nanotubes on magnesium alloy AZ31 and analyzing aging effects on CNTs/AZ31 composites fabricated by stir casting process. Tribol. Int. 2020, 142, 105982. [Google Scholar] [CrossRef]
- Aydin, F.; Sun, Y.; Emre, M. Influence of TiC content on mechanical, wear and corrosion properties of hot-pressed AZ91/TiC composites. J. Compos. Mater. 2020, 54, 141–152. [Google Scholar] [CrossRef]
- Aydin, F.; Sun, Y.; Emre, M. The effect of TiB2 content on wear and mechanical behavior of AZ91magnesium matrix composites produced by powder metallurgy. Powder Metall. Met. Ceram. 2019, 57, 564–572. [Google Scholar] [CrossRef]
- Nguyen, Q.; Sim, Y.; Gupta, M.; Lim, C. Tribology characteristics of magnesium alloy AZ31B and its composites. Tribol. Int. 2015, 82, 464–471. [Google Scholar] [CrossRef]
- Hu, C.; Wan, X.; Wu, K.; Xu, D.; Li, G.; Xu, G.; Misra, R. On the impacts of grain refinement and strain-induced deformation on three-body abrasive wear responses of 18Cr–8Ni austenitic stainless steel. Wear 2020, 446, 203181. [Google Scholar] [CrossRef]


Disclaimer/Publisher’s Note: The statements, opinions and data contained in all publications are solely those of the individual author(s) and contributor(s) and not of MDPI and/or the editor(s). MDPI and/or the editor(s) disclaim responsibility for any injury to people or property resulting from any ideas, methods, instructions or products referred to in the content. |
© 2024 by the authors. Licensee MDPI, Basel, Switzerland. This article is an open access article distributed under the terms and conditions of the Creative Commons Attribution (CC BY) license (https://creativecommons.org/licenses/by/4.0/).