Article

The Initial Assessment of the Possibility of Simulation Fire Standard Curve in the Electric Furnace with the Assessment of Chemical Composition Changes in Steel after Cooling Phase

1
Faculty of Civil Engineering and Architecture, Kielce University of Technology, al. Tysiąclecia PP 7, 25-314 Kielce, Poland
2
PPHU Suckert, 25-019 Kielce, Poland
*
Author to whom correspondence should be addressed.
Metals 2024, 14(6), 707; https://doi.org/10.3390/met14060707
Submission received: 21 March 2024 / Revised: 17 May 2024 / Accepted: 25 May 2024 / Published: 14 June 2024
(This article belongs to the Section Structural Integrity of Metals)

Abstract

:
The article focuses on analyzing changes in the chemical composition of steel samples after the cooling phase. A few distinct types of samples made of St3S steel were heated in an electric resistance furnace for 1 h. The temperature in the following minutes of the furnace work was programmed to reflect the standard fire curve defined in the Eurocode in the best possible way. The box-type electric furnace was used. There were three series of samples, and each of them was cooled down in diverse ways: (a) in the water, (b) in the polymer cooling medium AQUA-QUENCH® 320, and (c) in the furnace. After that, the chemical composition of diverse types of samples with various kinds of cooling was checked. This task was realized using a laser elementary analysis microscope with the EA-300 head. The investigation allowed the authors to draw the following conclusions: the electric furnace may be used to simulate an increase in temperature with fire duration according to standard fire curve only in the phase of fully developed fire situation; the EA-300 head for laser elementary analysis allows checking of the chemical composition of investigated elements very quickly (in a few seconds).

1. Introduction

A fire situation is one of the most essential critical cases when designing structures, including steel structures. Recommendations for calculating structures exposed to fire are included in codes, for instance, in [1]. Fire tests are an alternative to design by calculation, as mentioned by the code. Of course, laboratory tests can be expensive, and the purchase and exploitation of a furnace have the most significant impact on the cost, energy consumption, and carbon footprint, especially in the case of the most commonly used gas furnaces. The paper’s authors decided to perform a preliminary test in a fire situation using an electric furnace instead of a gas-fired furnace. The authors are also aware that a temperature change rate in the electric furnace may be inadequate to fully reproduce a standard fire curve according to ISO (International Organization for Standardization) [2], even if the dimensions of the furnace are relatively small. A particularly problematic issue is the reconstruction of the initial phase of fire, which is described by a standard fire curve, where rapid temperature increase appears. To overcome this problem, the authors programmed the curve in such a way as to fit the standard curve from a temperature of approximately 700 °C (which corresponds to 12 min after the start of the fire). The fire test was performed on short steel sections in three series, which differed in cooling down the specimens (in water, in polymer, and freely in air). The main goals of the test are as follows:
  • Assessment of the possibility of using an electric furnace for more advanced research (mechanical properties of steel, microstructural changes, nonstandard fire curves).
  • Assessment of chemical composition changes of steel after cooling phase.
  • Assessment of the influence of the sample cooling method and rate on the experiment results.
Usually, gas furnaces are used for fire tests. However, few laboratory tests have been conducted on the use of electric furnaces. Yu et al. [3] performed tests combined with numerical investigations which concerned flush end plate connections in steel structures. No information about the temperature–time dependency was given, and the paper focused on the force–rotation relationship depending on temperature. Wang et al. [4] also used an electric furnace and presented temperature history of specimens. The ISO standard curve was also programmed in their research. The electric furnace was cylindrical and had a maximum heating length of 150 mm. The research team investigated a few interesting issues, such as creep strain, residual stress in welds, local buckling, and the behavior of steel columns after fire exposure. Liu et al. [5] used a cylindrical electric furnace to assess the post-fire mechanical properties of steel using the Leeb hardness method. The maximal temperature in the test was 600 °C, significantly lower than values obtained according to the standard curve after 60 min of fire exposure. Król and Wachowski [6] also used an electric furnace but did not provide detailed information about the heating process. On the other hand, they analyzed a few prominent issues, such as the microstructural analysis of samples heated in different temperatures and the correlation between hardness and residual tensile strength. To sum up, all the laboratory tests mentioned above using an electric furnace raised critical scientific issues. Nevertheless, the cited research points to some drawbacks and limitations. Their authors did not analyze the influence of the time–temperature relationship on obtained results, nor was the heating length restricted if the standard curve was well reproduced [4]. It would be interesting to investigate the behavior of specimens entirely wholly placed in the furnace and to program the standard curve as precisely as possible. This is exactly what the authors of this paper try to realize in the presented research.
On the other hand, more studies involve gas furnaces or both gas and electric ones. Almand [7] issued a scientific report on experimental research of structure fire resistance. The tests were performed using a custom-built 8 × 3 m large gas-fired furnace. The furnace could heat air inside it to 950 °C after 25 min, proving the high efficiency of gas furnaces—Hasburgh et al. [8] simulated fire conditions in a natural gas furnace. The test was performed on cross-laminated timber structures, and the furnace was programmed with three real compartment fire curves (obtained as a result of previous full-scale fire tests) compared to the standard curve. Molkens et al. [9,10] investigated the post-fire performance of stainless and carbon steel. The team used gas-fired and electric furnaces and established steel retention factors and stress–strain relationships in different temperatures. Radzi et al. [11] also employed a few other heating devices: gas burners, electric furnaces, and ceramic pads. They tested beam-to-column connections. As one of the challenges, they evoked real fire–temperature curves compared to the standard fire curve and claimed that the second one has little resemblance to the actual fire–temperature–time relationship, so the nonstandard curves should be used. Bisby et al. [12] extensively reviewed large-scale nonstandard fire testing, listing electric furnaces. At that time, electrical resistance heaters were considered “unique”; only a few examples were mentioned in the paper.
As we can see, there is still a lot to do in the field of research on electric furnaces. The most critical issues concern the mechanical properties of steel under fire conditions, which were investigated many times by various scientists, for instance, by Winful et al. [13] or even combined with investigations of microstructure changes, as presented by Maraveas et al. [14]. Also, cooling episodes, rates, and ways of cooling (in the air or a water bath) can have a significant influence on steel [15] and concrete [16] properties in the post-fire stage. Laboratory tests can be successfully combined with numerical simulations with the use of the advanced finite element method (FEM). Not only can structural members under fire conditions be simulated, as shown in [17], but a furnace can also be modeled using FEM, which was presented by Cabova et al. [18].
Another critical problem connected with steel structures in a fire situation is decreased mechanical properties at elevated temperatures. Although Eurocodes give some information about a reduction in yield strength and modulus of elasticity in increasing temperature, they are limited to typical kinds of steel. Furthermore, these codes do not consider a cooling phase. This exciting approach is presented in [19], where authors presented the results obtained using machine learning (ML) algorithms to predict the mechanical properties, including ultimate tensile strength, yield strength, 0.2% proof strength, and elastic modulus, of high-strength steel plate material at elevated temperatures. Some works [20,21] investigated the mechanical properties of steel during the entire fire process, i.e., the heating and cooling phases.
During steel exposition at elevated temperatures, some phase transitions occur, which results in a decrease in mechanical properties, but the chemical composition of the material is the same. The authors of the article expect similar effects during the cooling phase. Nevertheless, it is worth knowing the chemical composition of samples before fire tests because the specimens may not be made of a “pure” kind of steel. It is known that the chemical composition has a tremendously profound influence on the mechanical properties of steel, which can be either problematic or can be used to develop fire resistance, as indicated in [22]. A modern approach to establishing the chemical composition of steel is a hybrid method involving artificial neural networks (ANNs), presented in [23].
The results presented in this paper indicate that using the electric furnace can be an effective and less expensive way to perform laboratory research on structures in fire conditions. Moreover, there is no notable change in the chemical composition of the specimens after the fire test. The results provide a good base for the authors’ future work, especially regarding structural design combined with laboratory fire tests of structural members. There are also perspectives to reduce costs, energy, and carbon footprint during laboratory tests, which is one of the most essential and vital issues in contemporary civil engineering [24,25], accompanied by improving the sustainability of structures [26].
Table 1 summarizes the literature review. References [1,2] are omitted because they are the Eurocodes.

2. Materials and Methods

The authors performed the laboratory test in the presented paper using 2 types of S235 steel samples. The first was an I-section covered with protective paint, and the second was an SHS (square hollow section) section with no cover.
The main aim of the research was to simulate fire, as described by the fire standard curve [2], using an electric furnace and examine the chemical composition of samples before heating and after diverse types of cooling.

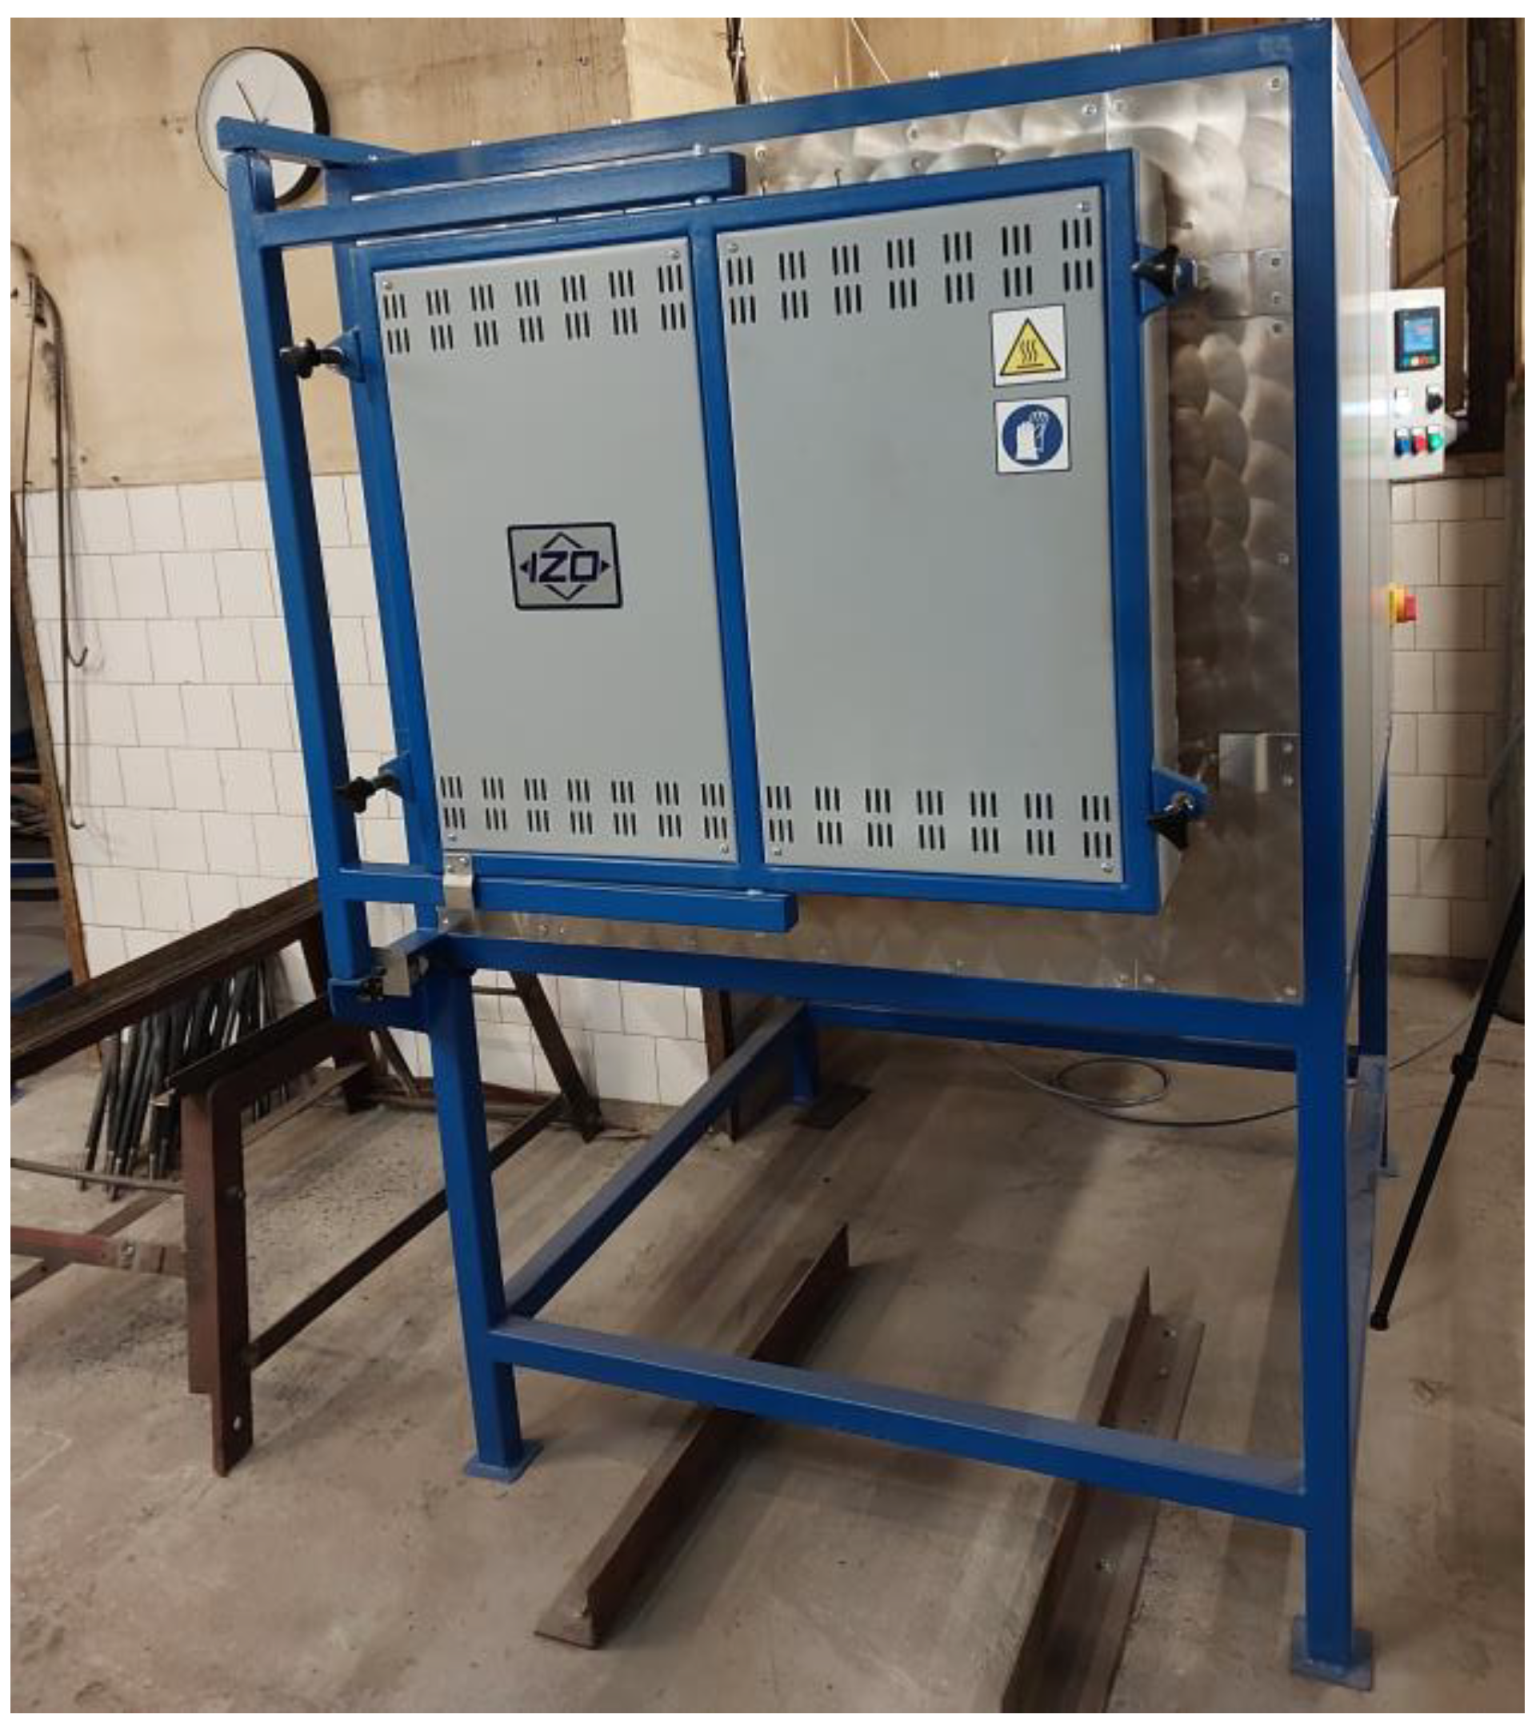
2.1. Characterization and Preparation of the Furnace

The resistance chamber furnace (type IZO-2.H, produced by IZO company, Bytom, Poland) was used to simulate the increase in temperature gas according to PN-EN-1-1-2 [2]. The device (Figure 1) is the property of the PPHU Suckert company (Kielce, Poland), represented by Tomasz and Mariusz Suckert. The main characteristics of the furnace are presented in Table 2.
The furnace used to perform the test can be programmed by giving points with two coordinates: time and temperature. The accurate simulation of fire in electrical furnaces is impossible because achieving rapid growth in the first fire phase is impossible. Figure 2 shows two fire curves: (1) the EC standard curve and (2) the curve programmed for the furnace work. It is easy to notice the skipped initial phase of fire. The individual programmed points are presented in Table 3.
To omit the initial phase, the furnace was warmed up to 750 °C, and the following samples were placed inside. During the 60-minute heating of each series, the temperature inside the furnace was displayed on the control panel, which was continuously recorded to enable the authors to plot the obtained temperature curve. The control panel with the recording device is presented in Figure 3.
The device presented in Figure 4 placed each series of samples into and removed them from the furnace in a special basket.

2.2. The Methods of Samples Cooling

In the research, three series of samples were examined. Then, each of them was cooled in diverse ways:
  • In water;
  • In the furnace;
  • In water mixed with the particular unique polymer AQUA-QUENCH® 320, produced by Quaker Houghton Cracow, Poland (intensity: 11%).
In the first case, the samples were directly placed into the bath with water after withdrawing from the furnace with the steel basket for a few minutes.
The samples cooled in the furnace and remained there after the entire program. The furnace was turned off, and the samples were withdrawn after two days.
Cooling in water with polymer was conducted similarly to cooling in water. The main properties of the polymer are presented in Figure 5 and Table 4. AQUA-QUENCH® 320 is originally the polymer quenchant dedicated to quenching, and has characteristics similar to the oil. This polymer has to be diluted in the water with a minimum intensity of 10% and a maximum intensity of 35%. Moreover, AQUA-QUENCH® 320 does not contain chemical substances (diethanolamine, boron, and biocides) that could release formaldehyde. The mentioned characteristic causes the solution of AQUA-QUENCH® 320 to be safe for the user and does not cause chemical reactions in cooled samples, which was confirmed in the presented paper—no reaction product was identified.
AQUA-QUENCH is a polymer based on polyvinylpyrrolidone (PVP). Its lower cooling rate during martensitic transformation in the critical temperature range minimizes the risk of cracks and deformations. AQUA-QUENCH is usually used in concentrations of 10–35%. In the presented research, it was 11%.

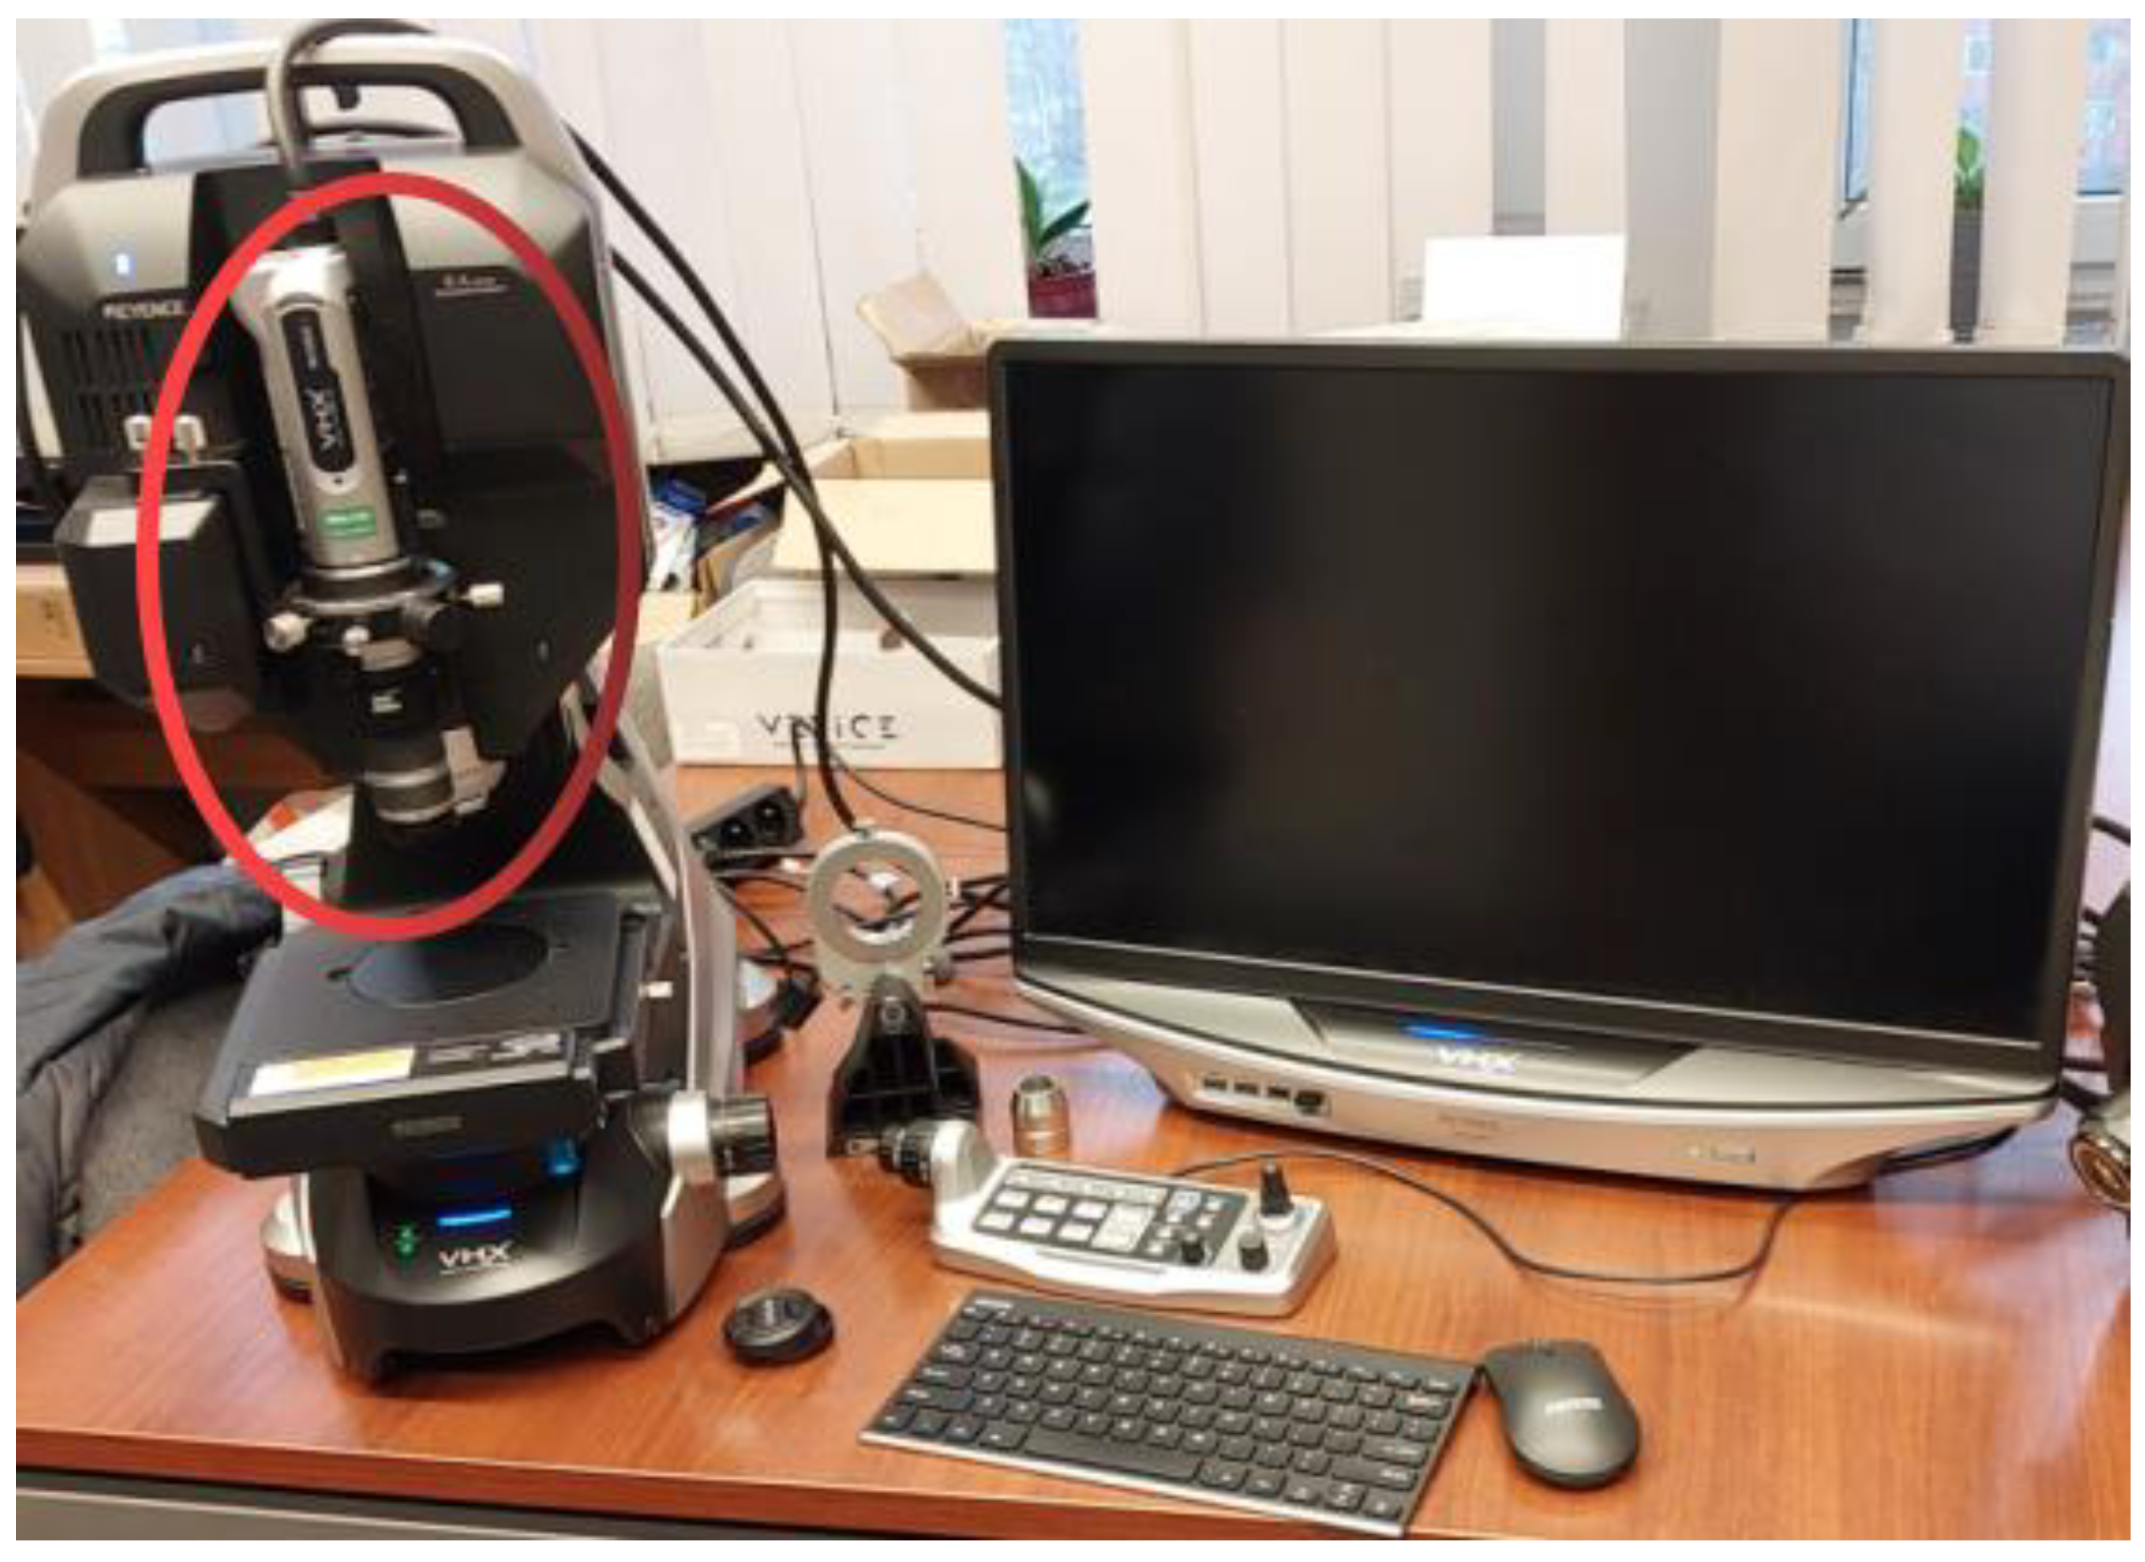
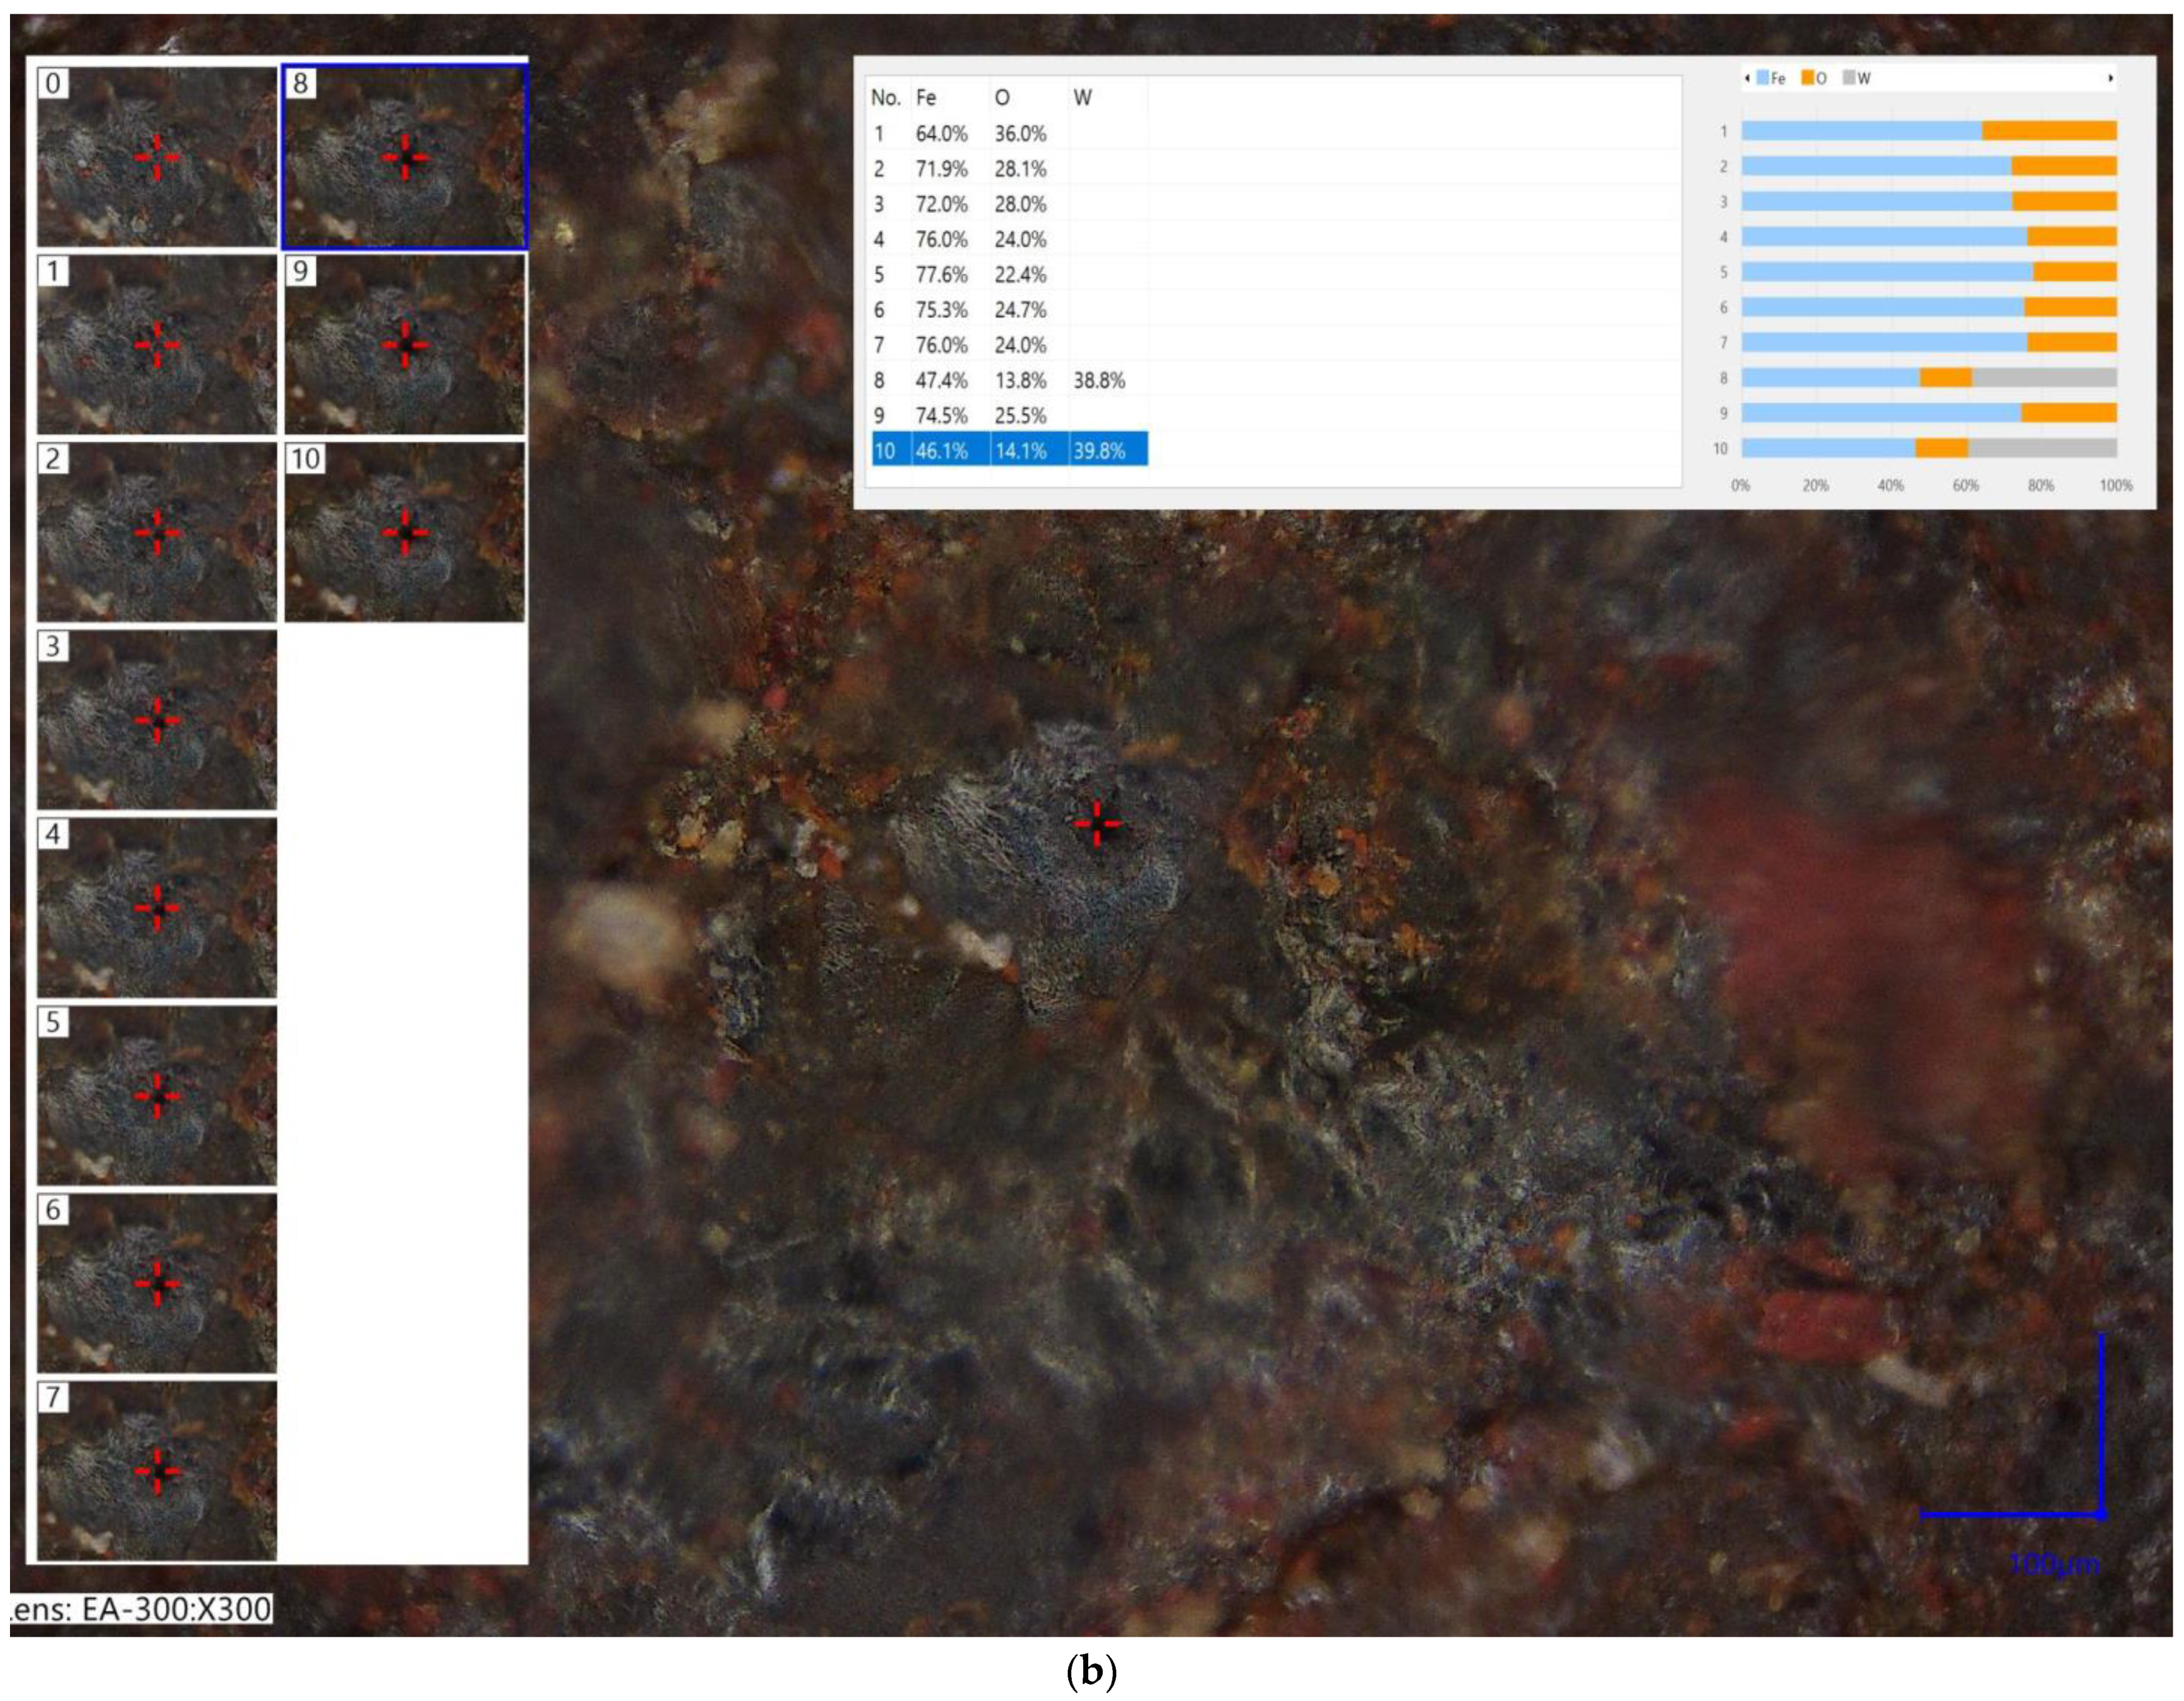
2.3. The Investigation of the Chemical Component of Samples

This test was conducted using a microscope with a head-to-laser elementary analysis type EA-300 [27], developed by KEYENCE located in Warsaw, Poland. This device operates based on LIBS (laser-induced breakdown spectroscopy) technology. It is an analytical technique used to determine the elemental composition of materials. Handheld LIBS analyzers use a highly focused laser to ablate the surface of a sample. Electronically excited atoms and ions form a plasma. As these atoms decay back into their ground states, they emit characteristic wavelengths of light, or “unique fingerprints”. These “fingerprints” are distinct for each element, making handheld LIBS analysis an excellent tool for quantitative and qualitative measurements. [28]
The EA-300 device is equipped with a broadband spectrometer with high resolution (from the deep UV to the near-infrared) and can determine the color of emitted light.
The device’s internal base contains thousands of compounds and materials. Therefore, it can quickly suggest elements and the most probable name of a substance.
It is possible to conduct the identification of elements and materials in two ways:
  • Multipoint analysis—This method allows multiple localizations to be examined simultaneously, which is especially convenient when examining both basic materials components and foreign particles.
  • Multilayer analysis—Thanks to constant laser exposure and drilling, analyzing the layers beneath the surface is possible.
In the presented article, both methods were used.
Figure 6 presents the equipment used to conduct the chemical composition analysis. The EA-300 device is marked in red.

3. Results

The main results from the performed research are divided into two sections: the first concerns a fire simulation, and the second presents the outcomes from chemical composition analysis.

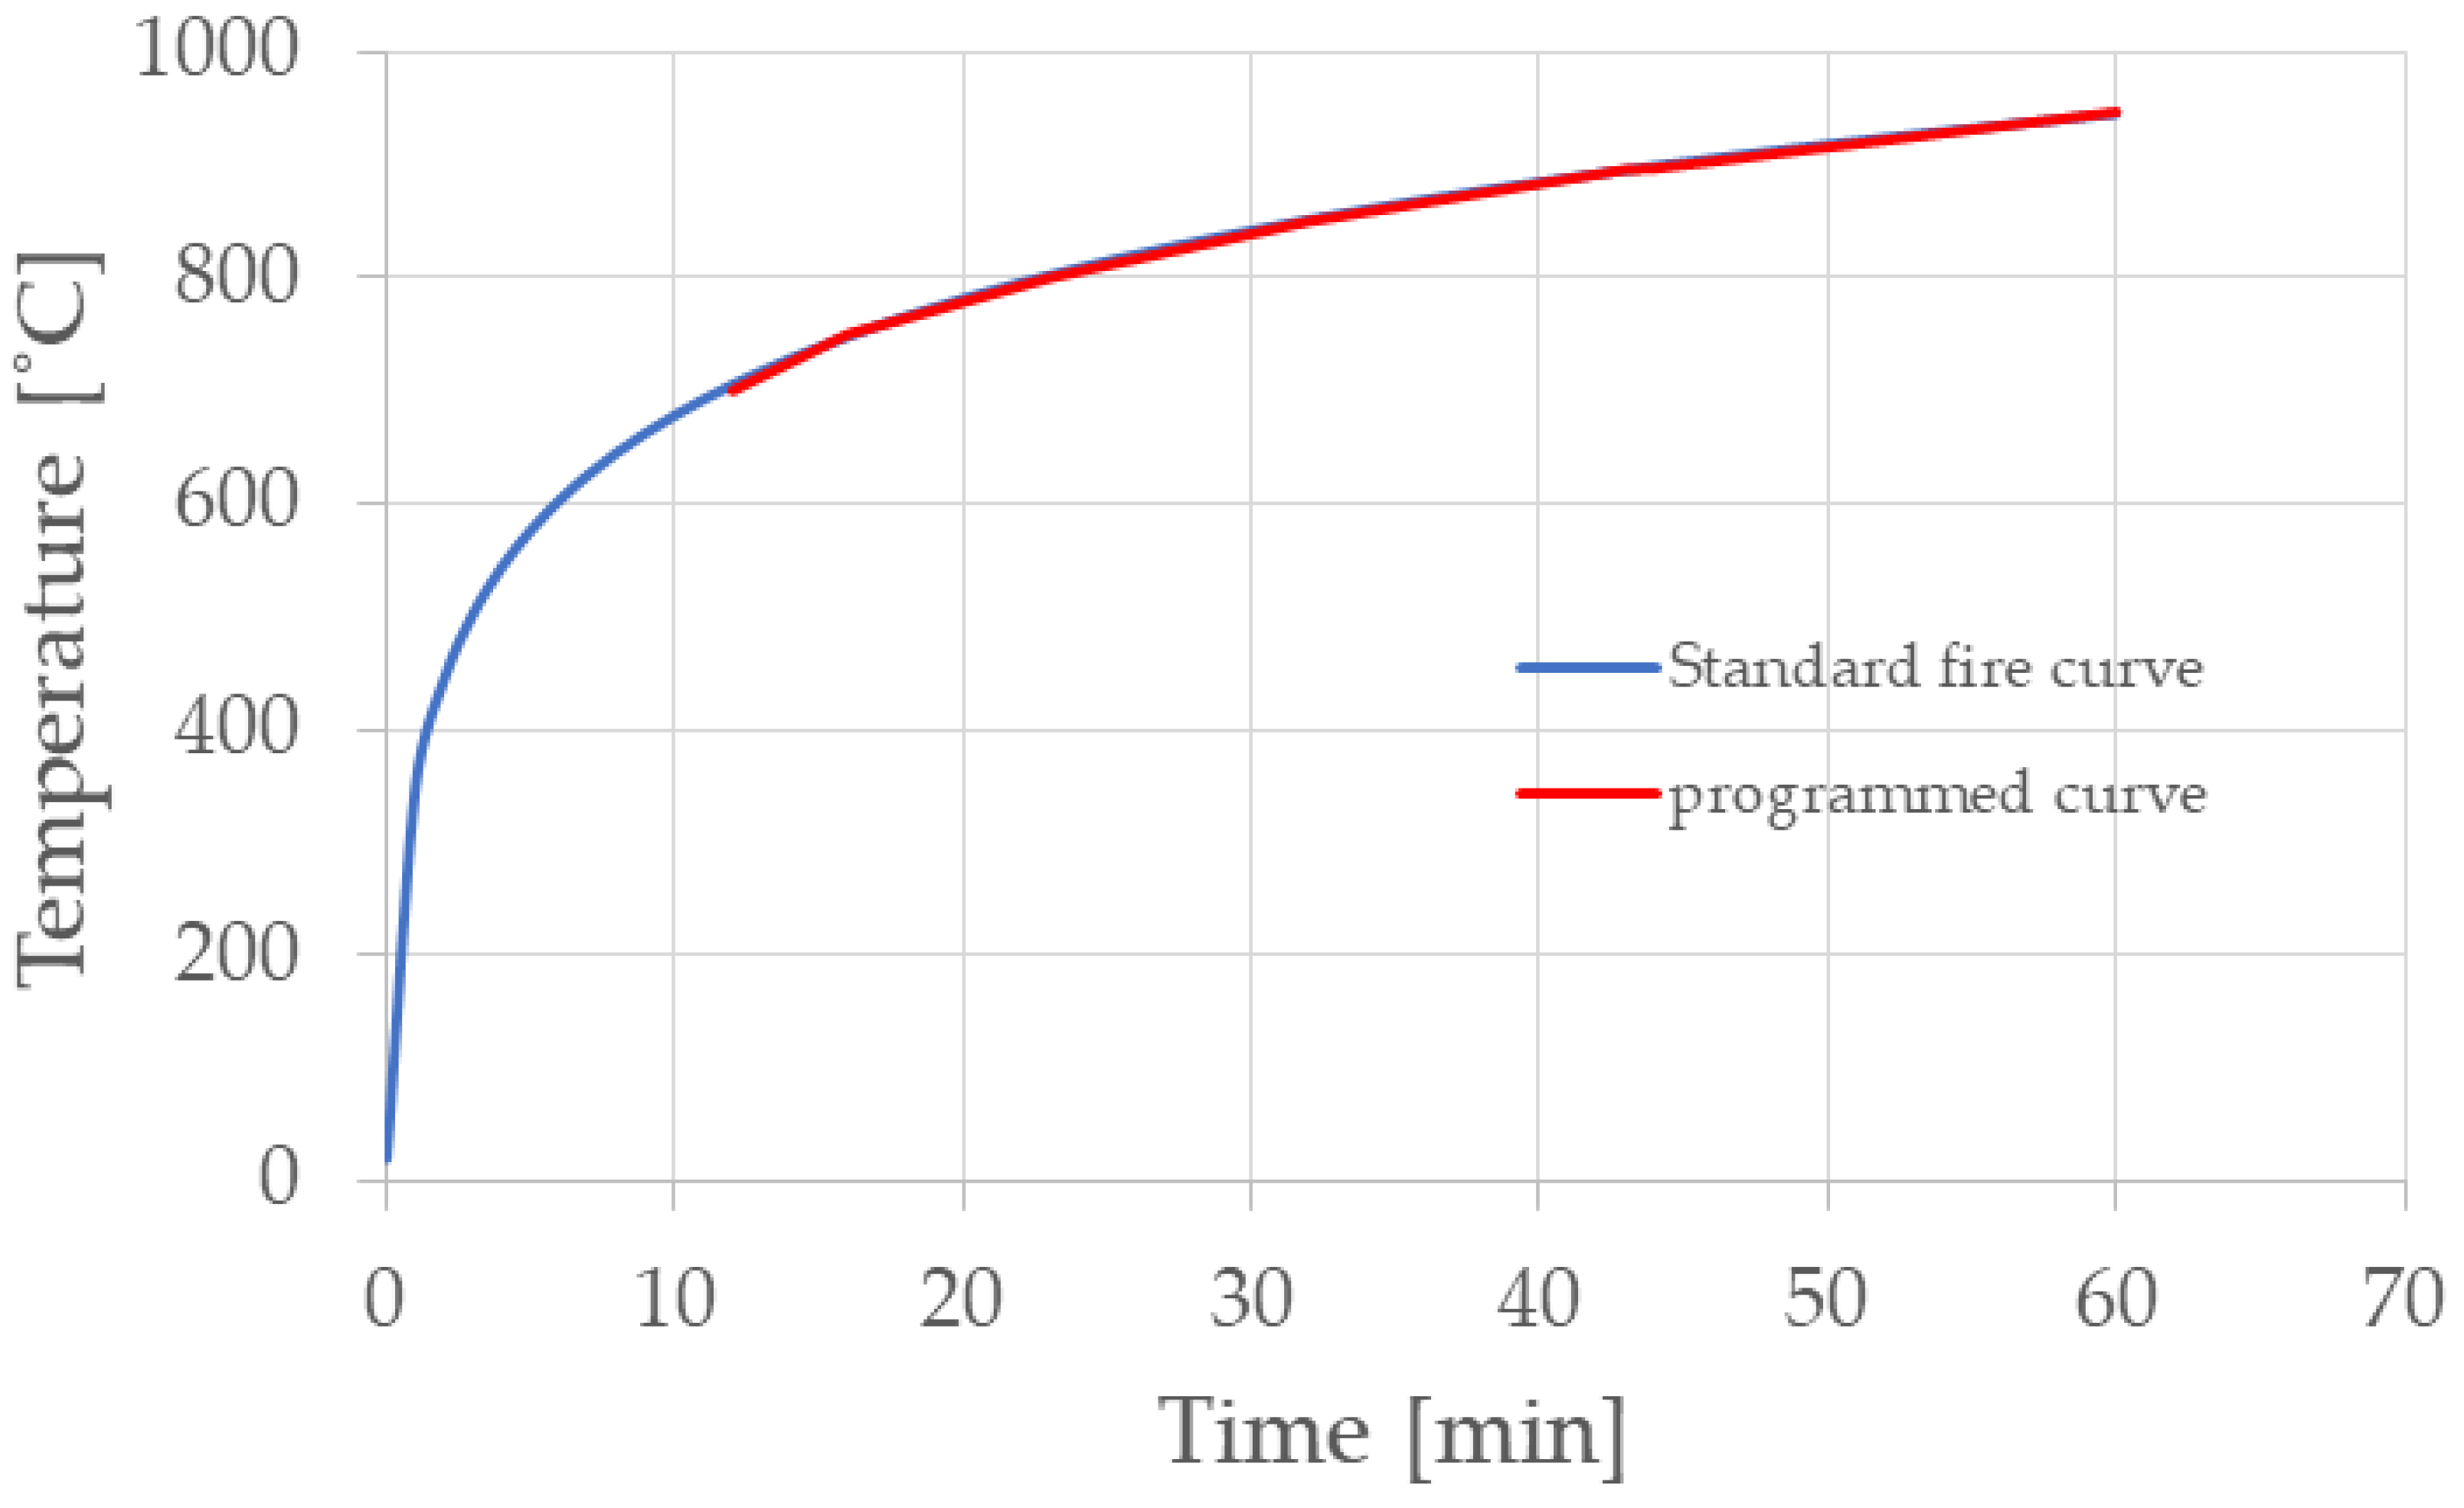
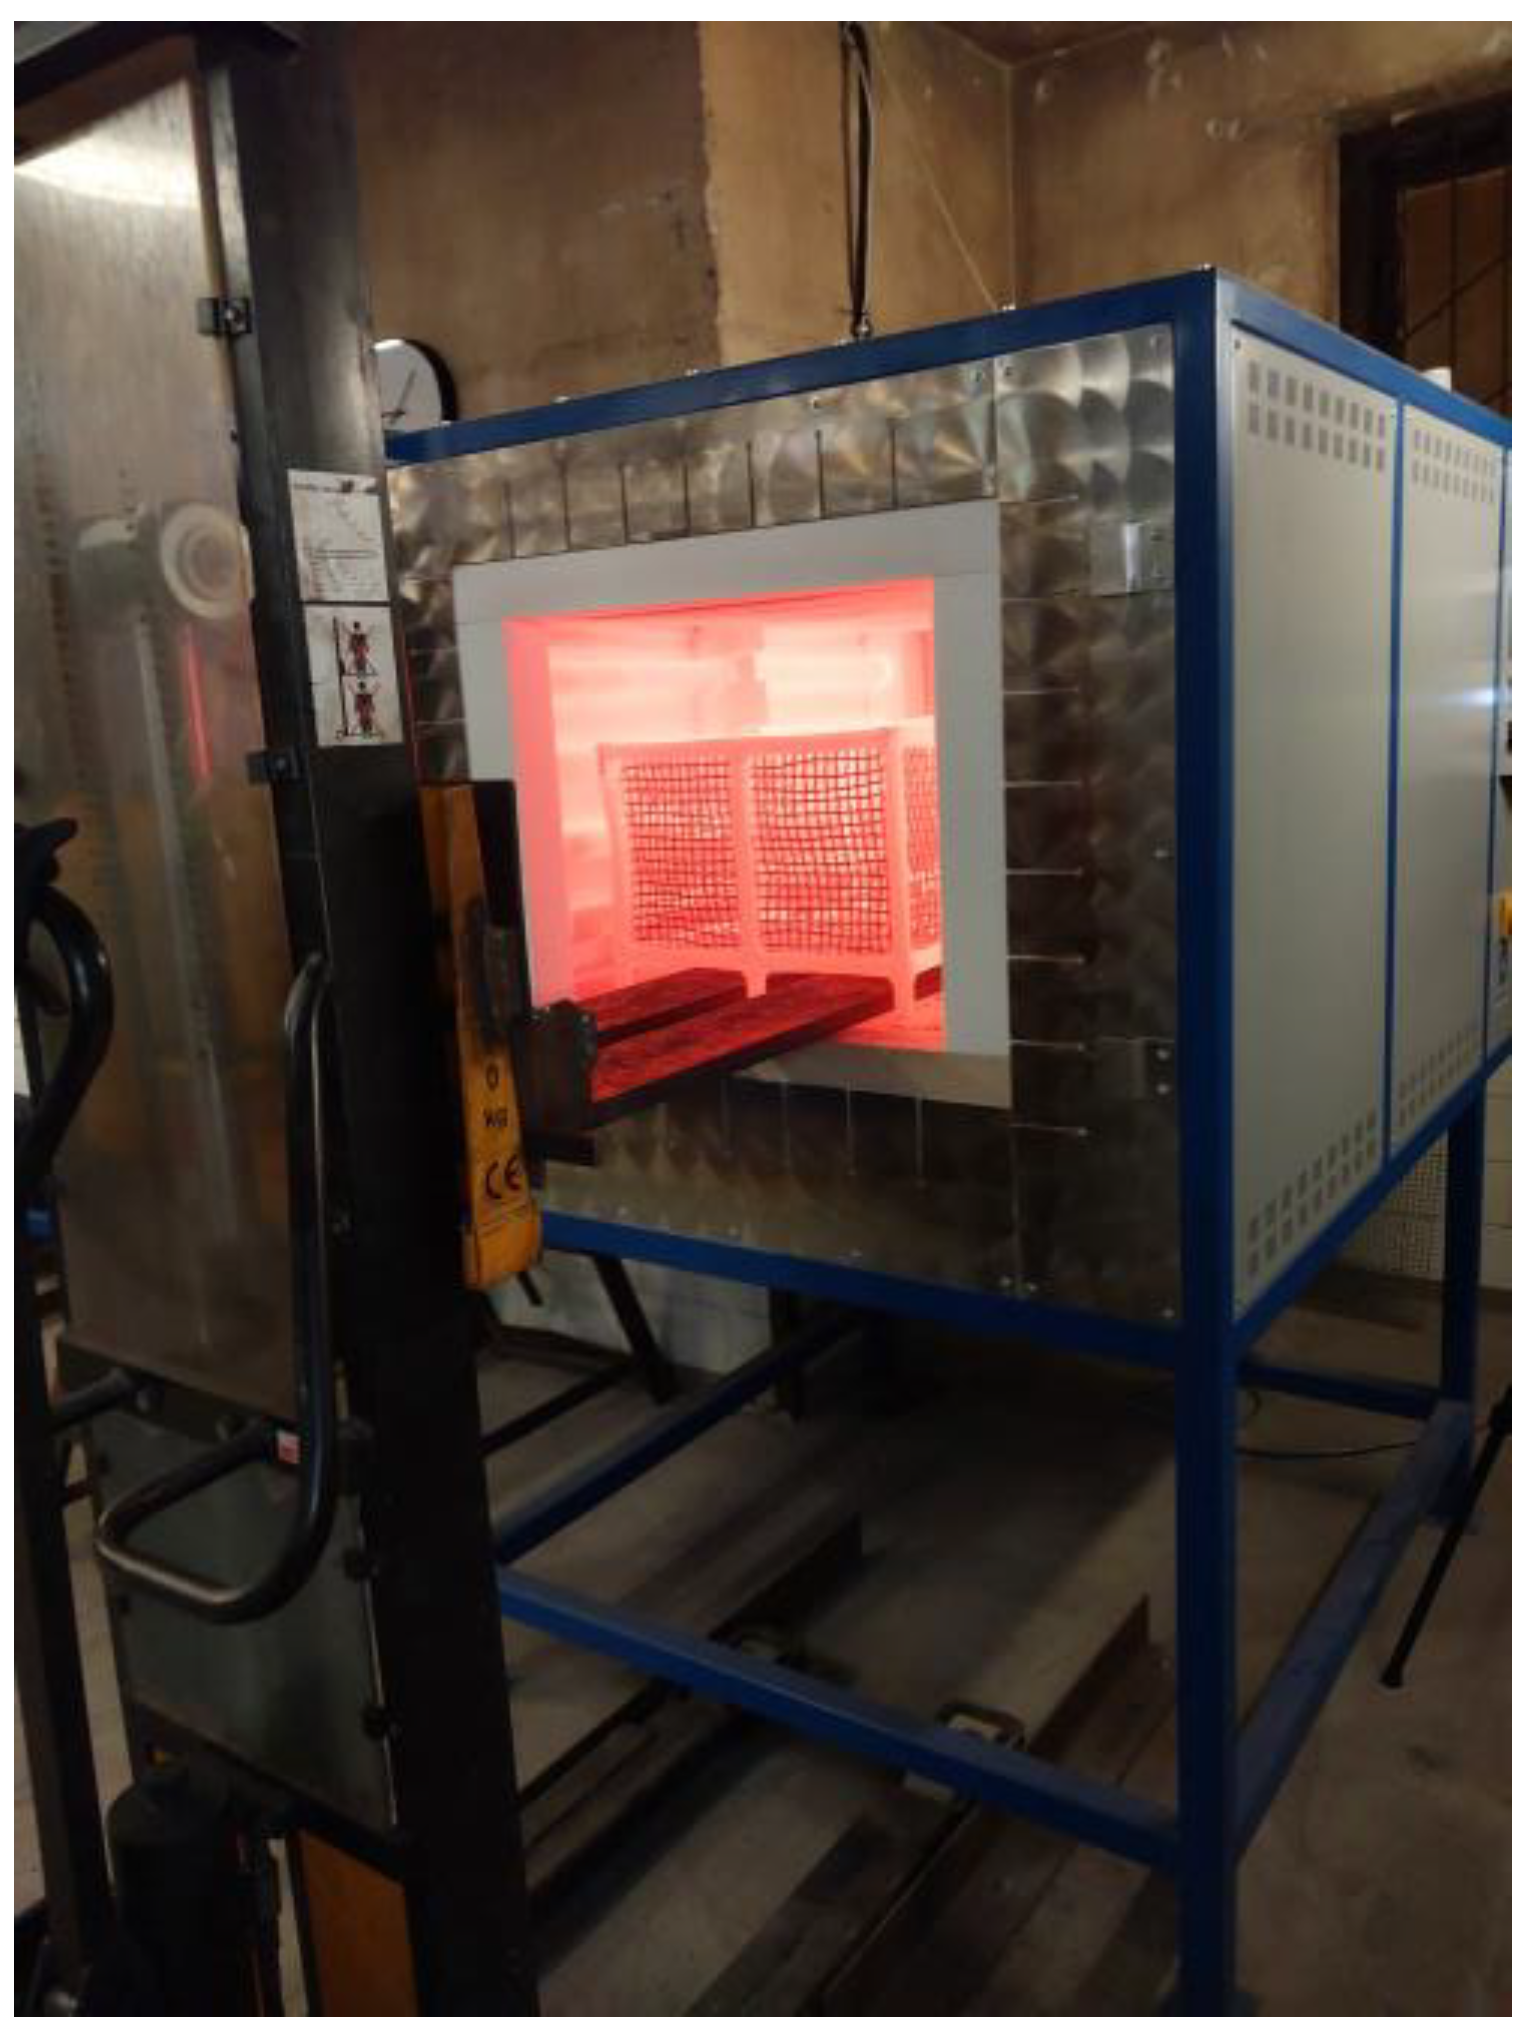
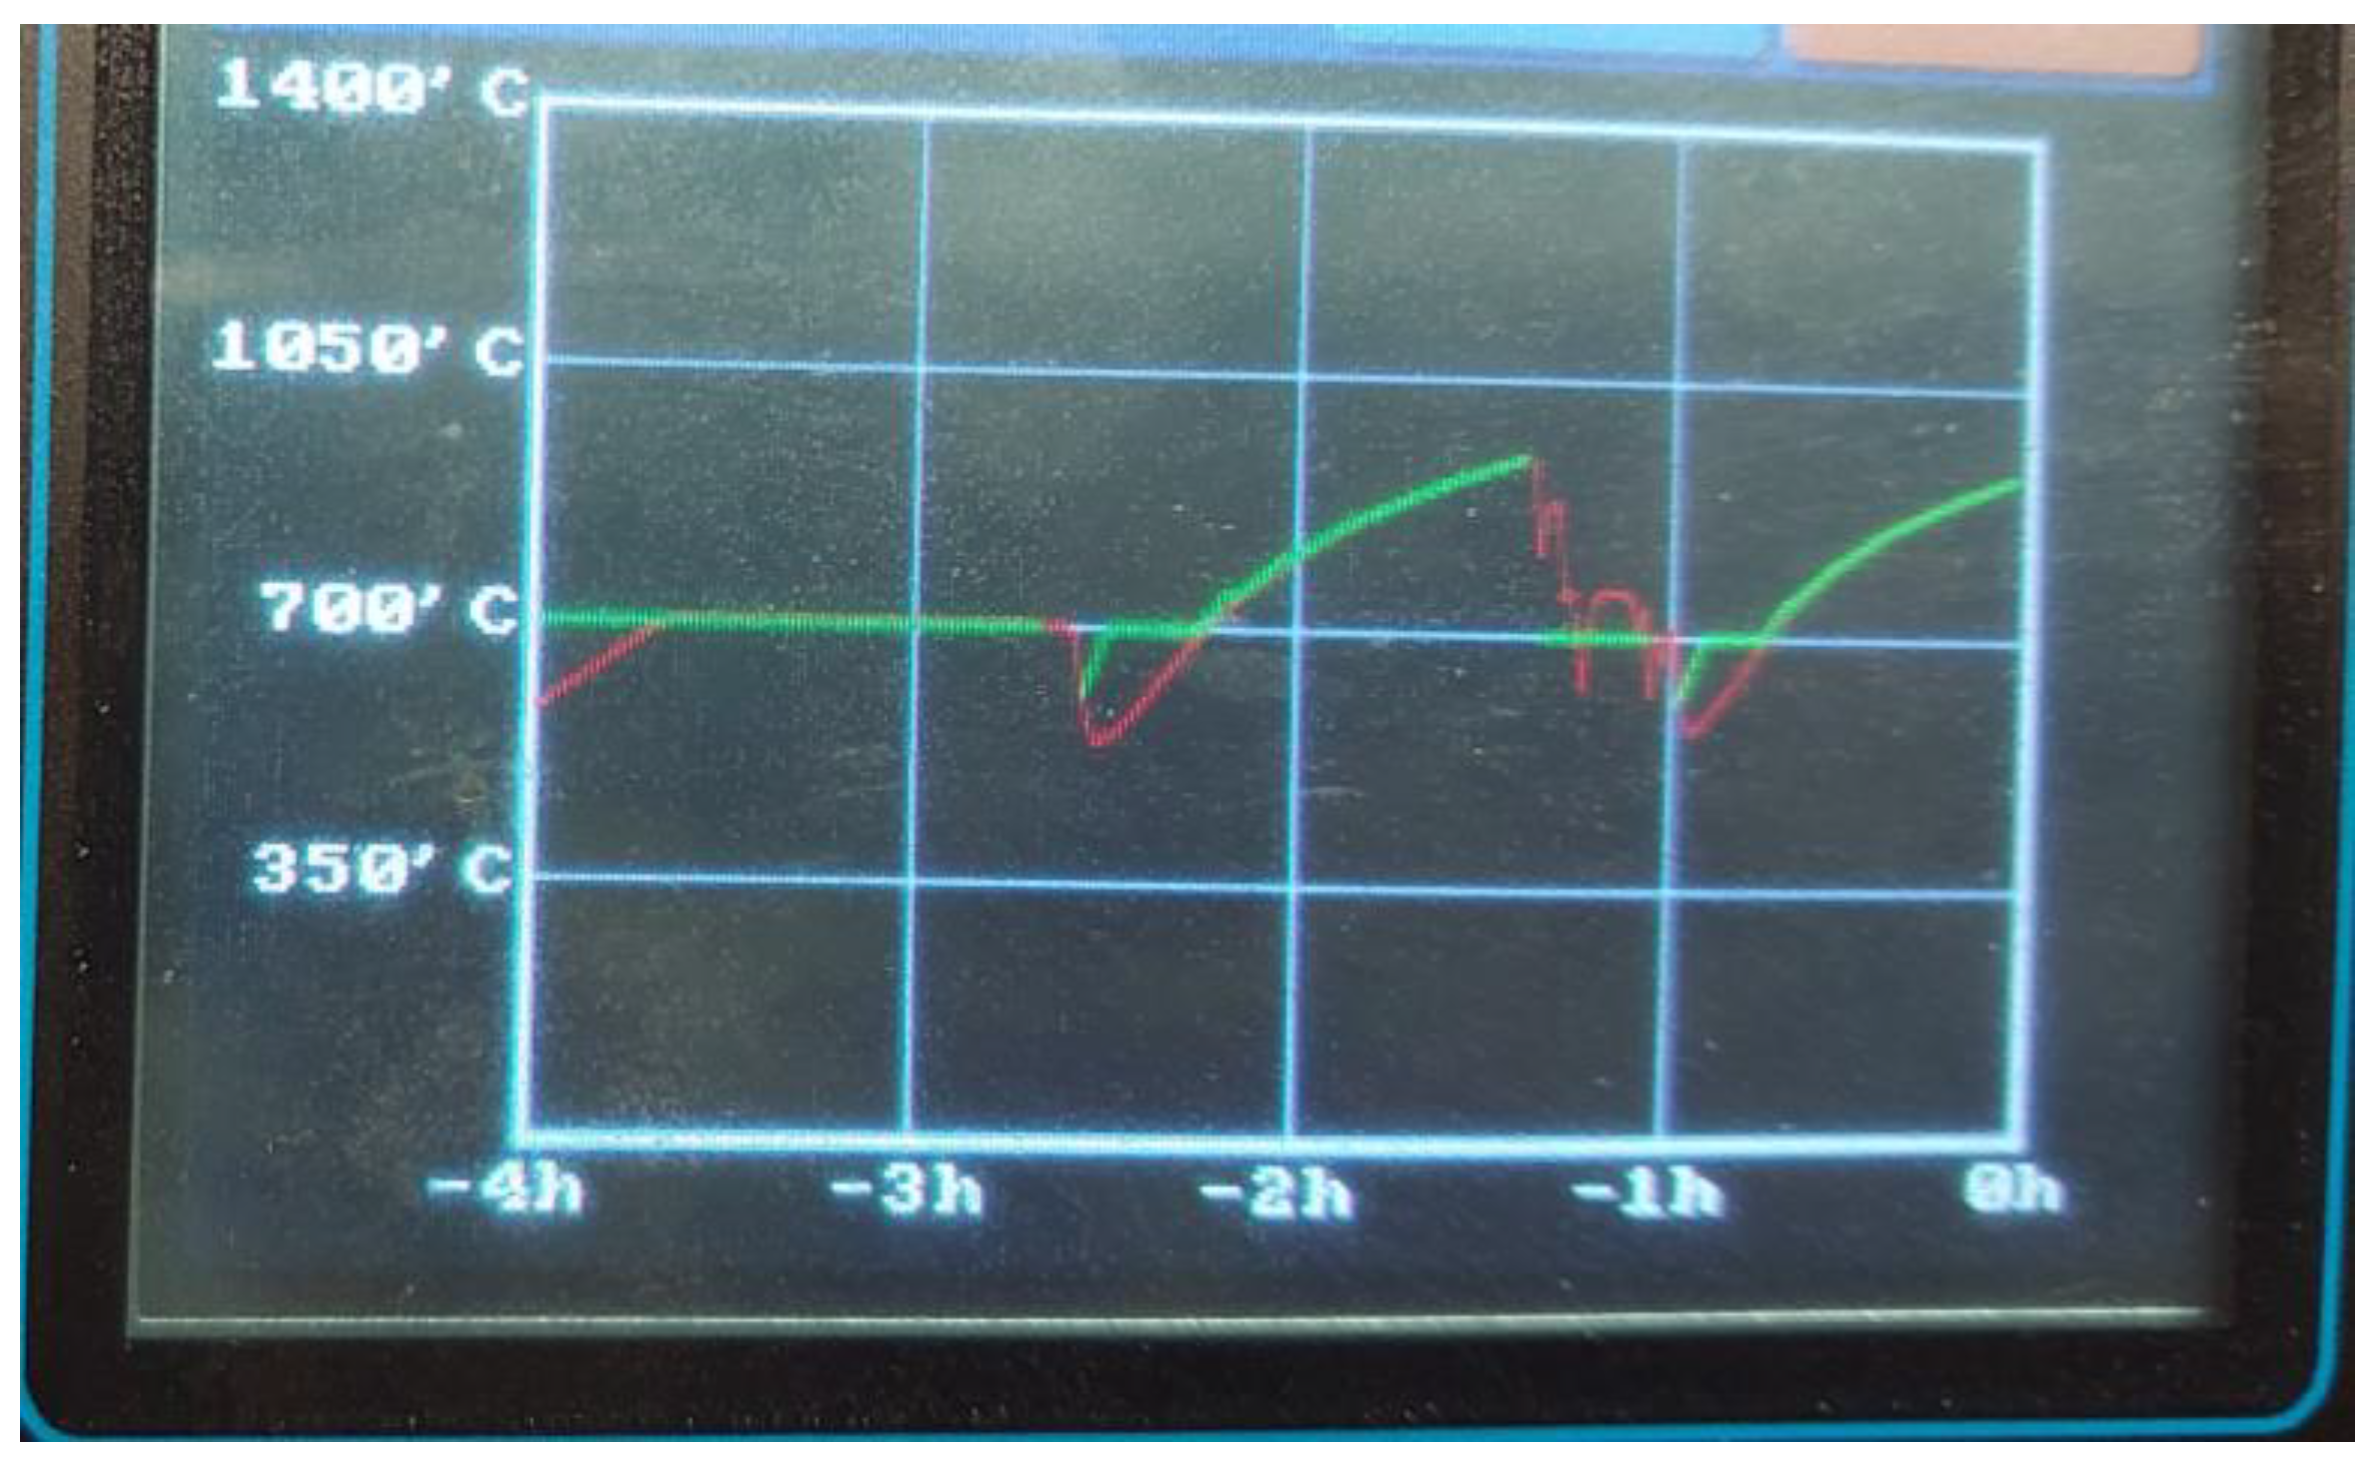
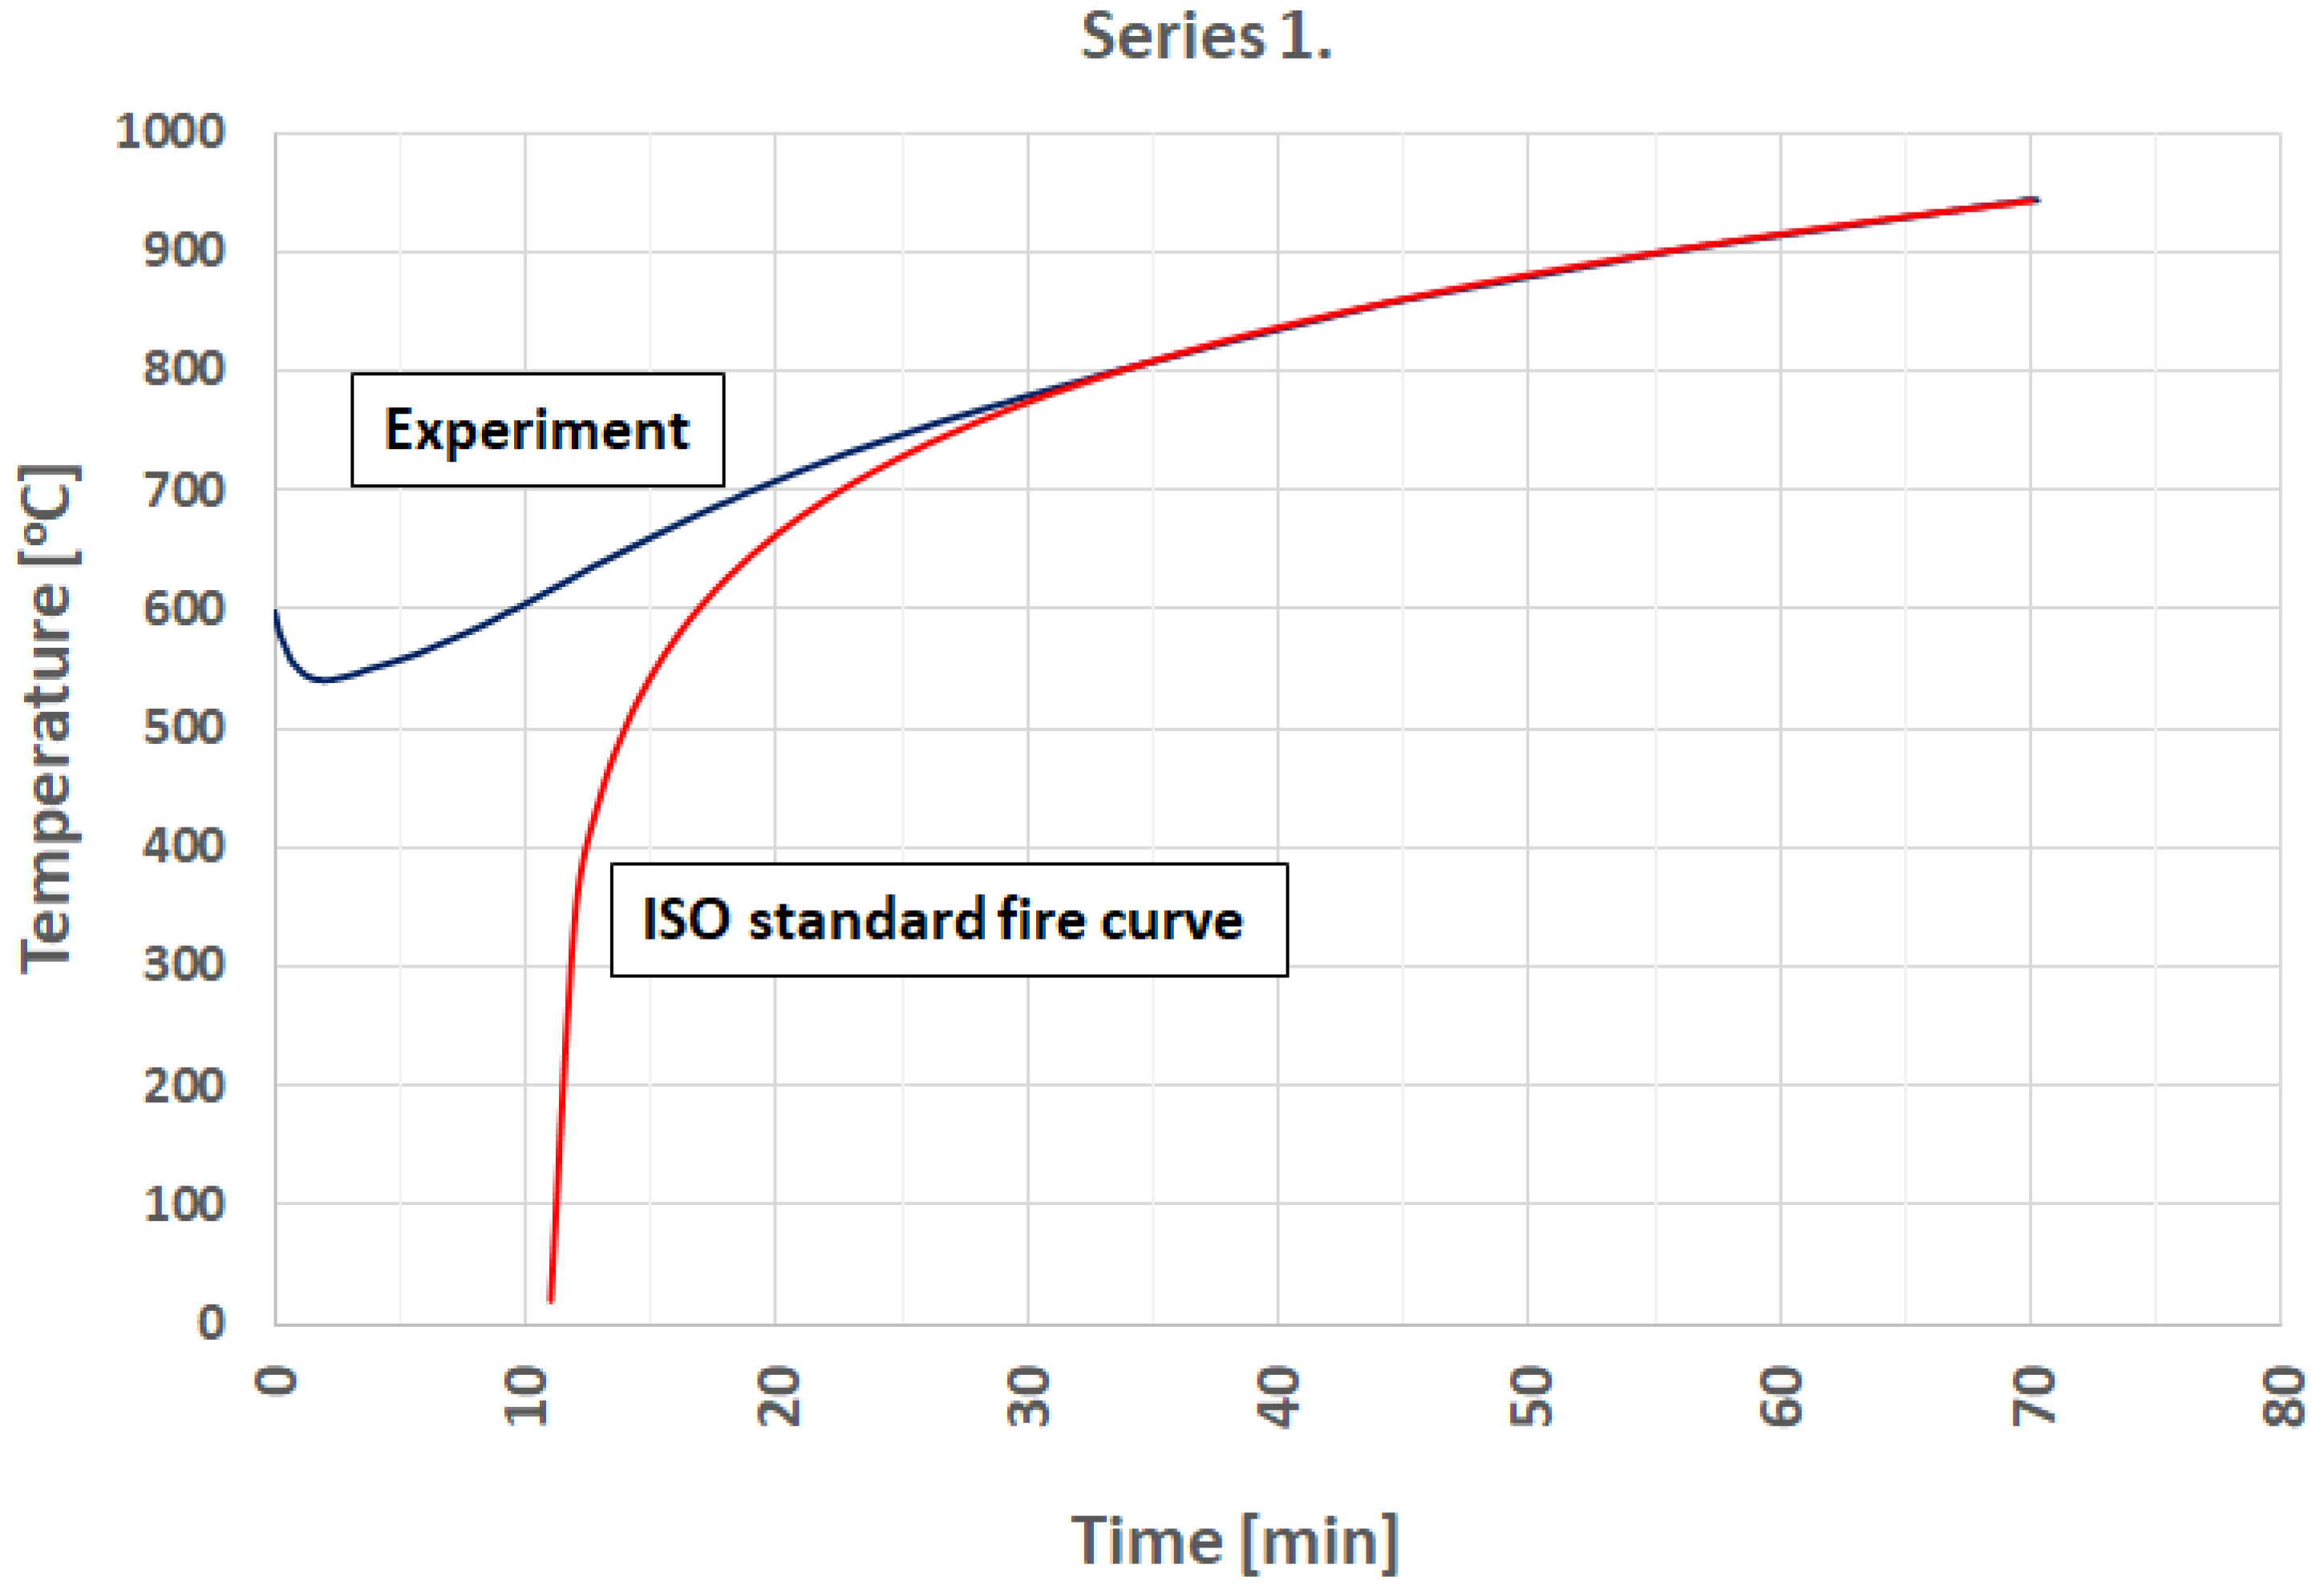
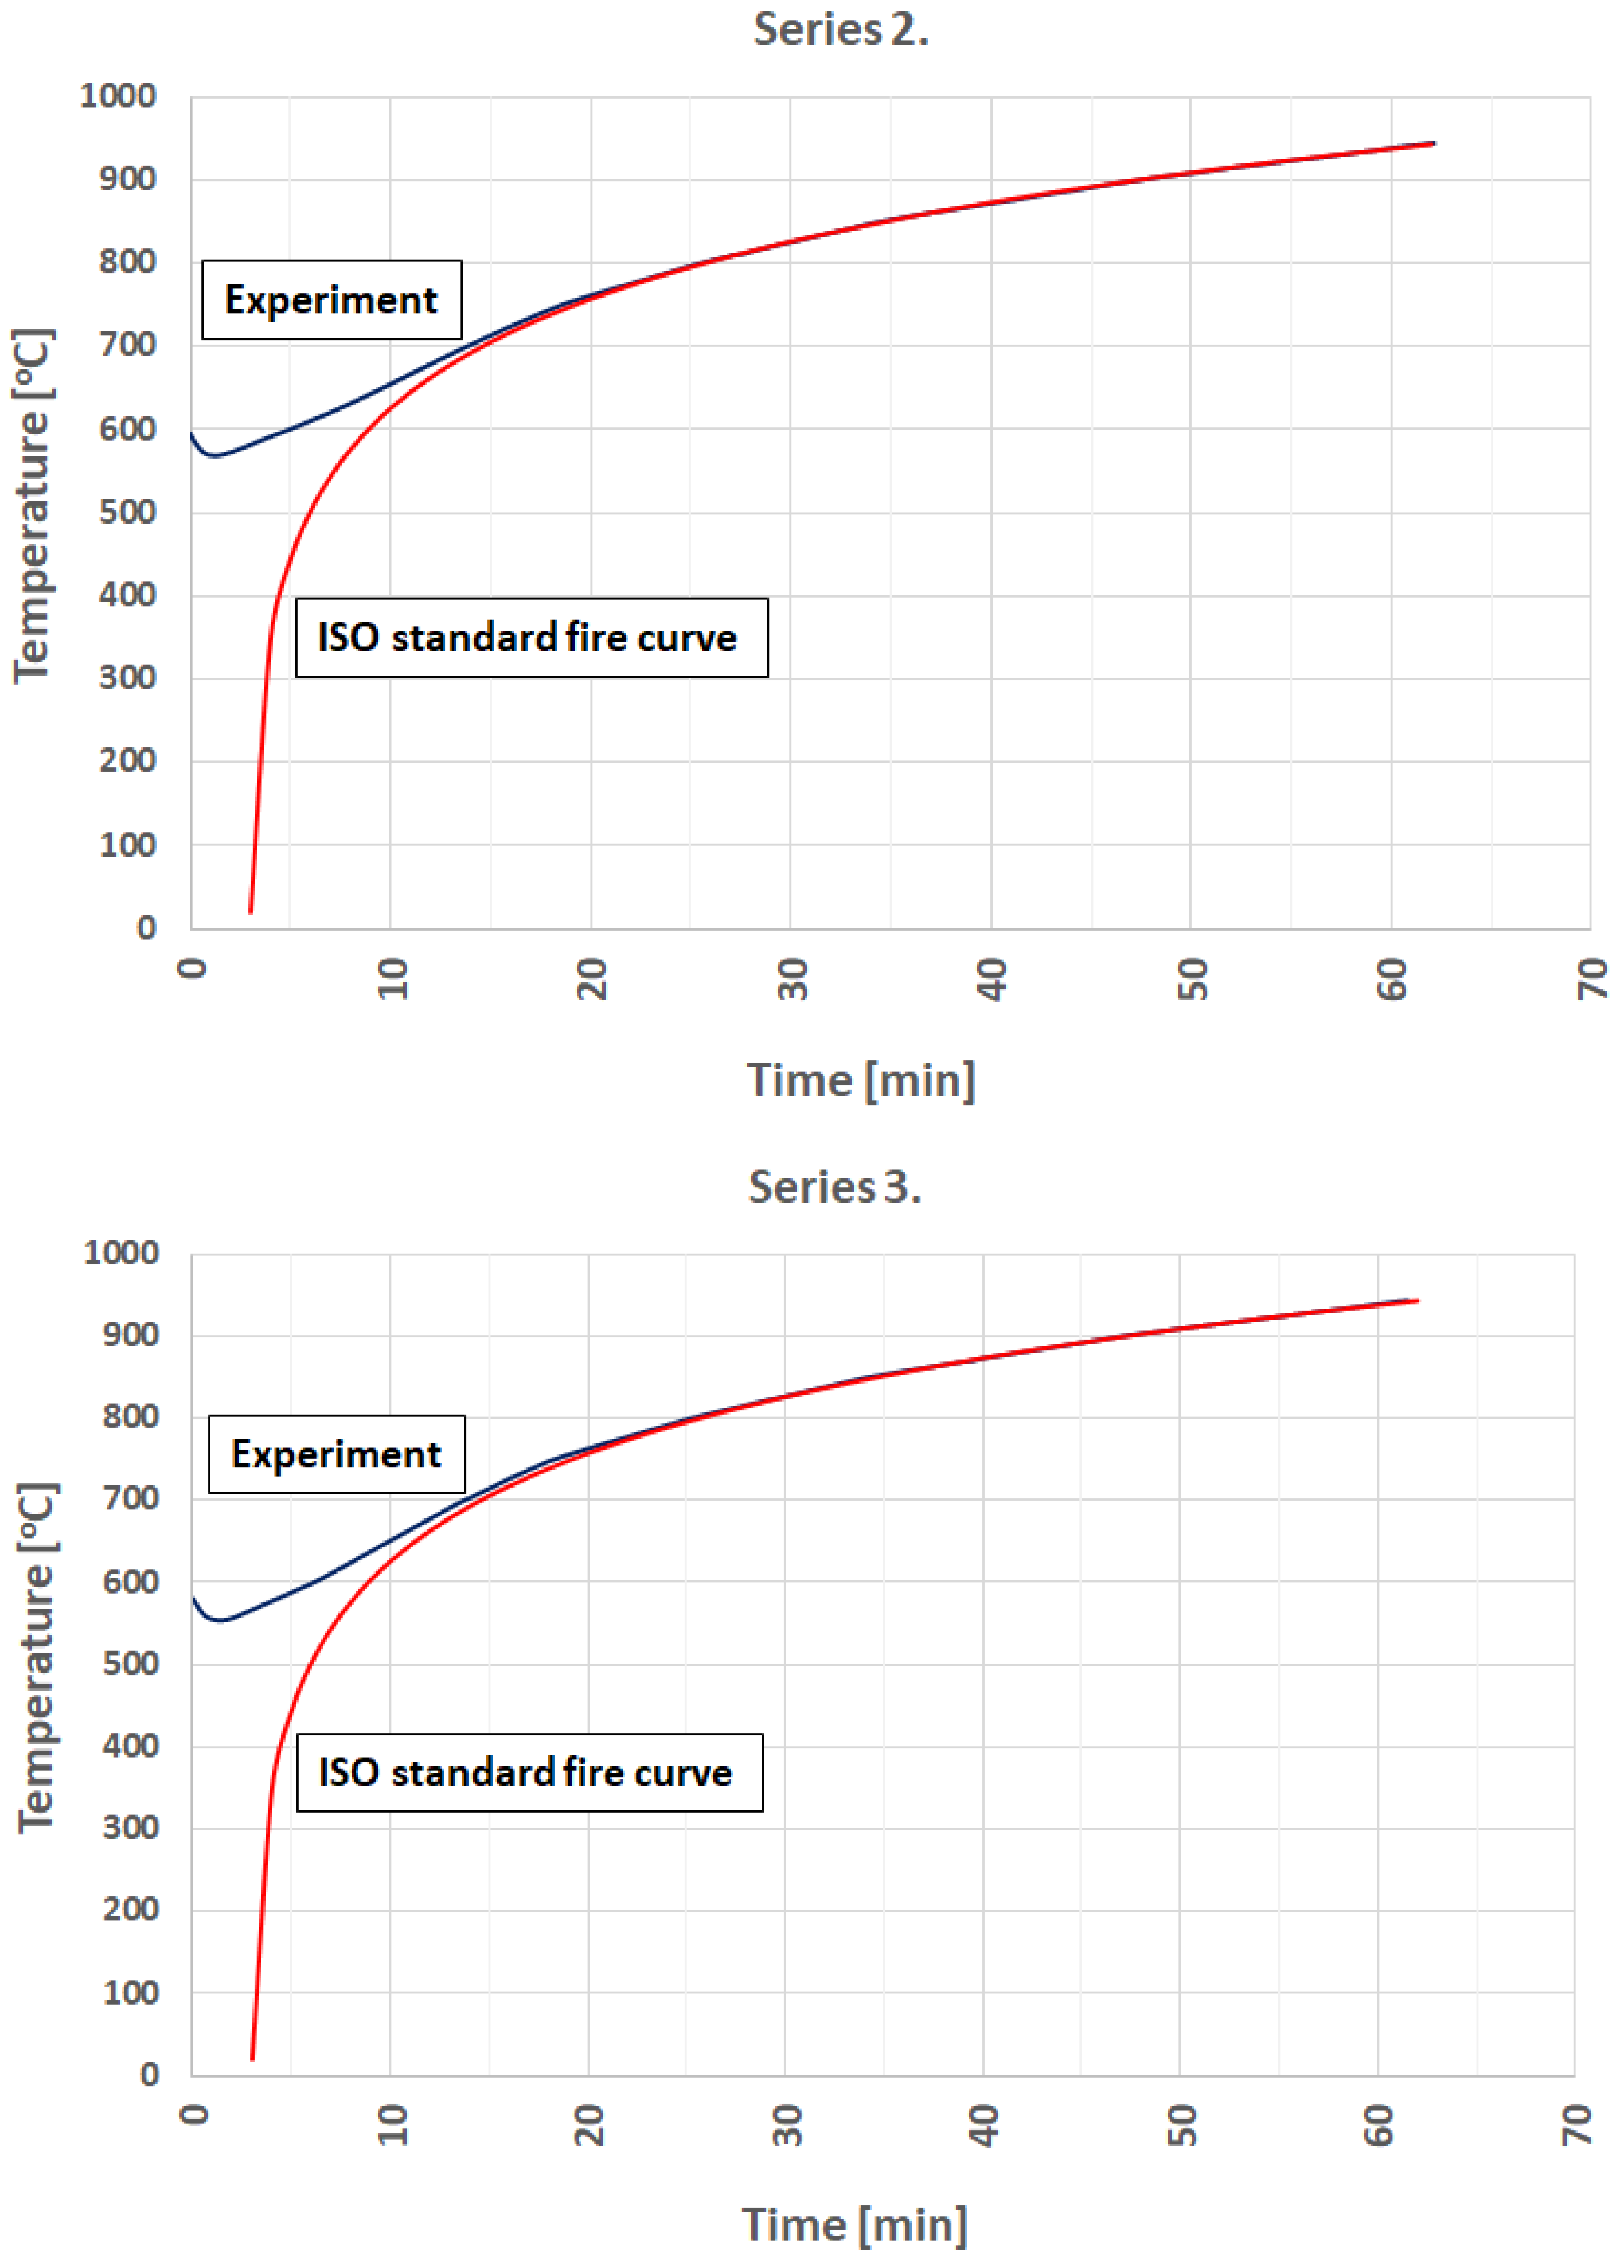
3.1. Fire Simulation

At any moment of the furnace work, it is possible to display the temperature history. In Figure 7, two curves are presented, obtained after heating the first two series. The green line indicates the programmed temperature in the following minutes, whereas red corresponds to the obtained absolute values. It is noticeable that the agreement in the heating phases is excellent. Before the first series, a rapid temperature decrease was observed, caused by opening furnace doors to place samples into it. The following rapid changes were observed during the series. This part of the red line is sharp because, in this case, the furnace doors were opened and closed to attain the initial temperature again.
In the diagrams below (Figure 8), the furnace temperature obtained based on programmed points is compared with the EC standard curve.

3.2. Chemical Analysis and Component Analysis

The whole documentation from the chemical component analysis of both types of samples (I-section and SHS) is presented in the Supplementary Materials. Figure 9 presents results from two types of possible chemical analysis, i.e., multiple points and drilling.
Using the EA-300 device allowed authors to identify the chemical components of both samples cooled in diverse ways. An analysis of charts presented in “Supporting Information” indicates that all samples, regardless of the cooling method, have remarkably similar chemical compositions. They contain iron (Fe); the oxygen atoms were identified on the most external layer of material, reflecting on the oxidation process. In some points of samples, H, K, Si, and Na atoms were identified in trace amounts. The most surprising finding is that tungsten was identified in many examined points in the deeper layers. Its content reached up to 50% of all components in some cases.

4. Discussion

Concerning the primary goal of the research, the authors of this paper believe that the use of the electric furnace is sufficient to recreate a fully developed fire. The preliminary study shows that the standard ISO curve, in its segment corresponding to fully developed fire, can be modeled and executed perfectly. This means that using electric furnaces reduces testing costs and limits environmental pollution (gas furnaces produce exhaust gases). There is also no need for a laboratory team to create a furnace—electric furnaces with appropriate dimensions can be purchased from specialized companies that provide warranty, service, and repairs. On the other hand, typical electric furnaces cannot reproduce a rapid growth of temperature after ignition, which is their most serious disadvantage. Only gas furnaces ensure a significant and fast temperature increase in a few minutes at the beginning of a fire simulation. The authors of this paper are fully aware of this deficiency and intend to investigate the influence of omitting the initial phase of fire (generated in the electric furnace) on results obtained in laboratory tests. On the other hand, the other authors [12] performed laboratory tests that involved the so-called nonstandard curves. Those authors also emphasize that a real fire scenario differs entirely from the ISO standard curve. The results presented in this paper seem promising in the context of simulating an unrestricted fire curve in an electric furnace.
Regarding the chemical composition of specimens, no significant changes were observed after a cooling phase. Of course, some products of the oxidation process were identified, but it is evident during a fire (oxygen is present in the air filling the chamber of the electric furnace)—see Maślak and Żwirski [15]. Moreover, the cooling process also has no influence on the chemical composition of specimens. A higher tungsten content can be explained in two ways. First, tungsten was also identified in a controlled trial, which was not tested in the furnace. Secondly, tungsten is a component of steel from which the basket (see Figure 3) was made.
No surprising differences were found in the appearance of samples differing in the cooling method. The SHS profiles demonstrate a mill scale on the surface, and the I-profiles have paint chips. Detailed photographic documentation showing the specimens after cooling is attached to this paper (Supporting Information).
To sum up, the authors of this paper claim that the preliminary research shows a good perspective on the use of electric furnaces, which are cheaper than gas furnaces and produce almost no exhaust gases. A laser microscope equipped with a chemical composition test set has an exciting application. In future work, the microscope can also help analyze microstructural changes in specimens.

5. Conclusions

A summary of the results presented in this paper looks like this:
  • It is possible to model a developed phase of the standard fire curve using an electric furnace.
  • Preceding research indicates that it is possible to simulate any fire curve provided that the rapid growth of the temperature phase will be omitted.
  • There is no notable change in the chemical composition of specimens after a fire test, and a cooling regime does not influence it.
  • A laser microscope is an effective device for the chemical composition analysis of specimens after a cooling phase.
The preliminary research presented in this paper is a good start for the authors’ future work. However, two tasks and issues should be performed or solved before the beginning of the following tests. These issues are listed below:
  • It is necessary to investigate the influence of omitting the initial phase of fire; alternatively, the authors intend to model a nonstandard fire curve if it turns out that the rate of change of temperature in the initial phase is crucial for the obtained results.
  • The issue mentioned above should also be expressed quantitatively—the authors plan to compare the results obtained using the electric furnace with those presented by other authors using gas furnaces.
The authors of the paper intend to develop laboratory tests of steel in a fire situation in their future work, namely:
  • An analysis of microstructural changes in specimens, which can also be performed using a laser microscope.
  • An analysis of changes in the mechanical properties of steel—this task involves strength tests before and after fire.
  • Investigations of more significantly prominent structural members with the use of a larger electric furnace.
  • A finite element modeling of a fire situation and comparison of laboratory and numerical results; some effort, in this case, has already been presented by Szczecina and Nowak [29].
  • Assessment of structural members after the fire, as presented by Kossakowski et al. [30].
  • Laboratory tests with several types of fire curves, including those defined by Eurocodes; some theoretical research is presented in Kubicka et al. [31].

Supplementary Materials

The following supporting information can be downloaded at: https://www.mdpi.com/article/10.3390/met14060707/s1, Figure S1: The surface of non-heated I-section under the microscope with 50 times; Figure S2: The chemical composition identification; Figure S3: The chemical composition identification (drill); Figure S4: The surface of I-section after cooling in water; Figure S5: The chemical composition identification (drill); Figure S6: The surface of non-heated I-section under the microscope with 50 times zoom; Figure S7: The chemical composition identification (drill); Figure S8: The surface of I-section under the microscope with 50 times zoom; Figure S9: The chemical composition identification; Figure S10: The chemical composition identification (drill) in different points; Figure S11: The surface of non-heated SHS section in (a) 20 times zoom; (b) 200 times zoom; Figure S12: Chemical composition of non-heated SHS section (drilling) in two different points (a), (b); Figure S13: The surface of SHS after cooling in the water (a) 20 times zoom; (b) 300 times zoom; Figure S14: Chemical composition of SHS section cooling in the water (drilling) in different points; Figure S15: The surface of SHS section after cooling in the polymer; Figure S16: Chemical composition of SHS section cooling in the polymer(drilling) in different points; Figure S17: The surface of SHS section after cooling in the furnace; Figure S18: Chemical composition of SHS section cooling in the furnace (drilling) in different points.

Author Contributions

Conceptualization, K.K. and M.S. (Michał Szczecina); methodology, K.K. and M.S. (Michał Szczecina); validation, K.K., M.S. (Michał Szczecina), T.S., and M.S. (Mariusz Suckert); formal analysis, K.K. and M.S. (Michał Szczecina); investigation, K.K., M.S. (Michał Szczecina), T.S., and M.S. (Mariusz Suckert); data curation, M.S. (Michał Szczecina); writing—original draft preparation, K.K. and M.S. (Michał Szczecina); writing—review and editing, K.K., M.S. (Michał Szczecina), T.S., and M.S. (Mariusz Suckert); visualization, K.K. and M.S. (Michał Szczecina). All authors have read and agreed to the published version of the manuscript.

Funding

The APC was founded by Kielce University of Technology project no. 02.0.20.00/1.02.001 SUBB.BKTK.24.002.

Data Availability Statement

The original contributions presented in the study are included in the article/Supplementary Material, further inquiries can be directed to the corresponding author.

Acknowledgments

The authors would like to express their deepest gratitude to the KEYENCE company, which presented the EA 300 device and enabled the examination of prepared samples.

Conflicts of Interest

Authors Mariusz Suckert and Tomasz Suckert were employed by the company PPHU Suckert. The remaining authors declare that the research was conducted in the absence of any commercial or financial relationships that could be construed as a potential conflict of interest.

References

  1. EN 1993-1-2; Eurocode 3: Design of Steel Structures—Part 1–2: General Rules—Structural Fire Design. CEN: Brussels, Belgium, 2005.
  2. EN 1991-1-2; Eurocode 1: Actions on Structures—Part 1–2: General Actions—Actions on Structures Exposed to Fire. CEN: Brussels, Belgium, 2002.
  3. Yu, H.; Burgess, I.W.; Davison, J.B.; Plank, R.J. Experimental and Numerical Investigations of the Behavior of Flush End Plate Connections at Elevated Temperatures. J. Struct. Eng. 2011, 137, 80–87. [Google Scholar] [CrossRef]
  4. Wang, W.; Xia, Y.; Li, G. Fire Resistance Studies on High Strength Steel Structures. Int. J. High Rise Build. 2018, 7, 287–298. [Google Scholar] [CrossRef]
  5. Liu, D.; Liu, X.; Wang, W.; Fu, F. Nondestructive Post-fire Damage Assessment of Structural Steel Members Using Leeb Harness Method. Fire Technol. 2020, 56, 1777–1799. [Google Scholar] [CrossRef]
  6. Król, P.A.; Wachowski, M. Effect of Fire Temperature and Exposure Time on High-Strength Steel Bolts Microstructure and Residual Mechanical. Materials 2021, 14, 3116. [Google Scholar] [CrossRef] [PubMed]
  7. Almand, K.H. Structural Fire Resistance Experimental Research—Priority Needs of U.S. Industry; Fire Protection Research Foundation: Quincy, MA, USA, 2012. [Google Scholar]
  8. Hasburgh, L.E.; Bourne, K.J.; Stone, S.D.; Zelinka, S.L. Simulating real compartment fire conditions in a furnace. Fire Mater. 2020, 44, 333. [Google Scholar] [CrossRef]
  9. Molkens, P.; Cashell, K.A.; Rossi, B. Post-fire mechanical properties of carbon steel and safety factors for the reinstatement of steel structures. Eng. Struct. 2021, 234, 111975. [Google Scholar] [CrossRef]
  10. Molkens, P.; Cashell, K.A.; Rossi, B. Performance of structural stainless steel following a fire. Eng. Struct. 2021, 235, 112001. [Google Scholar] [CrossRef]
  11. Radzi, N.A.M.; Hamid, R.; Mutalib, A.A.; Kaish, A.B.M.A. A Review of the Structural Fire Performance Testing Methods for Beam-to-Column Connections. Adv. Civ. Eng. 2021, 2021, 5432746. [Google Scholar] [CrossRef]
  12. Bisby, L.; Gales, J.; Maluk, C. A contemporary review of large-scale non-standard structural fire testing. Fire Sci. Rev. 2013, 2, 1–27. [Google Scholar] [CrossRef]
  13. Winful, D.A.; Cashell, K.A.; Afshan, S.; Barnes, A.M.; Pargeter, R.J. Material properties of high strength steel under fire conditions. In Proceedings of the Eurosteel 2017 Conference, Copenhagen, Denmark, 13–15 September 2017. [Google Scholar] [CrossRef]
  14. Maraveas, C.; Fasoulakis, Z.C.; Tsavdaridis, K.D. Mechanical properties of High and Very High Steel at elevated temperatures and after cooling down. Fire Sci. Rev. 2017, 6, 1–13. [Google Scholar] [CrossRef]
  15. Maślak, M.; Żwirski, G. Zmiany strukturalne w stali konstrukcyjnej wywołane epizodami jej nagrzewania i stygnięcia podczas pożaru (Changes in Structural Steel Microstructures Following Heating and Cooling Episodes in Fires). Saf. Fire Technol. 2017, 48, 34–52. [Google Scholar] [CrossRef]
  16. Thanaraj, D.P.; Tattukolla, K.; Balamurali, K.; Anand, N.; Andrushia, D.; Beulah, G.A.P.; Krishanu, R. Influence of Heating–Cooling Regime on the Engineering Properties of Structural Concrete Subjected to Elevated Temperature. Buildings 2023, 13, 295. [Google Scholar] [CrossRef]
  17. Blancs, M.C.; Sanchez, A.O.; Navarro, I.F. Evaluation of steel structures integrity in a post-fire condition: Case study of the Serradells sports centre in Andorra. Fire Saf. J. 2022, 133, 103668. [Google Scholar] [CrossRef]
  18. Cábová, K.; Lišková, N.; Zeman, F.; Benýšek, M. Virtual test of fire resistance of a steel beam. In Proceedings of the Engineering Mechanics Conference, Svratka, Czech Republic, 14–17 May 2018. [Google Scholar] [CrossRef]
  19. Shaheen, M.A.; Presswood, R.; Afshan, S.H. Application of Machine Learning to predict the mechanical properties of high strength steel at elevated temperatures based on the chemical compostion. Structures 2023, 52, 17–29. [Google Scholar] [CrossRef]
  20. Jiang, B.; Qu, Y.; Wang, M.; Lou, G.; Li, G. Mechanical properties of Q355 hot-rolled steel during the entire fire process. J. Constr. Steel Res. 2024, 215, 108565. [Google Scholar] [CrossRef]
  21. Jiang, B.; Qu, Y.; Wang, M.; Lou, G.; Li, G. Mechanical properties and constitutive model of Q460 steel during the fire-cooling stage. Thin-Walled Struct. 2023, 189, 110904. [Google Scholar] [CrossRef]
  22. Maślak, M.; Skiba, R. Fire resistance increase of structural steel through the modification of its chemical composition. Procedia Eng. 2015, 108, 277–284. [Google Scholar] [CrossRef]
  23. Trzaska, J.; Sitek, W.A. Hybrid Method for Calculating the Chemical Composition of Steel with the Required Hardness after Cooling from the Austenitizing Temperature. Materials 2023, 17, 97. [Google Scholar] [CrossRef]
  24. Dani, A.A.; Roy, K.; Masood, R.; Fang, Z.; Lim, J.B.P. A Comparative Study on the Life Cycle Assessment of New Zealand Residential Buildings. Buildings 2022, 12, 50. [Google Scholar] [CrossRef]
  25. Burchart-Korol, D. Life cycle assessment of steel production in Poland: A case study. J. Clean. Prod. 2013, 54, 235–243. [Google Scholar] [CrossRef]
  26. Roy, K.; Dani, A.A.; Ichhpuni, H.; Fang, Z.; Lim, J.B.P. Improving Sustainability of Steel Roofs: Life Cycle Assessment of a Case Study Roof. Appl. Sci. 2022, 12, 5943. [Google Scholar] [CrossRef]
  27. Available online: www.keyence.eu (accessed on 10 March 2024).
  28. Available online: https://www.thermofisher.com/pl/en/home/industrial/spectroscopy-elemental-isotope-analysis/portable-analysis-material-id/industrial-elemental-radiation-solutions/how-does-libs-work.html (accessed on 10 March 2024).
  29. Szczecina, M.; Nowak, K. Numerical analysis of a steel frame in a fire situation. Inżynieria Bezpieczeństwa Obiektów Antropogenicznych 2022, 4, 42–53. [Google Scholar] [CrossRef]
  30. Kossakowski, P.; Piotrowski, J.Z.; Świt, G.; Trampczyński, W. The feasibility assessment of the exibition hall after the fire. Struct. Environ. 2010, 2, 20–28. [Google Scholar]
  31. Kubicka, K.; Radoń, U.; Szaniec, W. The influence of description of fire curves on the thermal and reliability response of steel structure. MATEC Web Conf. 2017, 117, 00095. [Google Scholar] [CrossRef]
Figure 1. The resistance chamber furnace IZO-2.H.
Metals 14 00707 g001
Figure 2. The comparison of the programmed curve with the EC standard fire curve.
Metals 14 00707 g002
Figure 3. The research position with a recording device.
Metals 14 00707 g003
Figure 4. Taking out the heated series and placing it in the unique basket.
Metals 14 00707 g004
Figure 5. The cooling curves of polymer AQUA-QUENCH® 320.
Metals 14 00707 g005
Figure 6. The research position for chemical composition analysis.
Metals 14 00707 g006
Figure 7. The results are displayed in the control panel after the whole analysis.
Metals 14 00707 g007
Figure 8. In the following minutes, we compare the temperature of a furnace (blue line) with the EC standard fire curve (red line).
Metals 14 00707 g008aMetals 14 00707 g008b
Figure 9. The results of chemical analysis are (a) multiple points and (b) drilling.
Metals 14 00707 g009aMetals 14 00707 g009b
Table 1. Summary of the literature review.
Reference No.Findings/Scope of ResearchGaps/Limitations
Use of Electric [e]/Gas [g] FurnaceChemical Composition AnalysisNumerical AnalysisOther/Additional Information
[3][e]xvx*
[4][e]xxCreep strain, residual stress in welds, local buckling and behavior of steel columns after fire exposure.*
[5][e]xxPost-fire mechanical properties of steel; Leeb hardness method.*
[6][e]xxMicrostructural analysis of samples, correlation between hardness and residual tensile strength.*
[7][g]xxFurnace built by authors with high efficiency (950 °C after 25 min.).High costs
[8][g]xxThe furnace was programmed with 3 real compartment fire curves (obtained from a full-scale test).
[9,10][g] [e]xxThe authors obtained steel’s retention factors and the stress–strain relationship in different temperatures.
[11]gas burner, electric furnace, ceramic padxxBeam-to-column connection tests, comparison of real fire–temperature curve with the standard curve.x
[12][e]xxLarge-scale nonfire tests.*
[13][e]xxInvestigation of mechanical properties.*
[14][-]xxMicrostructure changes.*
[15][-]xxInfluence of cooling on post-fire properties of steel/concrete.*
[16][e]xxInfluence of cooling on post-fire properties of steel/concrete.*
[17,18]xxvCase study and FEM modeling.*
[19]xxvUse of machine learning to predict mechanical properties of steel.*
[20,21][e]xxInvestigation of mechanical properties during the heating and cooling phase.*
[22]xvxModification of the chemical composition of steel to increase fire resistance.**
[23]xvxUse of artificial neural networks (ANNs).**
[24,25]xxxReduction in costs, energy, and carbon footprint.x
[26]xxxSustainability of structures.x
(*) The methods presented in the literature still have to be developed, especially in the field of the simulation of fire curves in the best possible way in an electric furnace. (**) Compared with the methods presented in the cited research, the EA-300 device is a fast and easy-to-identify chemical composition.
Table 2. The main characteristics of IZO-2.H resistance chamber furnace.
Value
The work temperature (°C)Max. 1100
The power of the furnace (kW)32
The power of heating elements (kW)32
Unit power(VAC)400
(Hz)50
Deviation from the rated temperature (°C)±10
The dimensions of the furnace’s chamber
l × d × h (mm)
1000 × 600 × 500
The furnace dimensions
l × d × h (mm)
1800 × 1120 × 1850
The weight of the furnace (kg)~800
Heating elements—6 pcs5333 W/230 V
Insulating elements
Ceramic fiber Alsiflex (°C)1260
CaSi plates (°C)1000
TC 26 (°C)1430
The maximum weight of batch (kg)250
Table 3. Definition of following heating steps.
Time (min)121623324460
Temperature (°C)EC Standard Fire Curve705.44748.15802.17851.43898.98945.34
Programmed Curve700750800850900945
Table 4. The basic properties of polymer AQUA-QUENCH® 320.
PropertiesTypical Value
The appearance of concentrateStraw-colored, semi-transparent
Specific gravity at 15.5 °C1.03
Kinematic viscosity590 mm2/s
pH (concentration 20%)9.1
Reframetric coefficient5.2
Disclaimer/Publisher’s Note: The statements, opinions and data contained in all publications are solely those of the individual author(s) and contributor(s) and not of MDPI and/or the editor(s). MDPI and/or the editor(s) disclaim responsibility for any injury to people or property resulting from any ideas, methods, instructions or products referred to in the content.

