Article

Tunability of Martensitic Transformation with Cohesive Energies for Fe80−xMnxCo10Cr10 High-Entropy Alloys

by
Yu Cao
1,
Xiaoliang Zhang
2,
Daoxuan Zhou
2,
Peng Wang
2,3,*,
Deng Pan
1 and
Hongtao Wang
4
1
Materials Genome Institute, Shanghai University, Shanghai 200444, China
2
Shanghai Institute of Applied Mathematics and Mechanics, Shanghai Key Laboratory of Mechanics in Energy Engineering, Shanghai Frontier Science Center of Mechanoinformatics, School of Mechanics and Engineering Science, Shanghai University, Shanghai 200072, China
3
Shanghai Institute of Aircraft Mechanics and Control, Zhangwu Road, Shanghai 200092, China
4
Institute of Applied Mechanics, Zhejiang University, Hangzhou 310027, China
*
Author to whom correspondence should be addressed.
Metals 2024, 14(6), 728; https://doi.org/10.3390/met14060728
Submission received: 8 May 2024 / Revised: 6 June 2024 / Accepted: 11 June 2024 / Published: 19 June 2024
(This article belongs to the Section Computation and Simulation on Metals)

Abstract

:
Multi-element alloys (e.g., non-equiatomic FeMnCoCr alloys) have attracted extensive attention from researchers due to the breaking of the strengthen-ductility tradeoff relationship. Plenty of work has been conducted to investigate the ingredient-dependent deformation mechanism in these alloys in experiments. However, the atomic simulations on such parameter-related mechanisms are greatly limited with the lack of the related interatomic potentials. In this work, two interatomic potentials are developed within the embedded atom method (EAM) framework for Fe80−xMnxCo10Cr10 high-entropy alloys. The tunability of the cohesive energy-related martensitic transformation (MT) mechanism was comprehensively investigated using molecular dynamics (MD) through a series of unilateral crack configurations with different twin boundary spacings (TBs). It is noted that the main deformation mechanism around the crack tip is transformed from a martensitic transformation to dislocation activities (dislocation or twin) with the variation of different cohesive energies between face-centered cubic (fcc) and hexagonal close-packed (hcp) phases. Additionally, the introduction of twin boundaries significantly enhances the strength and toughness of the alloys. The newly developed interatomic potentials are expected to provide theoretical support for the related simulations, focusing the martensitic transformation mechanism on high-entropy alloys.

1. Introduction

High-entropy alloys (HEAs) have attracted much attention for their unique strength and toughness behavior [1,2,3,4,5,6] with equal or near-equal atomic percentage. Moschetti et al. [1] designed a complex alloy with the composition of Ti55Zr30Ta6V5Fe2Cr2, and the strength was significantly improved after cold rolling. Li et al. [2] proposed the concept of metastable engineering, proving that it is possible for HEAs to have both high strength and high toughness. Miracle et al. [3] classified HEAs and explained the unique properties of different types of HEAs. Fotto et al. [4] prepared CoCrFeMnNi HEAs and found that within a certain temperature range, their strength and toughness increased with a decreasing temperature. Chen et al. [5] developed a eutectic HEA that effectively overcame the competitive relationship between strength and plasticity. Zhang et al. [6] systematically discussed the physical, chemical, and mechanical properties of HEAs, demonstrating their unique strength and toughness behaviors. FeMnCoCr high-entropy alloys, which were designed initially with an equiatomic ratio, exhibit limited plasticity in experimental studies [1,7]. Li Zhiming’s group took advantage of the metastability engineering strategy to design a non-equiatomic ratio Fe50Mn30Co10Cr10 metastable phase transformation-induced plasticity-assisted dual-phase alloy (TRIP-DP-HEA), achieving the combined increase in strength and toughness [2]. The presentation of the TRIP-DP-HEA concept significantly accelerates the related research. Li’s group further developed the FeMnCoCr high-entropy alloy with a new composition of Fe49.5Mn30Co10Cr10C0.5, which exhibits twinning and transformation-induced plasticity upon loading [8,9]. For TaHfZrTi HEAs, the stability of the parent phase is destabilized with the reduction of the Ta element, which leads to an enhanced ductility with a dual-phase microstructure [10,11]. Li Jia’s group [12] has found that the introduction of a hexagonal close-packed (hcp) phase in dual-phase FeCoCrNiMn HEAs is capable of promoting both the strength and ductility with molecular dynamic (MD) simulations. Zhao Min’s group [13] has found that both martensitic transformation (MT) and grain refinement play important roles in the strengthening effect in FeCoCrNiMn HEAs. For the FeMnCrCoC alloy, the variation of the deformation mechanisms with the concentrations of Mn and C is studied with the Fe-Mn-C MEAM potential [14,15,16].
It is noted that the limited interatomic potential of the non-equiatomic ratio Fe80−xMnxCr10Co10 metastable TRIP-DP-HEA has been developed because of the high difficulty in developing interatomic potentials with MT processes. Recently, our group has developed one potential for Fe50Mn30Cr10Co10 HEAs [17], which can well describe the phase transformation process of from face-centered cubic (fcc) to hcp phases. It has been reported that the cohesive energy has a significant influence on the deformation mechanism of MT processes [18]. However, the influence of cohesive energies on the deformation mechanism of current alloy systems remains blurred. In order to systematically study the deformation mechanism of FeMnCoCr HEAs, two interatomic potentials are additionally developed in this work for Fe80−xMnxCo10Cr10 TRIP-DP-HEA (x = 35 and 40) using the meta-atom method [19], with the tuning of the cohesive energy difference between the fcc and hcp phases. The fitted physical parameters are consistent with the target values calculated by our research group’s density functional theory (DFT) calculations [17]. In summary, by adjusting the cohesive energy difference, the adjustability of its deformation mechanism was studied by tensile testing in MD simulations. The results show that the main deformation mechanism around the crack tip changes from martensitic phase transformation to twinning deformation and finally to dislocation activity. In addition, the introduction of twin boundaries can simultaneously improve the strength and toughness of the FeMnCoCr series of high-entropy alloys. This work can provide a theoretical basis for the study of cohesive energy during deformation and expand the research scope of this series of alloys.

2. Method and Simulation Details

2.1. EAM Potential Optimization

The interatomic potentials are developed within the EAM framework and meta-atom assumption. The meta-atom method proposed by Wang et al. [19,20,21] has repeatedly shown its advantage in the description of MT processes and the related deformation mechanisms. In this approach, the complex alloy system is represented by a set of interatomic atoms which directly fitted the physical properties of alloys from experiments [19]. One interatomic potential has been developed recently for Fe50Mn30Cr10Co10 HEA with a positive cohesive energy difference ( E f c c h c p = 71   m e V / a t o m ) between the parent and martensite, which leads a fast MT process upon loading. In this work, the energy difference between the dual-phase is set as 0 meV/atom and −50 meV/atom to investigate the tunability of deformation mechanisms with cohesive energy differences, which are set for the composition of Fe45Mn35Co10Cr10 and Fe40Mn40Co10Cr10, respectively. The total energy (E) of the obtained potential function within the EAM framework is expressed as:
E = i N F ρ i + 1 2 i j N ϕ i j r i j
where F ρ i is the embedding energy of atom i embedded into the matrix composed of other atoms, ρ i is the local electron density summation of other atoms in system at the position of atom i, ϕ ij is the pair potential function between atoms i and j, and r ij represents the relative distance between i-j atoms. The specific form of F ρ i is stated as,
F ρ = a 1 ρ + a 2 ρ 2 + a 3 ρ 4 + a 4 ρ a 5 2 H ρ a 5
The pairwise function ϕ ij is obtained by the summation of the polynomial terms,
ϕ r = i = 0 2 b i r i H r 0 r + H r r 0 i = 1 7 p = 3 5 c i , p r i r p H r i r
In the formula, H(r) is the Heaviside function and a i , b i , and ci,p are the fitting coefficients. Both potentials have the same cut-off radius of 6.0   .

2.2. Molecular Dynamic Simulation Details

Five configurations with different twin boundary (TB) spacings (defined as λ) and a unilateral crack (width: 2 nm) were constructed to investigate the tunability of deformation mechanisms with the variation of cohesive energy differences. Three interatomic potentials with different cohesive energy differences ( E f c c h c p ) of 71 meV/atom, 0 meV/atom, and −50 meV/atom were adopted in this work, which are denoted as Potential I, II, and III in this work. The unilateral crack was introduced in models as a trigger to emit dislocations or nucleate the martensitic transformation processes. The crystallographic orientations are set as x- [ 11 2 ¯ ] , y- 111 , and z- [ 1 1 ¯ 0 ] . This crystal orientation is selected in this work to ensure that two possible slip-systems could be activated upon loading. In addition, the twin boundary could be easily placed on the y-plane. For the model with a perfect lattice (Figure 1a) and the model with a twin lamella of 10 nm (Figure 1b), the dimensions of the models are 80 nm × 40 nm × 2 nm. For the models with λ = 20 nm, 30 nm, and 40 nm (Figure 1c–e), the lengths of the y-[111] dimension are set as 50 nm, 60 nm, and 70 nm, respectively. Periodic boundary conditions were applied in the y and z directions, while the free boundary condition was used in the x direction. The models were elongated along the y direction with a maximum strain of 20% to study the deformation mechanisms. For the MD simulations, the input parameters include the initial structure of the simulation, interatomic potential, temperature and pressure, time step, and boundary conditions. The output parameters include the interaction force between the atoms, microstructure evolution, and crack propagation. All simulations were performed using the Nosé–Hoover temperature thermostat [22] with a fixed time step of 1 fs. MD simulations were performed using the open-source package Large-Scale Atom/Molecular Massively Parallel Simulator (LAMMPS) (31 March 2017) [23]. Visualizations of the simulation results were achieved with the Ovito software (Version 3.10.0, 28 December 2023). [24], while the Common Neighbor Analysis (CNA) method [25] was used to identify the atomic microstructure.

3. Results and Discussion

3.1. Potential Optimization

Two interatomic potentials were developed in this work based on our previous work [17] for Fe80−xMnxCo10Cr10 (x = 35, 40) TRIP-DP-HEA. Table 1 summarizes the physical properties and the fitted values predicted by the newly fitted potentials and the previous results [17]. It is noted that the key difference between the potentials is the cohesive energy differences ( E f c c h c p ) between the fcc and hcp crystals. For Potential I, a relatively larger E f c c h c p (71 meV/atom) suggests that the martensitic transformation mechanism is the main deformation mechanism upon loading [17], whereas the E f c c h c p is set as 0 meV/atom and −50 meV/atom for Potential II and III to systematically study the tunability of cohesive energies on the deformation mechanisms of Fe80−xMnxCo10Cr10 TRIP-DP-HEA.
Figure 2a,b display the fitted F(r) and ϕ(r) functions of Potential II (left column) and III (right column). The specific forms of the embedding and pairwise functions are stated in the Equations (2) and (3). For the pairwise function ϕ(r), it is a 5th-order spline function with eight nodes. The cut-off radius is set as 6.0 Å for both potentials. The arrangement of the knots and the fitted parameters are listed in Table A1 and Table A2, respectively. The simulated Rose’s equation for the fcc phase is plotted in Figure 2c, suggesting that the potentials are capable of describing the phase stability of the fcc crystal. The stability of the hcp phase is guaranteed with the predicted energy landscape (Figure 2d) with different c/a and Wigner–Seitz radii. The cohesive energies of the hcp phase and the corresponding energy differences are labeled with the black solid lines in Figure 2c. All potentials applied in this work (Potentials I, II, and III) are provided in the online Supplementary Materials.
Based on the previous experiments conducted in L.W. Meyer’s group [30], dislocation gliding is the main deformation mechanism when the stacking fault energy (SFE) is greater than 45 mJ/m2. The stacking faults and twins start to dominate the deformation when the SFE is greater than 18 mJ/m2 and less than 45 mJ/m2. For the cases with a SFE level lower than 18 mJ/m2, the MT process becomes the key deformation mechanism upon loading. In this work, the corresponding stacking fault energies are −385 mJ/m2, 16 mJ/m2, and 301 mJ/m2 for Potentials I, II, and III, respectively. This suggests that the dominant deformation mechanisms predicted with different potentials will be significantly different to each other, which will be discussed in the next section.

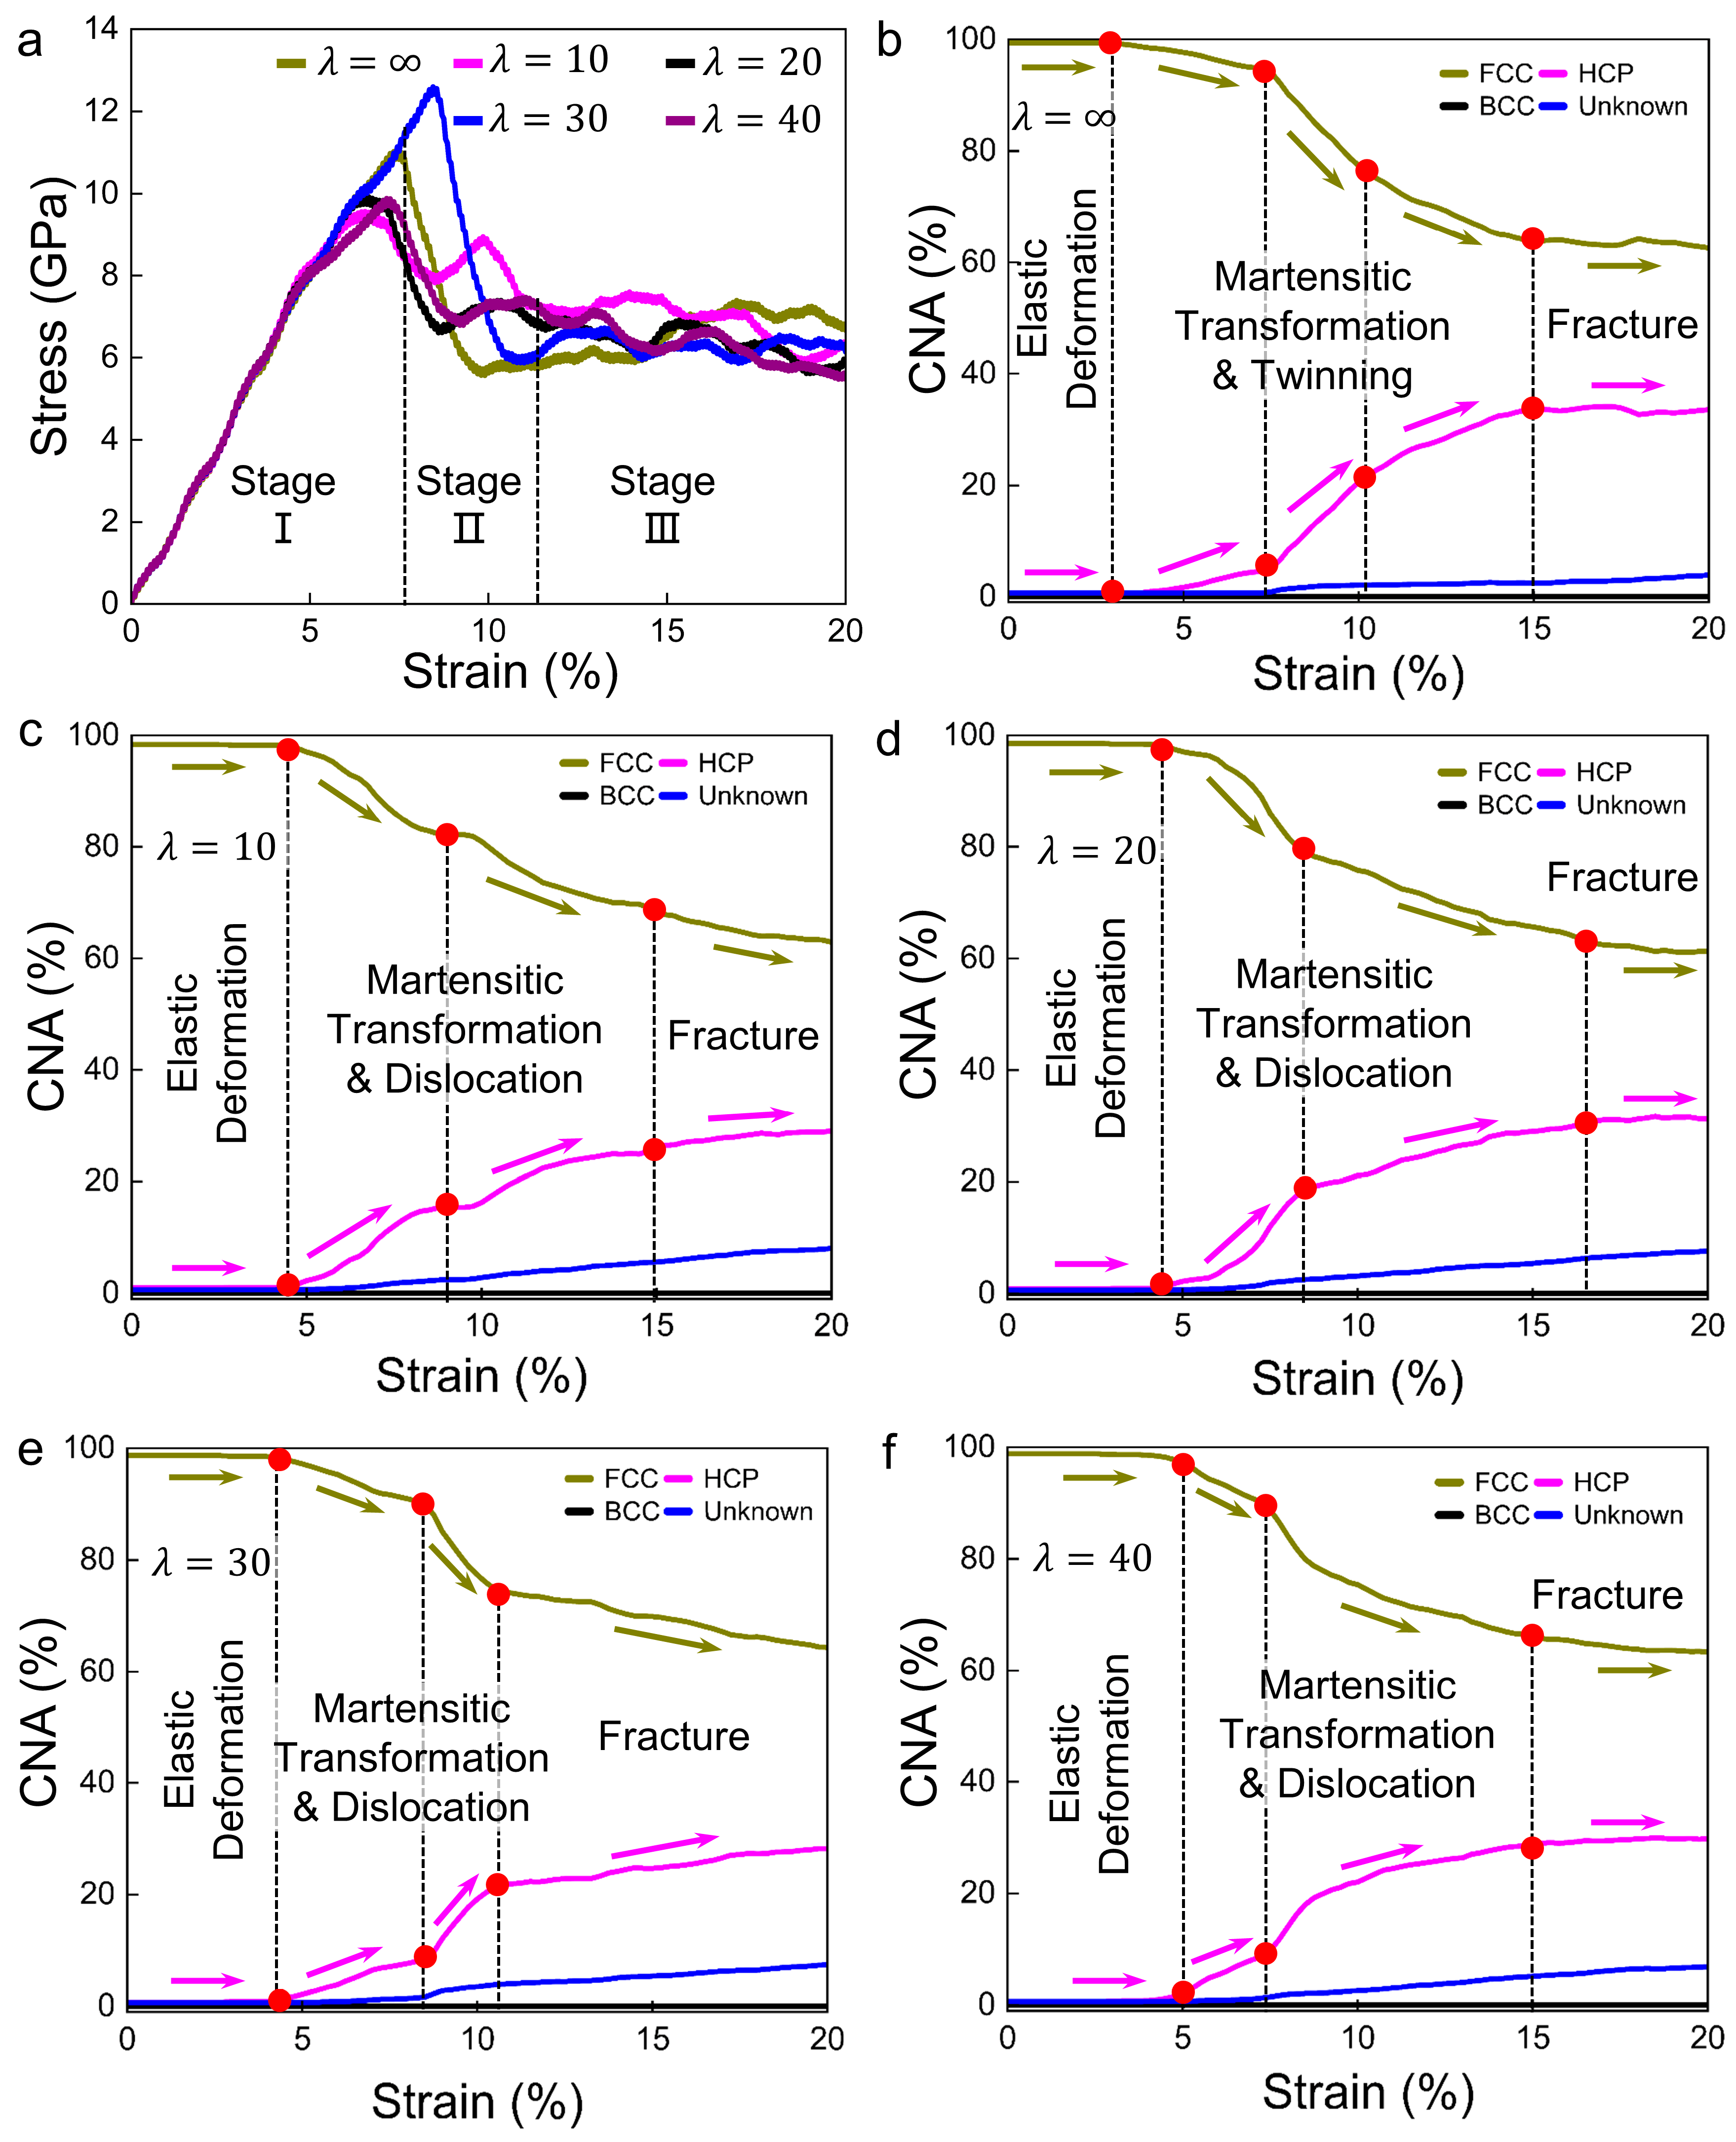
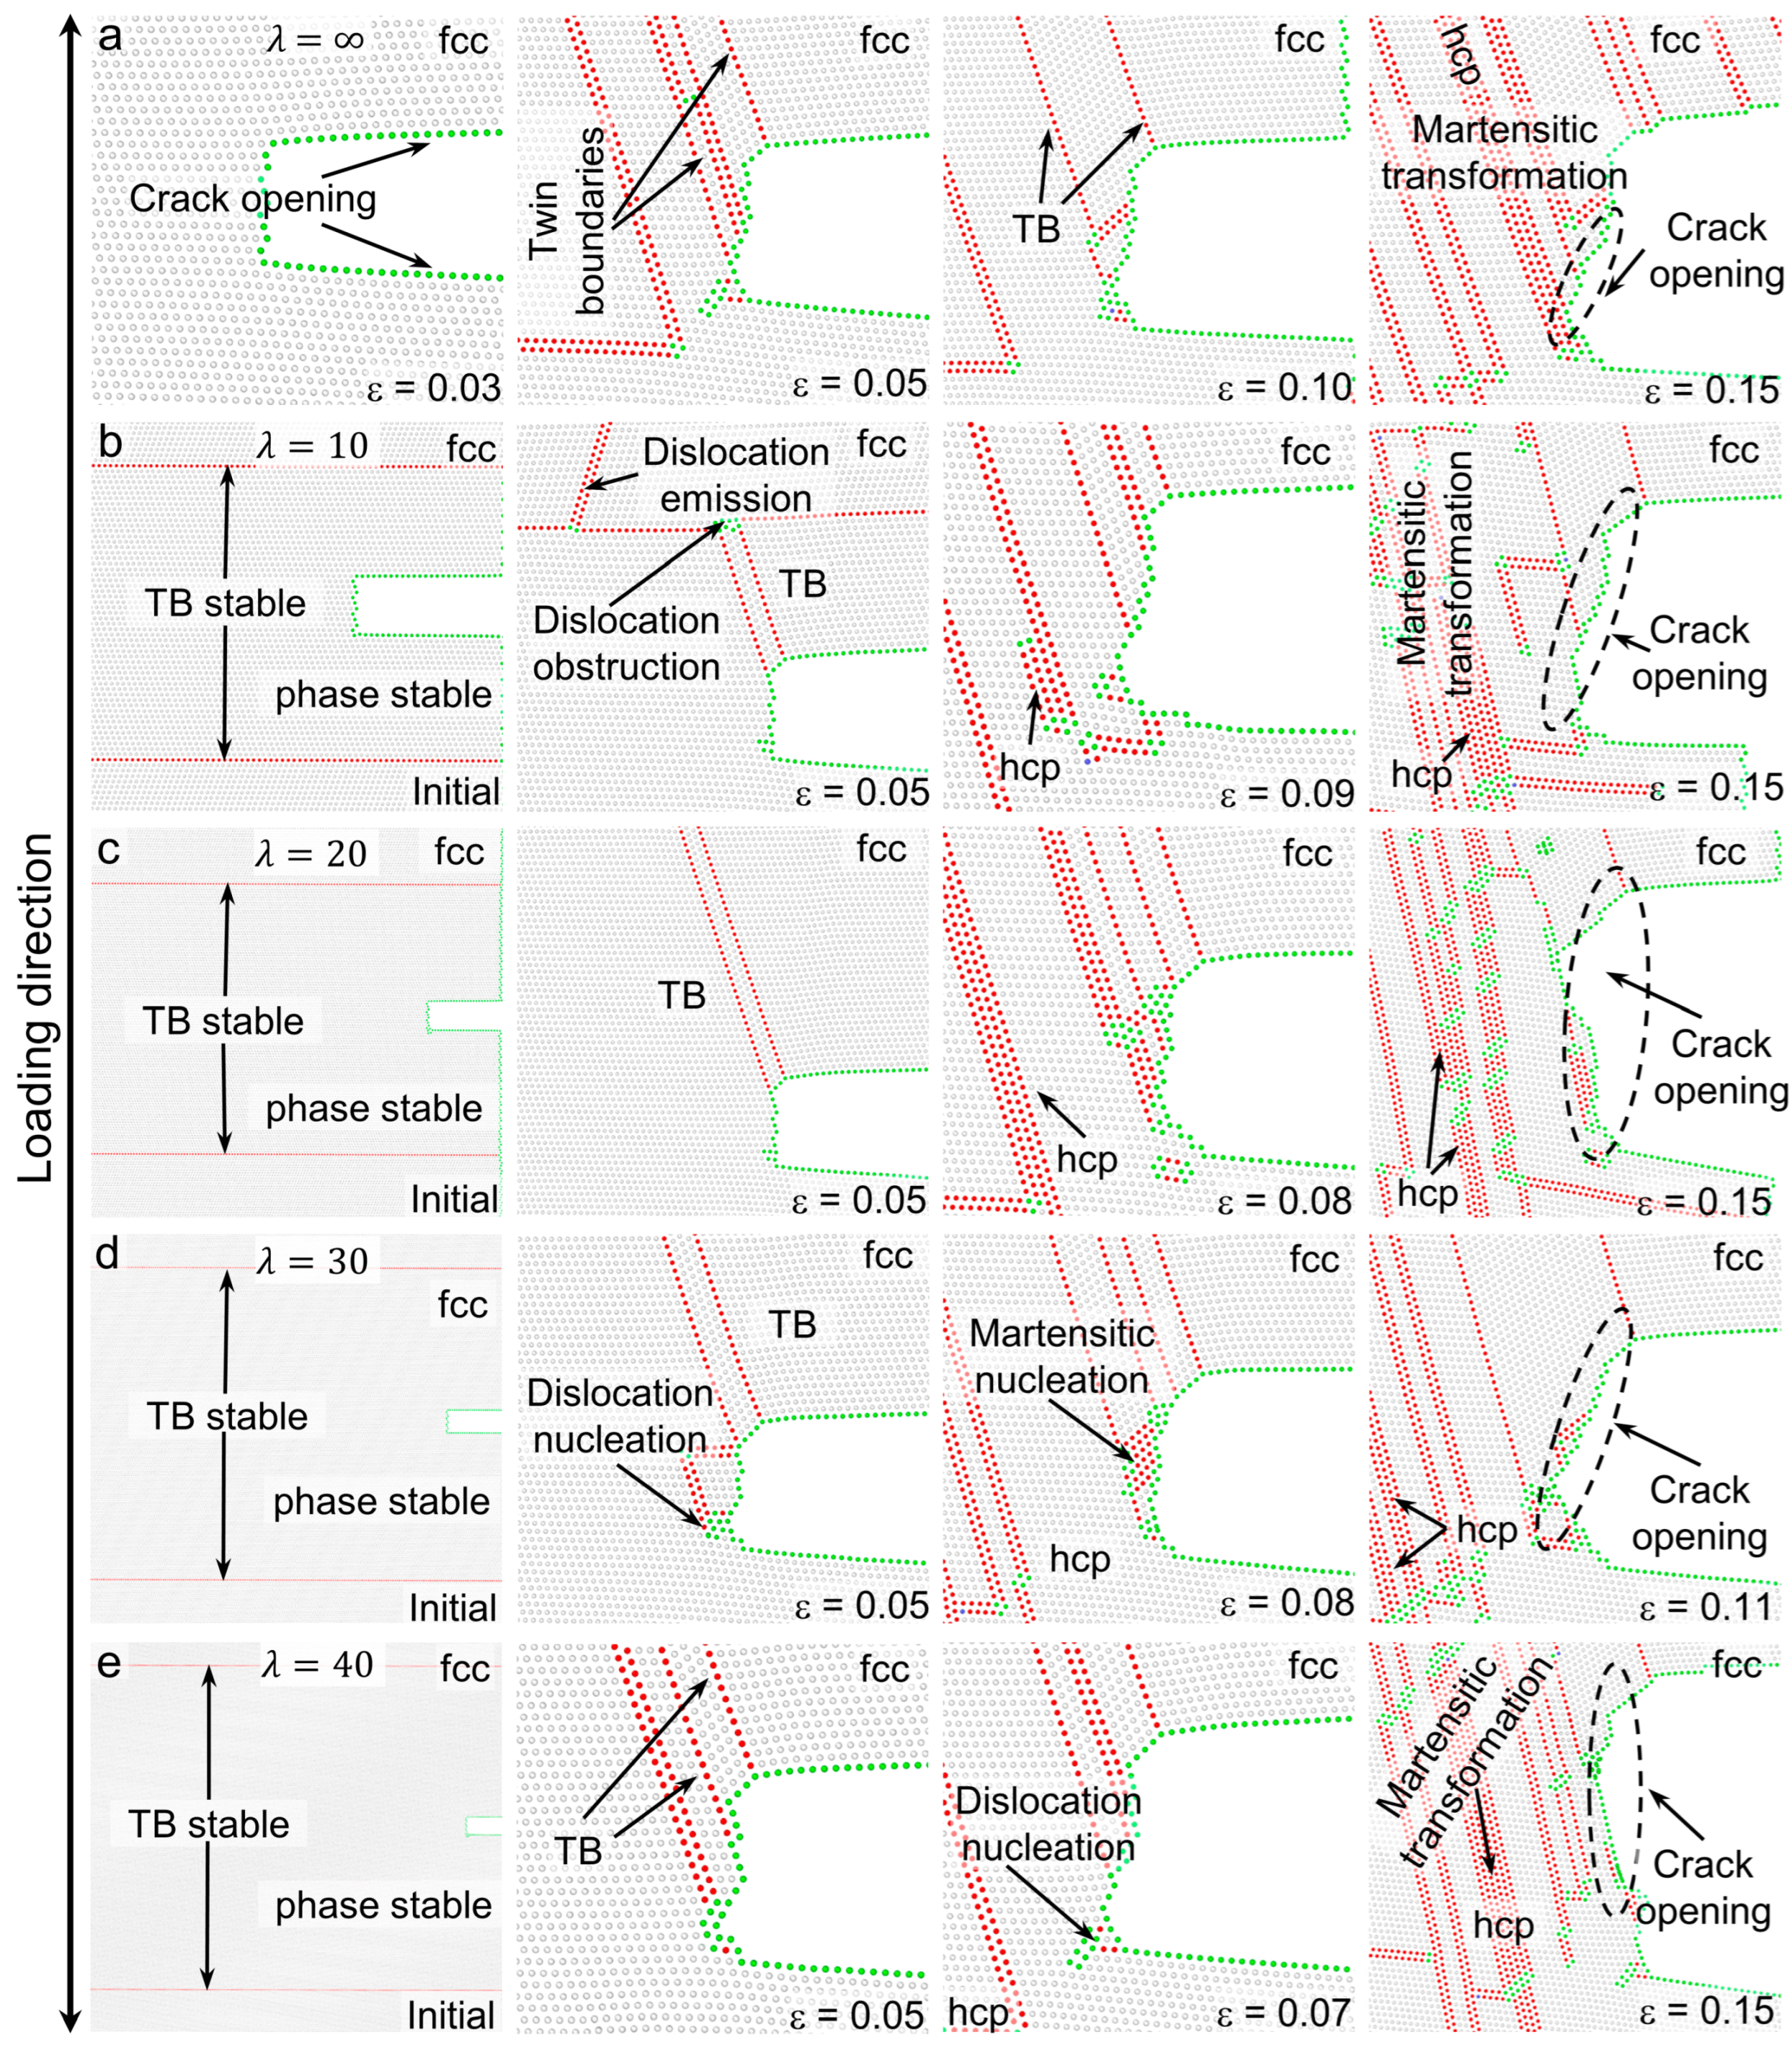
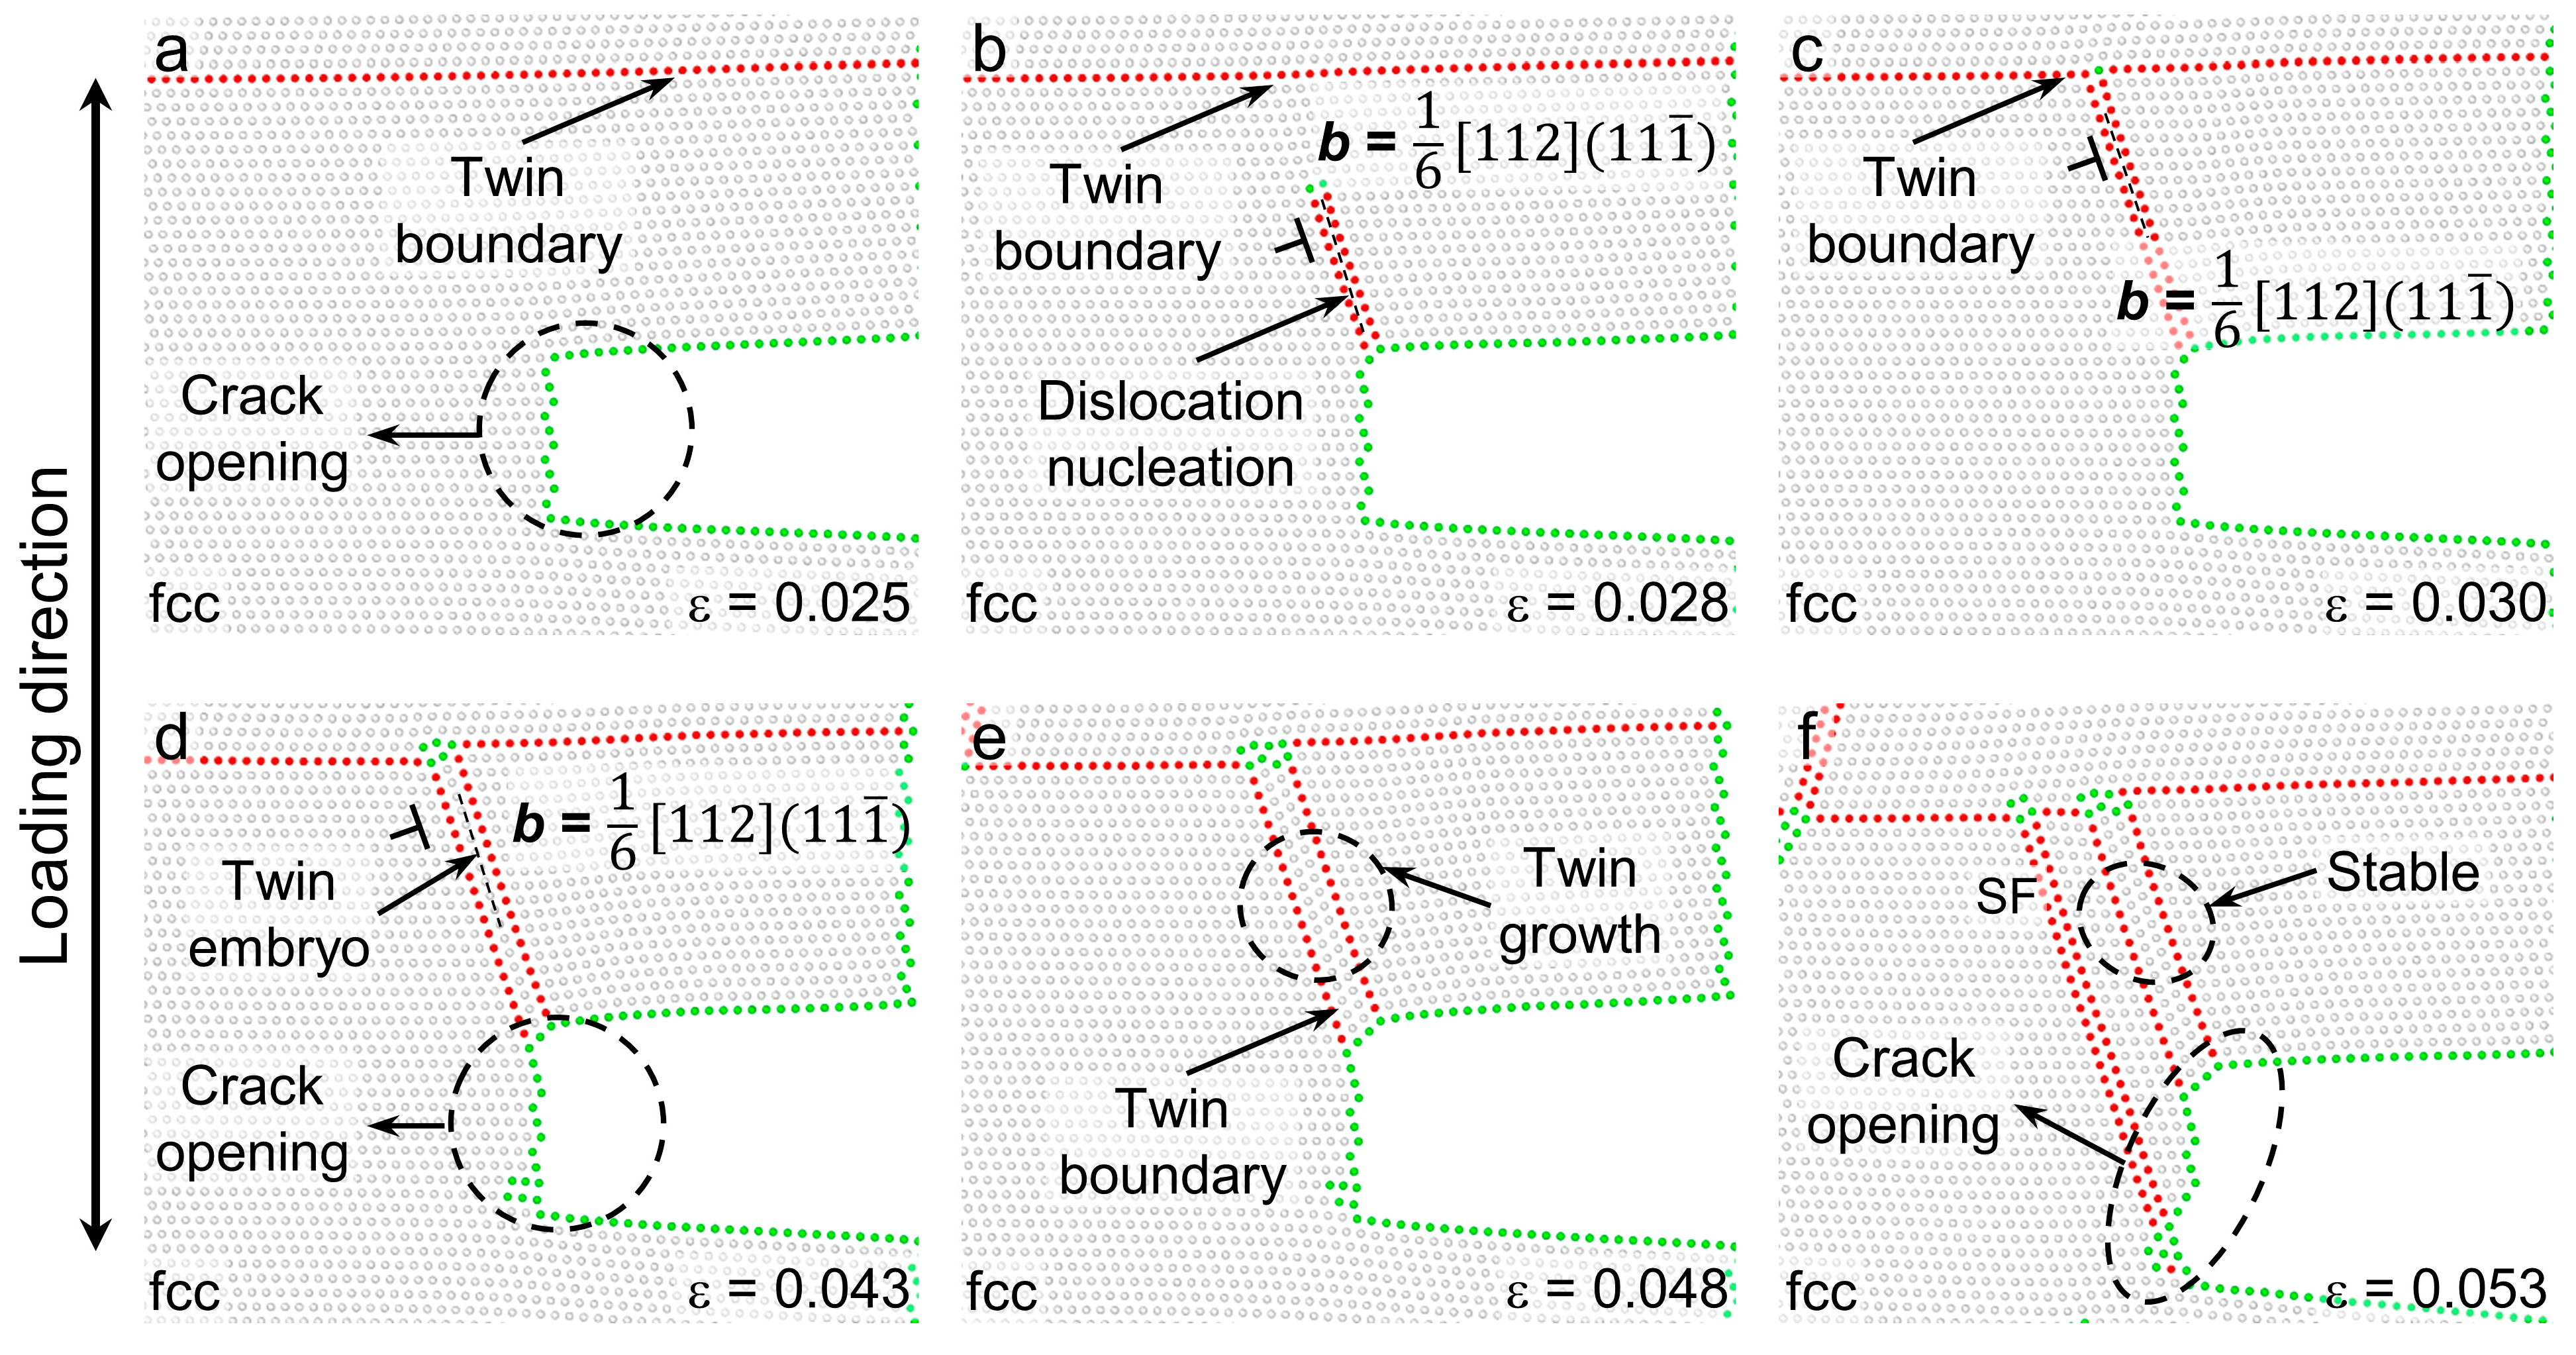
3.2. Deformation Processes for Models with E f c c h c p of 71 meV/atom

In order to characterize the effect of cohesive energy on the deformation mechanism, y-axis tensile tests were performed using Potential I ( E f c c h c p = 71 meV/atom) for configurations with different TB spacings and a unilateral crack. Figure 3a displays the related stress–strain curves, which are roughly divided into four stages as shown by the dotted lines in the figure according to the approximate elastic deformation and plastic deformation. Figure 3b–f show the evolution processes of the fractional phase content of the fcc, hcp, bcc, and unknown structures for configurations with different TB spacings. It is noted that the dominant deformation mechanism is the MT process from the fcc to hcp structures in all simulations with Potential I. It can be seen that the TB spacing has no significant impact on the alloy deformation mechanism at this time, and only affects the strength and toughness of the alloy (Figure 3c–f). In the elastic deformation, the configuration with λ = 10 nm exhibits the largest Young’s modulus and the highest strength, which is consistent with the previous report [31]. The elastic deformation in the configuration with λ = 20 nm presents the secondary Young’s modulus. For the configurations with larger twin spacings (λ = 30, 40 nm) and perfect lattices, the measured moduli are basically the same, but the perfect lattice exhibits a relatively larger yield stress. After yielding, all models undergo fast MT processes from the fcc to hcp phases, which are shown in Figure 3b–f. It is interesting to notice that the existence of twin boundaries significantly accelerates the MT processes around the crack tip upon loading (Figure 3c–f), which is due to the stress concentration from the confined effect of the twin structures.
Figure 4 shows the snapshots of the MT processes around the crack tip upon loading. The martensitic nucleus of the perfect lattice (Figure 4a) locates at the corner of the square crack tip which has the largest stress concentration level. This feature lays the foundation for the unidirectional martensitic structure in the perfect lattice and the postponement of the stress peaks in the deformation. For the twin configurations, the martensite nucleates near the crack tip after the relaxation, which leads to various crystalline directions (Figure 4b–e) in the proceeding MT processes. The difference in the crystalline structures is also responsible for different completion degrees of MT processes (~10%). For all models, the deformation twinning is frequently observed in the simulations (Figure 4) to accommodate the plastic deformation between the martensite. After the MT processes, the stress starts to increase for the second time because of the strengthening effect from the martensite (Figure 3a). Finally, the crack tip starts to propagate at the strain levels of ~0.18, which is indicated with the black circles in Figure 3b–f as the increase in the unknown structures. The entire deformation process is dominated by martensite, which is consistent with our previous simulation results [17]. A small portion of atoms are labeled as the bcc phase due to the complex stress field of the crack tip. However, the bcc phase will quickly transform into the stable hcp phase due to the relatively lower cohesive energy.

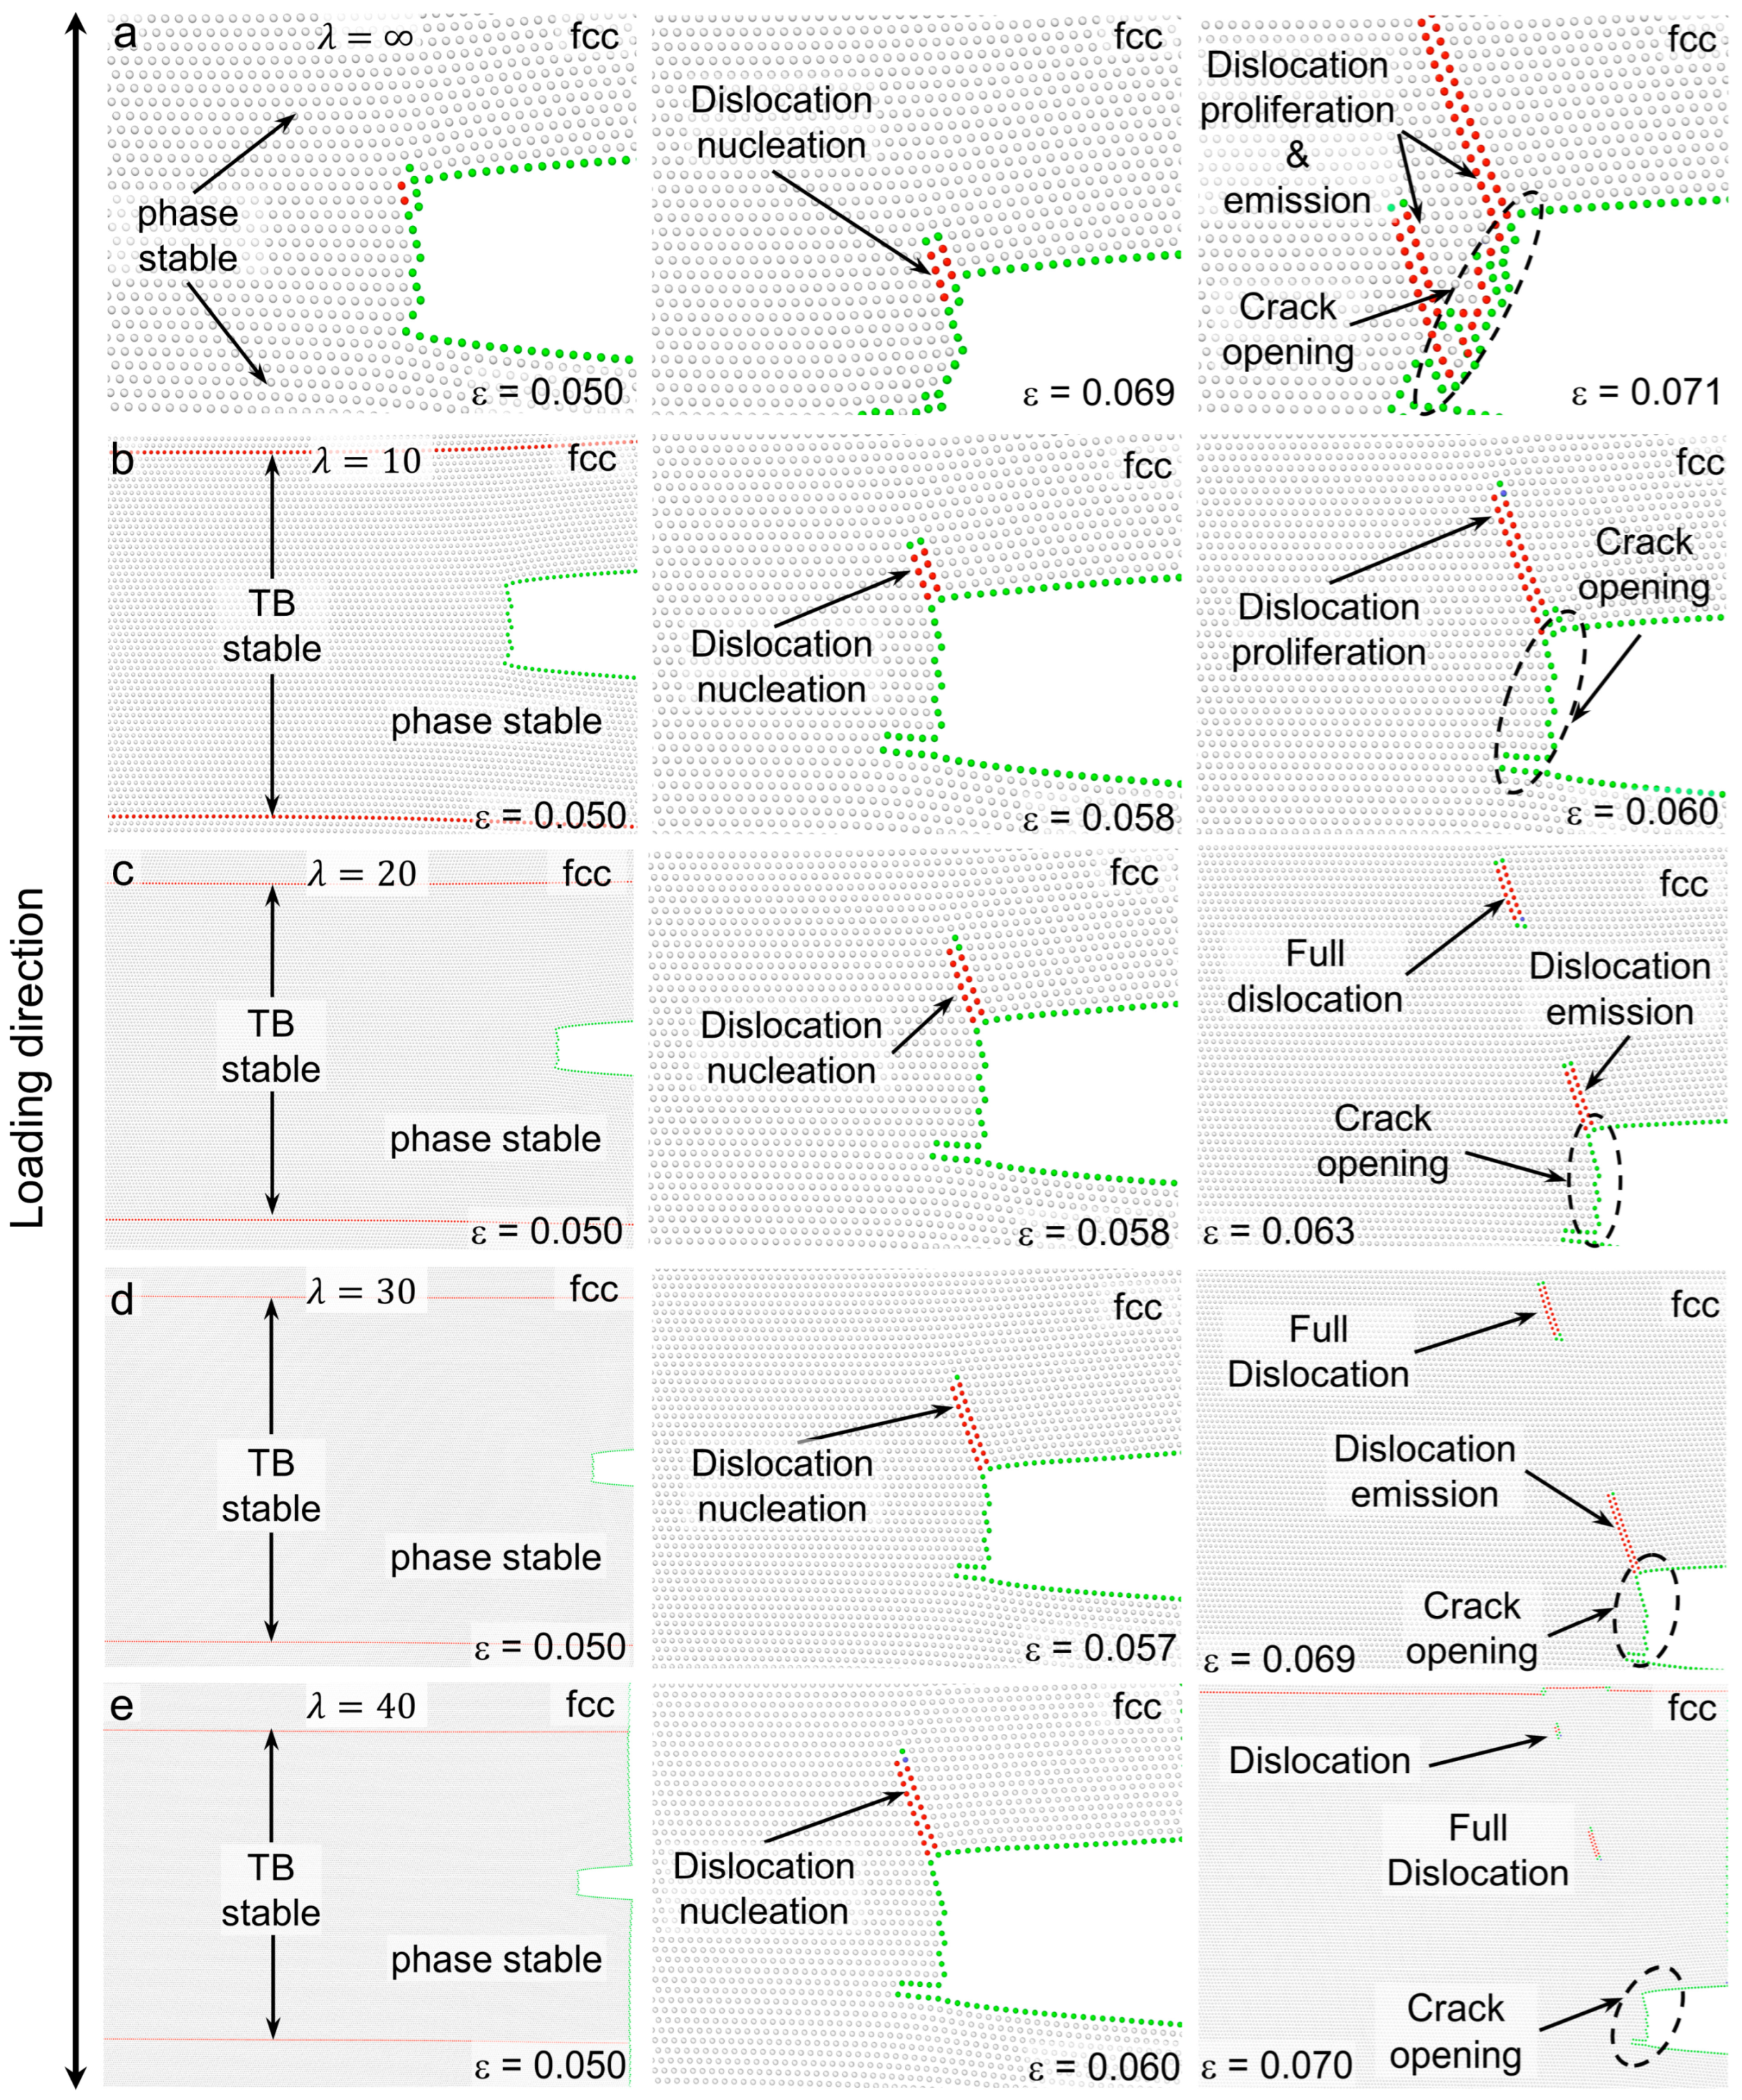
3.3. Deformation Processes for Models with E f c c h c p of 0 meV/atom

The y-axis tensile tests were performed on the perfect lattice and the configuration with twin lamellae using the newly developed Potential II ( E f c c h c p = 0 meV/atom). Figure 5 and Figure 6 exhibit the stress–strain relationship, fractional phase content evolutions, and corresponding snapshots in the deformation processes. In our simulations, the main deformation mechanism simultaneously possesses dislocations, twins, and MT due to the equivalent cohesive energy between the parent and martensitic phases. Similar to Potential I, the TB spacing does not affect the alloy deformation mechanism. The stress–strain relationships of five configurations upon loading are shown in Figure 5a. The phase content percentage evolution curve is roughly divided into several stages as shown by the red dots in the figure according to the stages of configuration stability, elastic deformation, crack expansion, and plastic deformation. The presence of analogous elastic deformation processes (stage I) implies an identical Young’s modulus across all models. Nevertheless, the configuration with a λ value of 30 nm displays the highest ultimate stress at 12.6 GPa, closely followed by the perfect configuration. In the yielding processes (stage II), the massive emissions of the dislocations and twining consume the stored elastic energy, leading to the sudden drop in the stress levels. Subsequent to yielding, all models demonstrate a comparable flowing stress of approximately 7 GPa, indicating similar deformation mechanisms.
Figure 6 shows the snapshots of microstructural evolutions in deformation around the crack tip. For the perfect configuration, the deformation process consists of elastic crack opening, dislocation emission, the formation of deformation twinning, and subsequent plastic crack opening with a partial martensitic transformation (Figure 6a). A comparable deformation mechanism is observed in twin configuration, as both models showcase a similar stress–strain relationship during loading (Figure 5a). Nevertheless, the pre-set twin boundary demonstrates its ability in impeding the gliding of dislocations emitted from the crack tip (Figure 6b). It is noted that the martensitic transformation processes are no longer the main deformation mechanism with the reduction in the cohesive energy difference E f c c h c p from 71 to 0 meV/atom, implying its significance in determining the deformation mechanism [32].
The detailed mechanisms of the dislocation emission and twin growth processes during deformation are depicted in Figure 7. One partial dislocation with a Burgers vector of 1 6 [ 112 ] is emitted from the crack tip, gliding on a ( 11 1 ¯ ) plane, which is shown in Figure 7b. The dislocation is blocked by the pre-set twin boundary ahead shortly after its nucleation (Figure 7c). At the strain level of 0.043, a subsequent twin dislocation is emitted from the crack tip on the adjacent ( 11 1 ¯ ) plane, giving rise to the formation of the twin embryo (Figure 7d). At the crack tip, the extreme inhomogeneity of the stress field leads to the microcracks detected in Figure 7. However, these microcracks will gradually disappear due to their instability. With the increase in the external applied stress, the twin embryo is transformed into a four-layer twin structure afterwards. This process is repeated in the proceeding deformation with more partial dislocation emitted from the crack tip (Figure 7f).

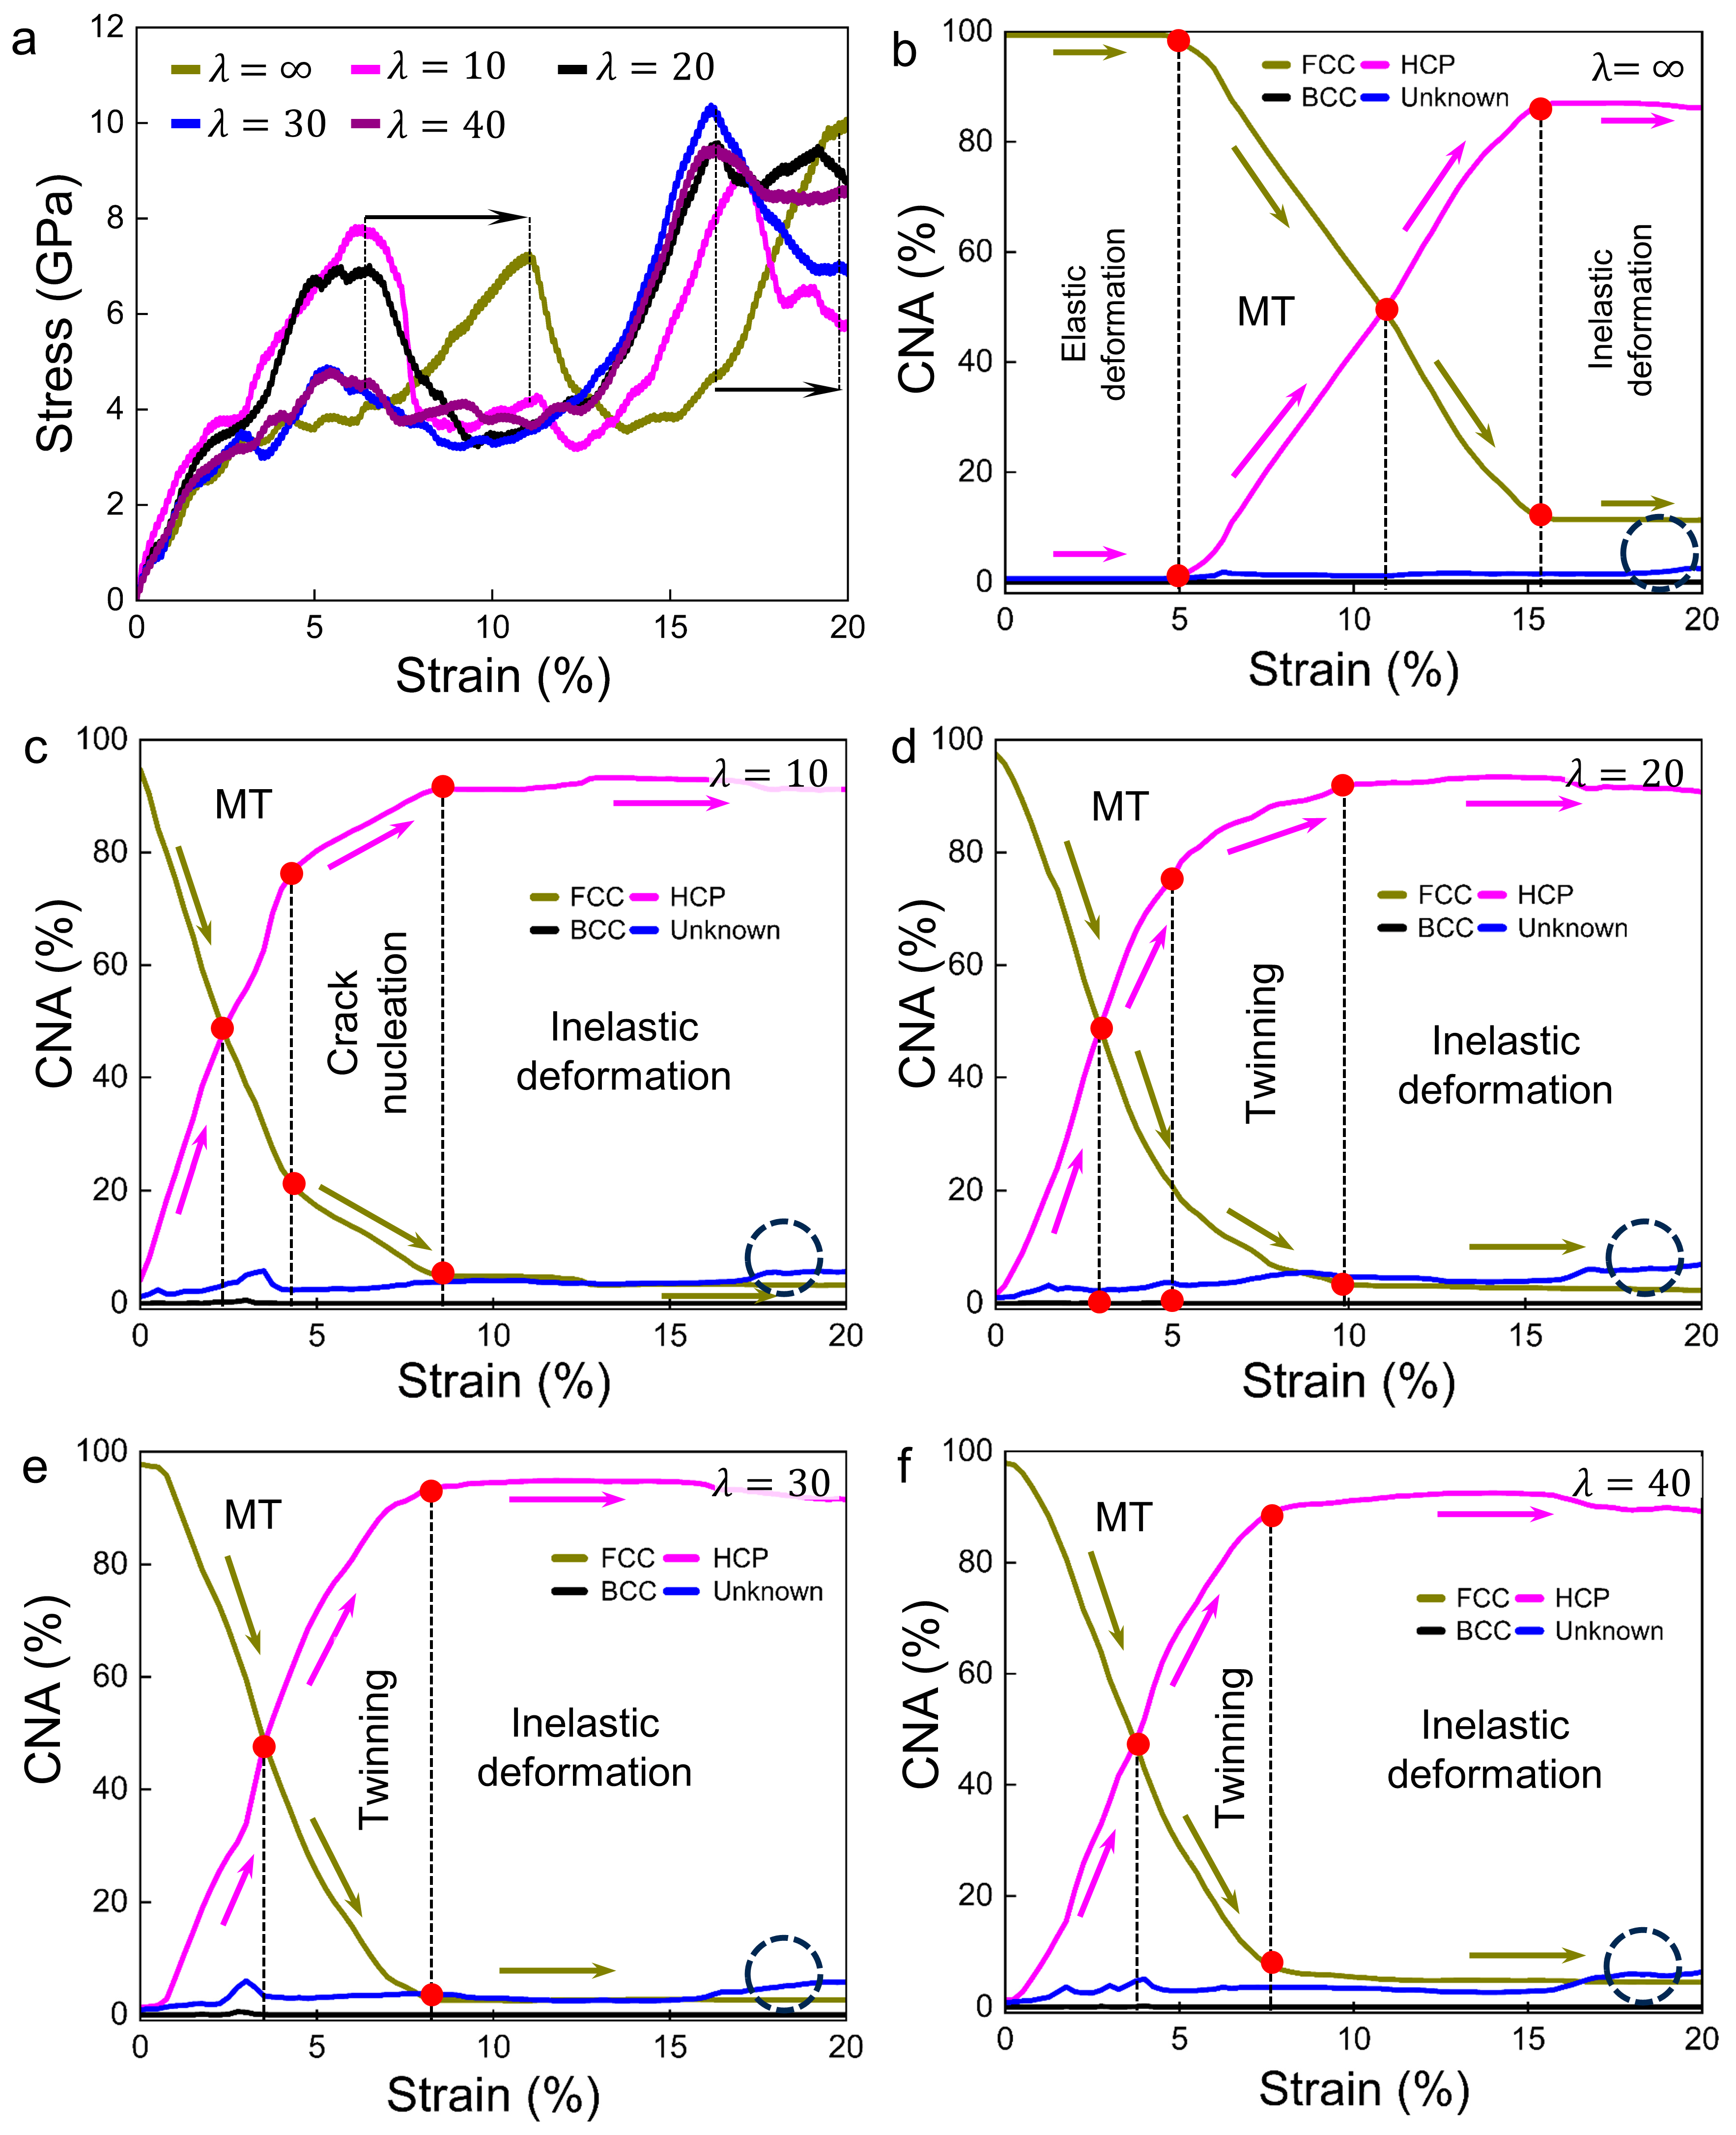
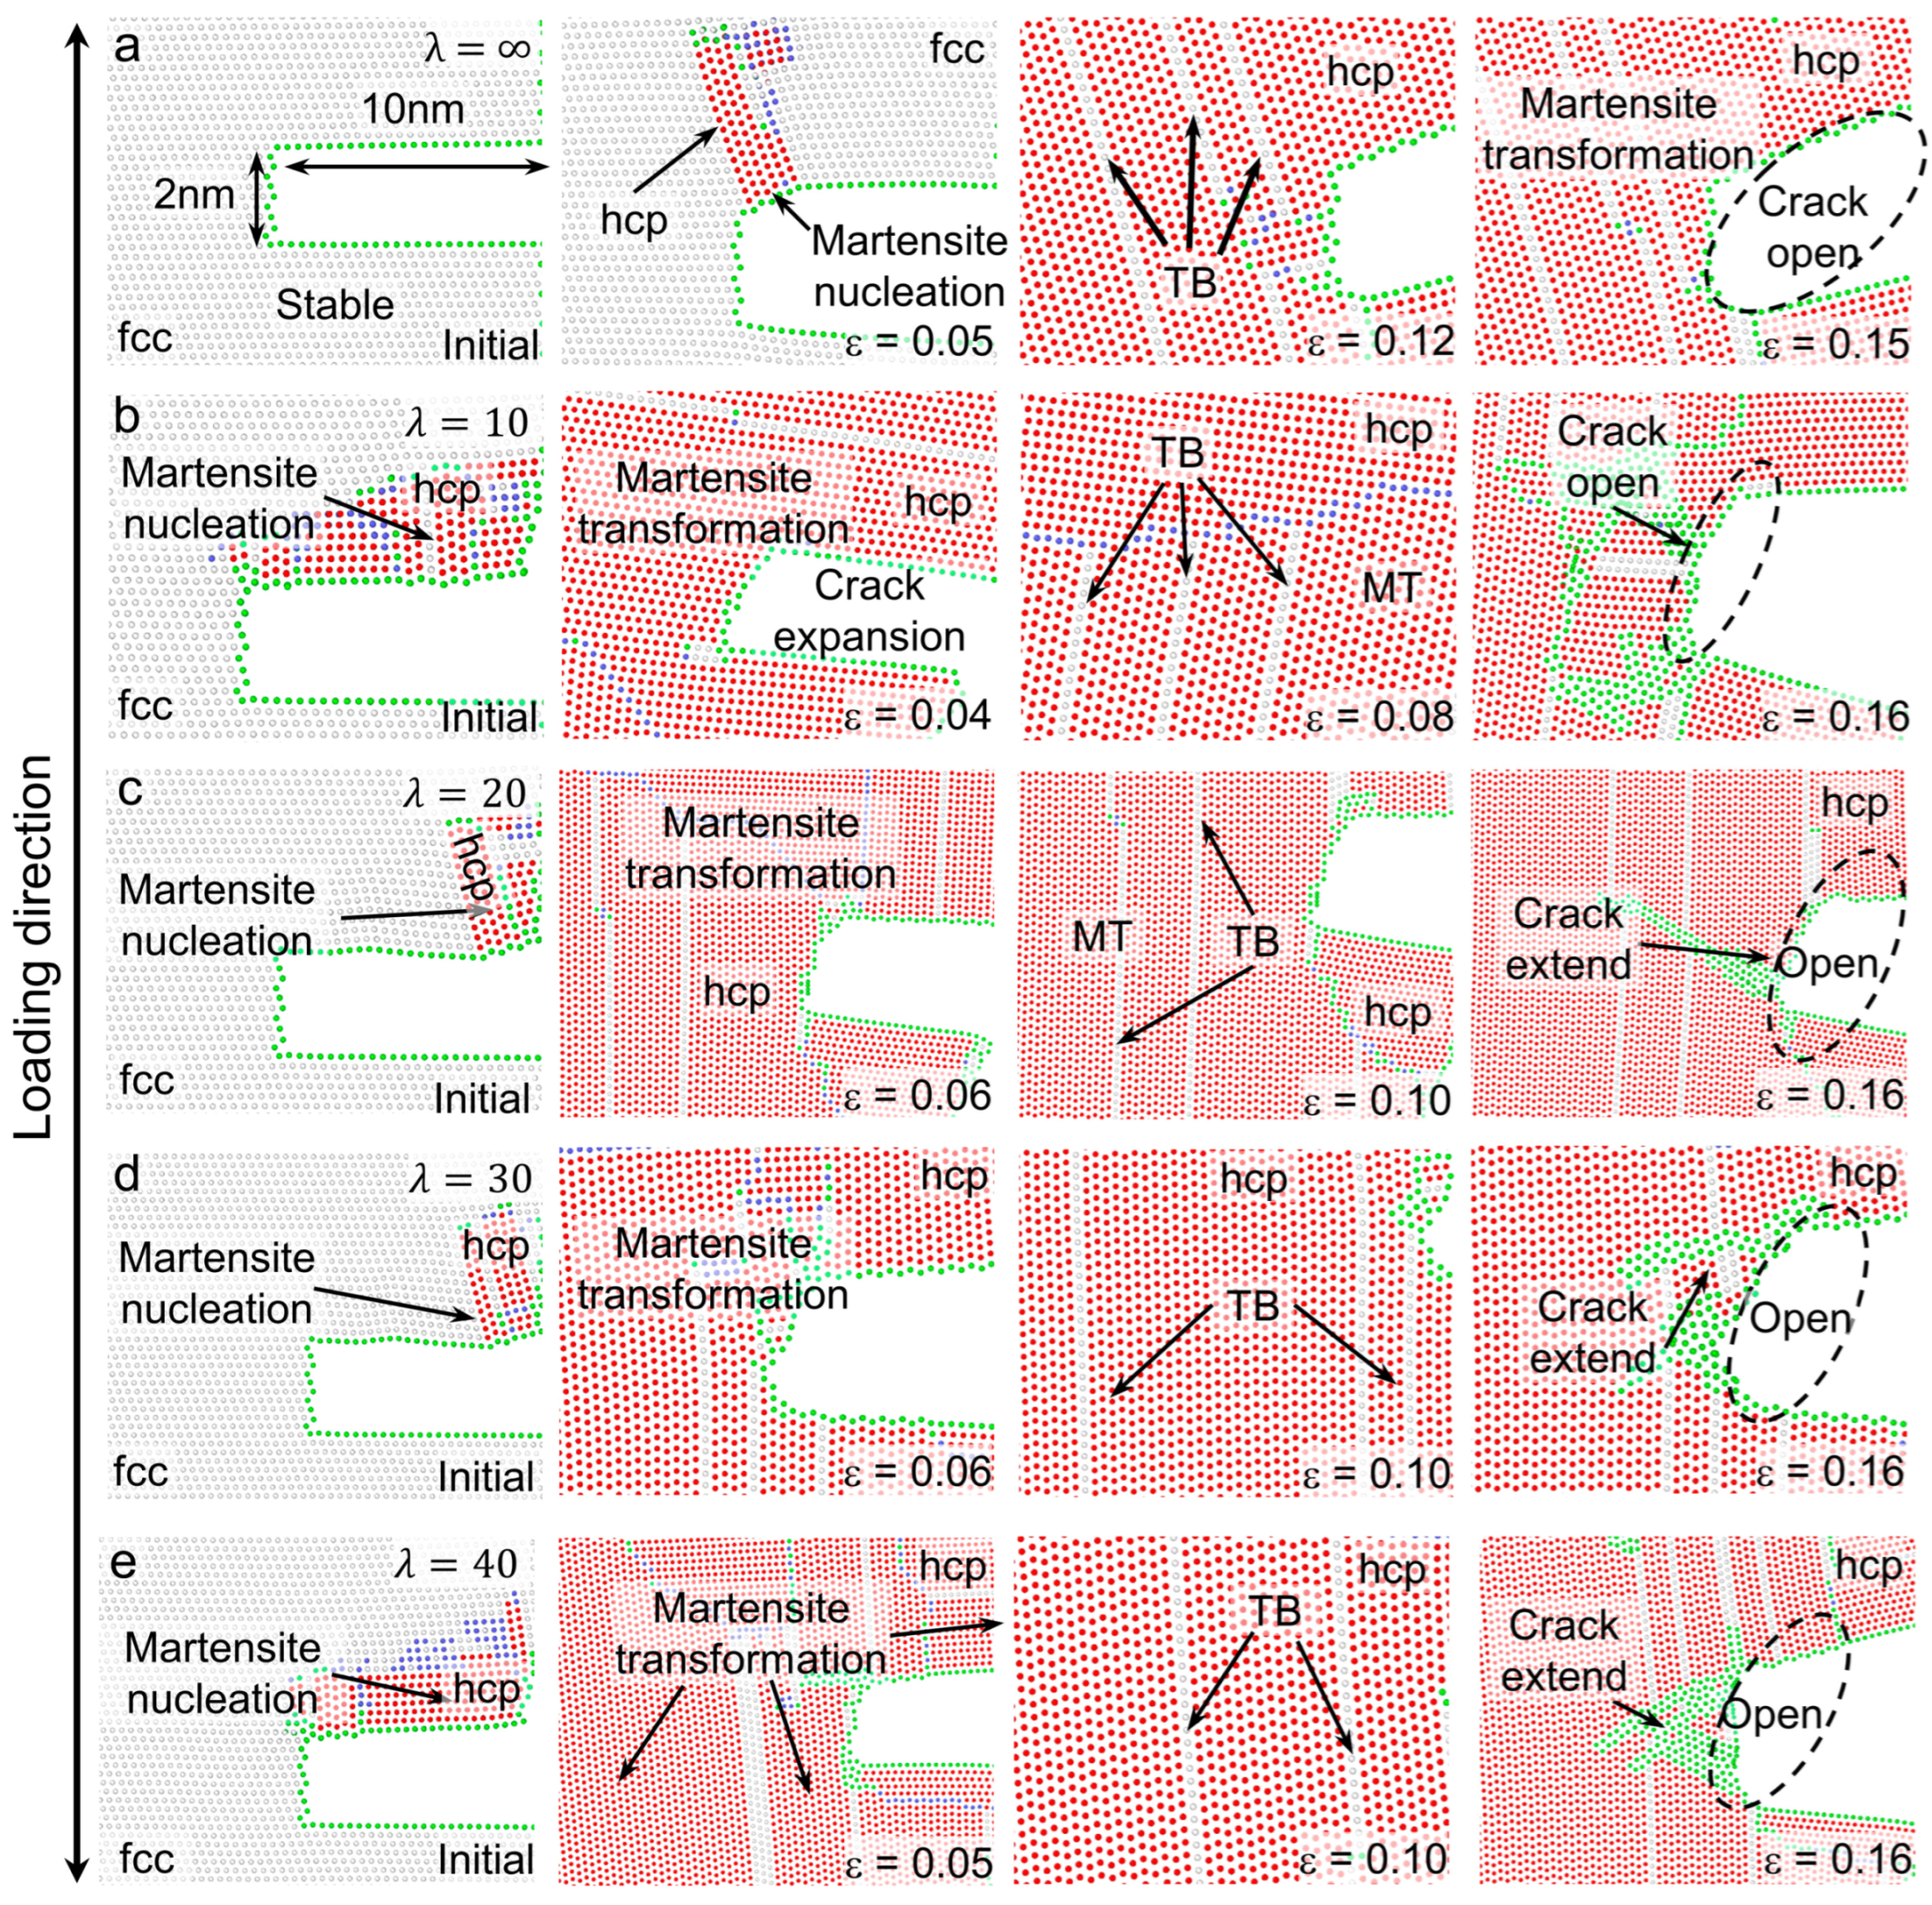
3.4. Deformation Processes for Models with E f c c h c p of −50 meV/atom

The stress–strain relationships and the phase content evolutions predicted with Potential III are shown in Figure 8. The atomic configuration is subjected to the y-axis tensile test, and the tensile deformation process can be easily divided into two stages. In the first stage, multiple plastic deformation steps are observed due to the emission of a series of dislocations on one slip plane at the crack tip. After yielding, a large number of dislocations are emitted in models, which consumes the stored elastic deformation energy and leads to the fast stress drops. The detailed deformation mechanisms are depicted in Figure 9 for all models. It is noted that the dislocation activity is the only deformation mechanism for all models up to the strain level of 0.07, and TB spacing has no obvious effect on the alloy deformation mode, which is determined by the relatively lower energy difference ( E f c c h c p = 50   m e V / a t o m ) between the fcc and hcp phases and the relatively larger stacking fault energy ( γ s f = 301   m J / m 2 ). Full dislocations with a Burgers vector of 1 / 2   [ 101 ] are emitted from the crack tip, gliding on a ( 11 1 ¯ ) plane, which is shown in Figure 9a–c. For the models with larger twin lamellae, two or more dislocations are emitted, gliding on the same ( 11 1 ¯ ) plane (Figure 9d,e). The emitted dislocations are impeded by the pre-set twin boundaries, which leads to the cross-slipping on the twin plane or penetration through the twin boundary.
Figure 10 displays the overall snapshot of the configuration with a twin spacing of 20 nm at the strain level of 0.10. It is worth noting that dislocations emitted from the crack tip and twin boundaries are the primary deformation mechanism upon loading. Nevertheless, a small secondary twin variant is also observed at the crack tip, which is partially due to the strong restriction from the periodic boundary condition in the z-direction and quasi-2D configuration.
Compared to the variation of the twin spacing λ, the cohesive energy difference between the parent and martensitic phases ( E f c c h c p in this work) is the key parameter affecting the primary deformation mechanism upon loading and, subsequently, the measured yielding stresses. Figure 11 summarizes the variation in the yield stresses and the twin spacing λ for the three potentials. For Potential I, the MT processes could be easily triggered with the positive cohesive energy difference of 71 meV/atom, indicating a comparatively lower yield stress. Conversely, the primary deformation mechanism is dislocation and twinning for Potential II and III, which suggests a similar yield stress upon loading. This finding suggests that cohesive energy plays an important role in the deformation mechanism and, subsequently, the strengthening and toughening mechanisms of meta-stable dual-phase high-entropy alloys and the related alloy systems. TB spacing only has a significant impact on the strength and toughness of the alloy, and has minimal impact on its deformation mechanism.
The main deformation mechanisms of the FeMnCoCr alloy with E f c c h c p = 71 meV/atom are MT and twinning deformation. When the cohesive energy difference decreases to 0 meV/atom, the MT, dislocation, and twinning jointly determine the deformation mode of the alloy upon loading. When E f c c h c p = −50 meV/atom, the dislocation activity is the only deformation mode in the early stage of deformation, and a small amount of deformation twins appear in the configuration in the later stage of deformation. In contrast, the twin boundary spacing λ only has a significant effect on the strength and toughness of the alloy under load.

4. Conclusions

In this work, two interatomic potentials (Potential II and III) have been developed within the framework of the embedded atom method to study the deformation mechanisms of non-equiatomic Fe80-xMnxCo10Cr10(x = 35, 40) alloys. The calculated physical properties of alloys fit well with the related ab initio calculations. For Potential I, the positive cohesive energy difference ( E f c c h c p = 71 meV/atom) between the austenite and martensite phase makes martensitic transformation the dominant deformation mechanism in alloys. When the cohesive energy difference decreases to 0 meV/atom (Potential II), the stacking fault energy simultaneously increases, leading to the coexistence of martensitic transformation, dislocation, and twinning upon loading. For Potential III, the dislocation activity is the dominant deformation mode with the lowest cohesive energy difference ( E f c c h c p = −50 meV/atom). In comparison, the twin boundary spacing λ has little influence on the deformation mechanism, but has a greater effect on the strength and toughness of alloys upon loading. Nevertheless, our work provides a systematic research tool to study the cohesive energy-related problem for the deformation mechanisms of FeMnCoCr high-entropy alloys and related alloys, which will lay a solid foundation for the research of FeMnCoCr alloys and the design of alloys with better strengthening and toughing performances in the future.

Supplementary Materials

The following supporting information can be downloaded at: https://www.mdpi.com/article/10.3390/met14060728/s1, Supplementary File: The compressed file for the interatomic and meta-atom potentials for FeMnCoCr alloys and one example for input script.

Author Contributions

Conceptualization, H.W.; Methodology, P.W.; Software, P.W.; Validation, P.W.; Investigation, Y.C., X.Z. and D.Z.; Data curation, Y.C., X.Z., D.Z. and P.W.; Writing—original draft, Y.C.; Writing—review and editing, P.W.; Visualization, Y.C., P.W. and D.P.; Supervision, D.P. and H.W.; Project administration, H.W. All authors have read and agreed to the published version of the manuscript.

Funding

The authors would like to acknowledge the financial support from the National Natural Science Foundation of China (Grant No. 11902185, 52090022, and 52288102), and the Young Elite Scientist Sponsorship Program by CAST (Grant No. 2019QNRC001).

Data Availability Statement

The raw data supporting the conclusions of this article will be made available by the authors on request.

Conflicts of Interest

The authors declare no conflict of interest.

Nomenclature

HEAsHigh-entropy alloys
TRIP-DP-HEATransformation-induced plasticity-assisted dual-phase alloy
MDMolecular dynamic
MTMartensitic transformation
DFTDensity functional theory
SFEStacking fault energy (mJ/m2)
TBTwin boundary
λTwin boundary spacings
LAMMPSLarge-Scale Atom/Molecular Massively Parallel Simulator
CNACommon Neighbor Analysis
VCAVirtual crystal approximation
bccBody-centered cubic
fccFace-centered cubic
hcpHexagonal close-packed

Appendix A

Table A1. The summary of the fitting coefficients of Potential II.
Summary of the Fitting Coefficients The Units of Energy and Distance Are eV and Å
Potential IIPotential II
r01.8r12.4
r23.0r33.6
r44.2r54.8
r65.4r76.0
a1−9.66770760793731 × 10⁻¹a2−4.320220866033277 × 10⁻⁴
a33.478971484000802 × 10−7a42.000000000000000 × 10−1
a540
b02.101375956583815 × 103b1−2.077171964986614 × 10³
b25.162776790386556 × 102
c1,3−5.2106037336697 × 10⁻²c1,42.778188909933398 × 102
c1,5−3.7570947633811610 × 101c2,34.62601873279574 × 10−1
c2,45.397455863083986 × 100c2,51.329131989361568 × 100
c3,3−4.344697177683853 × 100c3,43.444687503275756 × 100
c3,5−2.556175142394920 × 100c4,3−1.539582959232970 × 100
c4,48.16212811008731 × 10−1c4,5−4.4854759939966 × 10⁻²
c5,3−9.19177586830533 × 10⁻¹c5,4−1.264203911131165 × 100
c5,5−9.80724404586589 × 10⁻¹c6,38.201649434365 × 10−3
c6,4−2.817017818372356 × 100c6,51.58226822562389 × 10−1
c7,34.47354593228291 × 10−1c7,4−1.232064925519546 × 100
c7,58.53120624954035 × 10−1
Table A2. The summary of the fitting coefficients of Potential III.
Summary of the Fitting Coefficients The Units of Energy and Distance Are eV and Å
Potential IIIPotential III
r01.8r12.4
r23.0r33.6
r44.2r54.8
r65.4r76.0
a1−1.081659385091810 × 100a2−1.515231941409 × 10⁻³
a36.943744787859560 × 10−7a42.000000000000000 × 10−1
a540
b05.451752816213673 × 103b1−5.754856912375750 × 10³
b21.522035944735593 × 103
c1,35.510424603160274 × 102c1,4−2.207729708000522 × 10³
c1,52.474846739550133 × 103c2,3−3.628422779567440 × 100
c2,49.789322689368860 × 100c2,5−5.955323422751416 × 100
c3,31.933180399702355 × 100c3,41.1043734351838088 × 101
c3,53.966275516567340 × 100c4,3−1.139122907374148 × 100
c4,48.174054355850220 × 100c4,5−3.837897146665342 × 100
c5,3−1.261352893543118 × 100c5,41.897898187922895 × 100
c5,5−7.74660867853492 × 10⁻¹c6,3−1.720878011359318 × 100
c6,4−1.30970194552900 × 10⁻¹c6,5−1.060029898052776 × 100
c7,33.66636529045938 × 10−1c7,4−8.86829309275372 × 10⁻¹
c7,56.95113617224733 × 10−1

References

  1. Moschetti, M.; Perrière, L.; Couzinié, J.; Kruzic, J.; Gludovatz, B. A novel strategy for the design of compositionally complex alloys for advanced nuclear applications. Appl. Mater. Today 2024, 38, 102164. [Google Scholar] [CrossRef]
  2. Li, Z.; Pradeep, K.G.; Deng, Y.; Raabe, D.; Tasan, C.C. Metastable high-entropy dual-phase alloys overcome the strength–ductility trade-off. Nature 2016, 534, 227–230. [Google Scholar] [CrossRef]
  3. Miracle, D.B.; Senkov, O.N. A critical review of high entropy alloys and related concepts. Acta Mater. 2017, 122, 448–511. [Google Scholar] [CrossRef]
  4. Otto, F.; Dlouhý, A.; Somsen, C.; Bei, H.; Eggeler, G.; George, E.P. The influences of temperature and microstructure on the tensile properties of a CoCrFeMnNi high-entropy alloy. Acta Mater. 2013, 61, 5743–5755. [Google Scholar] [CrossRef]
  5. Chen, Z.; Zhu, W.; Wang, H.; He, Q.; Fang, Q.; Liu, X.; Li, J.; Yang, Y. Overcoming strength-toughness trade-off in a eutectic high entropy alloy by optimizing chemical and microstructural heterogeneities. Commun. Mater. 2024, 5, 12. [Google Scholar] [CrossRef]
  6. Zhang, Y.; Zuo, T.T.; Tang, Z.; Gao, M.C.; Dahmen, K.A.; Liaw, P.K.; Lu, Z.P. Microstructures and properties of high-entropy alloys. Prog. Mater. Sci. 2014, 61, 1–93. [Google Scholar] [CrossRef]
  7. Zhang, C.; Zhang, F.; Jin, K.; Bei, H.; Chen, S.; Cao, W.; Zhu, J.; Lv, D. Understanding of the Elemental Diffusion Behavior in Concentrated Solid Solution Alloys. J. Phase Equilibria Diffus. 2017, 38, 434–444. [Google Scholar] [CrossRef]
  8. Li, Z.; Tasan, C.C.; Springer, H.; Gault, B.; Raabe, D. Interstitial atoms enable joint twinning and transformation induced plasticity in strong and ductile high-entropy alloys. Sci. Rep. 2017, 7, 40704. [Google Scholar] [CrossRef]
  9. Li, Z.; Raabe, D. Influence of compositional inhomogeneity on mechanical behavior of an interstitial dual-phase high-entropy alloy. Mater. Chem. Phys. 2018, 210, 29–36. [Google Scholar] [CrossRef]
  10. Huang, H.; Wu, Y.; He, J.; Wang, H.; Liu, X.; An, K.; Wu, W.; Lu, Z. Phase-Transformation Ductilization of Brittle High-Entropy Alloys via Metastability Engineering. Adv. Mater. 2017, 29, 1701678. [Google Scholar] [CrossRef]
  11. Wang, P.; Song, Z.; Lin, Y.; Li, Q.; Wang, H. The nucleation mechanism of martensite and its interaction with dislocation dipoles in dual-phase high-entropy alloys. J. Alloys Compd. 2022, 909, 164685. [Google Scholar] [CrossRef]
  12. Fang, Q.; Chen, Y.; Li, J.; Jiang, C.; Liu, B.; Liu, Y.; Liaw, P.K. Probing the phase transformation and dislocation evolution in dual-phase high-entropy alloys. Int. J. Plast. 2019, 114, 161–173. [Google Scholar] [CrossRef]
  13. Qi, Y.; Zhao, M.; Feng, M. Molecular simulation of microstructure evolution and plastic deformation of nanocrystalline CoCrFeMnNi high-entropy alloy under tension and compression. J. Alloys Compd. 2021, 851, 156923. [Google Scholar] [CrossRef]
  14. Jiao, Y.; Xu, L.; Dan, W.; Xu, Y.; Zhang, W. Atomic-scale study of the mechanical properties of dual-phase fcc/bcc crystallites: Influences of alloying elements and phase boundaries. J. Mater. Sci. 2022, 57, 11111–11131. [Google Scholar] [CrossRef]
  15. Kim, Y.-M.; Shin, Y.-H.; Lee, B.-J. Modified embedded-atom method interatomic potentials for pure Mn and the Fe–Mn system. Acta Mater. 2009, 57, 474–482. [Google Scholar] [CrossRef]
  16. Lee, B.-J. A modified embedded-atom method interatomic potential for the Fe–C system. Acta Mater. 2006, 54, 701–711. [Google Scholar] [CrossRef]
  17. Wang, P.; Lin, Y.; Cao, Y.; Zhao, H.; Li, Q.; Wang, H. Atomistic simulations of martensitic transformation processes for metastable FeMnCoCr high-entropy alloy. Sci. China Technol. Sci. 2023, 66, 998–1006. [Google Scholar] [CrossRef]
  18. Chen, Y. Kinetic Monte Carlo Modeling of Martensitic Phase Transformation Dynamics. In Handbook of Materials Modeling; Springer: Berlin/Heidelberg, Germany, 2018; pp. 1–21. [Google Scholar] [CrossRef]
  19. Wang, P.; Xu, S.; Liu, J.; Li, X.; Wei, Y.; Wang, H.; Gao, H.; Yang, W. Atomistic simulation for deforming complex alloys with application toward TWIP steel and associated physical insights. J. Mech. Phys. Solids 2017, 98, 290–308. [Google Scholar] [CrossRef]
  20. Wang, P.; Wang, H. Meta-Atom Molecular Dynamics for Studying Material Property Dependent Deformation Mechanisms of Alloys. J. Appl. Mech. 2017, 84, 111002. [Google Scholar] [CrossRef]
  21. Wang, P.; Wu, Y.; Liu, J.; Wang, H. Impacts of atomic scale lattice distortion on dislocation activity in high-entropy alloys. Extrem. Mech. Lett. 2017, 17, 38–42. [Google Scholar] [CrossRef]
  22. Evans, D.J.; Holian, B.L. The Nose–Hoover thermostat. J. Chem. Phys. 1985, 83, 4069–4074. [Google Scholar] [CrossRef]
  23. Plimpton, S. Fast Parallel Algorithms for Short-Range Molecular Dynamics. J. Comput. Phys. 1995, 117, 1–19. [Google Scholar] [CrossRef]
  24. Stukowski, A. Visualization and analysis of atomistic simulation data with OVITO–the Open Visualization Tool. Model. Simul. Mater. Sci. Eng. 2010, 18, 015012. [Google Scholar] [CrossRef]
  25. Faken, D.; Jónsson, H. Systematic analysis of local atomic structure combined with 3D computer graphics. Comput. Mater. Sci. 1994, 2, 279–286. [Google Scholar] [CrossRef]
  26. Bu, Y.; Li, Z.; Liu, J.; Wang, H.; Raabe, D.; Yang, W. Nonbasal Slip Systems Enable a Strong and Ductile Hexagonal-Close-Packed High-Entropy Phase. Phys. Rev. Lett. 2019, 122, 075502. [Google Scholar] [CrossRef]
  27. Medvedeva, N.I.; Park, M.S.; Van Aken, D.C.; Medvedeva, J.E. First-principles study of Mn, Al and C distribution and their effect on stacking fault energies in fcc Fe. J. Alloys Compd. 2014, 582, 475–482. [Google Scholar] [CrossRef]
  28. Mizuno, M.; Sugita, K.; Araki, H. Defect energetics for diffusion in CrMnFeCoNi high-entropy alloy from first-principles calculations. Comput. Mater. Sci. 2019, 170, 109163. [Google Scholar] [CrossRef]
  29. Bellaiche, L.; Vanderbilt, D. Virtual crystal approximation revisited: Application to dielectric and piezoelectric properties of perovskites. Phys. Rev. B 2000, 61, 7877–7882. [Google Scholar] [CrossRef]
  30. Grässel, O.; Krüger, L.; Frommeyer, G.; Meyer, L.W. High strength Fe–Mn–(Al, Si) TRIP/TWIP steels development—Properties—Application. Int. J. Plast. 2000, 16, 1391–1409. [Google Scholar] [CrossRef]
  31. Qian, S.U.N.; Xiong-Bo, Y.; Ya-Jun, G.A.O.; Jian-Wei, Z. Molecular Dynamics Simulation of the Deformation Behavior of Ag Nanowires with Different Twin Boundary Density under Tension Loading. Acta Phys.-Chim. Sin. 2014, 30, 2015–2023. [Google Scholar] [CrossRef]
  32. Suzuki, T.; Shimono, M.; Kajiwara, S. On the mechanism for martensitic transformation from fcc to bcc. Mater. Sci. Eng. A 2001, 312, 104–108. [Google Scholar] [CrossRef]
Figure 1. Simulation models of (a) perfect lattice, (be) twin lamellae with λ of 10 nm, 20 nm, 30 nm, and 40 nm, respectively. The atoms are colored by common neighbor analysis (CNA) method. White: fcc structure; Blue: bcc structure; Red: hcp structure; Green: unknown structure. The loading direction is shown in the figure.
Metals 14 00728 g001
Figure 2. The interatomic potentials of FeMnCoCr alloys. (a) Embedding function F ( ρ ) . (b) Pair function ϕ ( r ) . (c) The fitting targets and the predicted values of Rose’s equation for fcc phase, the cohesive energy differences between hcp and fcc phases are labeled accordingly. (d) The predicted energy contours for hcp phase with different Wigner–Seitz (W-S) radii and c/a ratios. Left column: Potential II; Right column: Potential III.
Metals 14 00728 g002
Figure 3. The related curves of Fe50Mn30Co10Cr10 alloy: (a) The stress–strain curves for models with different TB spacings predicted with Potential I. The evolutions of fractional phase contents for (b) perfect lattice (λ = ∞) and twin lamellae with λ of (c) 10 nm, (d) 20 nm, (e) 30 nm, and (f) 40 nm, respectively. Brown: FCC structures; Pink: HCP structures; Black: BCC structures; Blue: unknown structures.
Metals 14 00728 g003
Figure 4. The atomic snapshots of the martensitic transformation processes in Fe50Mn30Co10Cr10 alloy with different TB spacings (λ) predicted by Potential I. (a) Perfect lattice (λ = ∞); (b) λ = 10 nm; (c) λ = 20 nm; (d) λ = 30 nm; and (e) λ = 40 nm. The loading direction is shown in the figure.
Metals 14 00728 g004
Figure 5. The related curves of Fe45Mn35Co10Cr10 alloy: (a) The stress–strain curves for models with different TB spacings predicted with Potential II. The evolutions of fractional phase contents for (b) perfect lattice (λ = ∞) and twin lamellae with λ of (c) 10 nm, (d) 20 nm, (e) 30 nm, and (f) 40 nm, respectively.
Metals 14 00728 g005
Figure 6. The atomic snapshots of the martensitic transformation processes in Fe45Mn35Co10Cr10 alloy with different TB spacings (λ) predicted by Potential II. (a) Perfect lattice (λ = ∞); (b) λ = 10 nm; (c) λ = 20 nm; (d) λ = 30 nm; and (e) λ = 40 nm. The loading direction is shown in the figure.
Metals 14 00728 g006
Figure 7. The detailed microstructure evolutions around the crack tip for configuration λ = 10 nm with the strain levels of (a) ε = 0.025, (b) ε = 0.028, (c) ε = 0.030, (d) ε = 0.043, (e) ε = 0.048, and (f) ε = 0.053, respectively. The loading direction is shown in the figure.
Metals 14 00728 g007
Figure 8. The related curves of Fe40Mn40Co10Cr10 alloy: (a) The stress–strain curves for models with different TB spacings predicted with Potential III. The evolutions of fractional phase contents for (b) perfect lattice (λ = ∞) and twin lamellae with λ of (c) 10 nm, (d) 20 nm, (e) 30 nm, and (f) 40 nm, respectively.
Metals 14 00728 g008
Figure 9. The atomic snapshots of the martensitic transformation processes in Fe40Mn40Co10Cr10 alloy with different TB spacings (λ) predicted by Potential III. (a) Perfect lattice (λ = ∞); (b) λ = 10 nm; (c) λ = 20 nm; (d) λ = 30 nm; and (e) λ = 40 nm. The loading direction is shown in the figure.
Metals 14 00728 g009
Figure 10. The snapshot of the overall structure for configuration with λ = 20 nm at the strain level of 0.10. The loading direction is shown in the figure.
Metals 14 00728 g010
Figure 11. The relationship of yield strength and twin boundary spacing (λ) of FeMnCoCr alloy.
Metals 14 00728 g011
Table 1. The physical properties and fitting results of the interatomic potentials for Fe80−xMnxCo10Cr10 TRIP-DP-HEA.
PropertiesTargetPotential Ⅰ [17]Potential ⅡPotential Ⅲ
a (fcc) (Å)3.608 [26]3.6093.6103.608
Ec_fcc (eV/atom)−4.679 [*]−4.679−4.729−4.729
C11 (GPa)265 [12]332329317
C12 (GPa)184 [12]133138154
C44 (GPa)113 [12]514540
γ111 (mJ/m2)2367 [17]245724431471
γ110 (mJ/m2)2718 [17]258026261800
γ100 (mJ/m2)2783 [17]248124461479
γsf (mJ/m2)-−38516301
γusf (mJ/m2)200 [27]199241460
Evac (eV)2 [28]22.22.17
a (hcp) (Å)2.544 [26]2.5472.5442.544
c (hcp) (Å)4.110 [26]4.0984.1524.110
Ec_hcp (eV/atom)−4.750 [*]−4.750−4.729−4.679
Note: a and c are the lattice constants. Cij is the elastic constant. γijk is the free surface energy. Evac is the point vacancy formation energy. γsf and γusf are the stable and unstable stacking fault energies. Ec_fcc and Ec_hcp represent the cohesive energies of fcc and hcp structures. ‘*’ represent values calculated using DFT via virtual crystal approximation (VCA) method [29] in our team.
Disclaimer/Publisher’s Note: The statements, opinions and data contained in all publications are solely those of the individual author(s) and contributor(s) and not of MDPI and/or the editor(s). MDPI and/or the editor(s) disclaim responsibility for any injury to people or property resulting from any ideas, methods, instructions or products referred to in the content.

