Abstract
Shape memory alloy (SMA) bidimensional cellular structures (CSs) have a great potential application in attenuation of vibrations due to reversible martensitic phase transformations induced by thermal or mechanical loading. This work aims to produce a thermal and mechanical characterization of CuAlMn SMA CSs produced by rapid investment casting (RIC). Structures with different unit cell geometries and thicknesses of 0.5 mm and 1 mm were manufactured by centrifugal RIC. Compression tests at different temperatures were performed on the CS to verify its thermomechanical behavior. We observed that a CS with a thickness of 0.5 mm presents greater mechanical strength and lower levels of maximum force at the end of each 5% compression cycle, ranging from approximately 1/10 to 1/3, compared to structures with a thickness of 1 mm. Among all the CS configurations, the re-entrant structure exhibited higher levels of force, with higher secant stiffness and dissipated energy. The structures resisted the application of compressive forces that varied between 125 N and 500 N for the 0.5 mm CS and between 500 N and 5500 N for the 1 mm CS. Therefore, the results showed that all CuAlMn SMA CSs produced by RIC exhibited sufficient strength to attain strain levels of up to 5% at different temperatures, and that the unit cell geometry can be used to tune the mechanical properties.
1. Introduction
Conventional metals and alloys play an extremely important role as structural materials within the scientific and technological context. Over time, there has been a continuous improvement in these materials in terms of efficiency, and the demand for lighter and stronger materials with tailored properties that meet structural requirements and provide better functionality has generated a new branch of materials. This led to the emergence of smart materials, which are considered high-performance materials capable of providing components with low weight and which have characteristic functions in response to external stimuli, such as temperature, electrical voltage, magnetic field, and others [1,2].
Among these materials are shape memory alloys (SMA), which are active metals capable of recovering their original shape after being deformed and exposed to appropriate stimuli, such as changes in temperature, magnetic field, or mechanical tension. These alloys exhibit two main macro mechanical functionalities: the shape memory effect (SME) and superelasticity (SE). SME refers to the alloy’s ability to recover its shape when plastically deformed and heated, while SE allows the SMA to undergo significant reversible elastic deformations after mechanical loading and unloading. These phenomena occur due to their reversible phase transition from austenite to martensite, during which there are reversible changes in the atomic structure of the alloy in response to variations in temperature or stress [2,3,4,5].
While the NiTi SMA family stands as the most widely utilized and commercially accessible, due to its outstanding properties and biocompatibility, inherent processing complexities and the elevated cost of the end product underscore the necessity for exploring alternative materials and alloys.
In this regard, copper–aluminum (Cu-Al)-based SMAs have garnered significant attention in various studies pertaining to SME and SE phenomena. This stems from the fact that, when compared to NiTi SMA, these alloys can exhibit higher phase transformation temperatures, reduced costs, and the capacity to achieve desired properties through the incorporation of ternary chemical elements (such as Mn, Ni, and Nb, among others) [6]. Challenges inherent to this alloy system may encompass shifts in transformation temperatures upon the addition of a third element and the susceptibility to brittleness during cold working of polycrystalline alloys [7,8].
Additional research has underscored the potential of these alloys and suggests that, with proper control of the microstructure, CuAlMn-based SMAs can exhibit properties comparable to NiTi alloys, which are extensively studied and known for their superior characteristics [7,9,10].
SMAs have been finding increasingly wide-ranging applications in various engineering fields, including the development of cellular structures (CSs). These structures consist of open cells, typically with small thicknesses and often adopting a hexagonal geometry, commonly known as honeycombs. They can vary widely in their geometric form. These structures enable the minimization of material usage, thus reducing weight and manufacturing costs while maintaining relative compression strength and exhibiting low relative density [11,12]. These structures have been extensively employed in industries such as naval and aerospace [13], sports [14,15], transportation [16], and biomedical [17], among others.
Meena and Singamneni [18] fabricated two auxetic stainless steel structures (re-entrant and s-structure) using the selective laser melting technique to print the models, employing the Renishaw AM 400 system. They investigated the mechanical behavior of these auxetic structures through compression tests. These structures exhibit a negative Poisson’s ratio, meaning that after undergoing elongation in one direction, materials with this geometry tend to expand transversely to the loading direction [19,20].
Conversely, conventional materials subjected to excessive loads may experience permanent deformations. Therefore, CSs fabricated from SMAs are intriguing due to the special thermomechanical phenomena exhibited by SMAs, namely, the SME and SE [21].
The manufacturing of CSs from NiTi SMAs was previously achieved through brazing joining techniques, as demonstrated by researchers such as [21,22,23]. These studies yielded satisfactory results in both tensile and compression tests. In addition, Simões and De Araujo [24] demonstrated the feasibility of producing CSs from NiTi SMAs with two different geometries (circular and hexagonal) using the rapid investment casting (RIC) process based on polymeric models (ABS or PLA) obtained through 3D printing. More recently, the induction melting followed by centrifugal casting (ICC) RIC process has been successfully employed to obtain CuAlMn SMA parts [25].
In this context, the present study aimed to manufacture and thermomechanically characterize four CSs with two distinct geometric configurations. The chosen geometries were classified based on the Poisson ratio, two with a positive ratio (hexagonal and diamond) and two with a negative ratio (re-entrant and s-shaped). Each of the structures was designed in two different wall thicknesses, 0.5 mm and 1 mm, using a CuAlMn alloy that exhibits the SME phenomenon, from room temperature. The CSs were manufactured using the ICC process, as described by [25]. The thermomechanical characterization of the CSs was carried out through compression tests at different temperatures, located within the phase transformation range of the manufactured CuAlMn SMAs. This approach allowed for a detailed assessment of the behavior of structures under different thermal conditions.
2. Materials and Methods
2.1. Material and Geometry of the Cellular Structures
Ingots of the CuAlMn SMA with a nominal composition of 81Cu12Al7Mn (wt.%) were produced from the raw metals (with purity >99.5%) using the electric arc melting process under an atmosphere of argon (Discovery All Metals, from EDG Equipamentos, São Carlos, Brazil). Initially, the raw metals were placed in a copper crucible, remelted four times to obtain compositional homogeneity and then injected into a cylindrical copper mold, resulting in an ingot weighing approximately 11 g.
The two-dimensional CSs were initially modeled with the aid of CAD tools (version 1.1) using the Autodesk Inventor 2023 student version software, as shown in Figure 1. Two types of unit cell geometries were used in this study: the first with positive Poisson’s ratio, hexagonal and diamond (Figure 1a), and the second, with a negative Poisson’s ratio, re-entrant and s-shaped (Figure 1b) [18]. Therefore, the CSs were designed based on a repetitive pattern, with three vertical cells and five horizontal cells with two wall thicknesses (t), 0.5 mm and 1.0 mm (Figure 1c,d). Additionally, plates were shaped and inserted into the upper and lower parts of the CSs to distribute the mechanical load during the mechanical tests. Table 1 presents the height, length, and relative density values for the CSs.
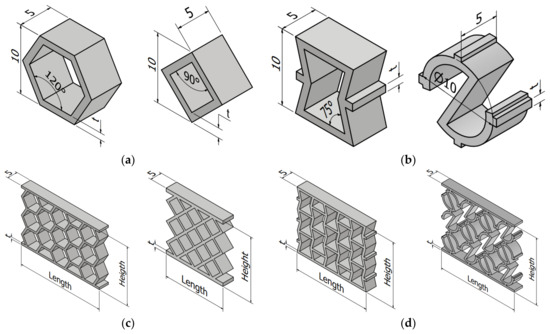
Figure 1.
Unit cells of the type with (a) positive Poisson’s ratio and (b) negative Poisson’s ratio. Two-dimensional CSs with (c) positive Poisson’s ratio and (d) negative Poisson’s ratio (unit: mm).

Table 1.
Final dimensions and relative density of CSs.
2.2. Rapid Investment Casting
To perform the experiments, CuAlMn SMA CSs were manufactured using a rapid investment casting (RIC) process. Initially, the CS models were obtained with a 3D printer (Snapmaker 2.0 model) using PLA (polylactic acid) as filament, and lost wax feed channels were manually added to the polymeric CS.
The ceramic molds were manufactured using a commercial ceramic coating with a composition based on quartz, ammonium phosphate, and magnesium oxide (Calibra Express, from VIPI, São Paulo, Brazil) according to the manufacturer’s recommendations. Each mold, with a diameter and height of 60 mm and 55 mm, respectively, was prepared with approximately 270 g of coating. After curing at room temperature for 1 h, the mold was heated in a resistive furnace up to 850 °C at 30 °C/min and maintained at this temperature for 30 min for sintering. The mold was cooled to 350 °C inside the furnace and was subsequently removed for use in the RIC process. The internal cavities of the ceramic molds were filled with approximately 35 g of CuAlMn SMA molten metal using the ICC process (PowerCast 1700, from EDG Equipamentos, São Carlos, Brazil). In this process, the CuAlMn SMA ingots were placed inside an alumina ceramic crucible with a constant argon flow of 5 L/min. After inductive heating of the ingots to approximately 1400 °C, the molten SMA was injected into the mold at a rotation speed of 350 rpm. After the ICC process, the molds were removed from the equipment manually and quenched in water at room temperature.
After removing the CuAlMn SMA CS from the ceramic molds with the aid of a pneumatic hammer, the surfaces of the cast samples were blasted with alumina with a particle size of 100 µm at a pressure of 8 bar. Finally, the samples were machined using the wire EDM process (NOVIK-1300, from Electrocut, San Carlos, CA, USA) to remove the feed channels.
Figure 2 illustrates schematically the above-described RIC process for manufacturing the CuAlMn SMA CSs.
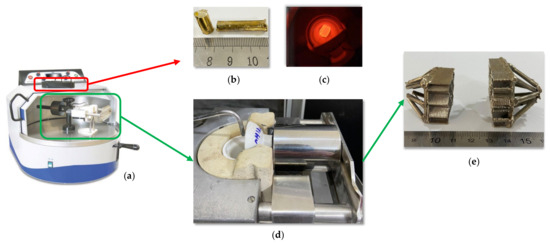
Figure 2.
Manufacturing the CuAlMn SMA CSs by ICC RIC process. (a) Power Cast 1700 machine. (b) CuAlMn ingots. (c) CuAlMn SMA melting. (d) ICC process. (e) CSs post-process.
2.3. Experimental Characterization
The CuAlMn SMA CSs with hexagonal (H), diamond (D), re-entrant (R), and s-shaped (S) unit cell geometry were experimentally characterized through dimensional and thermal analysis, and compression tests at different temperatures.
To investigate the dimensional variation of unit cell thickness between the CS fabricated with PLA and CuAlMn SMA, twenty measurements were performed at different locations in each CS. For this, the CSs were analyzed using a profile projector (model HB16, from Huatec, Beijing, China) with 50× amplification.
The transformation temperatures of the CuAlMn SMA CSs were determined by Differential Scanning Calorimetry (DSC) (model Q20, from TA Instruments, New Castle, DE, USA). The temperature range was from 0 °C to 250 °C with a cooling/heating rate of 10 °C/min under a nitrogen atmosphere. The starting and final phase transformation temperatures were obtained by the tangent intersection method applied to the DSC peaks using the Universal Analysis 2000 software (TA Instruments, New Castle, DE, USA). The samples used for the DSC tests were obtained from the feeding channels for each CS.
To investigate the mechanical behavior, compression tests were carried out in a quasi-static regime on the CuAlMn SMA CSs at different temperatures. Each CS was submitted to an isothermal load–unloading cycle at a 5% maximum strain (regarding height) with a strain rate of 8.3 × 10⁻⁵ s−1 at temperatures ranging from 30 °C up to temperatures higher than Af, with increments of 20 °C. Finally, the same previously characterized CSs with walls 0.5 mm thick were tested under compression mode up to a maximum strain of 30% at room temperature (approximately 22 °C) with a strain rate of 1.6 × 10⁻⁴ s−1.
All CS samples were tested on a universal testing machine (model 5582, from INSTRON, Norwood, MA, USA) equipped with a 30 kN load cell and environmental chamber. Before the mechanical tests, the CuAlMn SMA CSs were heated to a temperature above Af to recover any residual strain.
3. Results and Discussion
3.1. The Manufacturing of CuAlMn SMA Cellular Structures
The methodology adopted for the manufacturing of the CuAlMn SMA CSs using RIC with the ICC process was successfully validated. The efficiency of the casting parameters, such as molten metal temperature and rotation speed with values of approximately 1400 °C and 350 rpm, respectively, as well as the distribution of feed channels (Figure 2e), resulted in the complete filling of the internal cavity of the molds, as shown in Figure 3, after post-processing steps.
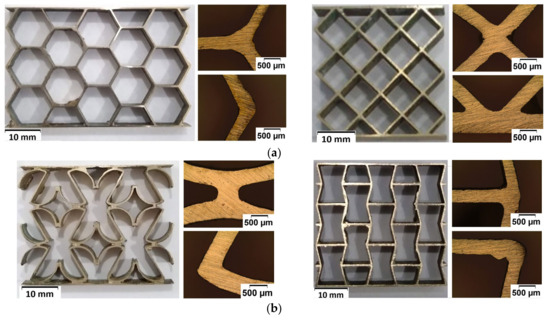
Figure 3.
CuAlMn SMA CSs manufactured by RIC with the ICC process. (a) Positive Poisson’s ratio. (b) Negative Poisson’s ratio.
3.2. Dimensional Analysis
Table 2 presents the wall thickness average values of CSs manufactured in PLA and CuAlMn SMA. The 3D-printed PLA models exhibited an increase in thickness compared to the nominal dimension designed in CAD for all structures. This increase is attributed to additive manufacturing by the material extrusion (FDM) process and 3D-printer characteristics, such as nozzle diameter and printing parameters. On the other hand, a contraction of wall thickness was observed after casting the CuAlMn SMA CSs, reaching maximum values of 14.8% for structures D-1 and R-1, and 5.9% for structure H-0.5. The smallest reduction was observed for the S-0.5 structure, with a value of 2.6%. This reduction is due to the contraction of the molten metal in the internal cavity of the mold, demonstrating greater sensitivity the greater the wall thickness.
Table 2.
Dimensional analysis of the wall thickness of the CuAlMn SMA CSs.
Similar contraction values have been observed in the literature for the manufacture of SMA miniaturized components using RIC with the ICC process. Montenegro et al. [26] presented contraction values between 6.7% and 10% for Ni-Ti SMA meshes manufactured by the ICC process from wax models. Santiago et al. [27] achieved better results in terms of dimensional reduction, obtaining contraction values between 1.2% and 1.7% for NiTi SMA helical extension springs manufactured by the ICC process from resin models obtained by 3D printing.
3.3. Transformation Temperatures
Figure 4a,b show the DSC thermograms of the CuAlMn SMA CSs during cooling and heating for the wall thicknesses of 0.5 mm and 1 mm, respectively. It is possible to observe that the transformation peaks differ between the structures, and this is directly related to the solidification process that depends on each unit cell geometry, arrangement of the feeding channels, and mass of the CuAlMn ingots, in addition to being strongly influenced by the concentrations of Al and Mn in the CuAlMn SMA [28,29,30].
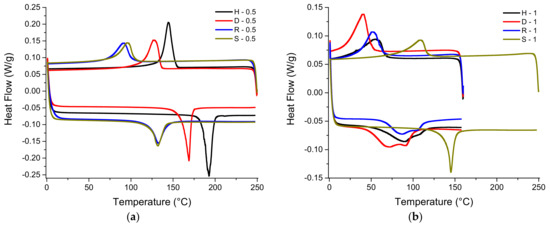
Figure 4.
DSC thermograms of the CuAlMn SMA CSs: (a) 0.5 mm thick; (b) 1 mm thick.
Furthermore, all CSs exhibited well-defined peaks during cooling and heating due to forward and reverse phase transformations (cooling and heating). Indirectly, this thermal behavior shows that induction casting in a plaster mold followed by quenching in water at room temperature already allows for homogeneous structures to be obtained. When the alloys and/or products are not sufficiently homogeneous, flat or disturbed DSC peaks, or even the non-appearance of peaks, are verified, as reported in the work of Simões et al. [31] for NiTi SMA injected into metallic molds. This aspect can even be considered a novelty of this work, as it eliminates a step in the manufacturing process of these structures, since they can leave the process and go directly to performance tests.
Table 3 shows the temperatures and enthalpies of forward and reverse phase transformation obtained from each thermogram of the CuAlMn SMA CSs. The structures presented final temperatures of martensite phase transformation (Mf) above the temperature of 20 °C. The forward and reverse transformation enthalpy values ranged from 4.1 J/g to 13.2 J/g for structures with 0.5 mm thickness, while for structures with 1.0 mm thickness, the values ranged from 4.1 J/g to 7.5 J/g. Similar values were reported by [31], corroborating the aspect of sufficient homogeneity of the structures mentioned previously.
Table 3.
Phase transformation temperatures and enthalpies of the CuAlMn SMA CSs.
3.4. Isothermal Quasi-Static Compression Response
Figure 5 shows the mechanical response under compression at different temperatures for the 0.5 mm thick CuAlMn SMA CS. As observed, the force value equivalent to the reorientation stress of the martensitic phase reduces with increasing temperature until reaching a minimum theoretically corresponding to temperature Ms. From temperature As, stress-induced phase transformation occurs and force values increase with increasing temperature, typical mechanical behavior observed in SMA. This relationship between mechanical stress and temperature follows the Clausius–Clapeyron law [32].
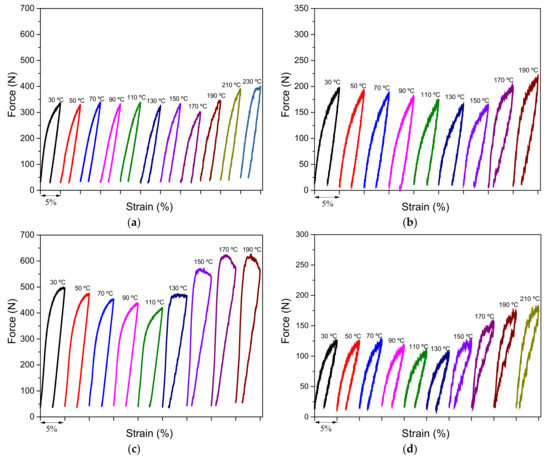
Figure 5.
Quasi-static force vs. strain response of the CuAlMn SMA CSs with 0.5 mm thick walls at different temperatures. (a) Hexagonal. (b) Diamond. (c) Re-entrant. (d) S-shaped.
CuAlMn SMA CSs showed different mechanical behaviors, and this is due, in brief, to the geometry of the unit cell. Furthermore, all structures have resisted loading and unloading cycles in a quasi-static regime under isotherms up to a test temperature (Ttest) higher than Af.
From the load–unload cycles at different temperatures for the CuAlMn SMA CSs shown in Figure 5, it is possible to observe that among the structures with positive Poisson’s ratio, the H-0.5 structure presented the highest peak force values when compared to the D-0.5 structure. According to [33], this is attributed to the presence of more stress concentration points in the hexagonal structure, thus requiring greater resistance for the same strain. For the H-0.5 structure at 30 °C and 190 °C, the force peaks were approximately 334 N and 345 N, respectively, while for the D-0.5 structure, at the same temperatures, the force peaks were approximately 196 N and 217 N, respectively, constituting an increase of approximately 41% at 30 °C, and of approximately 37% at 190 °C. The H-0.5 structure was tested up to 230 °C, achieving approximately 397 N value of peak force.
For structures with a negative Poisson’s ratio, the R-0.5 structure presented higher levels of peak force when compared to the S-0.5 structure; similar behavior was observed by [18]. For the R-0.5 structure at 30 °C and 190 °C, for example, the peak force values were approximately 496 N and 625 N, respectively, while for the S-0.5 structure, the values were approximately 124 N and 172 N, respectively, constituting an increase of 75% at 30 °C and of approximately 72% at 190 °C. The S-0.5 structure was tested at 210 °C, achieving approximately 180 N peak force.
The structures presented residual strain values between 1.8% and 2.6% in the temperature range between 30 °C and 90 °C, a situation in which all structures present a stable martensitic phase, as shown in Figure 6. As the Ttest evolves and reaches temperature As, a gradual reduction in residual strain is noted until reaching a maximum recovery in Af, in which austenite is the stable phase. From the stress-induced martensitic phase transformation occurs, causing the phenomenon of superelasticity. The lowest value of residual strain was observed in the S-0.5 structure at 170 °C, presenting a value of approximately 0.21%.
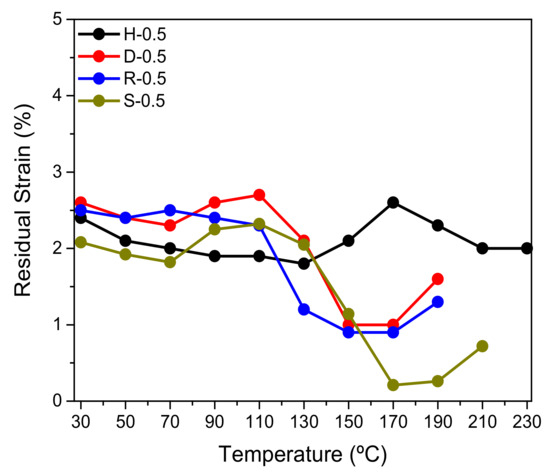
Figure 6.
Residual strain of the CuAlMn SMA CSs with 0.5 mm thick walls at different test temperatures.
The increase in residual strain observed in structures D-0.5, R-0.5, and S-0.5 from 170 °C is due to the accumulation of stress-induced martensite variants that were not transformed to austenite during reverse phase transformation. This phenomenon is justified by the fact that the samples were not mechanically cycled at a temperature above Af with the aim of saturating the stress-induced martensite. It is worth noting that the same CuAlMn SMA CSs were used for all mechanical compression tests at different temperatures.
Functional mechanical properties such as secant stiffness and dissipated energy are crucial in the design of CS devices manufactured with SMAs, particularly in applications involving the use of these devices as dynamic absorbers [34]. Based on the responses obtained in the thermomechanical tests conducted on the CuAlMn SMA CSs with a thickness of 0.5 mm, the secant stiffness (ks, in kN/m) and the dissipated energy per cycle (ED, in MJ/m3) were determined at different temperatures.
The ks is calculated according to Equation (1), where ∆F represents the difference between the peak forces, and ∆δ is the difference between the final and initial displacements.
The ED (Equation (2)) is defined as the internal area of the stress vs. strain mechanical response. For devices such as CSs, where the mechanical response is force vs. displacement, the calculation of the internal area results in the dissipated energy (in J). Volume (in m3) values for each CS were calculated via CAD.
Figure 7a shows the behavior of ks vs. temperature for the CuAlMn SMA CSs with a thickness of 0.5 mm. For CSs with positive Poisson’s ratio, the ks values remained practically constant with increasing temperature up to 150 °C, a temperature range in which the H-0.5 and D-0.5 structures present the martensite phase completely or are partially stable, presenting an average value of 216.47 ± 1.67 kN/m and 121.38 ± 7.95 kN/m, respectively. From 170 °C, the H-0.5 structure showed a gradual increase with increasing temperature, reaching a peak value of approximately 255 kN/m at 210 °C. For the D-0.5 structure, the peak value was approximately 151 kN/m at 190 °C.
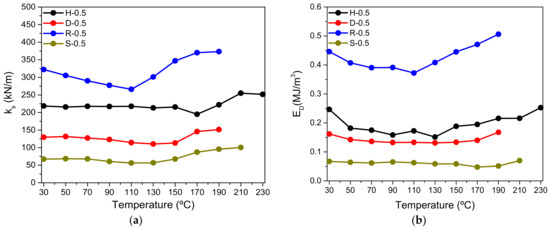
Figure 7.
Mechanical properties of CuAlMn SMA CSs with 0.5 mm thick walls at different temperatures. (a) Secant stiffness. (b) Dissipated energy per cycle.
Among all CuAlMn SMA CSs, the R-0.5 structure with negative Poisson’s ratio presented the highest values of ks. For the R-0.5 CS, the ks values decreased with increasing temperature up to 110 °C, presenting values at 30 °C and 110 °C of approximately 322 kN/m and 266 kN/m, respectively, constituting a reduction of approximately 17%. From 110 °C, the R-0.5 structure showed a significant increase in ks with temperature compared to the other CSs, presenting a peak value of approximately 373 kN/m at 190 °C, a temperature at which the austenite phase is stable, and therefore the structure is completely superelastic.
On the other hand, the S-0.5 structure presented the lowest values of ks among all CuAlMn SMA CSs, presenting nearly constant ks values up to a temperature of 130 °C. In this temperature range between 30 °C and 130 °C the average ks value was 62.89 ± 5.69 kN/m. The peak value is approximately 100 kN/m at 210 °C.
The behavior of ED as a function of temperature for the 0.5 mm thick CuAlMn SMA CSs in Figure 7b shows that the structure with negative Poisson ratio R-0.5 presented the highest values among the other CS, with a peak of approximately 0.5 MJ/m3 at 210 °C, the temperature at which the R-0.5 structure is completely superelastic. The S-0.5 structure presented an almost constant behavior for the ED with increasing temperature, presenting an average value of 0.06 ± 0.006 MJ/m3 between 30 °C and 210 °C. Among CSs with a positive Poisson’s ratio, such as structures H-0.5 and D-0.5, the values of ED at 30 °C were approximately 0.24 MJ/m3 and 0.16 MJ/m3, respectively.
To elucidate the deformation behavior of the CuAlMn SMA CSs, a sequence of photographs was obtained throughout the mechanical loading cycle at 30 °C for structures with negative Poisson’s ratio, R-0.5, and S-0.5, as pointed out in Figure 8. The R-0.5 structure presented the highest deformation levels, while the S-0.5 structure presented the lowest levels among the CuAlMn SMA CSs. These images were captured and arranged side by side (Figure 8) and show the deformation behavior for both structures. The phenomenon of lateral contraction is evident in the direction perpendicular to the applied load [35,36,37], which characterizes structures with a negative Poisson’s ratio, also known as auxetic structures, and can be visualized in the unit cell detailed by the yellow rectangle at 0% and 5% axial strain.
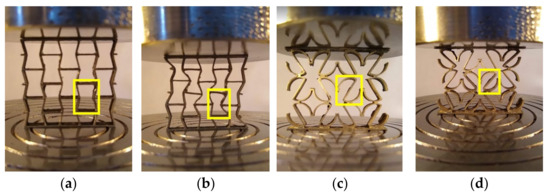
Figure 8.
Sequence of images of CuAlMn SMA CSs with 0.5 mm thick walls with detail for the deformation mode of the unit cell highlighted by the yellow rectangle. (a) R-0.5 at 0%. (b) R-0.5 at 5%. (c) S-0.5 at 0%. (d) S-0.5 at 5%.
According to [18,38], the re-entrant structure when subjected to compression presents a behavior wherein the vertically inclined bars of the structure deform under load, progressively collapsing, while the horizontal bars remain perpendicular until they begin to buckle. This combination of buckling and bending causes lateral displacement of the structure’s rows, which allows the cell to compact sooner and support greater loads. This phenomenon can be observed in Figure 8b, where the re-entrant unit cell, highlighted in yellow, after 5% strain, already commences lateral movement, similar to other unit cells that are already undergoing a similar process. As the deformation increases, this lateral movement is expected to evolve.
For the s-shaped structure, some works [18,39] indicate that the configuration of this structure undergoes deformation due to the rotation of its inclined bars around the axis of an imaginary circular path. This effect is visible in Figure 8d, in which the highlighted unit cell is rotating under its axis, approaching the inclined rods.
It is important to highlight that the s-shaped structure, due to its two stress concentration points compared to the four in the diamond structure and the eight in the re-entrant and hexagonal structures, is prone to stress accumulation and potential instability under loading conditions [40]. However, it is at these stress concentration points that the stress levels are sufficient to reorient the martensite for cases where the Ttest < Ms, as well as sufficient to induce martensite by stress for cases where the Ttest ≥ As. For this reason, structures with a negative Poisson’s ratio, R-0.5, and S-0.5, presented the highest and lowest levels of functional properties among all CSs analyzed, respectively.
After compression tests in a quasi-static regime at different temperatures in the CuAlMn SMA CSs and at up to 5% maximum strain, we performed tests at a room temperature of approximately 22 °C to evaluate the mechanical behavior and deformation mode of the CSs at a maximum strain of up to 30%, as shown in Figure 9. Furthermore, we photographed the structures at different strain levels throughout the loading cycle.
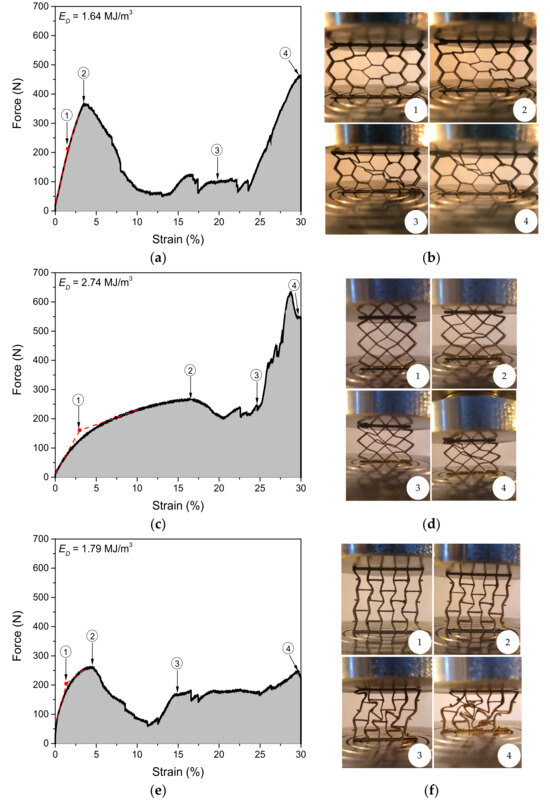
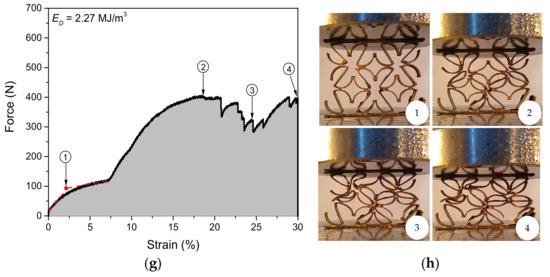
Figure 9.
Quasi-static force vs. strain response of the CuAlMn SMA CSs with 0.5 mm thick walls up to 30% of maximum strain at Ttest ≈ 22 °C. (a) Hexagonal. (c) Diamond. (e) Re-entrant. (g) S-shaped. Photographs of the deformation mode at different strain levels. (b) Hexagonal. (d) Diamond. (f) Re-entrant. (h) S-shaped.
As observed, initially the structures present a linear elastic region that corresponds to the uniform deformation of the unit cells, followed by a slope (point 1) in the force vs. strain curve that is probably due to the reorientation of the martensite phase. This inclination is evident in structures D-0.5, R-0.5, and S-0.5 (red filled circle). After reaching a force peak (point 2), the structures experience an abrupt drop in force values with increasing imposed strain, followed by a plateau region with ripples in force values. The plateau region is characterized by gradual fracture of the struts with subsequent settling. The H-0.5, D-0.5, and R-0.5 structures presented a fracture of the unit cells in a line at 45° (point 3). Finally, an abrupt increase in force values is observed due to the contact between the struts and a consequent increase in the relative density of the CS (point 4) at a strain of 30%.
We calculated the ED values (filled area under the curve highlighted in gray for the CuAlMn SMA CSs). Among the structures with a positive Poisson’s ratio, the values were approximately 1.64 MJ/m3 and 2.74 MJ/m3 for the H-0.5 and D-0.5 structures, respectively, while for the structures with a negative Poisson’s ratio, R-0.5 and S-0.5, the values were approximately 1.79 MJ/mm3 and 2.27 MJ/m3, respectively.
Figure 10 shows the mechanical response under compression at different temperatures for the 1 mm thick CuAlMn SMA CSs. Overall, the 1 mm thick CuAlMn SMA CSs showed higher peak force levels when compared to the 0.5 mm thick structures. At 30 °C, the peak force values were approximately 2043 N, 1634 N, 5308 N, and 476 N for the CSs H-1, D-1, R-1, and S-1, respectively. Therefore, structures with 0.5 mm thickness presented peak force levels in the range between 1/10 and 1/3 of structures with 1 mm. Furthermore, the 1 mm thick CSs presented lower strength when compared to the 0.5 mm structures, fracturing with few cumulative load–unload cycles at temperatures of 50 °C and 110 °C for CSs H-1, D-1, and R-1, respectively, except the S-1 structure which presented strength in compressive loading–unloading cycles up to 230 °C, i.e., Af + 80 °C.
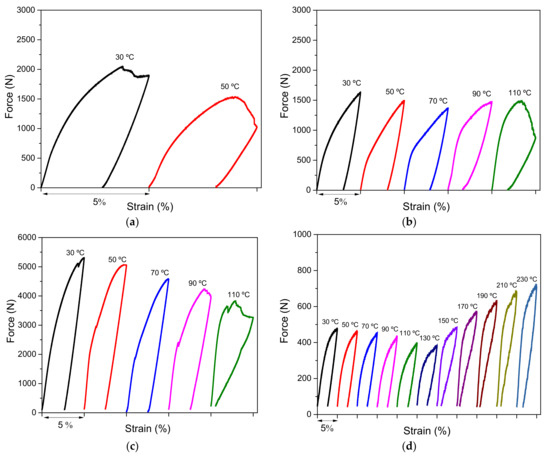
Figure 10.
Quasi-static force vs. strain response of the CuAlMn SMA CSs with 1 mm thick walls for different temperatures. (a) Hexagonal. (b) Diamond. (c) Re-entrant. (d) S-shaped.
Similarly, the cycles evolve with increasing Ttest, which is evident for the S-1 structure in which the peak force values decrease up to 130 °C, the temperature at which the martensite reorientation phenomenon occurs. From 150 °C, a temperature above As (see Table 3), stress-induced phase transformation occurs from the parent austenite phase. As already mentioned, this phenomenon is typical for SMAs and follows a linear relationship between temperature and stress, the Clausius–Clapeyron law.
Figure 11 shows the residual strain behavior of 1 mm thick CuAlMn SMA CSs at different temperatures. The values are nearly constant up to 70 °C, the temperature at which all structures have a partial (H-1, D-1, and R-1) or total (S-1) stable martensitic phase, with values between 2.5% and 3.1%. The D-1 structure presented a residual strain value of approximately 1.7% at 90 °C, with As < 90 °C < Af. For structure R-1, an abrupt drop was observed from 2.5% at 90 °C to 0.5% at 110 °C, a reduction of approximately 80%. Finally, for the S-1 structure, a reduction in residual strain was observed from 150 °C, a temperature higher than As, reaching a recovery peak of 0.67% at 170 °C, the temperature at which the structure presents austenite as a stable crystalline structure. It, therefore, presents the phenomenon of superelasticity. From 190 °C, for the S-1 structure, an increase in residual strain is observed, i.e., irreversible strain with increasing temperature, reaching a maximum of 1.58% at 230 °C, which is probably due to the plasticity of stress-induced martensite variants.
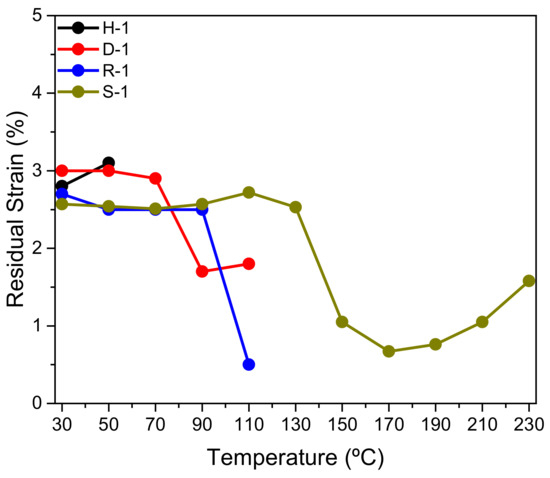
Figure 11.
Residual strain of the CuAlMn SMA CSs with 1 mm thick walls at different test temperatures.
From the load–unload cycles for 1 mm thick CuAlMn SMA CSs, it is possible to determine functional properties such as ks and ED, according to Equations (1) and (2), as shown in Figure 12. As observed in Figure 12a, the ks values for structures with positive Poisson’s ratio decrease with increasing temperature. For structure H-1, the values are approximately 1371.78 kN/m and 735.94 kN/m at 30 °C and 50 °C, respectively, while for structure D-1, the values are approximately 1231.79 kN/m and 656.57 kN/m at 30 °C and 110 °C, respectively.
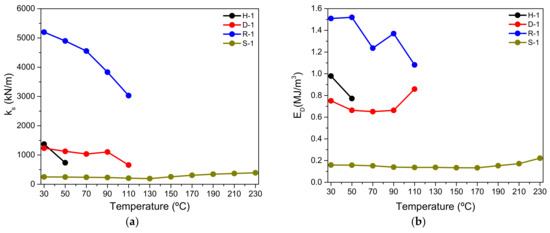
Figure 12.
Mechanical properties of CuAlMn SMA CSs with 1 mm thick walls at different temperatures. (a) Secant stiffness. (b) Dissipated energy per cycle.
As for structures with a negative Poisson’s ratio, both R-1 and S-1 presented the highest and lowest values of ks, respectively, among all the structures analyzed. For structure R-1 at 30 °C and 110 °C, the values are approximately 5198.58 kN/m and 3030.15 kN/m, respectively, a reduction of approximately 41%. On the other hand, the S-1 structure presented two slopes, first decreasing between 30 °C and 110 °C, with values of approximately 251.16 kN/m and 194.08 kN/m, respectively, a reduction of approximately 22%. From 150 °C, ks increased with increasing temperature until reaching a maximum of 391.74 kN/m at 230 °C, an increase in relation to 130 °C of approximately 50%.
Figure 12b shows the ED of 1 mm thick CuAlMn SMA CSs at different temperatures. For structures with positive Poisson’s ratio, H-1 and D-1, at 30 °C the values were approximately 0.979 MJ/m3 and 0.750 MJ/m3, respectively. For structure D-1, in the temperature range between 50 °C and 90 °C, the values were nearly constant, with an average value of approximately 0.65 ± 0.006 MJ/m3, increasing at 110 °C to 0.858 MJ/m3. Among the structures with a negative Poisson’s ratio, the R-1 structure presented the highest ED values among all the structures analyzed, observing a reduction as the temperature increased. At 30 °C and 110 °C the values were approximately 1.509 MJ/m3 and 1.081 MJ/m3, respectively, a 28% reduction. For the S-1 structure, the values remained practically constant in the temperature range between 90 °C and 170 °C, with an average value of approximately 0.136 ± 0.002 MJ/m3. From 190 °C onwards, the values of ED increased again with temperature, reaching a maximum of 0.221 MJ/m3 at 230 °C.
In Figure 13, we compare the percentage difference (Δ in %) of functional mechanical properties such as ks and ED between 0.5 mm and 1 mm thick CuAlMn SMA CSs at 30 °C.
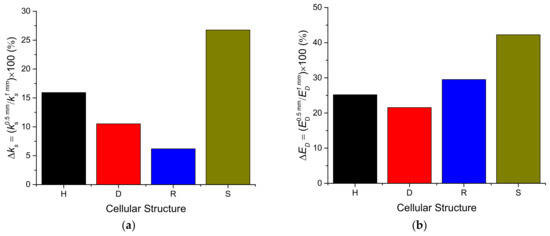
Figure 13.
Percentage difference between the CuAlMn SMA CSs with 0.5 mm and 1 mm thick walls for the mechanical properties at 30 °C. (a) Secant stiffness. (b) Dissipated energy per cycle.
It is evident that the geometric parameters of CS, such as topology and unit cell thickness, strongly influence mechanical properties in different ways. Therefore, it is up to the designer to select such geometric parameters according to the design prerequisites. In the case of ks, shown in Figure 13a, the Δks revealed the following order of sensitivity of the CSs to the wall thickness at 30 °C: s-shaped (S), hexagonal (H), diamond (D), and re-entrant (R); with values of 26.7%, 15.9%, 10.5%, and 6.2%, respectively. In Figure 13b, the ΔED revealed a sensitivity to the thickness of the CuAlMn SMA CSs following in order at 30 °C: S, R, H, and D; with values of 42.2%, 29.5%, 25.2%, and 21.5%, respectively.
It is worth noting that this comparison is limited due to the different phase transformation temperatures of structures of the same unit cell geometry with different thicknesses. Strictly, the test temperature should be the same for both structures, however, in relation to the Mf, for example, Ttest = Mf − 20 °C.
3.5. An Example of Self-Repairing CuAlMn Re-Entrant Cellular Structure
To demonstrate the self-repairing capacity by shape memory effect of these CuAlMn SMA CSs, we photographed the broken R-1 structure (Figure 10c) during heating from room temperature until approximately 150 °C (T ≥ Af) as illustrated in Figure 14. As observed in the unit cell highlights (yellow dashed line), in a time of about 7 s the structure visibly recovered the residual strain, returning to its original shape with the aid of a thermal blower.
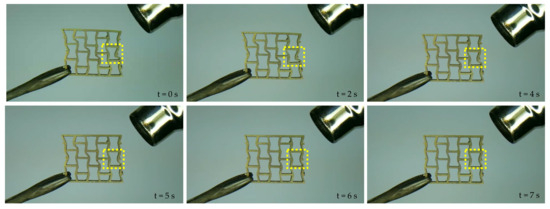
Figure 14.
Photographs of the self-repairing by shape recovery after heating up to 150 °C of the broken R-1 CuAlMn SMA CS.
The intrinsic characteristics of SMAs, such as shape recovery upon heating leading to the concept of self-repairing structures, have attracted the attention of researchers with potential for applications in the automotive, aerospace, and civil engineering industries, for example, as actuators, sensors, and absorber devices. However, it should be noted that the repaired structures were not retested in this initial study.
4. Conclusions
This study presents an experimental investigation about the thermomechanical behavior of CuAlMn SMA cellular structures (CSs), manufactured using rapid investment casting (RIC) with the induction centrifugal casting (ICC) process. We evaluated two types of CS, with 0.5 mm and 1 mm thick walls, with positive Poisson’s ratio, hexagonal (H) and diamond (D) unit cell geometry, and with negative Poisson’s ratio, re-entrant (R) and S-shaped (S).
The efficiency of the selected parameters, such as molten metal temperature and rotation speed with values of approximately 1400 °C and 350 rpm, respectively, allowed the complete filling of the internal cavity of the ceramic molds, demonstrating the feasibility of manufacturing CuAlMn SMA CSs by RIC using the ICC process. A dimensional contraction in thickness between CSs manufactured in CuAlMn SMA and PLA between 2.6% and 5.9%, for structures with 0.5 mm thick walls, and between 11.6% and 14.8% for structures with 1 mm thick walls, was observed.
CuAlMn SMA CSs with 0.5 mm thick walls presented residual strain values lower than structures with 1 mm thick walls, with values in the range between 1.8% and 2.6% for temperatures up to 90 °C and values between 2.5% and 3.1% up to 70 °C, respectively.
At 30 °C, the peak force values of CSs with 0.5 mm thick walls represented between 1/10 and 1/3 of the values observed in structures with 1 mm walls, reaching values up to 5308 N for the R-1 structure, while in the R-0.5 structure the value was approximately 496 N. In general, the CuAlMn SMA CSs presented peak force levels, in descending order: R, H, D, and S.
The secant stiffness and energy dissipated per cycle revealed a thickness sensitivity concerning the unit cell at 30 °C of up to 26.7% and 42.2%, respectively, for the s-shaped structure. On the other hand, the re-entrant structure showed the lowest sensitivity to secant stiffness, while for the energy dissipated per cycle, the diamond structure revealed the lowest sensitivity to thickness, with values of 6.2% and 21.5%, respectively.
Author Contributions
Conceptualization, R.M.N.A. and C.J.D.A.; methodology, R.M.N.A. and P.C.S.S.; software, R.M.N.A.; validation, R.M.N.A., C.J.D.A. and D.F.O.; formal analysis, R.M.N.A. and P.C.S.S.; investigation, C.J.D.A., D.G.L.C. and P.C.S.S.; resources, C.J.D.A. and A.G.B.L.; writing—original draft preparation, R.M.N.A., D.F.O. and P.C.S.S.; writing—review and editing, C.J.D.A., A.G.B.L. and J.M.P.Q.D.; visualization, P.C.S.S. and D.F.O.; supervision, C.J.D.A., D.G.L.C. and A.G.B.L.; project administration, C.J.D.A. and D.G.L.C.; funding acquisition, J.M.P.Q.D., C.J.D.A. and A.G.B.L. All authors contributed to the design, analysis, writing and revision of this paper. All authors have read and agreed to the published version of the manuscript.
Funding
This research was funded through the INCT-EIE (National Institute of Science and Technology—Smart Structures in Engineering, grant number 406148/2022-8), the Brazilian Agencies CNPq (Conselho Nacional de Desenvolvimento Científico e Tecnológico), CAPES (Coordenação de Aperfeiçoamento de Pessoal de Nível Superior), and FAPEMIG (Fundação de Amparo à Pesquisa do Estado de Minas Gerais). It was also funded by the FAPESQ-PB (Fundação de Amparo à Pesquisa do Estado da Paraiba) through the project NISMArt, grant number 044/2023. Moreover, this work was financially supported by national funds through the FCT/MCTES (PIDDAC), under the project 2022. 06841.PTDC—BlueHouseSim—Development of numerical simulation tools and methodologies for high-efficiency off-the-electrical-grid houses, with a DOI: 10.54499/2022.06841.PTDC (https://doi.org/10.54499/2022.06841.PTDC). In addition, this work was financially supported by Base Funding—UIDB/04708/2020, with a DOI: 10.54499/UIDB/04708/2020 (https://doi.org/10.54499/UIDB/04708/2020); Programmatic Funding—UIDP/04708/2020, with a DOI: 10.54499/UIDP/04708/2020 (https://doi.org/10.54499/UIDP/04708/2020) of the CONSTRUCT funded by national funds through the FCT/MCTES (PIDDAC); and FCT through the individual Scientific Employment Stimulus 2020.00828.CEECIND/CP1590/CT0004—DOI: 10.54499/2020.00828.CEECIND/CP1590/CT0004 (https://doi.org/10.54499/2020.00828.CEECIND/CP1590/CT0004).
Data Availability Statement
The original contributions presented in the study are included in the article, further inquiries can be directed to the corresponding author.
Acknowledgments
The authors acknowledge the authors cited in the text, whose studies helped in the improvement of this paper. On behalf of all the authors, Railson de M. N. Alves would like to express their heartfelt gratitude to Rodinei Medeiros Gomes (in memoriam) for his invaluable support and guidance. We acknowledge his significant contributions to this work.
Conflicts of Interest
The authors declare no conflicts of interest.
References
- Rao, A.; Srinivasa, A.R.; Reddy, J.N.; Rao, A.; Srinivasa, A.R.; Reddy, J.N. Introduction to shape memory alloys. In Design of Shape Memory Alloy (SMA) Actuators; Department of Mechanical Engineering, Texas A&M University: College Station, TX, USA, 2015. [Google Scholar] [CrossRef]
- Lagoudas, D.C. (Ed.) Shape Memory Alloys: Modeling and Engineering Applications; Springer: Boston, MA, USA, 2008; ISBN 9780387476858. [Google Scholar] [CrossRef]
- Otsuka, K.; Wayman, C.M. Shape Memory Materials; Cambridge University Press: Cambridge, UK, 1998. [Google Scholar]
- Duerig, T.; Melton, K.; Stockel, D.; Wayman, C. Engineering Aspects of Shape Memory Alloys; Butterworth-Heinemann: London, UK, 1990. [Google Scholar]
- Czechowicz, A.; Langbein, S. (Eds.) Shape Memory Alloy Valves; Springer International Publishing: Cham, Switzerland, 2015. [Google Scholar] [CrossRef]
- Dasgupta, R. A look into Cu-based shape memory alloys: Present scenario and future prospects. J. Mater. Res. 2014, 29, 1681–1698. [Google Scholar] [CrossRef]
- Sutou, Y.; Omori, T.; Wang, J.J.; Kainuma, R.; Ishida, K. Characteristics of Cu–Al–Mn-based shape memory alloys and their applications. Mater. Sci. Eng. A 2004, 378, 278–282. [Google Scholar] [CrossRef]
- Kumar, P.; Jain, A.K.; Hussain, S.; Pandey, A.; Dasgupta, R. Changes in the properties of Cu-Al-Mn shape memory alloy due to quaternary addition of different elements. Matéria 2015, 20, 284–292. [Google Scholar] [CrossRef]
- Wang, Q.; Han, F.; Cui, C. Effects of macroscopic graphite particulates on the damping behavior of CuAlMn shape memory alloy. J. Mater. Sci. 2007, 42, 5029–5035. [Google Scholar] [CrossRef]
- Xiao, Z.; Fang, M.; Li, Z.; Xiao, T.; Lei, Q. Structure and properties of ductile CuAlMn shape memory alloy synthesized by mechanical alloying and powder metallurgy. Mater. Des. 2014, 58, 451–456. [Google Scholar] [CrossRef]
- Bitzer, T. Honeycomb Technology; Springer: New York, NY, USA, 1998. [Google Scholar]
- Gibson, L.J.; Ashby, M.F. Cellular Solids-Structure and Properties; Cambridge University Press: Cambridge, UK, 1997. [Google Scholar] [CrossRef]
- Guo, S.; Zhang, G.; Li, L.; Wang, W.; Zhao, X. Effect of materials and modelling on the design of the space-based lightweight mirror. Mater. Des. 2009, 30, 9–14. [Google Scholar] [CrossRef]
- Sanami, M.; Ravirala, N.; Alderson, K.; Alderson, A. Auxetic materials for sports applications. Procedia Eng. 2014, 72, 453–458. [Google Scholar] [CrossRef]
- Duncan, O.; Shepherd, T.; Moroney, C.; Foster, L.; Venkatraman, P.D.; Winwood, K.; Allen, K.; Alderson, A. Review of auxetic materials for sports applications: Expanding options in comfort and protection. Appl. Sci. 2018, 8, 941. [Google Scholar] [CrossRef]
- Ju, J.; Ananthasayanam, B.; Summers, J.D.; Joseph, P. Design of cellular shear bands of a non-pneumatic tire-investigation of contact pressure. SAE Int. J. Passeng. Cars-Mech. Syst. 2010, 3, 598–606. [Google Scholar] [CrossRef]
- Subasi, O.; Karaismailoglu, B.; Ashkani-Esfahani, S.; Lazoglu, I. Investigation of lattice infill parameters for additively manufactured bone fracture plates to reduce stress shielding. Comput. Biol. Med. 2023, 161, 107062. [Google Scholar] [CrossRef]
- Meena, K.; Singamneni, S. A new auxetic structure with significantly reduced stress concentration effects. Mater. Des. 2019, 173, 107779. [Google Scholar] [CrossRef]
- Novak, N.; Vesenjak, M.; Ren, Z. Auxetic cellular materials-a review. Stroj. Vestn. -J. Mech. Eng. 2016, 62, 485–493. [Google Scholar] [CrossRef]
- Kolken, H.M.; Zadpoor, A.A. Auxetic mechanical metamaterials. RSC Adv. 2017, 7, 5111–5129. [Google Scholar] [CrossRef]
- Shaw, J.A.; Grummon, D.S.; Foltz, J. Superelastic NiTi honeycombs: Fabrication and experiments. Smart Mater. Struct. 2007, 16, S170. [Google Scholar] [CrossRef]
- Okabe, Y.; Sugiyama, H.; Inayoshi, T. Lightweight actuator structure with SMA honeycomb core and CFRP skins. J. Mech. Des. 2011, 133, 011006. [Google Scholar] [CrossRef]
- Hassan, M.R.; Scarpa, F.; Mohamed, N.A.; Ruzzene, M. Tensile properties of shape memory alloy chiral honeycombs. Phys. Status Solidi B 2008, 245, 2440–2444. [Google Scholar] [CrossRef]
- De Brito Simoes, J.; de Araújo, C.J. Nickel–titanium shape memory alloy mechanical components produced by investment casting. J. Intell. Mater. Syst. Struct. 2018, 29, 3748–3757. [Google Scholar] [CrossRef]
- Albuquerque, C.E.S.; Silva, P.C.S.; Grassi, E.N.D.; De Araujo, C.J.; Delgado, J.M.P.Q.; Lima, A.G.B. Optimizing the Gating System for Rapid Investment Casting of Shape Memory Alloys: Computational Numerical Analysis for Defect Minimization in a Simple-Cubic Cell Structure. Metals 2023, 13, 1138. [Google Scholar] [CrossRef]
- Montenegro, E.O.S.; Grassi, E.N.D.; Simões, J.B.; da Silva, P.S.; De Araújo, C.J. NiTi shape memory alloy cellular meshes: Manufacturing by investment casting and characterization. Smart Mater. Struct. 2020, 29, 125008. [Google Scholar] [CrossRef]
- Santiago, J.J.D.M.; Simões, J.D.B.; Araújo, C.J.D. Thermomechanical characterization of superelastic Ni-Ti SMA helical extension springs manufactured by investment casting. Mater. Res. 2019, 22, e20180852. [Google Scholar] [CrossRef]
- Zak, G.; Kneissl, A.C.; Zatulskij, G. Shape memory effect in cryogenic Cu-Al-Mn alloys. Scr. Mater. 1996, 34, 363–367. [Google Scholar] [CrossRef]
- Mallik, U.S.; Sampath, V. Influence of aluminum and manganese concentration on the shape memory characteristics of Cu–Al–Mn shape memory alloys. J. Alloys Compd. 2008, 459, 142–147. [Google Scholar] [CrossRef]
- Gholami-Kermanshahi, M.; Wu, Y.Y.; Lange, G.; Chang, S.H. Effect of alloying elements (Nb, Ag) on the damping performance of Cu–Al–Mn shape memory alloys. J. Alloys Compd. 2023, 930, 167438. [Google Scholar] [CrossRef]
- De Brito Simões, J.; Pereira, F.F.R.; Otubo, J.; de Araújo, C.J. Influence of Heat Treatments on a NiTi Shape Memory Alloy Obtained Using Vacuum Induction Melting and Reprocessed by Plasma Skull Push-Pull. MRS Online Proc. Libr. 2015, 1765, 121–126. [Google Scholar] [CrossRef]
- Otsuka, K.; Ren, X. Physical metallurgy of Ti–Ni-based shape memory alloys. Prog. Mater. Sci. 2005, 50, 511–678. [Google Scholar] [CrossRef]
- Habib, F.N.; Iovenitti, P.; Masood, S.H.; Nikzad, M. Cell geometry effect on in-plane energy absorption of periodic honeycomb structures. Int. J. Adv. Manuf. Technol. 2018, 94, 2369–2380. [Google Scholar] [CrossRef]
- De Souza, E.F.; da Silva, P.C.S.; Grassi, E.N.D.; De Araújo, C.J.; de Lima, A.G.B. Critical frequency of self-heating in a superelastic Ni-Ti belleville spring: Experimental characterization and numerical simulation. Sensors 2021, 21, 7140. [Google Scholar] [CrossRef]
- Logakannan, K.P.; Ramachandran, V.; Rengaswamy, J.; Gao, Z.; Ruan, D. Quasi-static and dynamic compression behaviors of a novel auxetic structure. Compos. Struct. 2020, 254, 112853. [Google Scholar] [CrossRef]
- Xiao, D.; Dong, Z.; Li, Y.; Wu, W.; Fang, D. Compression behavior of the graded metallic auxetic reentrant honeycomb: Experiment and finite element analysis. Mater. Sci. Eng. A 2019, 758, 163–171. [Google Scholar] [CrossRef]
- Dong, Z.; Li, Y.; Zhao, T.; Wu, W.; Xiao, D.; Liang, J. Experimental and numerical studies on the compressive mechanical properties of the metallic auxetic reentrant honeycomb. Mater. Des. 2019, 182, 108036. [Google Scholar] [CrossRef]
- Ingrole, A.; Hao, A.; Liang, R. Design and modeling of auxetic and hybrid honeycomb structures for in-plane property enhancement. Mater. Des. 2017, 117, 72–83. [Google Scholar] [CrossRef]
- Meena, K.; Singamneni, S. Novel hybrid auxetic structures for improved in-plane mechanical properties via additive manufacturing. Mech. Mater. 2021, 158, 103890. [Google Scholar] [CrossRef]
- Wang, K.; Chang, Y.H.; Chen, Y.; Zhang, C.; Wang, B. Designable dual-material auxetic metamaterials using three-dimensional printing. Mater. Des. 2015, 67, 159–164. [Google Scholar] [CrossRef]
Disclaimer/Publisher’s Note: The statements, opinions and data contained in all publications are solely those of the individual author(s) and contributor(s) and not of MDPI and/or the editor(s). MDPI and/or the editor(s) disclaim responsibility for any injury to people or property resulting from any ideas, methods, instructions or products referred to in the content. |
© 2024 by the authors. Licensee MDPI, Basel, Switzerland. This article is an open access article distributed under the terms and conditions of the Creative Commons Attribution (CC BY) license (https://creativecommons.org/licenses/by/4.0/).