Article

Plastic Shakedown Behavior and Deformation Mechanisms of Ti17 Alloy under Long Term Creep–Fatigue Loading

National Inovation Center of Defence Industry for Precise Forging and Ring Rolling, Northwestern Polytechnical University, Xi’an 710072, China
*
Author to whom correspondence should be addressed.
Metals 2024, 14(7), 743; https://doi.org/10.3390/met14070743
Submission received: 6 May 2024 / Revised: 13 June 2024 / Accepted: 17 June 2024 / Published: 22 June 2024
(This article belongs to the Special Issue Plasticity and Metal Forming)

Abstract

:
Ti17 alloy is mainly used to manufacture aero-engine discs due to its excellent properties such as high strength, toughness and hardenability. It is often subjected to creep–fatigue cyclic loading in service environments. Shakedown theory describes the state in which the accumulated plastic strain of the material stabilizes after several cycles of cyclic loading, without affecting its initial function and leading to failure. This theory includes three behaviors: elastic shakedown, plastic shakedown and ratcheting. In this paper, the creep–fatigue tests (CF) were conducted on Ti17 alloy at 300 °C to study its shakedown behavior under creep–fatigue cyclic loading. Based on the plasticity–creep superposition model, a theory model that accurately describes the shakedown behavior of Ti17 alloy was constructed, and ABAQUS finite element software was used to validate the accuracy of the model. TEM analysis was performed to observe the micro-mechanisms of shakedown in Ti17 alloy. The results reveal that the Ti17 alloy specimens exhibit plastic shakedown behavior after three cycles of creep–fatigue loading. The established finite element model can effectively predict the plastic shakedown process of Ti17 alloy, with a relative error between the experimental and simulation results within 4%. TEM results reveal that anelastic recovery controlled by dislocation bending and back stress hardening caused by inhomogeneous deformation are the main mechanisms for the plastic shakedown behavior of Ti17 alloy.

1. Introduction

Titanium alloys are commonly used to manufacture rotating components of aero-engines, such as blades, discs and shafts, due to their high specific strength, excellent creep resistance and corrosion resistance [1,2]. These critical components not only experience fatigue loading caused by frequent start-stop processes but also creep loading and thermal stresses during the cruise phase [3,4]. The mechanical behavior of materials under creep–fatigue cyclic loading is well summarized by the shakedown theory. Material shakedown refers to the state in which the accumulated plastic strain in the material stabilizes after several load cycles without affecting its initial function, leading to failure. In general, under cyclic loading, materials mainly exhibit three mechanical behaviors: elastic shakedown, plastic shakedown and ratcheting [5]. Both elastic and plastic shakedown correspond to a steady accumulation of plastic strain, while ratcheting corresponds to the continuous accumulation of plastic deformation that eventually leads to failure [6]. Studying the shakedown behavior of titanium alloys under creep–fatigue cyclic loading is of great practical significance for rationally determining the permissible range of cyclic loading in titanium alloy materials, maximizing their load-bearing potential and guaranteeing the safe and stable operation of aero-engines.
In recent years, a lot of research has been carried out on the creep–fatigue of titanium alloys, but it has been concentrated on life prediction and damage, etc. Yutaro Ota et al. [7] proposed a more universal life assessment method within the range of DTotal = 0.6–1.2 to evaluate creep–fatigue damage without considering the microstructure, based on linear damage accumulation theory. Zhang Mingda et al. [8] investigated the influence of holding time and stress ratio on the creep–fatigue life of Ti6242 alloy. They found that longer holding times caused a monotonic decrease in creep–fatigue life, while higher stress ratios caused an exponential increase in creep–fatigue life. Kumar et al. [9] investigated creep–fatigue damage across multiple scales of the Ti-6Al-4V alloy based on damage mechanics, developed a multi-scale damage model and created a creep–fatigue damage map. L.R. Zeng et al. [10] conducted in situ tests to understand the creep–fatigue damage mechanism of the bimodal titanium alloy Ti-6Al-4V and described a new mechanism in which elastic deformation of the αs phase was gradually converted into plastic deformation during the creep stage from the perspective of stress relaxation, thus promoting fatigue damage. However, shakedown behavior under creep–fatigue cyclic loading has received little attention. Therefore, studying the shakedown behavior of titanium alloys under creep–fatigue cyclic loading and its micro-mechanisms has great theoretical significance in filling the current research gap in this field.
Ti17 alloy is a β-type bimodal titanium alloy with high strength, toughness and hardenability [11,12]. It is one of the most important materials for aero-engines, mainly used to manufacture engine discs [13]. These parts are subjected to the long-term combined effects of creep, fatigue and temperature in service. In this paper, creep–fatigue (CF) cyclic loading tests of Ti17 alloy were conducted, focusing on characterizing the shakedown behavior of Ti17 alloy from the perspective of stress–strain curves. The evolution of strain components during shakedown was analyzed, such as creep strain, residual strain, anelastic strain and ratcheting strain obtained by decomposing the total strain. Furthermore, based on the plasticity–creep superposition model, as proposed by Kan Qianhua et al. [14,15], a theory model for shakedown behavior was established according to the results of tensile tests, low-cycle fatigue (LCF) tests and CF tests. Because this model takes into account the phenomenon of anelasticity, it can provide a more accurate description of creep–fatigue with longer stress-holding times. Additionally, TEM analysis was carried out to preliminarily explain the micro-mechanisms of the Ti17 alloy undergoing CF testing to reach a shakedown state. Understanding the shakedown behavior of Ti17 titanium alloy is significant in fully exploiting the material’s potential.

2. Materials and Experiments

2.1. As-Received Material

The as-received material used in the CF tests is Ti17 alloy with a uniform basket-weave microstructure, as shown in Figure 1. It can be seen that the original microstructure consists of interwoven layers of α colonies and β-transformed matrices between the α phases. The α phase contains a small number of dislocations, which terminate at the α/β phase boundaries, with localized areas of dislocation entanglement. The main chemical composition of the Ti17 alloy is shown in Table 1.

2.2. Mechanical Tests

Tensile tests, LCF tests and CF tests are performed on the as-received material. CF tests are used to study the shakedown behavior, and tensile and LCF tests are used to determine the material parameters of the shakedown theory model.
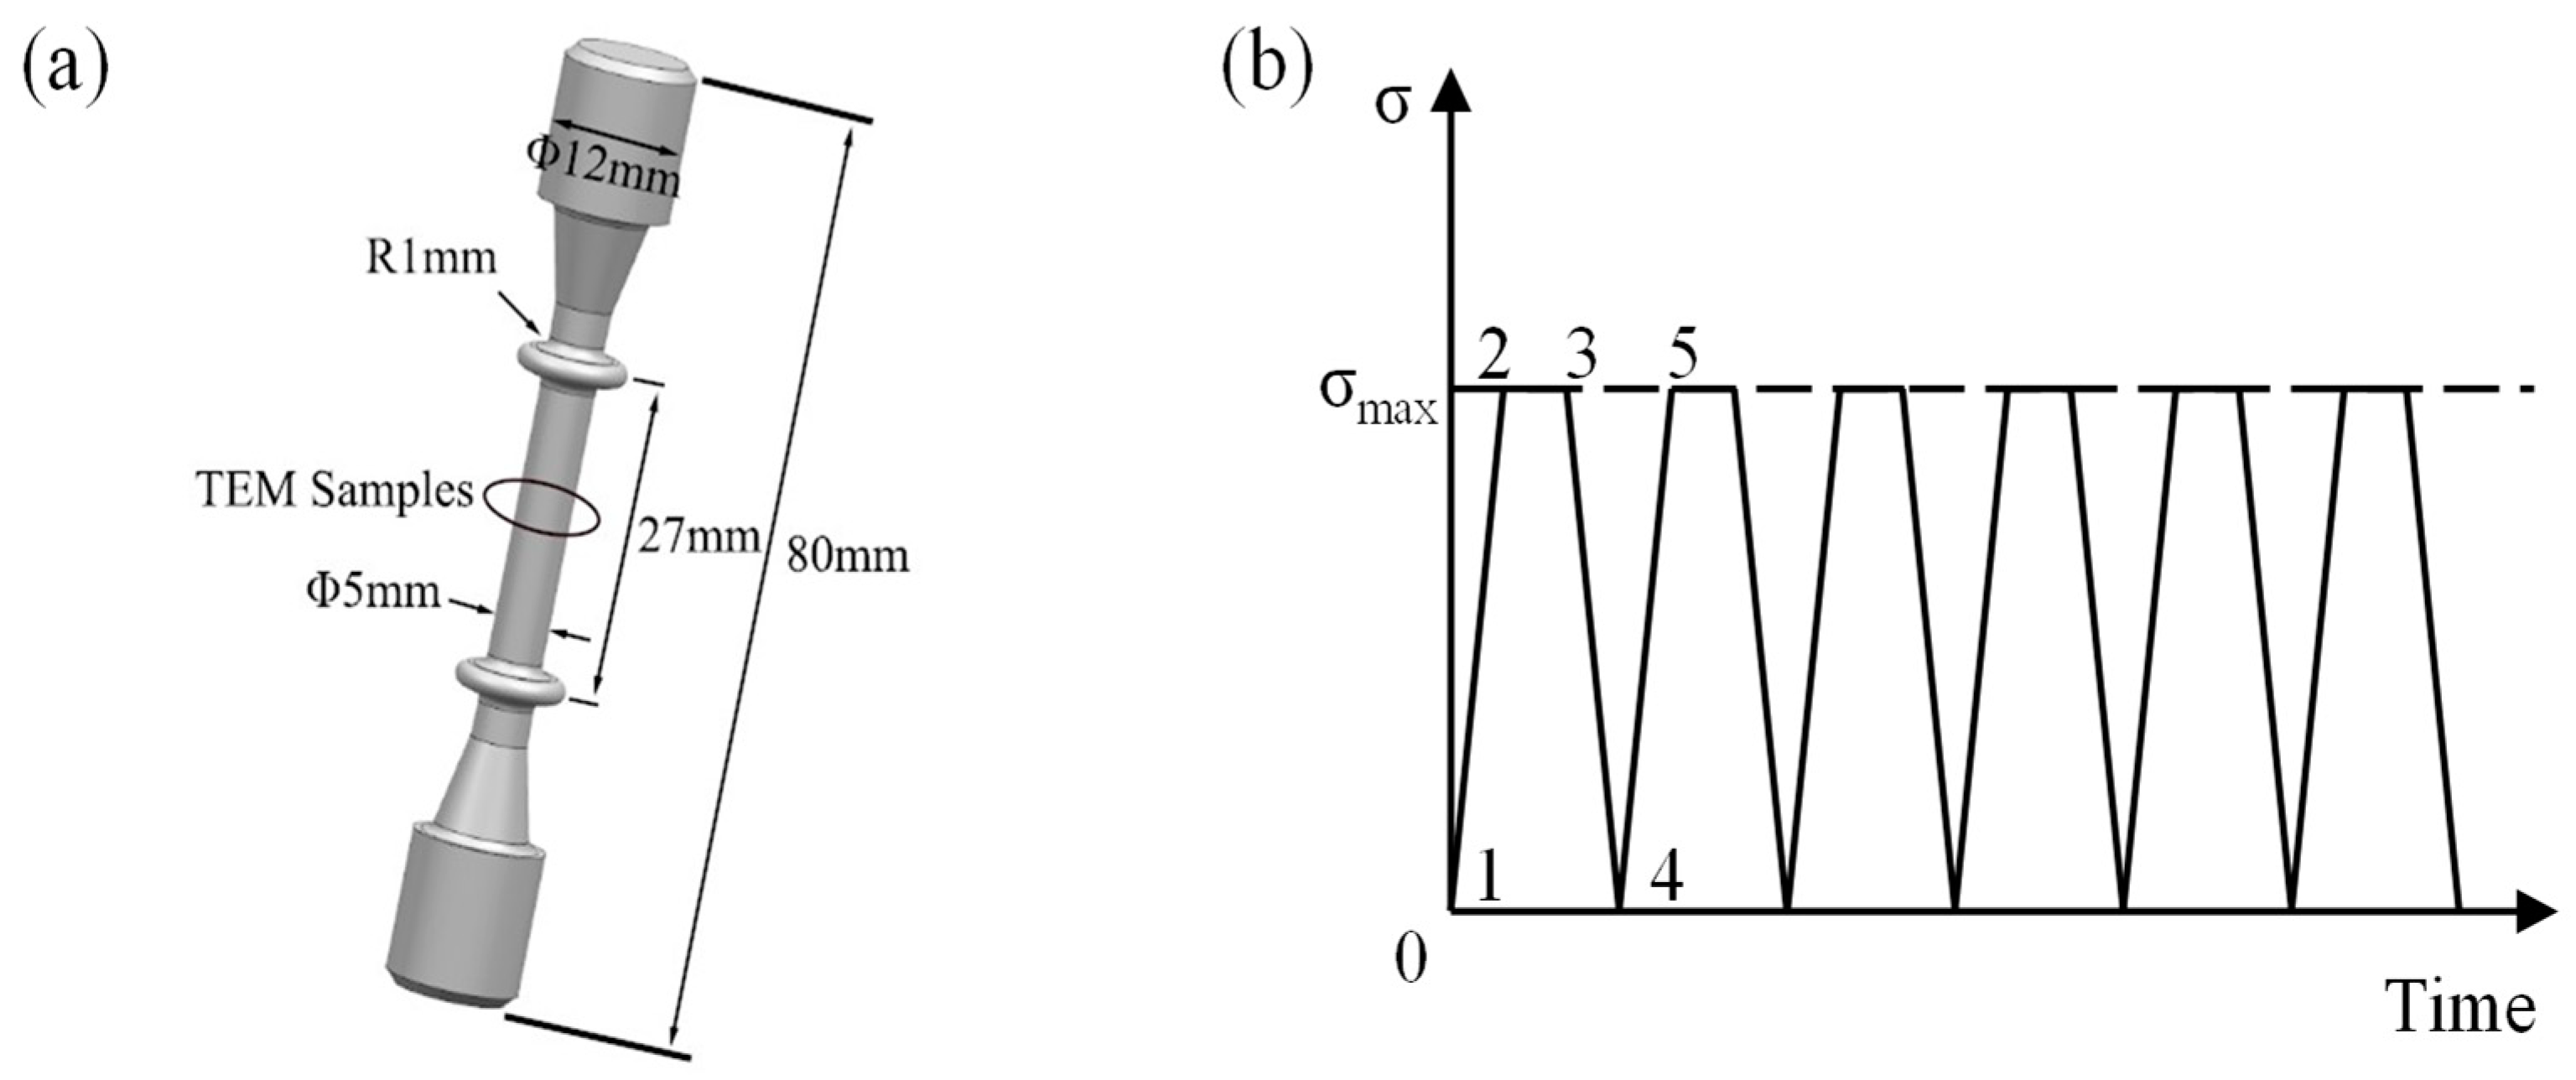
For CF tests, the specimen is shown in Figure 2a. The stress-controlled CF tests are conducted at 300 °C, which is the typical service temperature of Ti17 alloy. The specimen is heated to the designated temperature and held for 30 min to achieve a uniform temperature distribution. Then, the heated specimen is loaded to 600 MPa with a load speed of 0.03 KN/s and holds the stress for 60 min, as shown in Figure 2b from point 1 to point 3. After the stress holding, the specimen is unloaded to 0 MPa with an unloading speed of 0.03 KN/s, as shown in Figure 2b from point 3 to point 4. Then, from point 4 to point 5, the stress is again loaded at a speed of 0.03 KN/s to 600 MPa, repeating the process of the previous cycle. A total of 6 cycles of the above process are performed throughout the CF tests.
A CNCJ-100E type electronic persistent creep testing machine was used for the CF tests. Three pairs of thermocouple wires are attached to the bottom, center and top positions of specimens to record the temperature during tests and the temperature difference is within ±2 °C. The strain for CF tests is measured by a high-temperature extensometer.
For tensile and LCF tests, tensile tests are conducted at 300 °C with controlled strain rates of 0.008%/s and 0.08%/s, respectively. LCF tests with strain amplitude ±2% and strain rate 0.08%/s are conducted at 300 °C too. The tensile tests are performed using the CMT5105 electronic universal testing machine (MTS, Shenzhen, CHN ), and the LCF tests are conducted on the EHF-EV101K2 electro-hydraulic servo fatigue testing machine (Shimadzu Corporation, Shimadzu, Kyoto, JPN).

2.3. Microstructure Characterization

To reveal the shakedown mechanism of Ti17 alloy under CF tests, TEM is performed to analyze the evolution of dislocations. TEM samples are prepared along the transverse section of the specimens, thinned to 50 μm by mechanical grinding. Then the twin-jet thinning technique is used to reduce the thin zone in the center of samples at 28 V and −25 °C. The mixed solution used in the twin-jet thinning technique is 6% HClO4: 34% C4H9OH: 60% CH3OH. TEM observations are conducted on a ThermoFisher Talos F200X (Waltham, MA, USA) transmission electron microscope with an accelerating voltage of 300 KV.

3. Shakedown Theory Model

The model used in this paper is based on the plasticity–creep superposition model, proposed by Kan Qianhua et al. [14,15], which has been verified to be able to reasonably predict the mechanical behaviors of metal materials under uniaxial CF cyclic loading. The anelastic recovery of materials is reflected by the back stress static recovery term and the thermal recovery term in the nonlinear kinematic hardening model. Because this model takes into account the phenomenon of anelasticity, it can provide a more accurate description of creep–fatigue with longer stress-holding times.

3.1. Main Equations

The main equations of the theory model adopted in this paper are shown as follows:
ε i j = ε i j e + ε i j i n + ε i j c + ε i j T
ε i j e = D i j k l - 1 σ k l
ε ˙ i j i n = 3 2 F y K n S i j α i j S i j α i j
ε ˙ i j i n = 3 2 ( 3 2 ε ˙ c : ε ˙ c ) 1 / 2 S i j S i j
ε ˙ i j T = c i j T ˙ δ i j
F y = 3 2 ( S i j α i j ) ( S i j α i j ) - Q
S i j   = σ i j 1 3 σ k k δ i j
Q ˙ = γ ( Q s a Q ) p ˙
where ε i j , ε i j e , ε i j i n and ε i j c are the total strain, elastic strain, inelastic strain and creep strain, respectively; ε ˙ i j i n is inelastic strain rate, ε ˙ i j c is creep strain rate and ε ˙ i j T is thermal strain rate; Dijkl is matrix of elasticity; K and n are the viscosity constant and viscosity index;   is McCauley’s bracket and means that as x ≤ 0, x = 0 ; as x > 0, x = x ; cij is isotropic coefficient of thermal expansion; Sij is deviatoric stress, αij is back stress; Q is isotropic deformation resistance, Q ˙ is isotropic hardening rate, Qsa is the saturated isotropic reinforcement deformation resistance; γ is isotropic hardening rate parameter.

3.2. Ohno–Abdel–Karim Nonlinear Kinematic Hardening

The evolution equations of nonlinear kinematic hardening [16] with a critical state of dynamic recovery are used in this paper, back stress αij is divided into M components:
α i j = k = 1 M r ( k ) b i j ( k )
the critical state of dynamic recovery is reflected by a surface f ( k ) = α ¯ ( k ) 2 r ( k ) 2 = 0 , where α ¯ ( k ) = ( 3 2 α ( k ) : α ( k ) ) 1 2 is equivalent back stress, and r ( k ) is the radius of the critical surface.
b ˙ i j ( k ) = 2 3 ς ( k ) ε ˙ i j i n ς ( k ) [ μ ( k ) p ˙ + H ( f ( k ) ) ε ˙ i j i n : α i j ( k ) α ¯ ( k ) μ ( k ) p ˙ ] b i j ( k ) x ( k ) ( α ¯ ( k ) ) m ( k ) 1 b i j ( k )
The last two terms of Equation (10) are the back stress static recovery term and the thermal recovery term, respectively, and the introduction of these two terms can improve the accuracy of the model prediction of the high-temperature cyclic loading behavior. ζ(k), μ(k), χ(k), m(k) are the temperature-dependent constants; H(f(k)) is Heaviside function, which means that as f(k) > 0, H(f(k)) = 1; and as f(k) ≤ 0 H(f(k)) = 0.

3.3. Determination of Material Parameters

The material parameter modulus of elasticity E and Poisson’s ratio ν are obtained by tensile tests. The viscosity constant K and viscosity index n can be obtained by monotonic tensile tests at different strain rates. For monotonic tensile tests, plastic strain rate p ˙ = [ σ e Q / K ] n , and equivalent stress σe is equal to the tensile stress σ. Take the maximum stress point of the tensile curve; at this point, isotropic deformation resistance Q = Qsa; through the two sets of tensile curves at different strain rates can be found using the material parameters K and n [17].
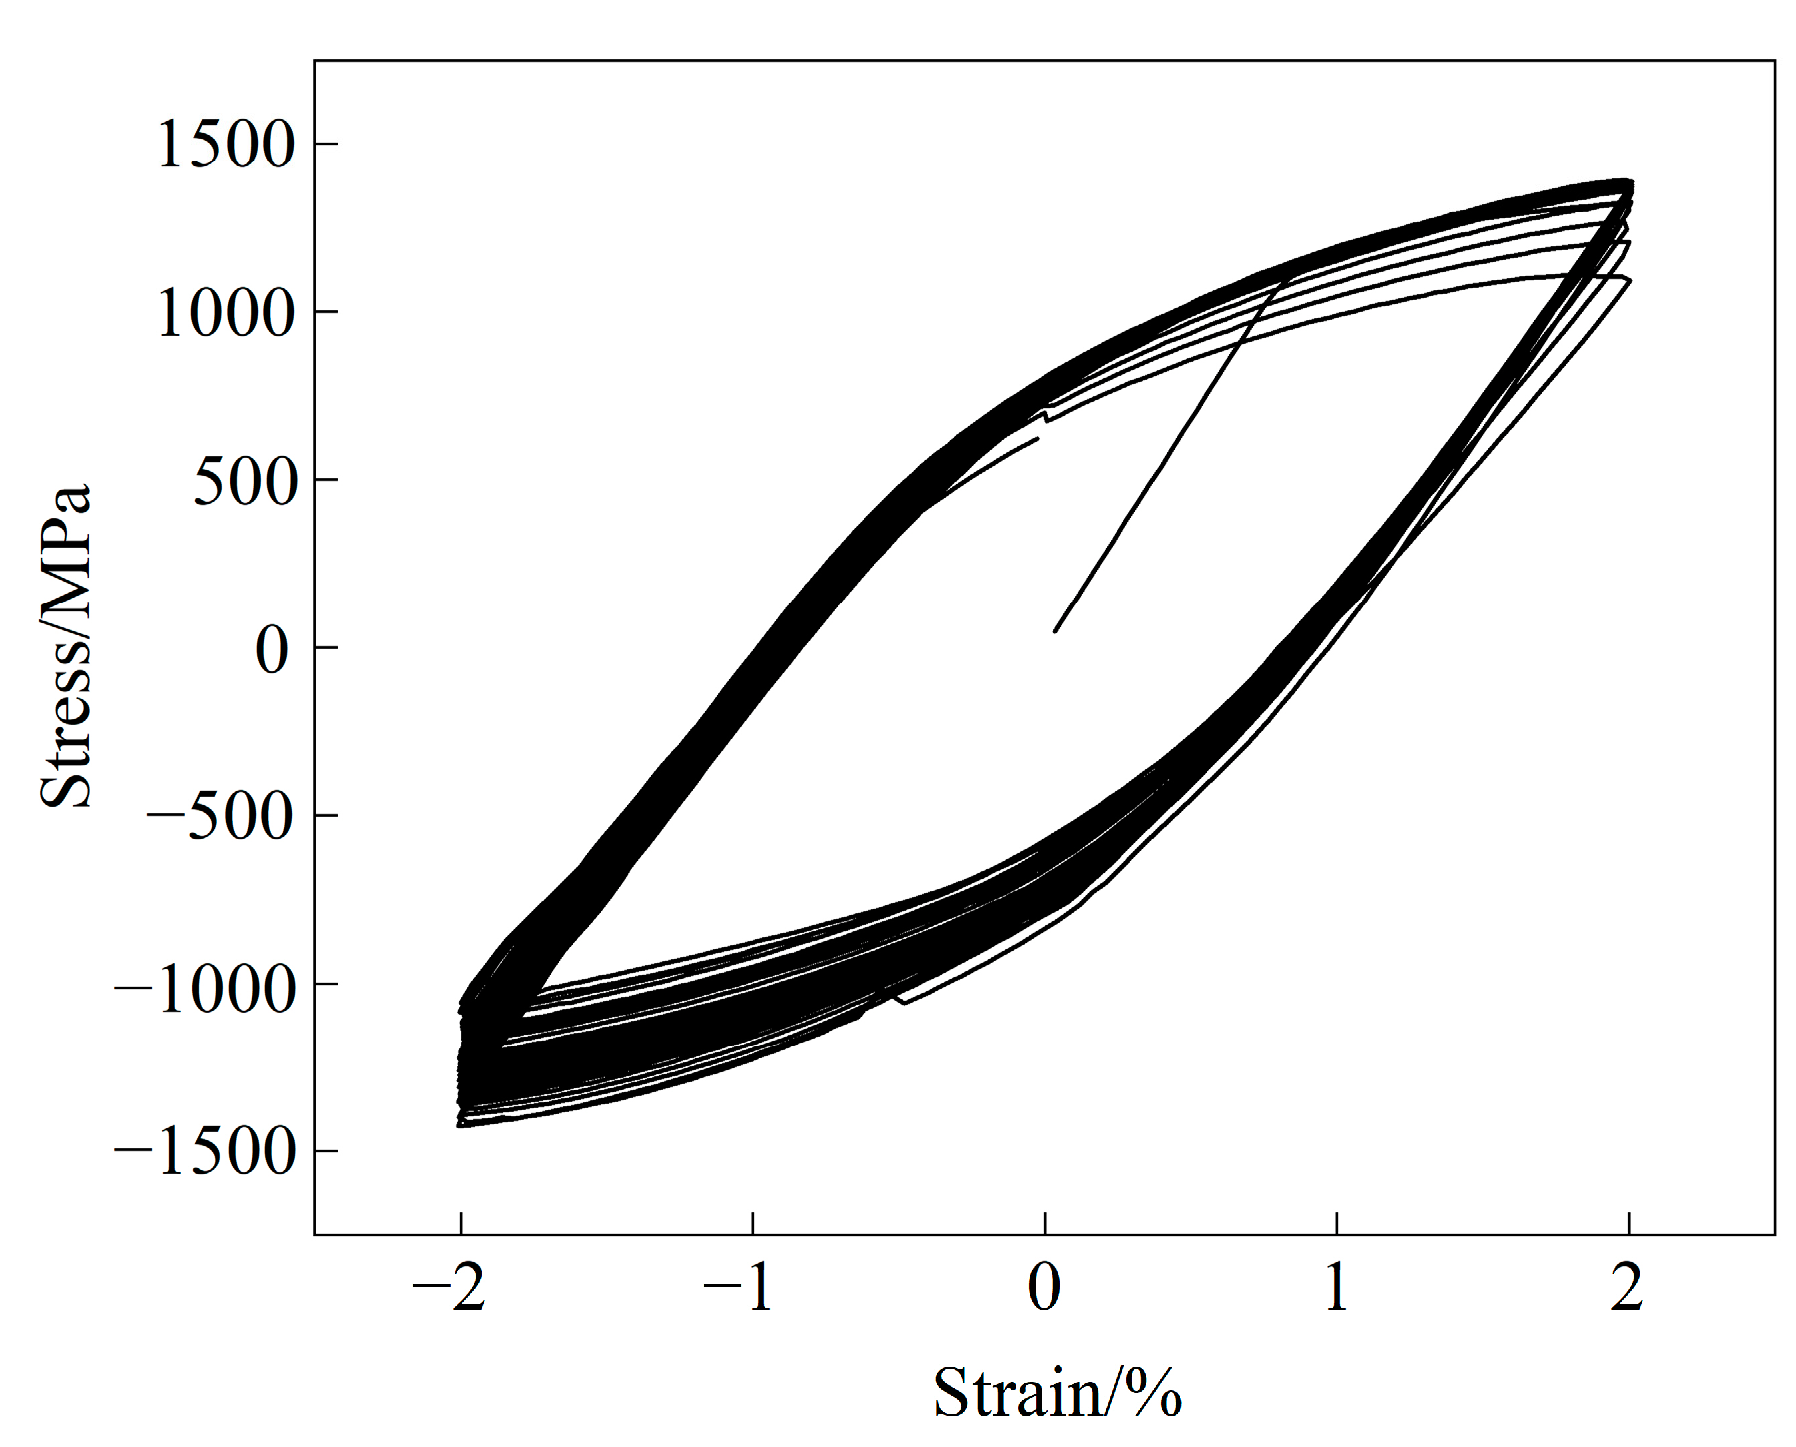
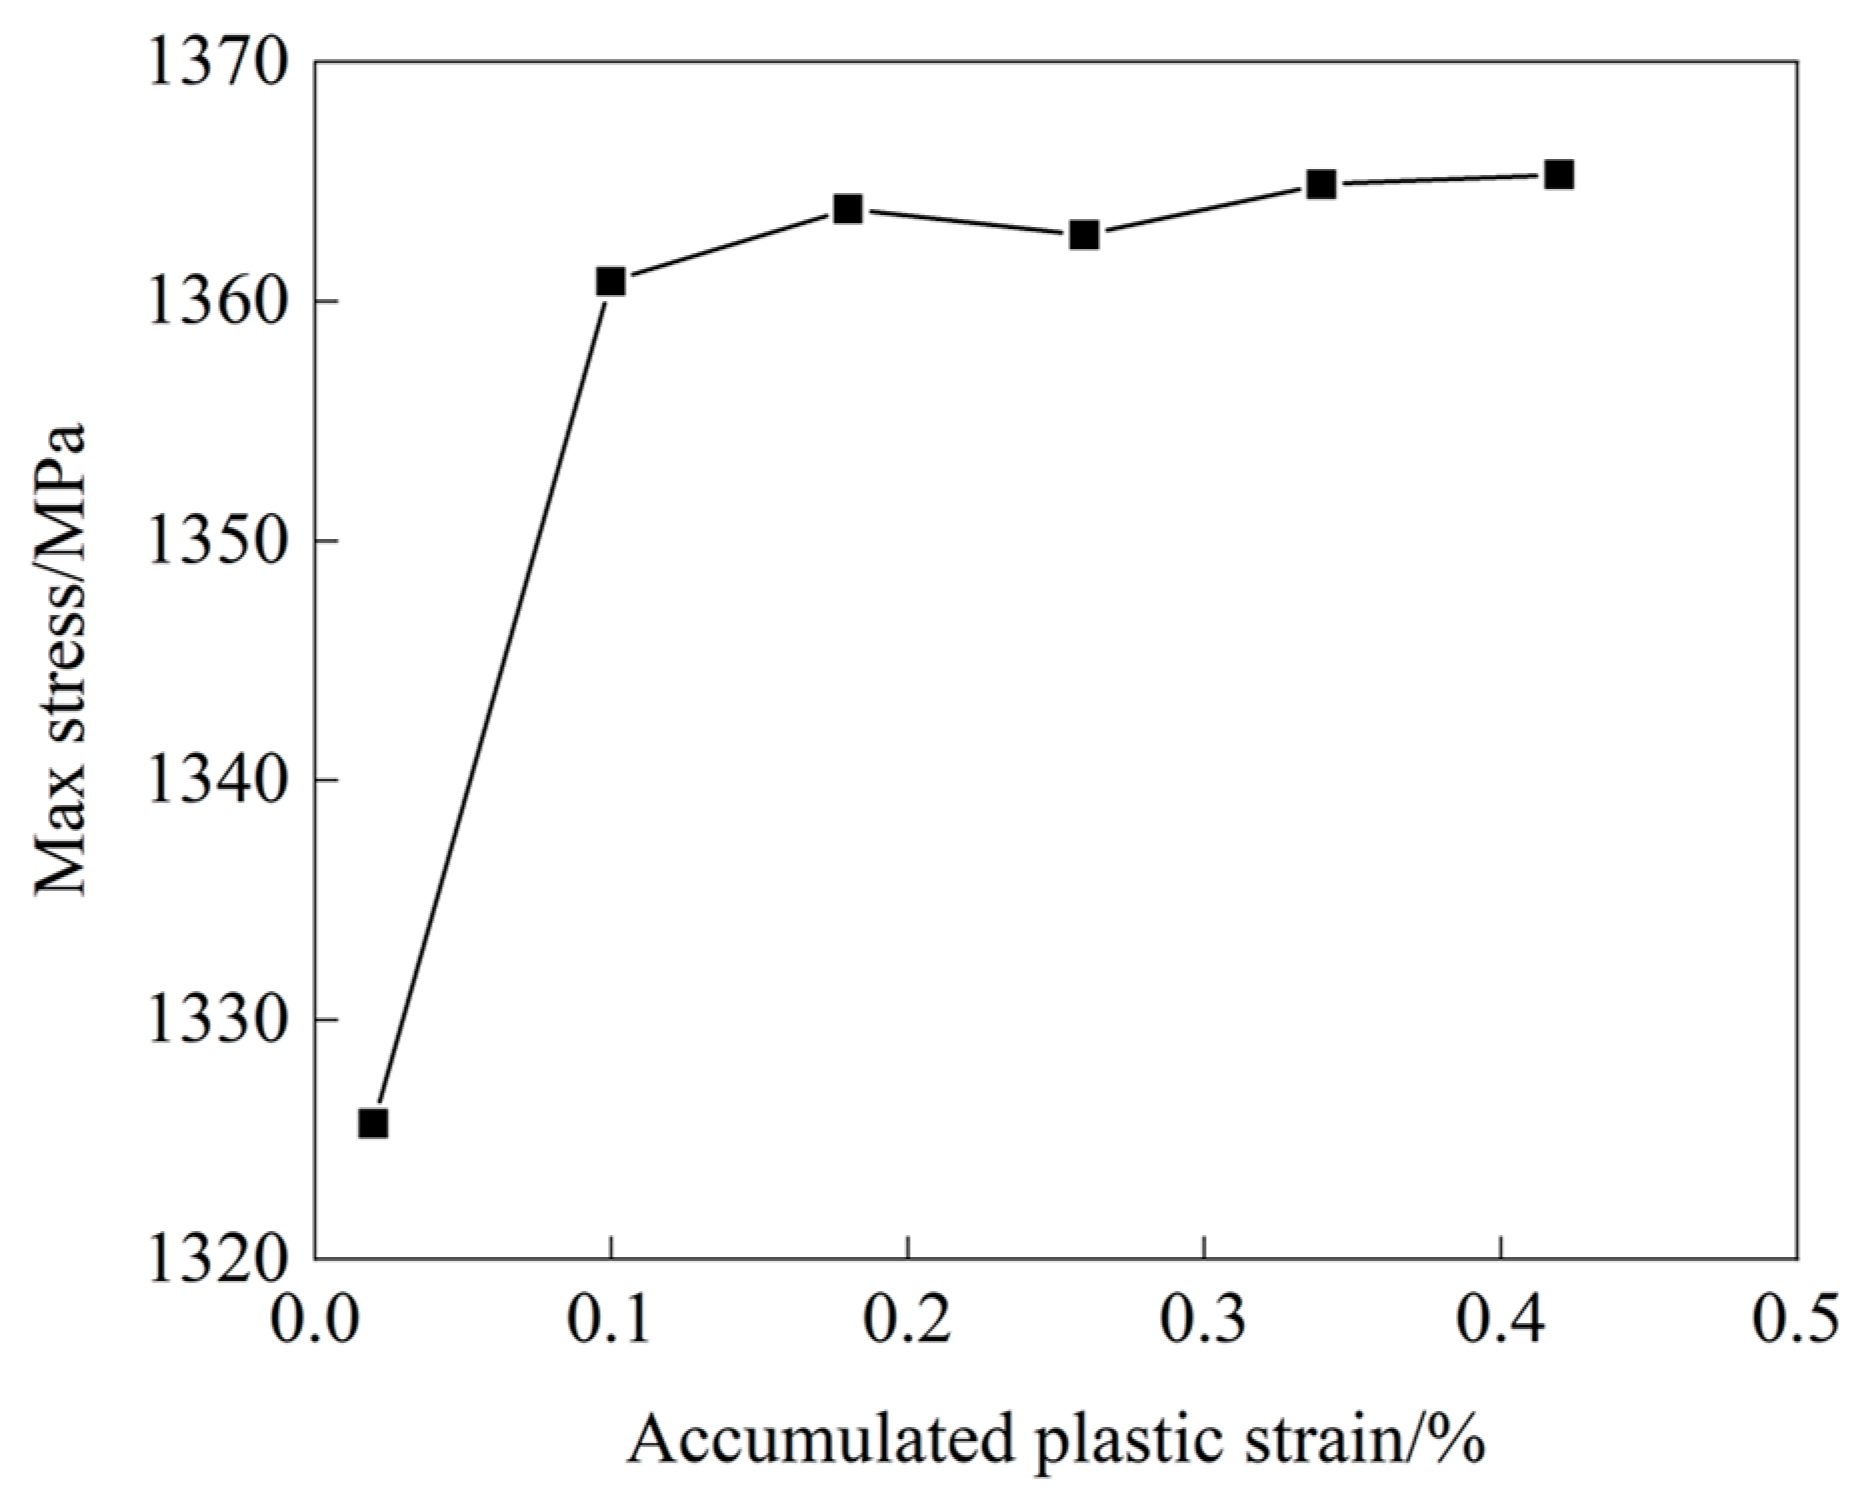
Due to the presence of isotropic hardening, the effect of isotropic hardening must be removed before determining the kinematic hardening parameters ζ(k) and r(k) [18,19]. Assuming that the cyclic hardening is reflected only by isotropic hardening, the relationship curve of the evolution of the cyclic maximum stress σmax with the accumulated plastic strain p can be obtained from strain-controlled cyclic loading tests under a certain strain amplitude. Figure 3 shows the stress–strain curves under uniaxial strain cycling with a strain amplitude of 2%, and Figure 4 gives the relationship between the maximum stress σmax and the accumulated plastic strain p in each cycle. Fitting the curves shown in Figure 4, we can obtain the following function reflecting isotropic hardening:
σ m a x = σ m a x 0 ( 1 + 67.486 p ) 0.0098
where σ m a x 0 is the peak stress of the first cycle. Defining the function h(p) = (1 + 67.486p)0.0098, the effect of isotropic hardening on monotonic tensile tests can be removed by using Equation (12).
σ* = σ/h(p)
The monotonic tensile curve after the removal of isotropic hardening is shown in Figure 5. The saturated isotropic deformation resistance Qsa is the maximum difference between σ and σ* in the figure, and the initial isotropic deformation resistance Q0 is the stress at the beginning of the elastic phase of the tensile curve when it is transformed into the yield phase. The kinematic hardening parameters ζ(k) and r(k) are determined by Equations (13) and (14) [14,18,20], respectively, and σ0 is the corresponding stress when ε 0 p = 0 in the monotonic tensile curve.
ζ ( k ) = 1 ε k p
r ( k ) = ( σ k σ k 1 ε k p ε k 1 p σ k + 1 σ k ε k + 1 p ε k p ) ε k p
In addition, the isotropic hardening rate parameter γ was determined by fitting the relationship curve between maximum stress σmax and accumulated plastic strain p, as shown in Figure 4, through Equation (14); the ratchet parameter μ and the back stress thermal recovery parameters x(k) and m(k) were obtained by trial-and-error based on the results of creep–fatigue experiments [14].
σmax = f1 + f2[1 − exp(−γp)]

4. Results and Discussion

4.1. Stress–Strain Curves

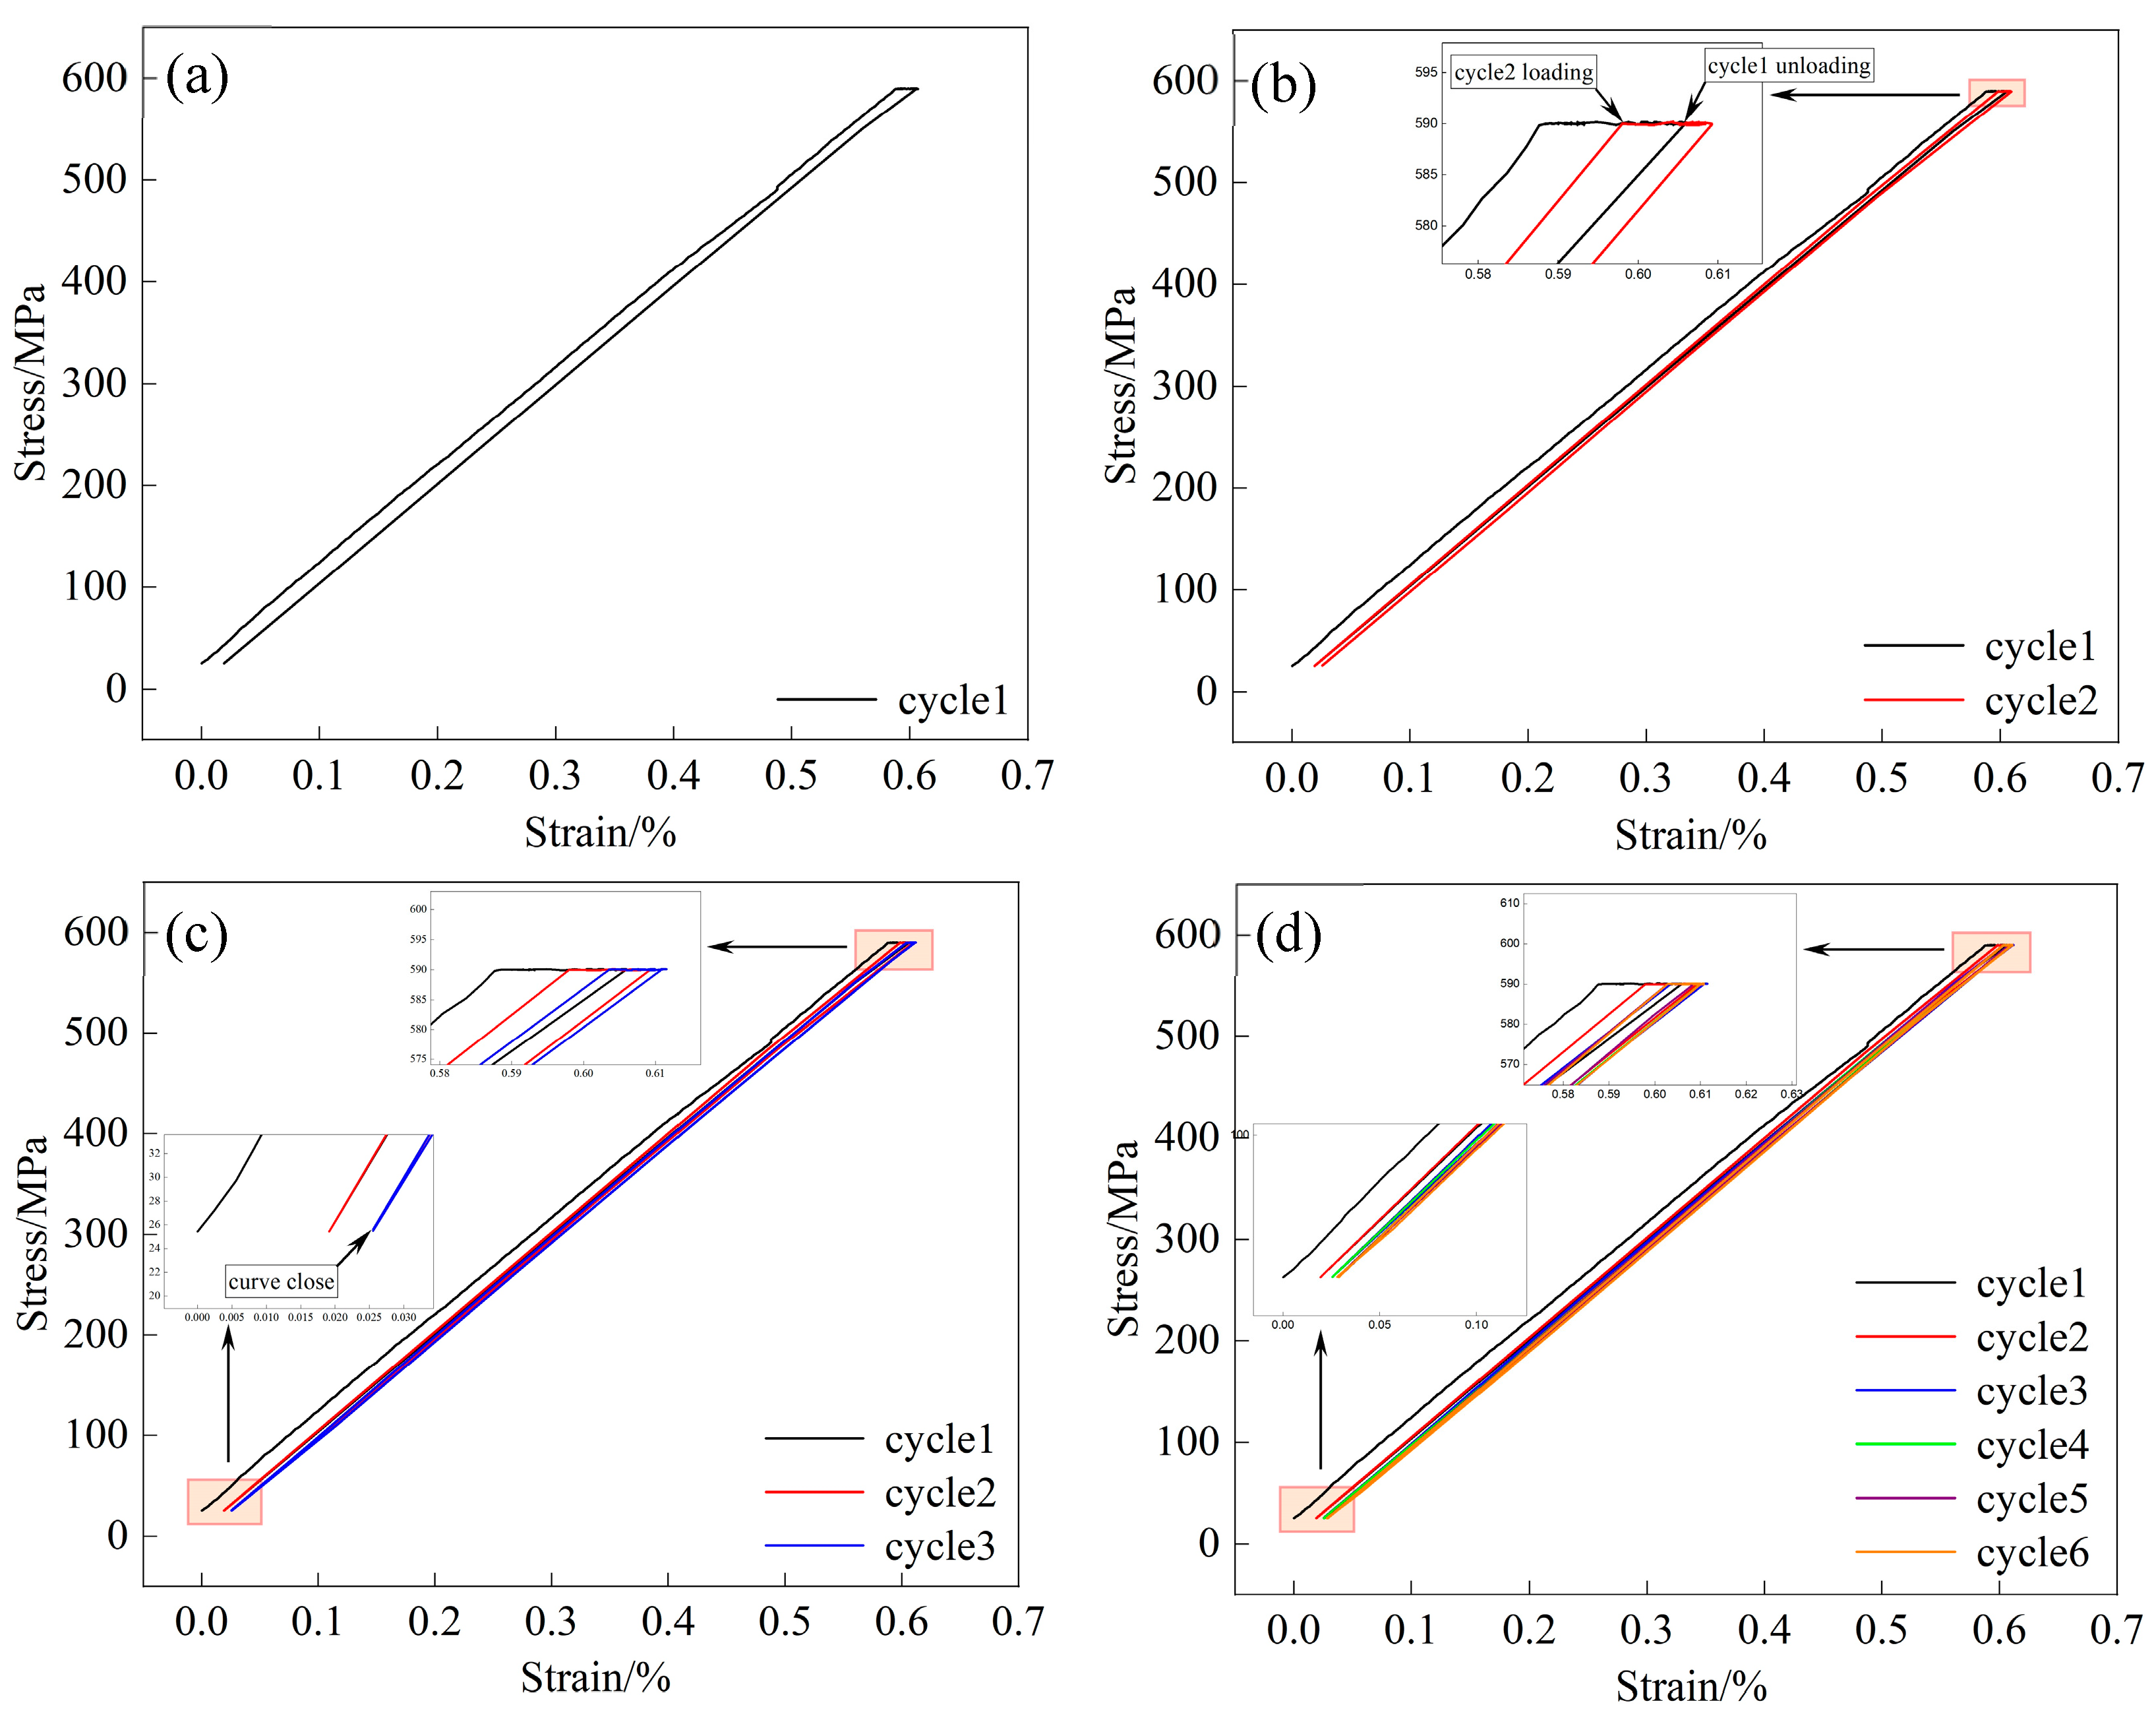
The stress–strain curves of Ti17 alloy under CF tests are shown in Figure 6. Cycle 1 is shown in Figure 6a; due to the peak stress 600 MPa being less than the yield stress of Ti17 alloy at 300 °C, the loading and unloading stages show elastic deformation. At the stress-holding stage, the specimen produces an obvious plastic deformation due to creep. After unloading of stress, part of the residual strain is retained in the specimen, and the cyclic curve is not closed, and the plastic strain increment ∆εp ≠ 0. Furthermore, the area enclosed by the stress–strain curve in cycle 1 is larger, which means the plastic strain energy ∆wp is greater [21]. Cycle 2 is shown in Figure 6b, the specimen still undergoes elastic deformation during the loading and unloading stages, but the total strain at the end of loading is smaller than that at the beginning of unloading in cycle 1. The plastic deformation induced by creep during the stress-holding stage is reduced, and the “horizontal line segment” in the curve representing the creep strain is partially overlapped by cycle 1. After unloading, the residual strain in the specimen increases slightly, and the curve has a tendency to be closed. The area enclosed by the strain–stress curve in cycle 2 also decreases, indicating a reduced plastic strain energy ∆wp.
In cycle 3, as shown in Figure 6c, the stress–strain curve exhibits characteristics similar to those of cycle 1 and cycle 2. The deformation during the stress-holding stage further decreases, and there is a greater overlap between the curve and cycle 2. At this cycle, the curve is completely closed after unloading, and the plastic strain increment ∆εp = 0. The area enclosed by the strain–stress curve continues to decrease, indicating the plastic strain energy ∆wp continues to decrease, but still does not go to 0.
Finally, from Figure 6d, it is found that the curves always maintain the closed characteristic after unloading in the 4th, 5th and 6th cycles, and there are no more new plastic strain increments, ∆εp = 0. The curves in the last three cycles overlap with each other, the area enclosed by the strain–stress curve is similar, the plastic strain energy ∆wp ≠ 0, and the specimen enters a special “self-balancing” state after unloading is completed in the 3rd cycle.
According to shakedown theory, after a certain number of cyclic loads, the plastic deformation of the material is repeated, forming a stable alternating plasticity, and the material enters a plastic shakedown state. The stress–strain curve of the Ti17 specimen is closed after the unloading of the 3rd cycle, i.e., the creep deformation of the stress-holding stage is recovered during the unloading process, and there is no more new plastic strain increment after unloading, ∆εp = 0. And the curves overlap with that of the subsequent cycles, indicating the strain in each cycle is repeated continuously along the same path, suggesting that the specimen enters the plastic shakedown state after the 3rd cycle. A similar plastic shakedown phenomenon was also observed in studies of other metallic materials [22,23].

4.2. The Evolution of Strain Components

In order to more intuitively show the strain evolution process of Ti17 alloy reaching the plastic shakedown state in the CF tests, strain decomposition is needed. The total strain is decomposed according to the different stages of the stress–strain curve; the stress–strain curve of cycle 1 is taken as an example, as shown in Figure 7. From point 1 to point 2 is the loading stage, which produces elastic–plastic strain; from point 2 to point 3 is the stress-holding stage, which produces creep strain; from point 3 to point 4 is the unloading stage, which produces elastic–plastic strain, anelastic recovery strain and visco-plastic strain; and from point 4 to point 5 is the reloading stage, which produces visco-plastic strain and elastic–plastic strain. Of course, there is also ratchet strain due to cycling during these stages.
Since the peak stress is relatively low, the plastic and visco-plastic strains during the loading and unloading stages are neglected. Ratchet strain is defined as the average of the maximum strain εmax and the minimum strain εmin per cycle [15,24], noting that this definition of ratchet strain includes both creep strain and accumulated plastic strain. Thus, the various components of strain, namely elastic strain εe, creep strain εc, residual strain εre, anelastic strain εan, and ratchet strain εr, can be expressed as follows:
εe = σmax/E
εc = ε3ε2
εre = ε4
εan = ε3ε4σmax/E
εr = (εmax + εmin)/2
Based on whether the specimen reaches the plastic shakedown state, the CF test is divided into the initial stage, transition stage and shakedown stage; specifically, cycles 1 and 2 are the initial stage, cycle 3 is the transition stage, and cycles 4, 5 and 6 are the plastic shakedown stage. The evolution of strain components with the number of cycles is shown in Figure 8 and Figure 9.
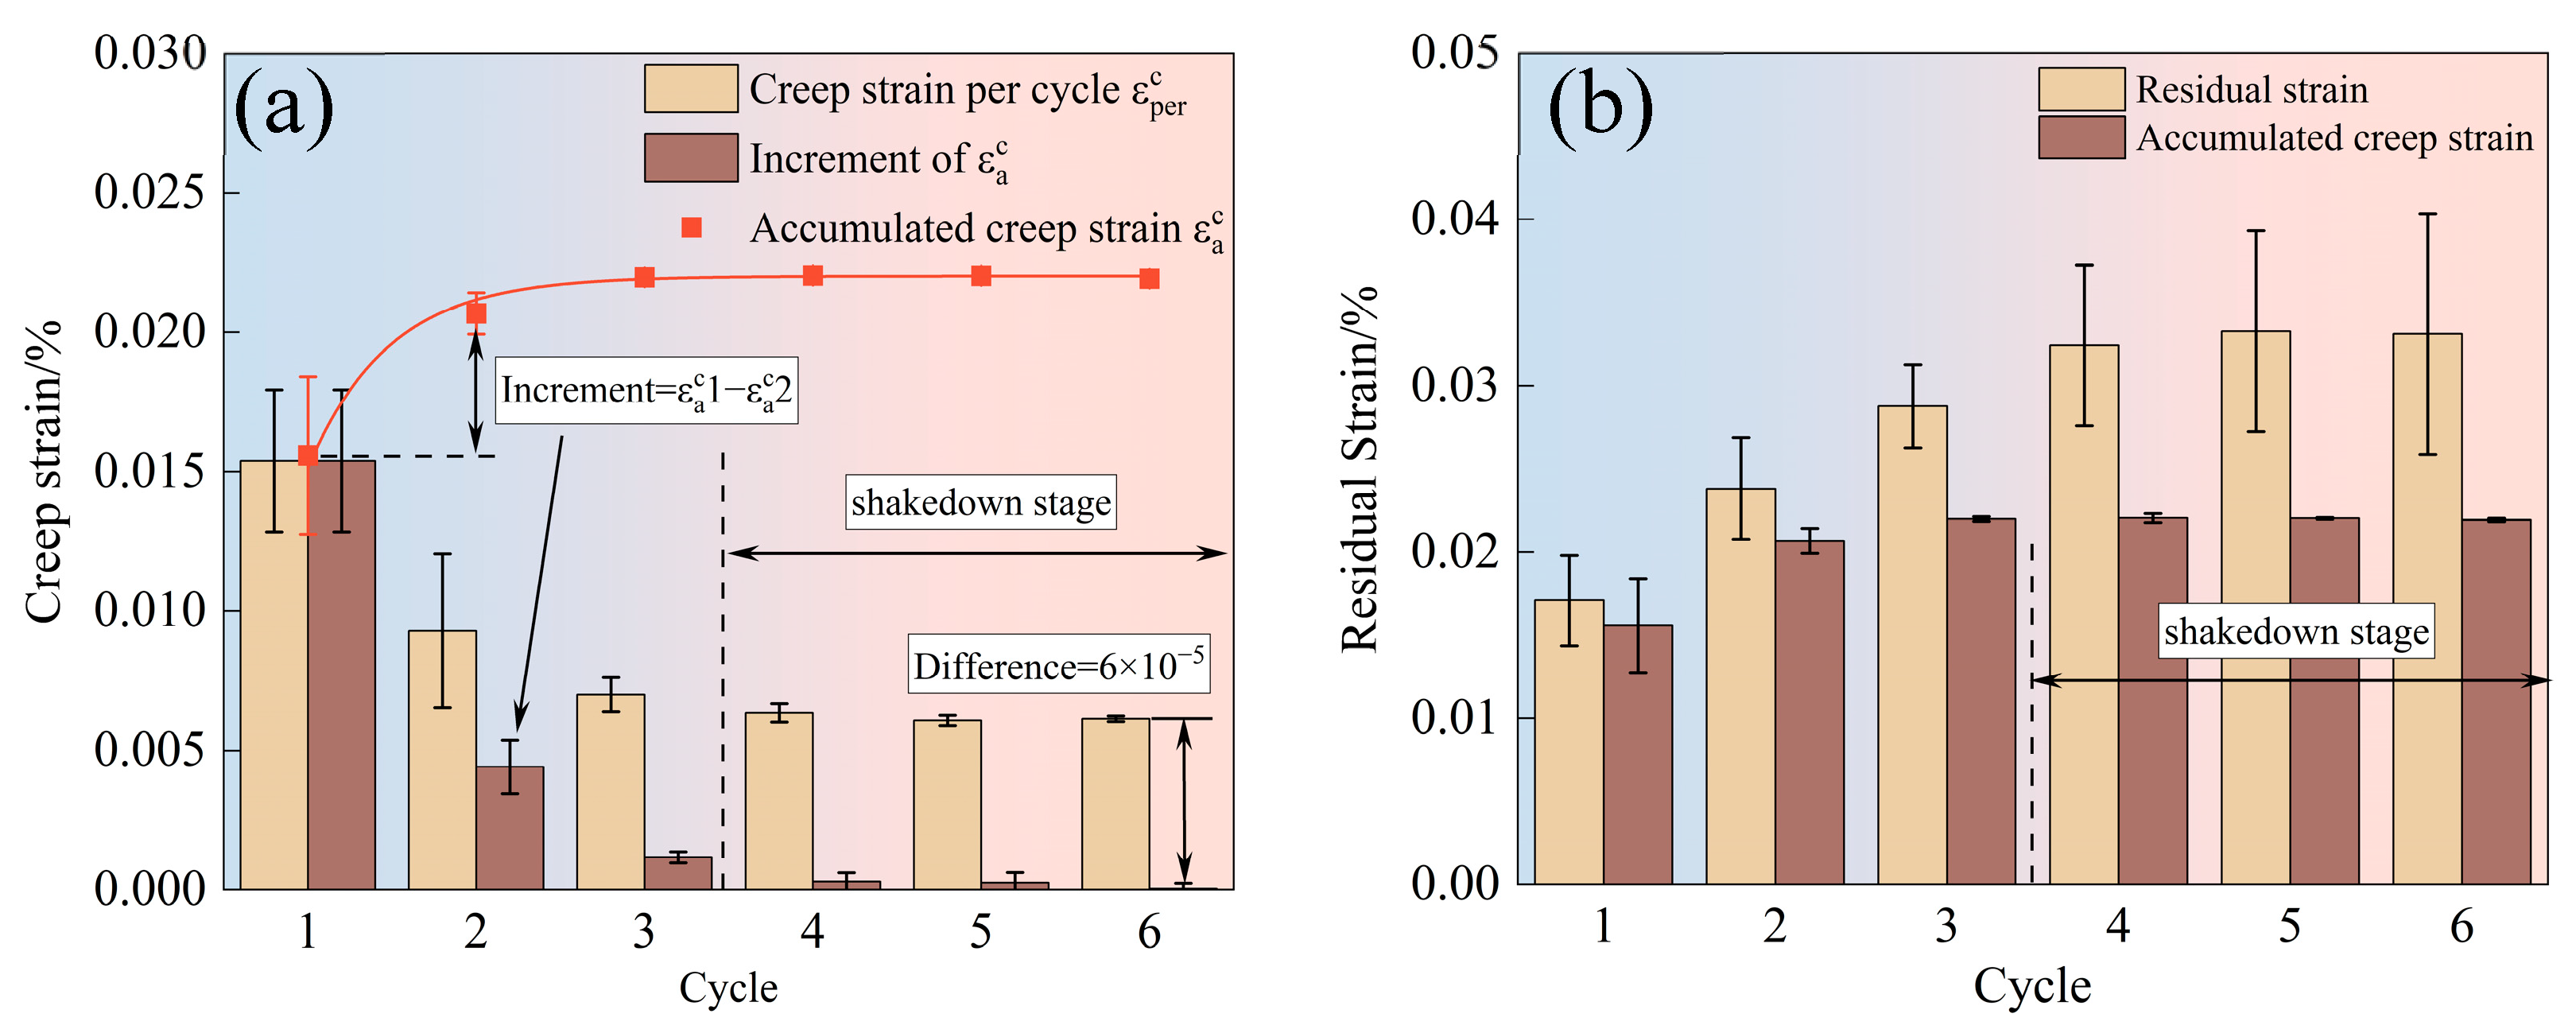
The variation of creep strain εc and residual strain εre are shown in Figure 8. During the initial stage, the creep strain per cycle ε p e r c is large at the beginning and then decreases rapidly. It decreases to a stable value in cycle 3 (transition stage). In the plastic shakedown stage, the amount of creep strain per cycle ε p e r c shows similar quantities. This implies that the accumulated creep strain ε a c gradually increases, but the growth rate gradually decreases, as shown in Figure 8a. It reaches the maximum accumulated value in cycle 3, and afterward, the accumulated creep strain ε a c remains at this value. Creep strain presents the above law because the initial stage of cycle corresponds to the initial creep stage with a faster creep rate, so with the same stress-holding time, the creep strain is larger. While in the plastic shakedown stage, the specimen gradually enters the steady creep stage, the creep rate decreases and is relatively stable, and the creep strain is smaller and consistent [25]. Additionally, the creep strain per cycle ε p e r c is greater than the increment of accumulated creep strain ε a c , especially in the plastic shakedown stage, indicating not all of the creep strain in the stress-holding phase is retained in specimens.
In Figure 8b, the accumulated residual strain εre gradually increases during the initial stage, with a decreasing growth rate. In the transition stage, the residual strain εre increases to a maximum value. Finally, in the plastic shakedown stage, the residual strain εre no longer increases, and it maintains the maximum value. The residual strain εre represents the deformation retained in the specimen after CF tests, which is a reflection of the damage to the specimen. In order to reduce the accumulation of damage in the CF cyclic loading of Ti17 alloy, the residual strain εre before reaching the plastic shakedown state should be reduced as much as possible. According to Figure 8b, it can be seen that the plastic strain of the cycling process is mainly contributed by the creep strain εc during the stress-holding stage, especially creep deformation is the dominance for long stress-holding time [26], so the residual strain εre is also mainly dependent on the creep strain εc. As the creep strain εc generated in the initial stage is dominant, in order to reduce the residual strain εre before plastic shakedown, reducing the creep strain εc in the initial stage is the most effective method.
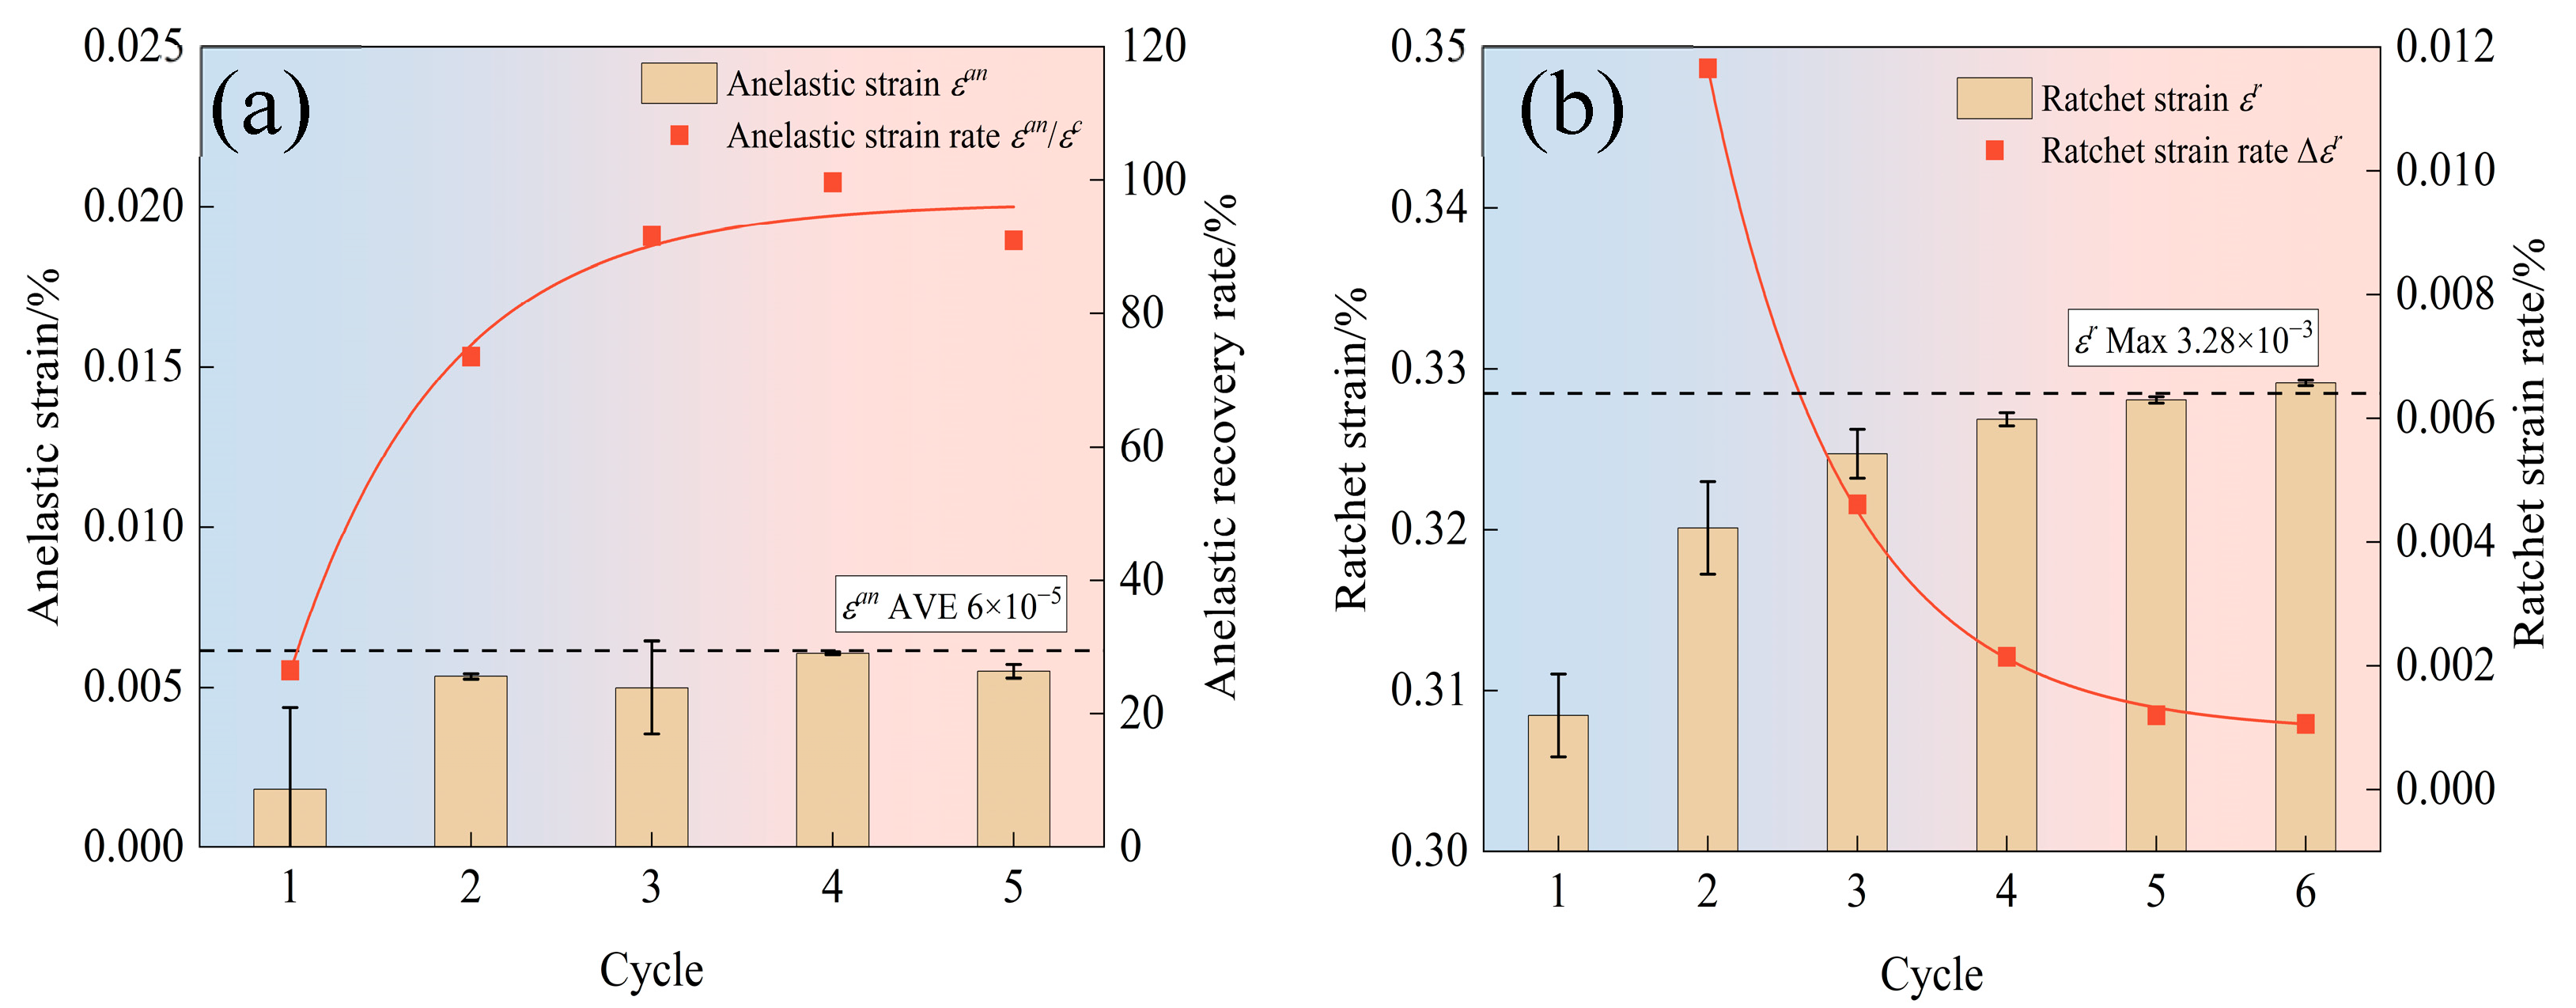
From Figure 9a, it can be seen that the anelastic strain εan remains nearly constant at approximately 6 × 10⁻⁵ over 6 cycles, similar to the investigation results of Zheng Xiaotao [27]. This constant is equal to the difference between increment of ε a c and ε p e r c , as marked in Figure 8a. Define the anelastic recovery rate ε ˙ a n as the ratio of the anelastic strain εan to the creep strain per cycle ε p e r c , ε ˙ a n = εan/ ε p e r c . The anelastic recovery rate ε ˙ a n increases exponentially with the number of cycles. At the initial stage (i.e., the initial creep stage), the amount of anelastic strain εan remains constant, but the creep rate decreases significantly, so the anelastic recovery rate ε ˙ a n increases faster. After the 3rd cycle, when the specimen reaches the plastic shakedown state, the creep during the stress-holding time enters a steady creep stage, with a constant creep rate and a constant anelastic recovery rate. In addition, in cycle 3, the anelastic recovery rate ε ˙ a n grows to nearly 100%, indicating that the creep strain εc in the stress-holding time is almost completely recovered during the unloading [28]. This results in the repetitive plastic strain during the cyclic loading process, indicating that the specimen has entered the plastic shakedown state.
The variation of ratchet strain εr is different from that of anelastic strain εan, as shown in Figure 9b. The ratchet strain εr gradually increases and approaches a maximum value in the initial stage, which remains constant in the plastic shakedown stage. Ratchet strain rate is defined as the increment of ratchet strain relative to the previous cycle (i.e., r/dN). The ratchet strain rate decreases rapidly and reduces to nearly 0% in the 3rd cycle, after which the ratchet strain caused by stress cycling no longer increases. The lowest point of decreasing ratchet strain rate is also in the 3rd cycle, i.e., the plastic shakedown transition point, which indicates that the phenomenon of anelastic recovery not only slows down the accumulated creep strain rate, but also reduces the ratchet strain rate [29]. Because anelastic recovery can reduce the accumulation of creep damage in the material [30], this is one of the most important reasons for the specimen to exhibit plastic shakedown.
In the process of creep–fatigue cyclic loading of Ti17 alloy, all strain components undergo rapid changes in the early cycles, with creep strain per cycle εc, residual strain εre, and ratcheting strain εr tending to decrease or increase towards their respective stable values. Once the plastic shakedown state is reached, the value of each strain component remains essentially constant. When the specimen enters the plastic shakedown state, the anelastic recovery rate increases to 100% and the ratchet strain rate decreases to 0%. The deformation of the specimen due to cyclic creep–fatigue is repeated over and over again to form stable alternating plasticity.

4.3. Validation of Shakedown Theory Model

Using the methodology for determining the material parameters presented in Section 3.3, the values of the material parameters required for the shakedown theory model are obtained as shown in Table 2.
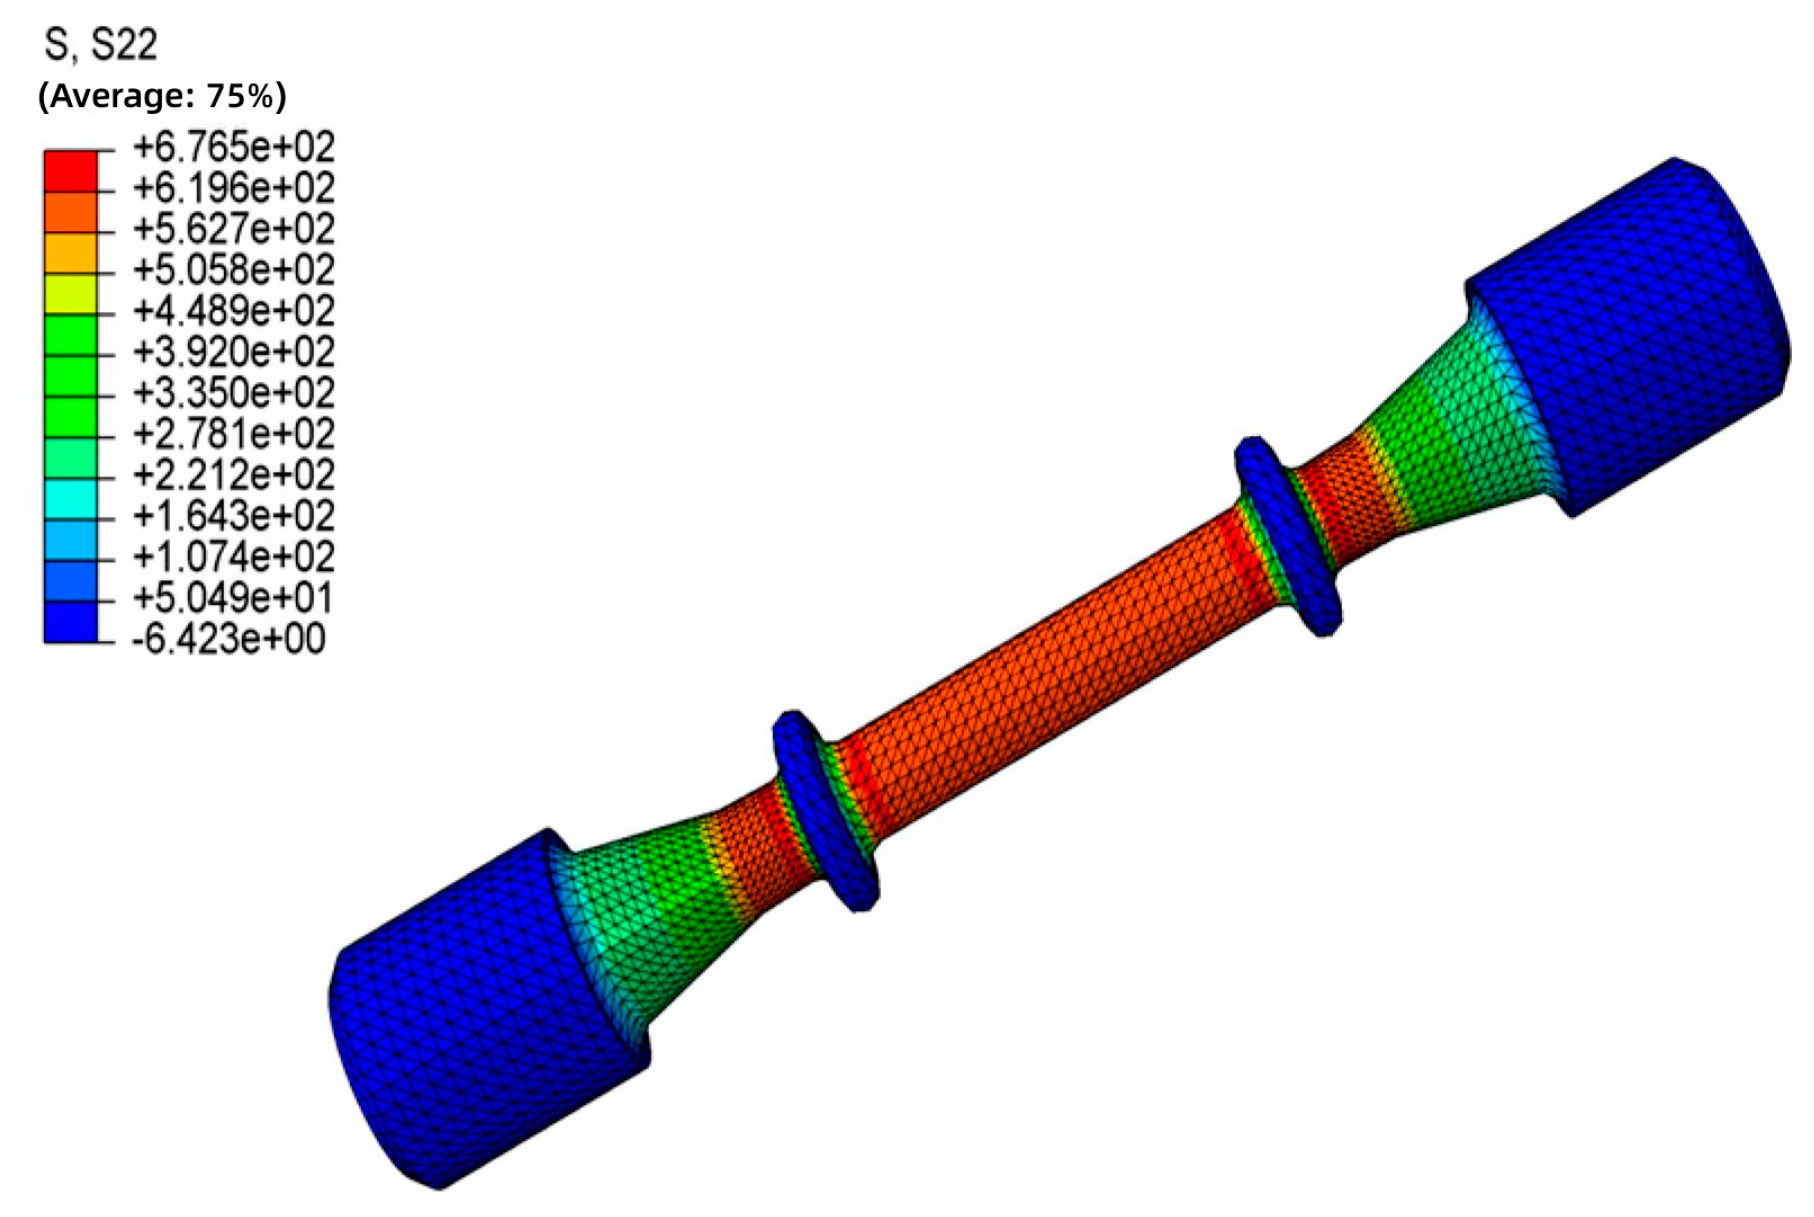
To verify the accuracy and adaptability of the shakedown theory model and material parameters, the simulation of the CF test is carried out using Abaqus software 2022 under the same conditions. The geometry used in this model is a Φ5 mm bar with an axial load of 11781N applied at one end, and the other end is completely fixed; then, the model is meshed with tetrahedral C3D4 cells, and finally, 49,678 cells are divided, and the model of the loaded state is shown in Figure 10.
The simulation results and the corresponding experimental results are given together in Figure 11, and the relative errors between the simulated and experimental strain values for different cycles are statistically shown in Table 3. From Figure 11, the simulation results of CF of the shakedown theory model at 300 °C have a good overlap with the experimental results, and the statistical results in Table 3 show that the maximum relative error between the simulation and experimental results for different cycles is not more than 4%. It is shown that the model can accurately predict the shakedown behavior of Ti17 alloy under the corresponding experimental conditions. The establishment of this model provides a theoretical basis for the shakedown analysis of aero-engine rotating components at higher temperatures.

4.4. Microscopic Mechanisms of Plastic Shakedown

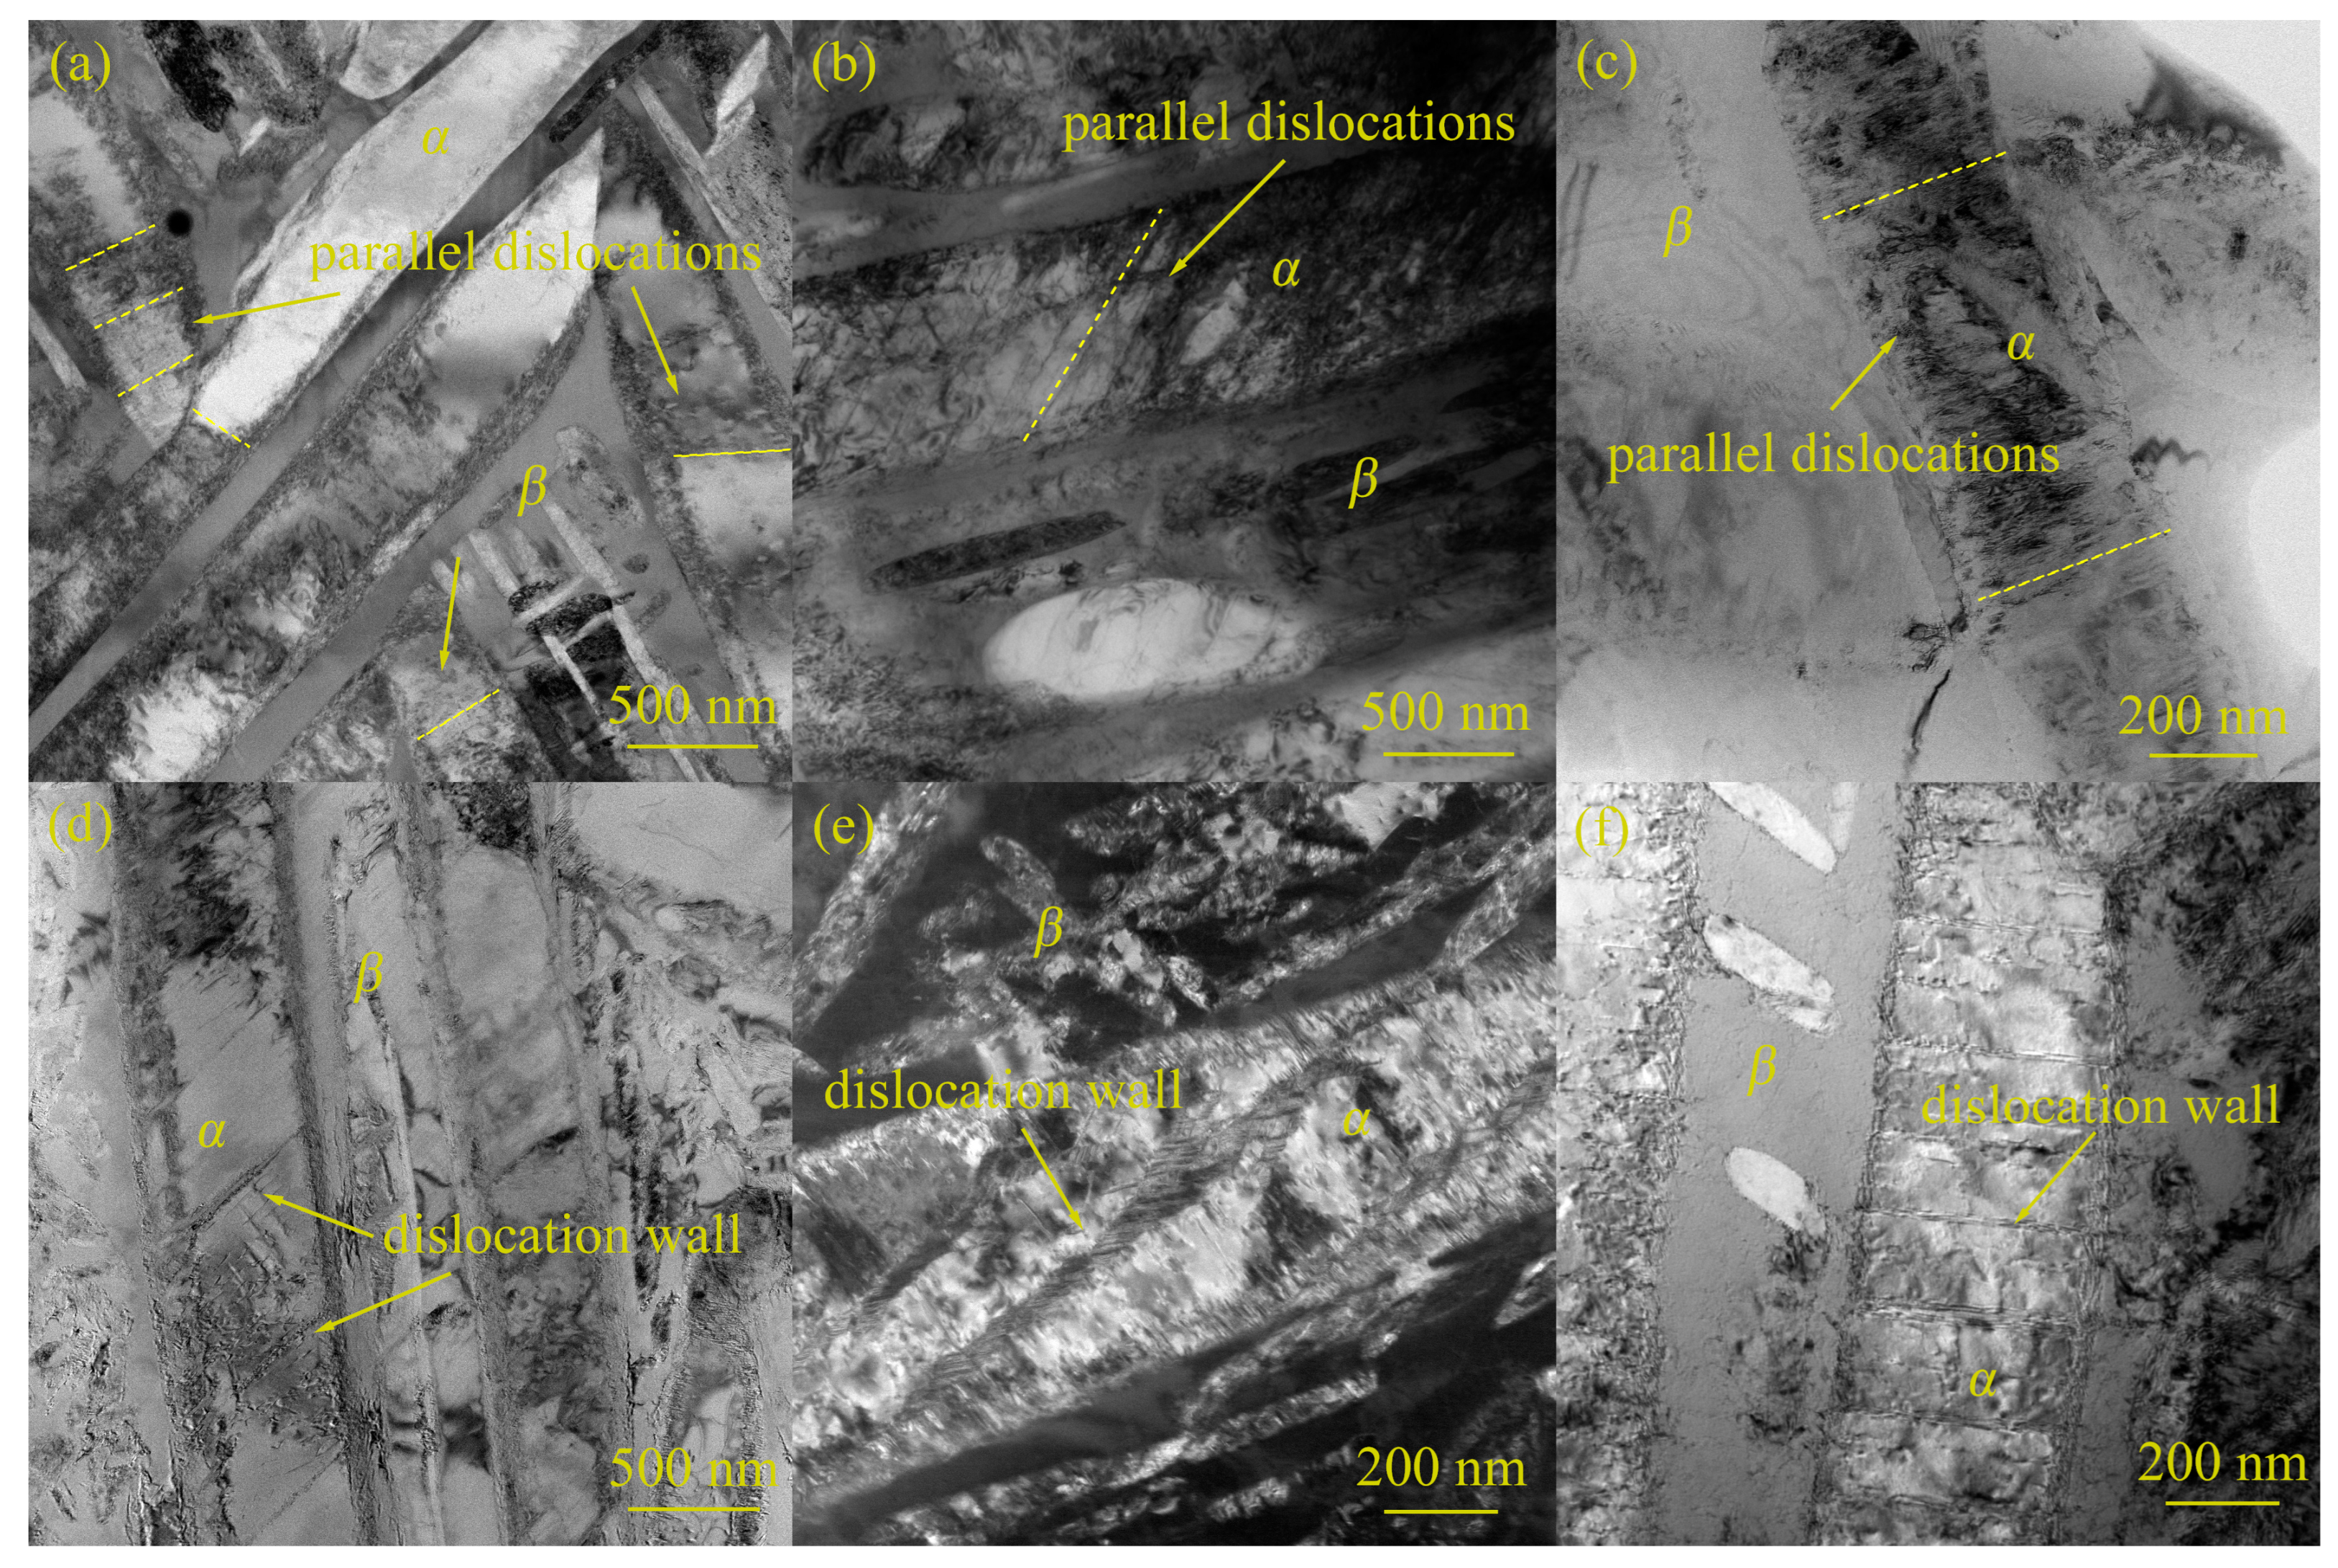
To reveal the micro-mechanisms of plastic shakedown of Ti17 alloy, TEM observation is carried out on the specimens after the CF test. Figure 12 shows the microstructure of Ti17 specimens in the plastic shakedown state. Compared with the initial structure (Figure 1b), it is observed that the deformation of the basket-weave microstructure is non-uniform, with pronounced dislocation slip occurring in favorably oriented α phases and lower dislocation density in unfavorably oriented α phases. Moreover, the area of dislocation pile-up within the α-phase is narrow, indicating the localized nature of deformation in the basket-weave microstructure [31]. Creep–fatigue primarily gives rise to two distinct structures in the highly slip-prone α phases [32]: one is a large number of parallel dislocations in the α-phase, which extend across the whole α-phase and are plugged at the α/β grain boundary, as shown in Figure 12a–c; the other is the formation of dislocation walls and the low-density dislocation zone between the dislocation walls in the lamellar α-phase, as shown in Figure 12d–f.
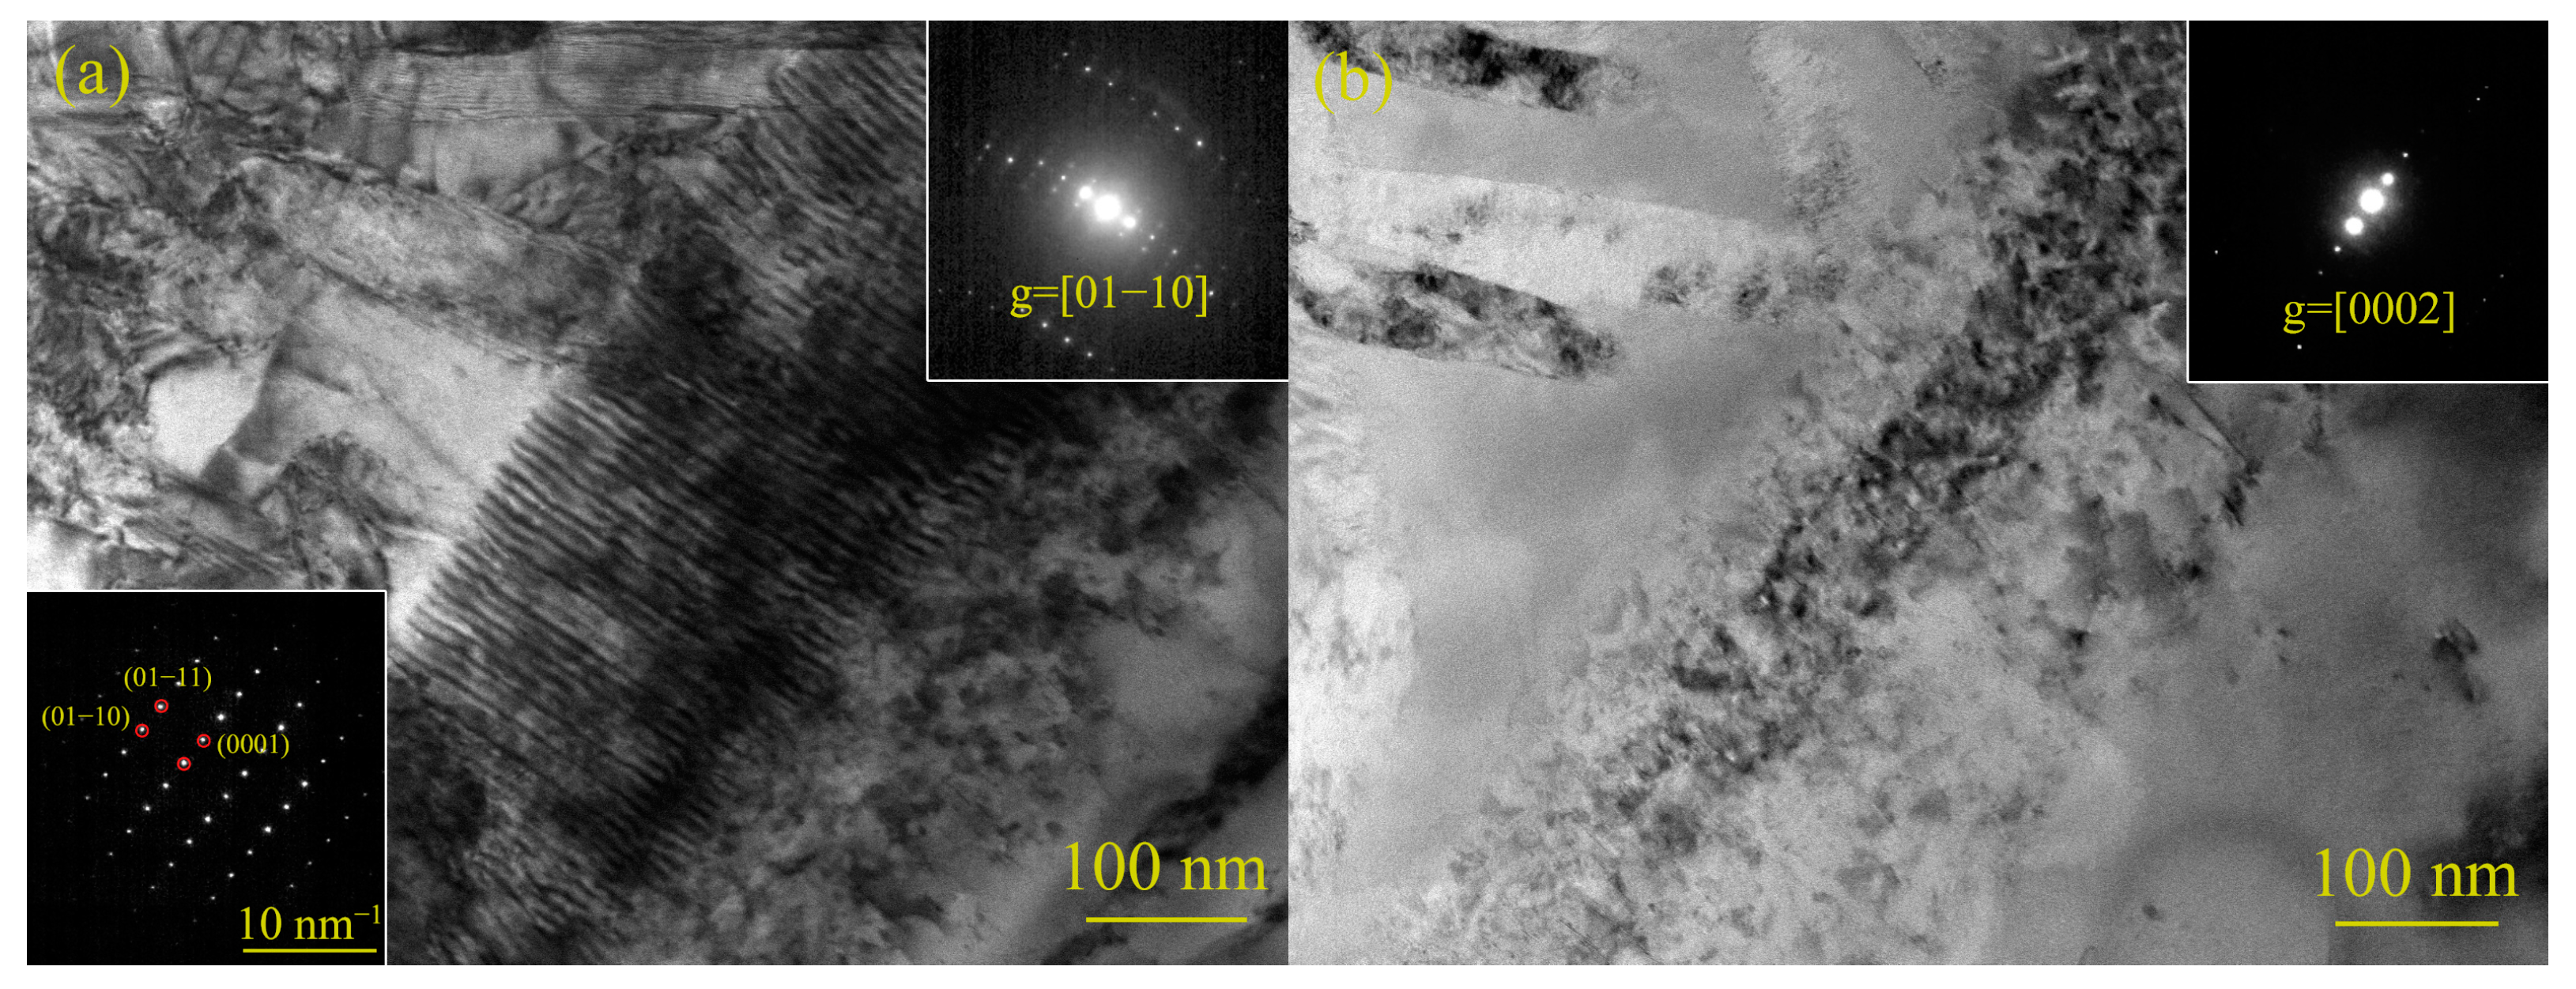
During the initial stage of CF tests, the dislocation density is low and the dislocation pile-up is not serious. The resistance to dislocation slip is weak, resulting in low deformation resistance. Therefore, during the initial cycles, especially cycle 1, the specimen experiences significant strain, with all strain components being large. After undergoing substantial plastic deformation, dislocations rapidly multiply within favorably oriented α phases. Due to the limited number of slip systems in titanium alloy α phase, it is widely believed that the activation of slip primarily occurs in the basal or prismatic <a> slip systems [33,34]. As a result, the dislocations within the α phase mainly originate from the same slip system, and the dislocation lines exhibit a parallel morphology. Figure 13 shows the dislocation slip lines in two-beam images as observed by TEM. The type of dislocation can be determined according to dislocation invisibility criterion: if the Burgers vector b is normal to the operating vector g, g·b = 0. For titanium alloys with an HCP structure, Table 4 lists the common dislocation Burgers vector and determination criterion [35]. When the operating vector g = [01−10], the observed dislocation lines in the TEM images can be determined as <a> or <a + c> type dislocations. In Figure 13b, when the operating vector g = [0002], the observed dislocation lines at the same position disappear. Only <a>-type dislocation lines would disappear under the operating vector g. Therefore, it can be concluded that the observed parallel dislocation lines are <a>-type dislocation lines.
In the transition stage, the dislocation density has increased significantly, and the dislocations are entangled with each other and pile up at grain boundaries. Cyclic hardening caused by the interaction of dislocation–dislocation will be stronger, and the dislocation slip resistance is greatly enhanced [36]. On the one hand, this activates the dislocation climb, leading to the formation of dislocation walls where dislocations within the walls either annihilate each other or become absorbed into the walls [37]. On the other hand, it results in back stress cyclic hardening, and the obstructed movement of pile-up dislocations across grain boundaries prevents the presence of dislocations in unfavorably oriented α phases and higher hardness β phases, causing non-uniform deformation, which further exacerbates back stress hardening [38].
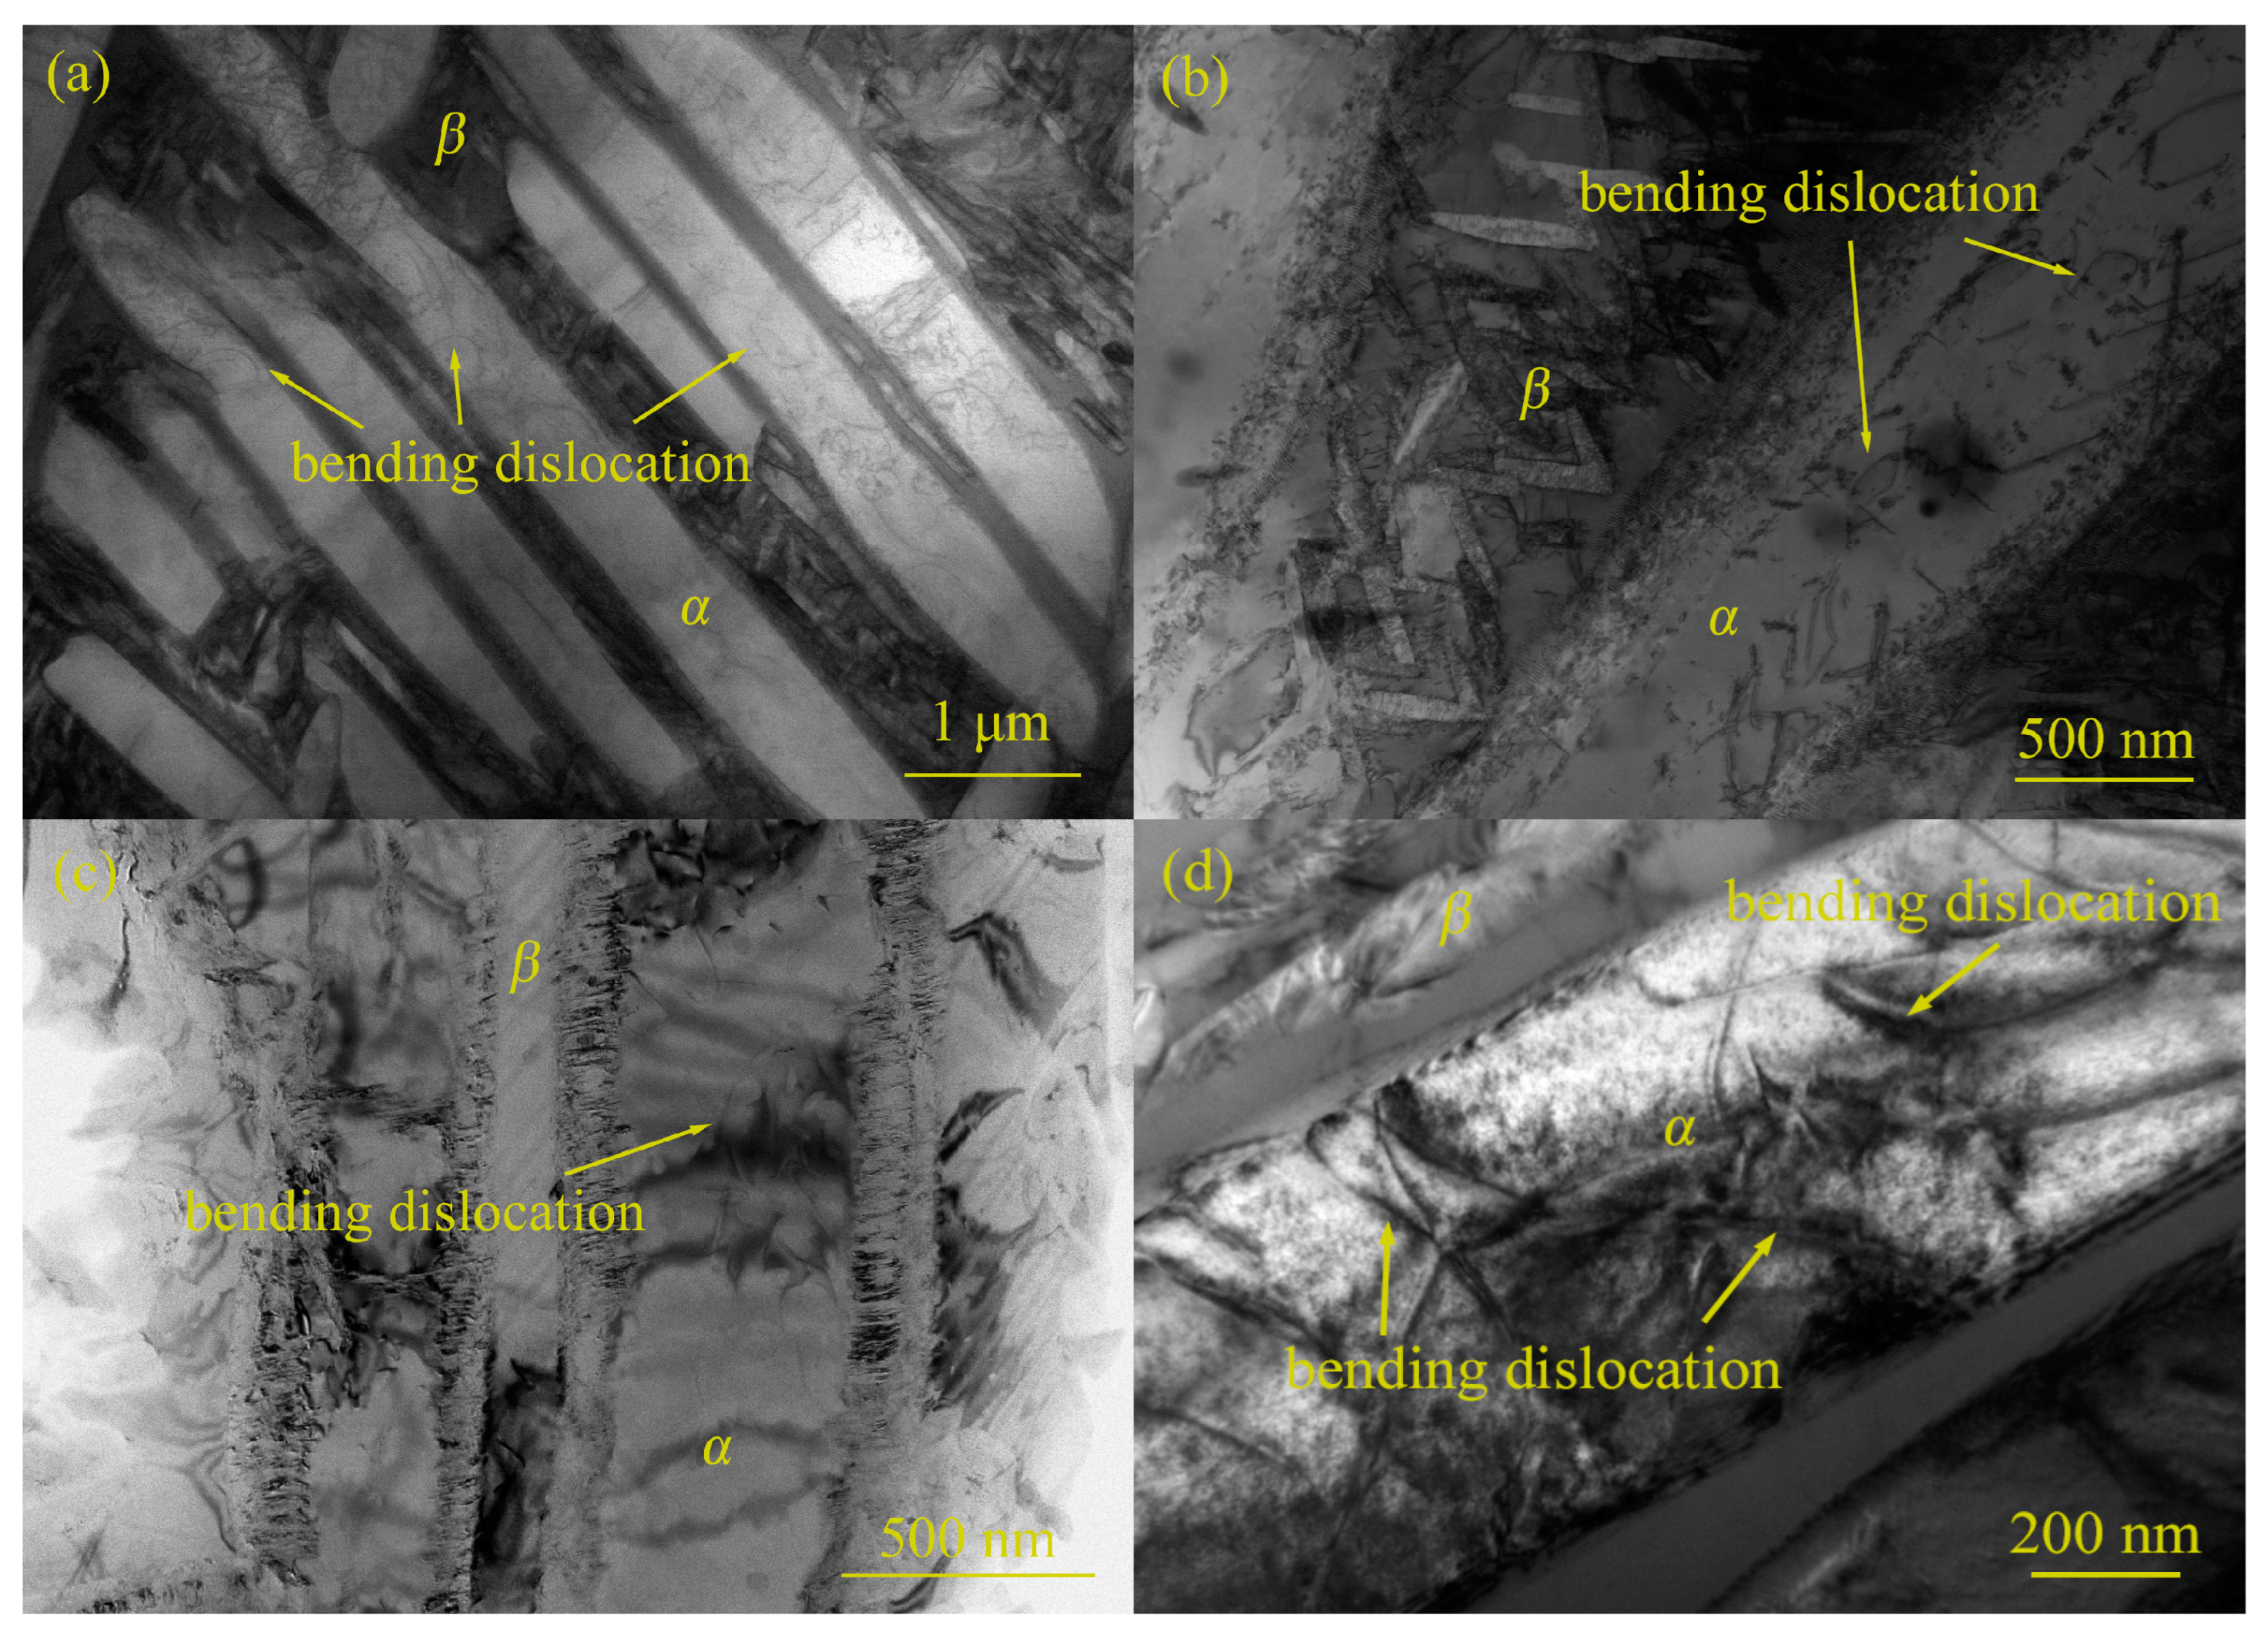
Finally, in the plastic shakedown stage, hindered by the combined effects of pile-up dislocations and non-uniform deformation, both the externally applied tensile stress during stretching and the reverse stress on dislocations generated during stress relaxation upon unloading are lower than the critical shear stress required to drive dislocation slip. As a result, dislocations have difficulty in initiating motion. This is macroscopically reflected in a significant decrease in strain rate and the stabilization of strain components. However, the continuous action of the applied stress during the stress-holding stage causes elastic bending of dislocation segments, as shown in Figure 14. This is manifested as a small amount of “creep strain” on the stress–strain curve. It should be noted that this “creep strain” is not an irrecoverable plastic strain, and it will disappear upon unloading due to the re-straightening of bending dislocation segments through the occurrence of anelastic recovery [39,40,41]. This conclusion was already pointed out in Nardone’s study on cyclic creep behavior controlled by anelastic recovery [42]. Anelastic recovery strain during unloading is initially stored in the strain accumulated during the stress-holding period, and this strain has not yet completely transformed into irrecoverable “creep strain”. The micro-mechanism behind this phenomenon is primarily attributed to the back stress generated by the line tension of dislocations in bending. If unloading occurs during the bending process of dislocations, the strain can be recovered. Souni has also observed bending dislocation segments in TEM images during the study of anelastic creep behavior in near-α titanium alloy Ti6242Si, suggesting that the deformation of dislocation segments controlled by dislocation climb dominates the anelastic strain [27]. The phenomenon of dislocation segment bending and re-straightening occurs repeatedly during CF loading and unloading, resulting in continuous repeated deformation of the specimen, ultimately leading to the attainment of a plastic shakedown state.
Based on the above discussion, the micro-mechanisms of plastic shakedown of Ti17 alloy under CF loading are summarized in Figure 15, which shows a certain region in the basket-weave structure of Ti17 alloy. The dislocations within the α-phase in the as-received material can be neglected. Ti17 alloy undergoes the dislocation slip in the initial stage. Then the dislocation plugs and entangles, continuously inducing dislocation climbing in the transition stage. Finally, the dislocation bending during stress-loading and the re-straightening during unloading reach a balance, a plastic shakedown state is manifested in the macroscopic state.

5. Conclusions

This paper has investigated the plastic shakedown behavior of Ti17 alloy through CF tests, established a shakedown theory model and examined the micro-mechanisms of plastic shakedown behavior by TEM. The main conclusions are as follows:
(1)
Ti17 alloy specimens experience CF tests at 300 °C. During the initial stage, significant strain is observed, with the creep strain per cycle ε p e r c rapidly decreasing, while residual strain εre and ratchet strain εr increase rapidly. After three cycles, the specimens reach a plastic shakedown state, with the strain components tending to stabilize. The anelastic recovery rate increases to 100%, and the ratchet strain rate decreases to 0%.
(2)
Based on the plasticity–creep superposition model, a theory model for the CF shakedown behavior of Ti17 alloy is established. This model can accurately describe the shakedown behavior of Ti17 alloy at 300 °C, and the relative error between the simulation and experimental results can be controlled within 4%.
(3)
TEM observations reveal that the multiplication and pile-up of dislocations during cyclic loading, as well as the non-uniformity of deformation, result in strong back stress cyclic hardening. The increased resistance to dislocation slip leads to the elastic bending of dislocation segments during the stress-holding stage and their subsequent re-straightening upon unloading, giving rise to anelastic recovery. Back stress cyclic hardening and anelastic recovery are the main mechanisms for the plastic shakedown behavior of the Ti17 alloy.

Author Contributions

Conceptualization, J.W. and D.L.; Methodology, J.W. and D.L.; Software, Z.Z. and C.Z.; Validation, T.M. and Y.S.; Formal analysis, J.W. and T.M.; Data curation, T.M. and Y.S.; Writing—original draft preparation, J.W. and T.M.; Writing—review and editing, C.Z.; Visualization, T.M. and Z.Z.; Project administration, J.W.; Funding acquisition, J.W. All authors have read and agreed to the published version of the manuscript.

Funding

The author would like to thank the National Natural Science Foundation of China (No. 52101052) for their support.

Data Availability Statement

The original contributions presented in the study are included in the article, further inquiries can be directed to the corresponding author.

Conflicts of Interest

The authors declare no conflicts of interest.

References

  1. Shi, D.G.; Xu, X.Y.; Wu, Y.; Qi, Y.C. Factors influencing and research progress on dwell fatigue of titanium alloys. Chin. J. Mater. Res. 2019, 38, 722–728. [Google Scholar]
  2. Sui, J.C.; Guo, T.; Meng, Z.W.; Tian, X.L. Process research on integrated three-level disc shaft. China New Technol. Prod. 2015, 22, 56–57. [Google Scholar]
  3. Bache, M.R. A review of dwell sensitive fatigue in titanium alloys: The role of microstructure, texture and operating conditions. Int. J. Fatigue 2003, 25, 1079–1087. [Google Scholar] [CrossRef]
  4. Chen, K.M.; Tian, R.Z.; Guo, S.J.; Wang, R.Z.; Zhang, C.C.; Chen, H.F.; Zhang, X.C.; Tu, S.D. Prediction of creep-fatigue life of aviation turbine discs under cyclic thermal-mechanical loading. Acta Aeronaut. Astronaut. Sin. 2022, 43, 336–346. [Google Scholar]
  5. Xuan, F.Z.; Zheng, X.T. Stability Analysis and Design of Pressure Equipment; Science Press: Beijing, China, 2020; pp. 1–4. [Google Scholar]
  6. Boiler, A. ASME Boiler and Pressure Vessel Code: An International Code; American Society of Mechanical Engineers: New York, NY, USA, 1998; pp. 28–29. [Google Scholar]
  7. Ota, Y.; Kubushiro, K.; Yamazaki, Y. The life evaluation by linear cumulative damage rule for cold dwell fatigue of Ti-6Al-4V alloy. Fatigue Fract. Eng. Mater. Struct. 2022, 45, 259–269. [Google Scholar] [CrossRef]
  8. Zhang, M.D.; Cao, J.X.; Zhai, Z.J.; Yang, Z.N.; Zhang, B.; Sui, N.; Huang, X. Influence of dwell time and stress ratio on stress-strain response of Ti6242 alloy. Chin. J. Nonferrous Met. 2022, 32, 1685–1692. [Google Scholar]
  9. Kumar, J.; Rao, A.V.; Raman, S.G.S.; Kumar, V. Creep-fatigue damage simulation at multiple length scales for an aeroengine titanium alloy. Int. J. Fatigue 2018, 116, 505–512. [Google Scholar] [CrossRef]
  10. Zeng, L.R.; Lei, L.M.; Luo, X.M.; Zhang, G.P. Toward an understanding of dwell fatigue damage mechanism of bimodal Ti-6Al-4V alloys. J. Mater. Sci. Technol. 2022, 108, 244–255. [Google Scholar] [CrossRef]
  11. Han, Y.; Zhao, F.; Liu, Y.; Huang, C.W. Quantitative relationships between mechanical properties and microstructure of Ti17 alloy after thermomechanical treatment. Metals 2020, 10, 67–83. [Google Scholar] [CrossRef]
  12. Sun, J.Z.; Li, M.Q.; Li, H. Deformation behavior of TC17 titanium alloy with basket-weave microstructure during isothermal compression. J. Alloys Compd. 2018, 730, 533–543. [Google Scholar] [CrossRef]
  13. Guo, P.; Pan, H.; Jia, G.Y.; Hou, H.M. Conventional low-cycle fatigue and dwell fatigue damage behavior of TC17 titanium alloy under high load conditions. Rare Met. Mater. Eng. 2022, 51, 301–305. [Google Scholar]
  14. Kang, G.Z.; Kan, Q.H. Constitutive modeling for uniaxial time-dependent ratcheting of SS304 stainless steel. Mech. Mater. 2007, 39, 488–499. [Google Scholar] [CrossRef]
  15. Kan, Q.H.; Kang, G.Z.; Zhang, J. Constitutive description of correlated ratcheting behavior of SS304 stainless steel under uniaxial tension. Nucl. Power Eng. 2007, 28, 66–71. [Google Scholar]
  16. Ohno, N.; Wang, J.D. Kinematic hardening rules with critical state of dynamic recovery, part II: Application to experiments of ratchetting behavior. Int. J. Plast. 1993, 9, 391–403. [Google Scholar] [CrossRef]
  17. Cao, Y.; Cui, X.; Ji, D.M. Creep-fatigue damage behavior of P92 steel and the development of damage constitutive model. Mech. Eng. Mater. 2021, 45, 50–65. [Google Scholar]
  18. Kang, G.Z.; Gao, Q.; Yang, X.J. A visco–plastic constitutive model incorporated with cyclic hardening for uniaxial/multiaxial ratcheting of SS304 stainless steel at room temperature. Mech. Mater. 2022, 34, 521–531. [Google Scholar] [CrossRef]
  19. Fang, T. Experimental and Theoretical Models on Ratcheting-Fatigue Interaction of Wheel and Rail Steels. Master’s Thesis, Southwest Jiaotong University, Chengdu, China, 2014; pp. 28–30. [Google Scholar]
  20. Abdel-Karim, M.; Ohno, N. Kinematic hardening model suitable for ratchetting with steady-state. Int. J. Plast. 2000, 16, 225–240. [Google Scholar] [CrossRef]
  21. Wang, Y.J.; Wang, X.H.; Yang, Y.F.; Lan, X.; Zhang, Z.; Li, H. Study on creep-fatigue mechanical behavior and life prediction of Ti2AlNb-based alloy. Materials 2022, 15, 6238. [Google Scholar] [CrossRef] [PubMed]
  22. Liu, F.L. Study on plastic shakedown state of metallic materials. Mech. Eng. Autom. 2005, 1, 47–50. [Google Scholar]
  23. Shi, J.Y.; Zhang, M.; Cheng, Y.D.; Wang, B.K.; Liu, F.L. A study on the shakedown mechanism of mining ring chain steel 23MnNiCrMo54. J. Heat Treat. Mater. 2005, 26, 90–92. [Google Scholar]
  24. Kang, G.Z.; Sun, Y.F.; Zhang, J.; Kan, Q.H. Time-dependent ratcheting behavior of SS304 stainless steel under cyclic loading at room temperature. Acta Metall. Sin. 2005, 41, 277–281. [Google Scholar]
  25. Yu, L.; Song, X.P.; You, L.; Jiao, Z.H.; Yu, H.C. Effect of dwell time on creep-fatigue life of a High-Nb TiAl alloy at 750 °C. Scr. Mater. 2015, 109, 61–63. [Google Scholar] [CrossRef]
  26. Alsmadi, Z.Y.; Abouelella, H.; Alomari, A.S.; Murty, K.L. Stress-controlled creep–fatigue of an advanced austenitic stainless steel at elevated temperatures. Materials 2022, 15, 3984. [Google Scholar] [CrossRef] [PubMed]
  27. Zheng, X.T. Shakedown Analysis and Evaluation Approaches to Structures under Complicated Conditions. Ph.D. Thesis, East China University of Science and Technology, Shanghai, China, 2012; pp. 69–74. [Google Scholar]
  28. Es-Souni, M. Primary, secondary and anelastic creep of a high temperature near α-Ti alloy Ti6242Si. Maretials Charact. 2000, 45, 153–164. [Google Scholar] [CrossRef]
  29. Głuchowski, A.; Sas, W. Long-term cyclic loading impact on the creep deformation mechanism in cohesive materials. Materials 2020, 13, 3907. [Google Scholar] [CrossRef] [PubMed]
  30. Zhang, S.L.; Xuan, F.Z.; Guo, S.J.; Zhao, P. The role of anelastic recovery in the creep-fatigue interaction of 9–12% Cr steel at high temperature. Int. J. Mech. Sci. 2017, 122, 95–103. [Google Scholar] [CrossRef]
  31. Chen, G.X.; Peng, Y.; Liu, C.Y. Periodic plastic deformation behavior of Ti-6Al-4V titanium alloy based on strain controlling mode. J. Fail. Anal. Prev. 2020, 20, 597–604. [Google Scholar] [CrossRef]
  32. Zhou, Y.; Pang, Y.H.; Zhou, Y.G. Deformation characteristics and dislocation structures of TC11 titanium alloy under creep-fatigue interaction. Acta Aeronaut. Astronaut. Sin. 1994, 15, 691–695. [Google Scholar]
  33. Sun, F.C. Possible dislocations in alpha titanium alloys. Rare Met. Mater. Eng. 1985, 1, 3–6. [Google Scholar]
  34. Huang, J.; Wang, Z.; Xue, K. Cyclic deformation response and micro-mechanisms of Ti Alloy Ti–5Al–5V–5Mo–3Cr–0.5Fe. Mater. Sci. Eng. A 2011, 528, 8723–8732. [Google Scholar] [CrossRef]
  35. Paton, N.E.; Backofen, W.A. Plastic deformation of titanium at elevated temperatures. Mech. Behav. 1970, 1, 2839–2847. [Google Scholar] [CrossRef]
  36. Zhao, J.W.; Qiu, F.; Xu, C.G. Review of creep-thermomechanical fatigue behavior of austenitic stainless steel. Crystals 2023, 13, 70. [Google Scholar] [CrossRef]
  37. Li, X.X.; Xia, C.Q.; Qi, Y.L.; Wang, Z.H.; Niu, G.S.; Sun, W. Study on high-temperature tensile creep behavior of TC6 titanium alloy. Rare Met. Mater. Eng. 2013, 42, 1901–1904. [Google Scholar]
  38. Xu, H.F. Study on Low-Cycle Fatigue Mechanical Behavior and Life Prediction Energy Model of Ti-6Al-4V Alloy Based on Internal Stress. Ph.D. Thesis, Zhejiang University, Hangzhou, China, 2018; pp. 281–282. [Google Scholar]
  39. Lu, C.Y.; Wang, P.; Luo, S.Y.; Li, Y.F.; Wang, R.Z.; He, Y.M.; Gao, Z.L.; Tu, S.T. Influence of anelastic recovery on the cyclic creep behavior of AlCoCrFeNi2.1 eutectic high-entropy alloy. Int. J. Fatigue 2024, 180, 10811. [Google Scholar] [CrossRef]
  40. Ying, C.H.; Chen, L.J.; Liu, T.L.; Guo, L.Q. Influence of hold time on cyclic creep behavior of 409 ferritic stainless steel. J. Shenyang Univ. Technol. 2016, 38, 634–638. [Google Scholar]
  41. Rao, A.; Bouchard, R.J.; Northover, S.M.; Fitzpatrick, M.E. Anelasticity in austenitic stainless steel. Acta Mater. 2012, 60, 6851–6861. [Google Scholar] [CrossRef]
  42. Nardone, V.C.; Matejczyk, D.E.; Tien, J.K. A model for anelastic relaxation controlled cyclic creep. Metall. Trans. A 1985, 16, 1117–1122. [Google Scholar] [CrossRef]
Figure 1. The original microstructure of Ti17 alloy: (a) SEM photograph; (b) TEM photograph.
Metals 14 00743 g001
Figure 2. (a) Size and morphology of the specimen in creep–fatigue tests; (b) CF cyclic loading mode.
Metals 14 00743 g002
Figure 3. Diagram of stress vs. strain for LCF tests with strain amplitude of 2% at a strain rate of 0.008%s−1.
Metals 14 00743 g003
Figure 4. Diagram of maximum stress vs. accumulated plastic strain for LCF tests with strain amplitude of 2%.
Metals 14 00743 g004
Figure 5. Diagram of axial tensile true stress vs. true strain before and after removing isotropic hardening.
Metals 14 00743 g005
Figure 6. The stress–strain curves of Ti17 alloy with CF tests: (a) one cycle; (b) two cycles; (c) three cycles; (d) six cycles.
Metals 14 00743 g006
Figure 7. The curve of stress vs. strain under the first cycling, which 1–2 is the stress loading stage; 2–3 is the stress holding stage; 3–4 is the stress unloading stage; 4–5 is reloading stage; dotted line is parallel to the stress loading stage, indicating the same E as the stress loading stage.
Metals 14 00743 g007
Figure 8. Creep strain and residual strain in CF tests: (a) the evolution of creep strain per cycle, accumulated creep strain and its increment; (b) the relationship between residual strain and creep strain.
Metals 14 00743 g008
Figure 9. Anelastic strain and ratchet strain in CF tests: (a) anelastic strain and anelastic recovery rate; (b) ratchet strain and ratchet strain rate.
Metals 14 00743 g009
Figure 10. The geometry of the finite element model used in Abaqus.
Metals 14 00743 g010
Figure 11. Comparison of Ti17 CF simulation results with experimental results: (a) the curve of stress vs. strain; (b) the curve of strain vs. time.
Metals 14 00743 g011
Figure 12. Microstructure of Ti17 alloy in the plastic shakedown state observed by TEM: (ac) parallel dislocation lines in α phase; (df) dislocation walls formed by dislocation climbing.
Metals 14 00743 g012
Figure 13. Two-beam TEM images of dislocation lines observed in Ti17 alloy in the plastic shakedown state: (a) image using imaging conditions of g = [01−10]; (b) image using imaging conditions of g = [0002].
Metals 14 00743 g013
Figure 14. Bending dislocation observed by TEM: (a) bending dislocations observed at small magnifications; (bd) bending dislocations observed at big magnifications.
Metals 14 00743 g014
Figure 15. Schematics of microstructure evolution of plastic shakedown of Ti17 alloy during CF test.
Metals 14 00743 g015
Table 1. Chemical composition of Ti17 alloy (wt, %).
ElementAlSnZrMoCrFeCNHOTi
wt./%5.02.11.93.94.00.300.050.050.01250.08Bal.
Table 2. Material parameters of Ti17 alloy shakedown theory model.
TemperatureMaterial Parameters
300 °CE = 102 GPa, ν = 0.30, Q0 = 580 Mpa, Qsa = 104 MPa, K = 665 MPa, n = 150, γ = 29.8, μ = 0.05, x(k) = 2.9 × 10⁻⁹, m(k) = 3.5, M = 8;
ζ(1) = 522.2, ζ(2) = 309.7, ζ(3) = 257.1, ζ(4) = 176.9, ζ(5) = 118.3, ζ(6) = 75.4, ζ(7) = 43.6, ζ(8) = 26.6; r(1) = 6.61, r(2) = 5.28, r(3) = 18.31, r(4) = 37.93, r(5) = 20.93, r(6) = 21.79, r(7) = 30.41, r(8) = 41.26
Table 3. The relative error of the simulation results and the experimental results.
Cycle123456
Error value/%0.0200.0210.0180.0140.0080.006
Percentage/%3.263.412.962.201.280.99
Table 4. The common dislocation Burgers vectors and determination criteria in titanium alloys adapted from Ref. [35].
g<a><c><a + c>
1/3<11−20>[0001]1/3<11−23>
0002NoneAllAll
01−10AllNoneAll
−2110AllNoneAll
Disclaimer/Publisher’s Note: The statements, opinions and data contained in all publications are solely those of the individual author(s) and contributor(s) and not of MDPI and/or the editor(s). MDPI and/or the editor(s) disclaim responsibility for any injury to people or property resulting from any ideas, methods, instructions or products referred to in the content.