Article

The Influence of Insertion Depth of Inorganic Materials on Solidification Microstructure and Segregation of 2.5-ton 42CrMo Ingot

State Key Laboratory of Advanced Special Steel, School of Materials Science and Engineering, Shanghai University, Shanghai 200444, China
*
Authors to whom correspondence should be addressed.
Metals 2024, 14(7), 753; https://doi.org/10.3390/met14070753
Submission received: 4 June 2024 / Revised: 17 June 2024 / Accepted: 17 June 2024 / Published: 25 June 2024

Abstract

:
In this work, a novel internal heat absorption technology using inorganic material rods is employed during the solidification process of steel ingots, aiming to control their solidification and improve the quality of the final product. The study investigates the effect of the insertion depth of inorganic materials on the solidification microstructure and macrosegregation of 2.5-ton 42CrMo ingots. The mechanical properties of samples from the product are also tested. A numerical simulation model for casting 2.5-ton ingots is established and implemented in Ansys Fluent fluid simulation software, with inorganic material rods set at different preset depths. The simulation explores the physical processes of the melting and floating of inorganic materials in molten steel, as well as their effects on the temperature and flow fields of the material. The results show that deeper insertion of inorganic materials (200 mm from the hot top) reduces the tendency for macrosegregation compared to that at the insertion depth of 100 mm. Specifically, the positive segregation area decreases by 10.35%, while the negative segregation area decreases by 15.32%. Moreover, deeper insertion results in a significant refinement of the solidification microstructure, ultimately enhancing the mechanical properties of the products machined from the ingots (i.e., the yield strength increased by 4.7%). The numerical simulation results indicate that as the placement depth of inorganic materials in the ingot mold increases, the cooling effect becomes more significant, the flow area of molten steel initiated by the inorganic materials expands, and the linear velocity of the double-circle flow increases. This further explains why the solidification quality of the ingots improves with the increasing placement depth of inorganic materials.

1. Introduction

Large ingots are key materials in the production of important parts of equipment vital for economic growth. They are widely used in industries such as aviation, shipbuilding, energy, and national defense. However, the large size and mass of ingots, along with their extended solidification time, result in low cooling rates throughout the solidification process. This variability can lead to multiple casting defects which directly impact the final mechanical properties, corrosion resistance, and fatigue resistance [1,2,3].
Lesoult described the common defects found in a 65-ton steel ingot, such as inverse segregation concentrated at the bottom region, channel segregation in the middle portion, and shrinkage cavities near the top layer of the ingot [4]. These findings were also corroborated by other related research [5,6,7]. Thus, controlling the solidification of large ingots to reduce macrosegregation, large inclusions, and shrinkage porosity is a growing challenge [8,9,10]. Traditional casting techniques fail to meet the new higher standards, resulting in an urgent need to find solutions and overcome the technical barriers in this field.
Under this backdrop, researchers are continuously exploring new technological methods. Currently, some existing techniques include variable composition multi-package co-pouring technology [11,12], layered solidification technology [13,14], feeding steel strip technology [15,16,17], and internal cooling with steel balls technology [18]. However, although these technologies have made some progress, they still face several problems such as high application costs, technical difficulties, and the difficulty of generalization.
Therefore, facing the challenge of defect control during the solidification process of large ingots, our laboratory has innovatively proposed the method of using internal heat absorption technology to improve the macrosegregation and central solidification structure of large ingots. In previous work, Lai initially simulated the application of internal heat absorption technology with inorganic materials in the casting process of large steel ingots using a physical model employing water and paraffin, revealing the melting and floating processes of the inorganic materials [19]. Xu employed inorganic material endothermic technology for the casting of 250 kg ingots, subsequently demonstrating through characterization tests on the ingots that this technology improved the quality of the ingots [20]. Zhu and Yu conducted industrial experiments with 5-ton GCr15SiMn using the internal heat absorption technology [21]. Comparison with samples made using traditional methods revealed marked enhancements in the reduction of macrosegregation and inclusion defects in large ingots. Additionally, the simulation phenomena demonstrated that during the melting process, the inorganic materials enhance the quality of the steel ingot by increasing the cooling rate of the molten steel and accelerating the internal liquid steel flow.
However, previous studies indicate that the effect of different placement depths of inorganic materials on ingot quality remains unstudied. In this work, the influence of the insertion depth of inorganic materials on the solidification microstructure, macrosegregation, and mechanical properties of the final product in 2.5-ton 42CrMo ingots is investigated. Additionally, this paper employs a numerical simulation model to explore changes in the temperature and flow fields during the solidification process of molten steel as the insertion depth of inorganic material rods increases.

2. Experimental Procedure

2.1. Experimental Design

The experiments were conducted at a domestic steel company, and 42CrMo steel was selected as the material; its chemical composition is presented in Table 1. The liquidus temperature of the steel is 1793 K. The selection of 42CrMo steel was driven by its extensive application in industries requiring high strength and toughness. During solidification, this alloy faces challenges such as susceptibility to macrosegregation due to uneven cooling rates and potential coarse dendritic growth, significantly affecting the final mechanical properties.
The experimental plan was to cast two 2.5-ton steel ingots. The molten steel is injected into the iron mold using the bottom pouring method. As shown in Figure 1, two inorganic material rods of the same specifications, but with different heights, were pre-set in the molds (Ingot A: H = 100 mm, Ingot B: H = 200 mm).

2.2. Industrial Experimental Procedure

The production process of the experimental ingots starts with electric furnace steelmaking, followed by refining the molten steel and pouring it into molds for casting. The casting temperature is 1823 K, and the casting process is completed in 6 min. After solidification, the ingots were annealed and cooled down. Then, two ingots were sent to the plant for the forging of the product and sampling.

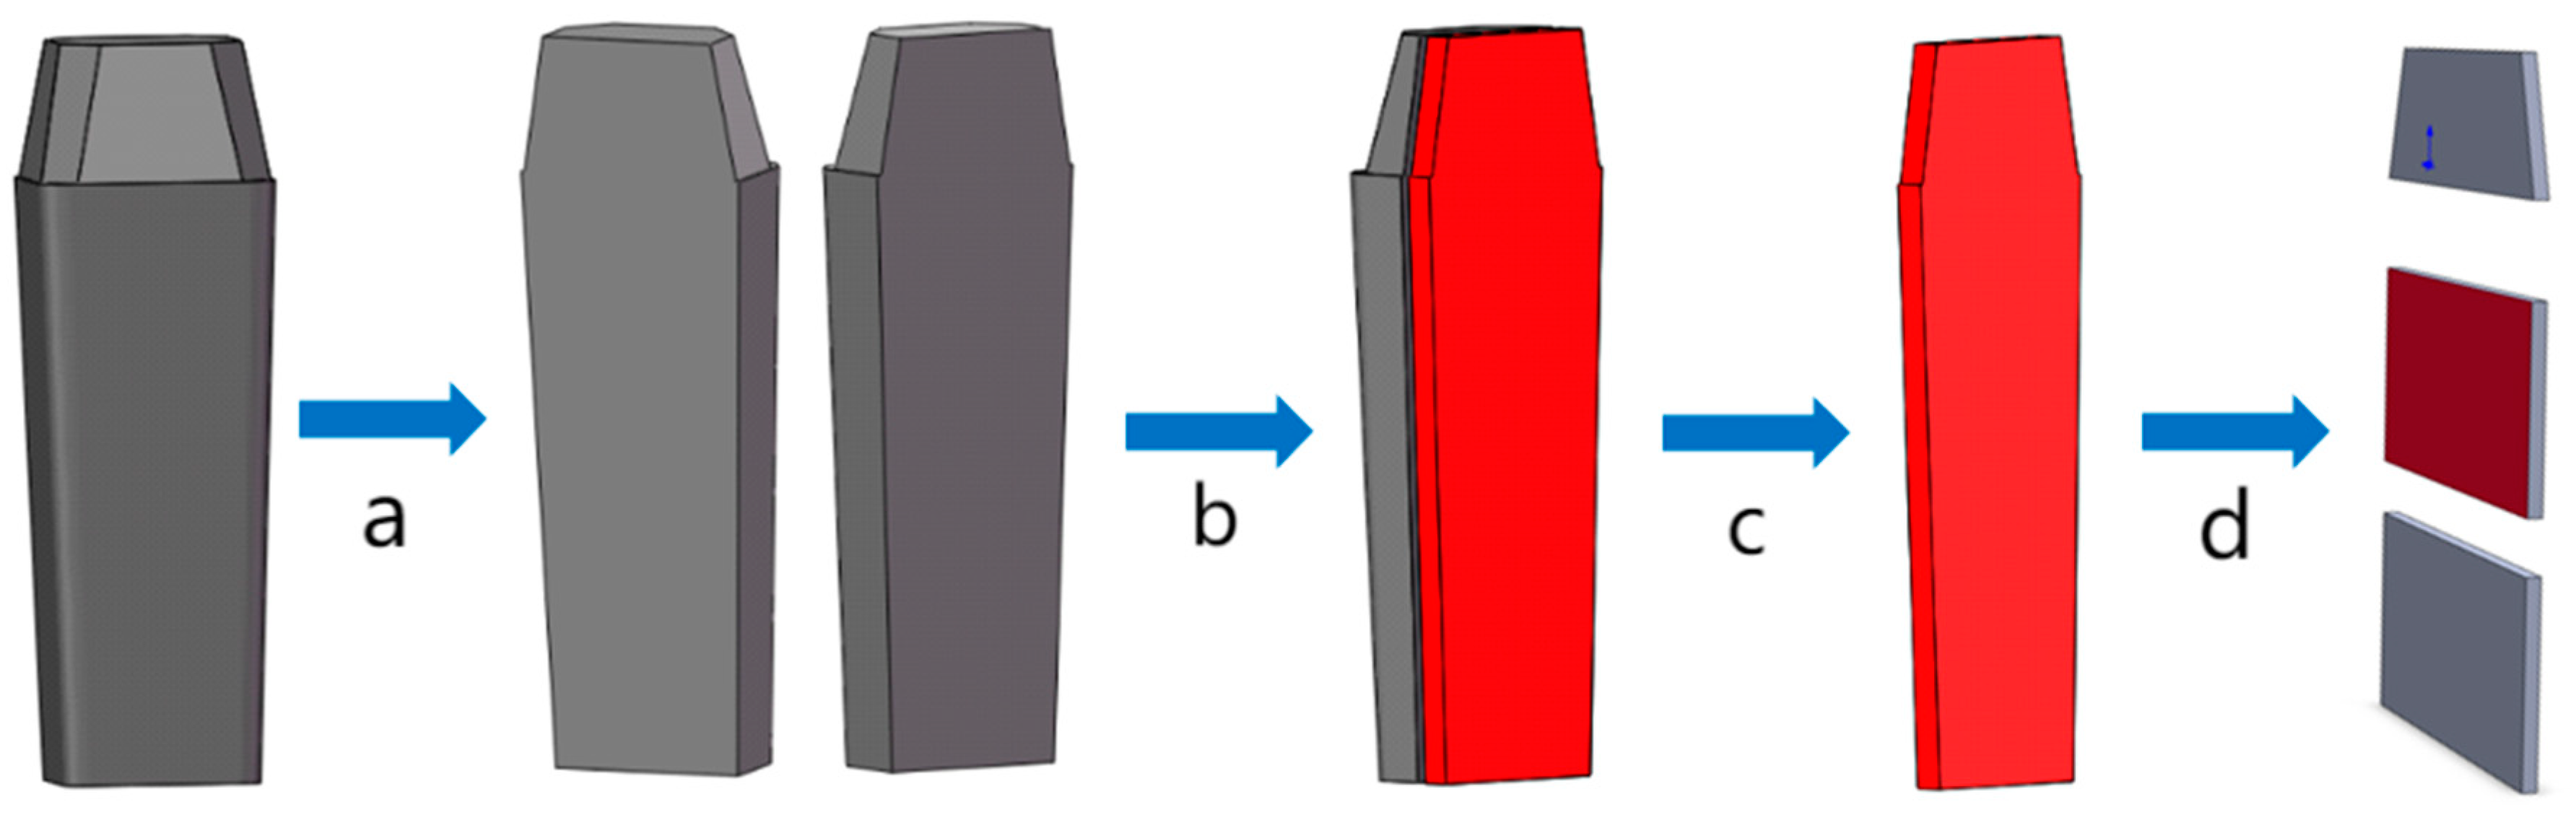
2.3. Sampling Characterization Methods

Before the forging process, the steel ingots were sectioned along the vertical centerline. Due to the occurrence of typical defects in large ingots near the hot top location, the upper section of the ingot was selected for characterization in this experiment. The sampling schematic is illustrated in Figure 2.
The analysis surfaces were polished to achieve a surface roughness of Ra ≤ 1.6 μm. A hydrochloric acid solution (1:1 volume ratio) was used to immerse the samples in acid, etching at 348 K for 15 min. Subsequently, the macrosegregation on the surfaces of different samples was observed and compared.
Holes with a diameter of 5 mm were drilled at 25 mm intervals along the longitudinal and transverse directions. The distribution of carbon and sulfur within the ingot was measured using a C/S analyzer (Leco CS844, LECO Corporation, Saint Joseph, MI, USA). In the right half of the specimen, samples were taken at three different levels (upper, middle, and lower) at 50 mm intervals along the transverse direction. Samples of 10 mm × 10 mm × 10 mm were obtained from the slices. After grinding and polishing, the sample block was etched in a saturated picric acid solution for 65 s, cleaned, and then subjected to metallographic analysis. The actual sampling method is depicted in Figure 3.
Two 35 mm thick slices were cut at the same position as the rough-machined products shown in Figure 4a. Mechanical performance tests were then conducted on the specimens. The sampling positions are illustrated in Figure 4c.

3. Numerical Simulation Model

In this study, a series of numerical simulations were conducted using the commercial software Ansys Fluent 2022 R1 (developed by Ansys, Inc.) to compare variations in the flow field and temperature field under different process parameters. Several simplifications and assumptions were made during the simulation: (1) a two-dimensional (2D) model comprising molten steel, inorganic materials, air, ingot molds, and refractory insulation sleeves was established; (2) both molten steel and melted inorganic material rods were assumed to be homogeneous, incompressible Newtonian fluids; (3) the buoyancy term of the molten steel followed the Boussinesq hypothesis; (4) volume shrinkage during the solidification of molten steel was ignored. In this model, a combination of the Navier–Stokes equation and the three-phase VOF model was employed to track the interfaces between steel, inorganic materials, and air, as well as to simulate multiphase flow within the ingot mold. Turbulence was calculated using the shear stress transport (SST) k-ε model. The energy equation and the enthalpy–porosity method were applied to describe heat transfer and solidification/melting processes.
The initial conditions for the simulation were as follows: The initial temperatures of air and inorganic materials were set to 323 K, respectively. The boundary conditions are presented in Figure 5: the inlet initial velocity was 0.01 m·s−1, and the temperature was set to 1773 K.

4. Results and Discussions

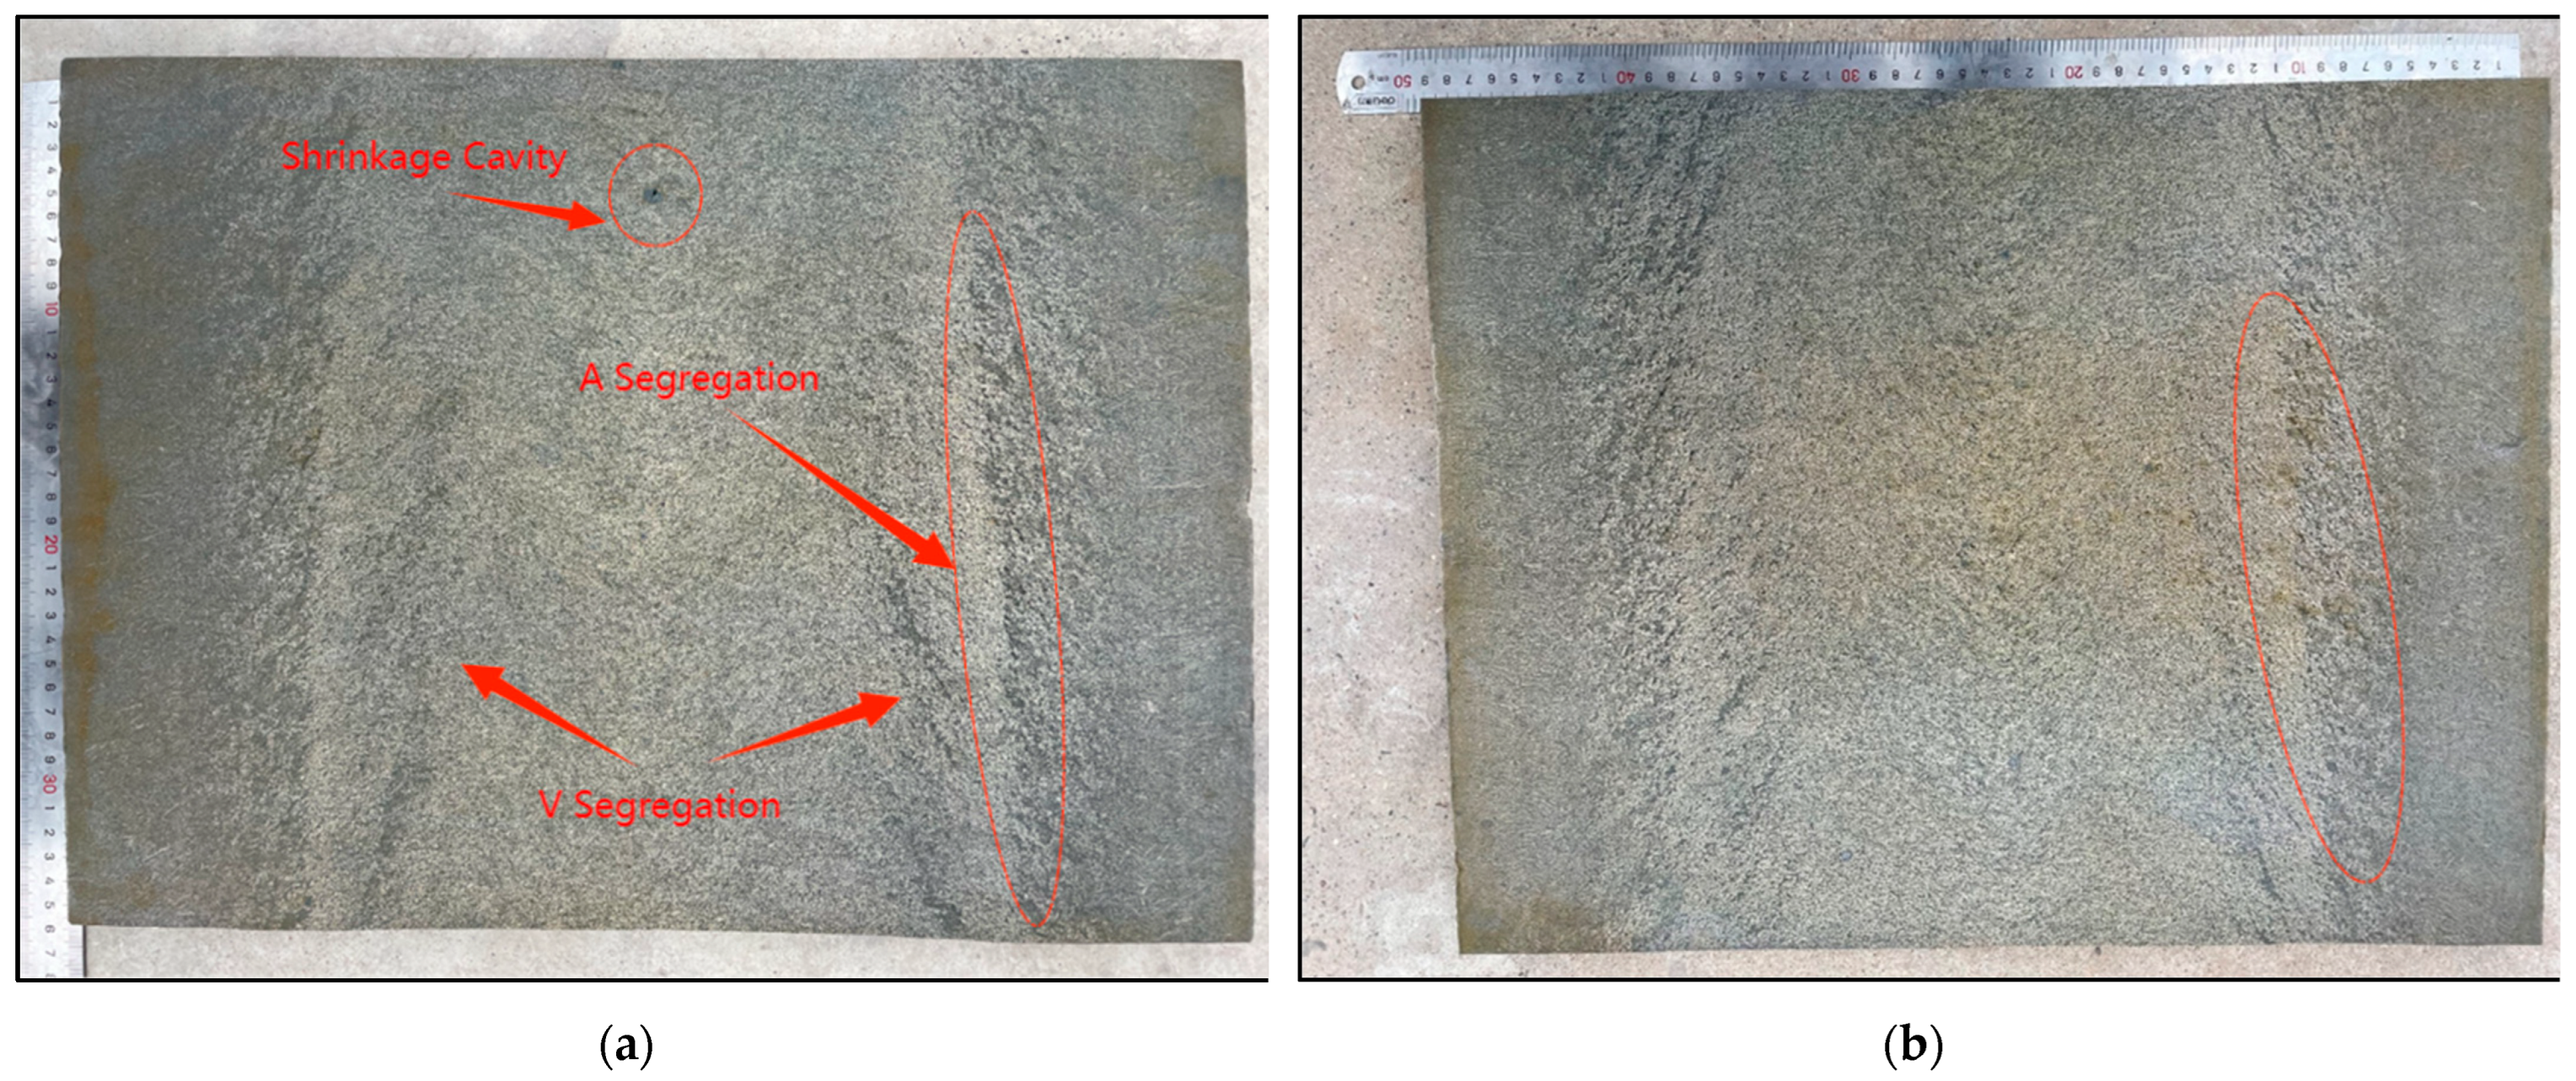
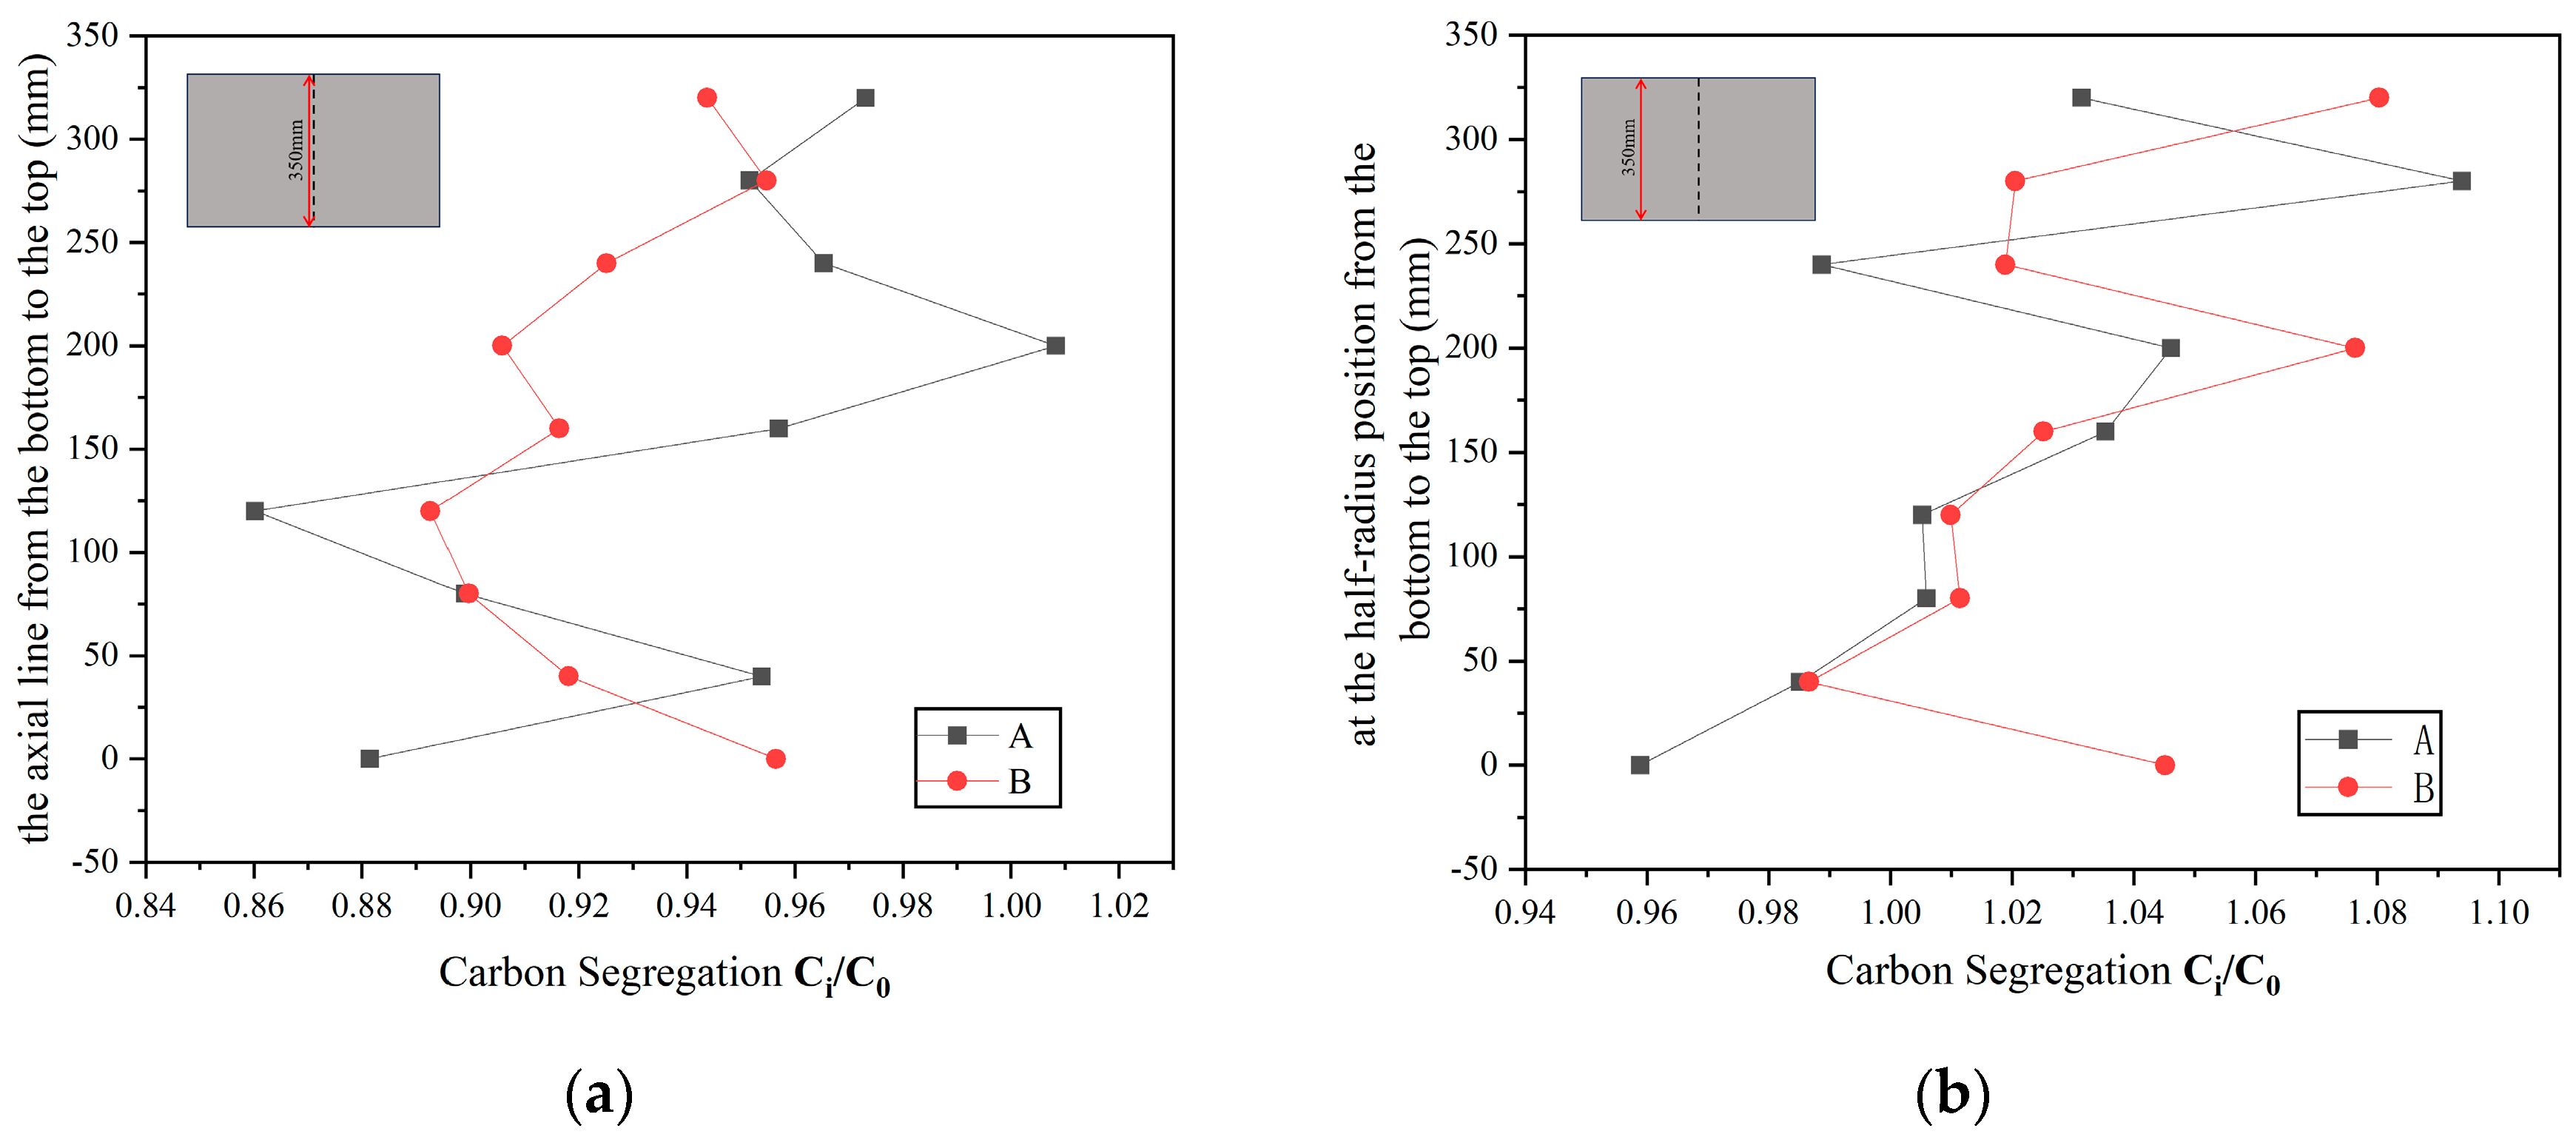
4.1. Macrosegregation Analysis

The sectioned samples of the steel ingot after hot acid etching are shown in Figure 6. From the results, it can be observed that the macrosegregation in Ingot B, where the inorganic material was inserted to a deeper position depth, has been significantly improved compared with that of Ingot A. The degree of A-type and V-type segregation both decreased.
To demonstrate the effect of different depths of inorganic material positions on the macrosegregation of the ingot, the carbon segregation ratios were calculated based on the carbon content at various sampling points of the casting at room temperature, as shown in Figure 3. The carbon segregation ratio is reflected by the segregation ratio Ri, calculated using the formula:
Ri = Ci/C0,
where Ci represents the measured carbon content at a sampling point, and C0 represents the mean carbon content of all sampling points.
Figure 7 depicts the carbon segregation contour maps on the surfaces of samples A and B. It can be observed that below half the height of Ingot A, there is a negative segregation area which covers 30.42% of the entire area, with the minimum segregation ratio being 0.8910. The top part and the right half of Ingot A exhibit positive segregation, covering 60.37% of the area. The maximum segregation ratio is 1.106. In contrast, for Ingot B, with inorganic material heat absorption rods placed at a deeper position, the segregation areas are reduced, with a more significant reduction in the negative segregation area. The area percentage of the upper positive segregation region is reduced by 10.35%, concentrated in the upper central portion. The area of the lower negative segregation region is reduced by 15.32%. It could be concluded that compared with Ingot A, Ingot B shows a significant reduction in both positive and negative segregation areas.
On the ingot’s central axis, as shown in Figure 8a, both Ingot A and Ingot B exhibit a consistent overall trend of carbon segregation, with negative segregation at the lower part and positive segregation at the upper part. In Ingot A, carbon segregation displays greater fluctuations, with ratios ranging from 0.86 to 1.01, whereas in Ingot B, carbon segregation ratios range from 0.89 to 0.96. These results indicate that in Ingot B, where the inorganic material rods are placed deeper, the range of carbon segregation along the central axis is significantly reduced. Additionally, as illustrated in Figure 8b, at the half-radius position of the ingot in the vertical direction, the overall carbon segregation in Ingot A ranges between 0.96 and 1.10, while in comparison, the degree of carbon segregation in Ingot B slightly decreases, with segregation ratios ranging between 0.98 and 1.08. The variance of element segregation coefficients can reflect the dispersion of carbon segregation ratios at various points on the same ingot. By computing the variance of carbon segregation ratios at the center position of the steel ingot ( S A 2 = 0.0023, s B 2 = 0.00054) and at the half-radius position ( S A 2 = 0.0015, s B 2 = 0.00097), it is observed that the carbon segregation in Ingot B is superior to that of Ingot A.

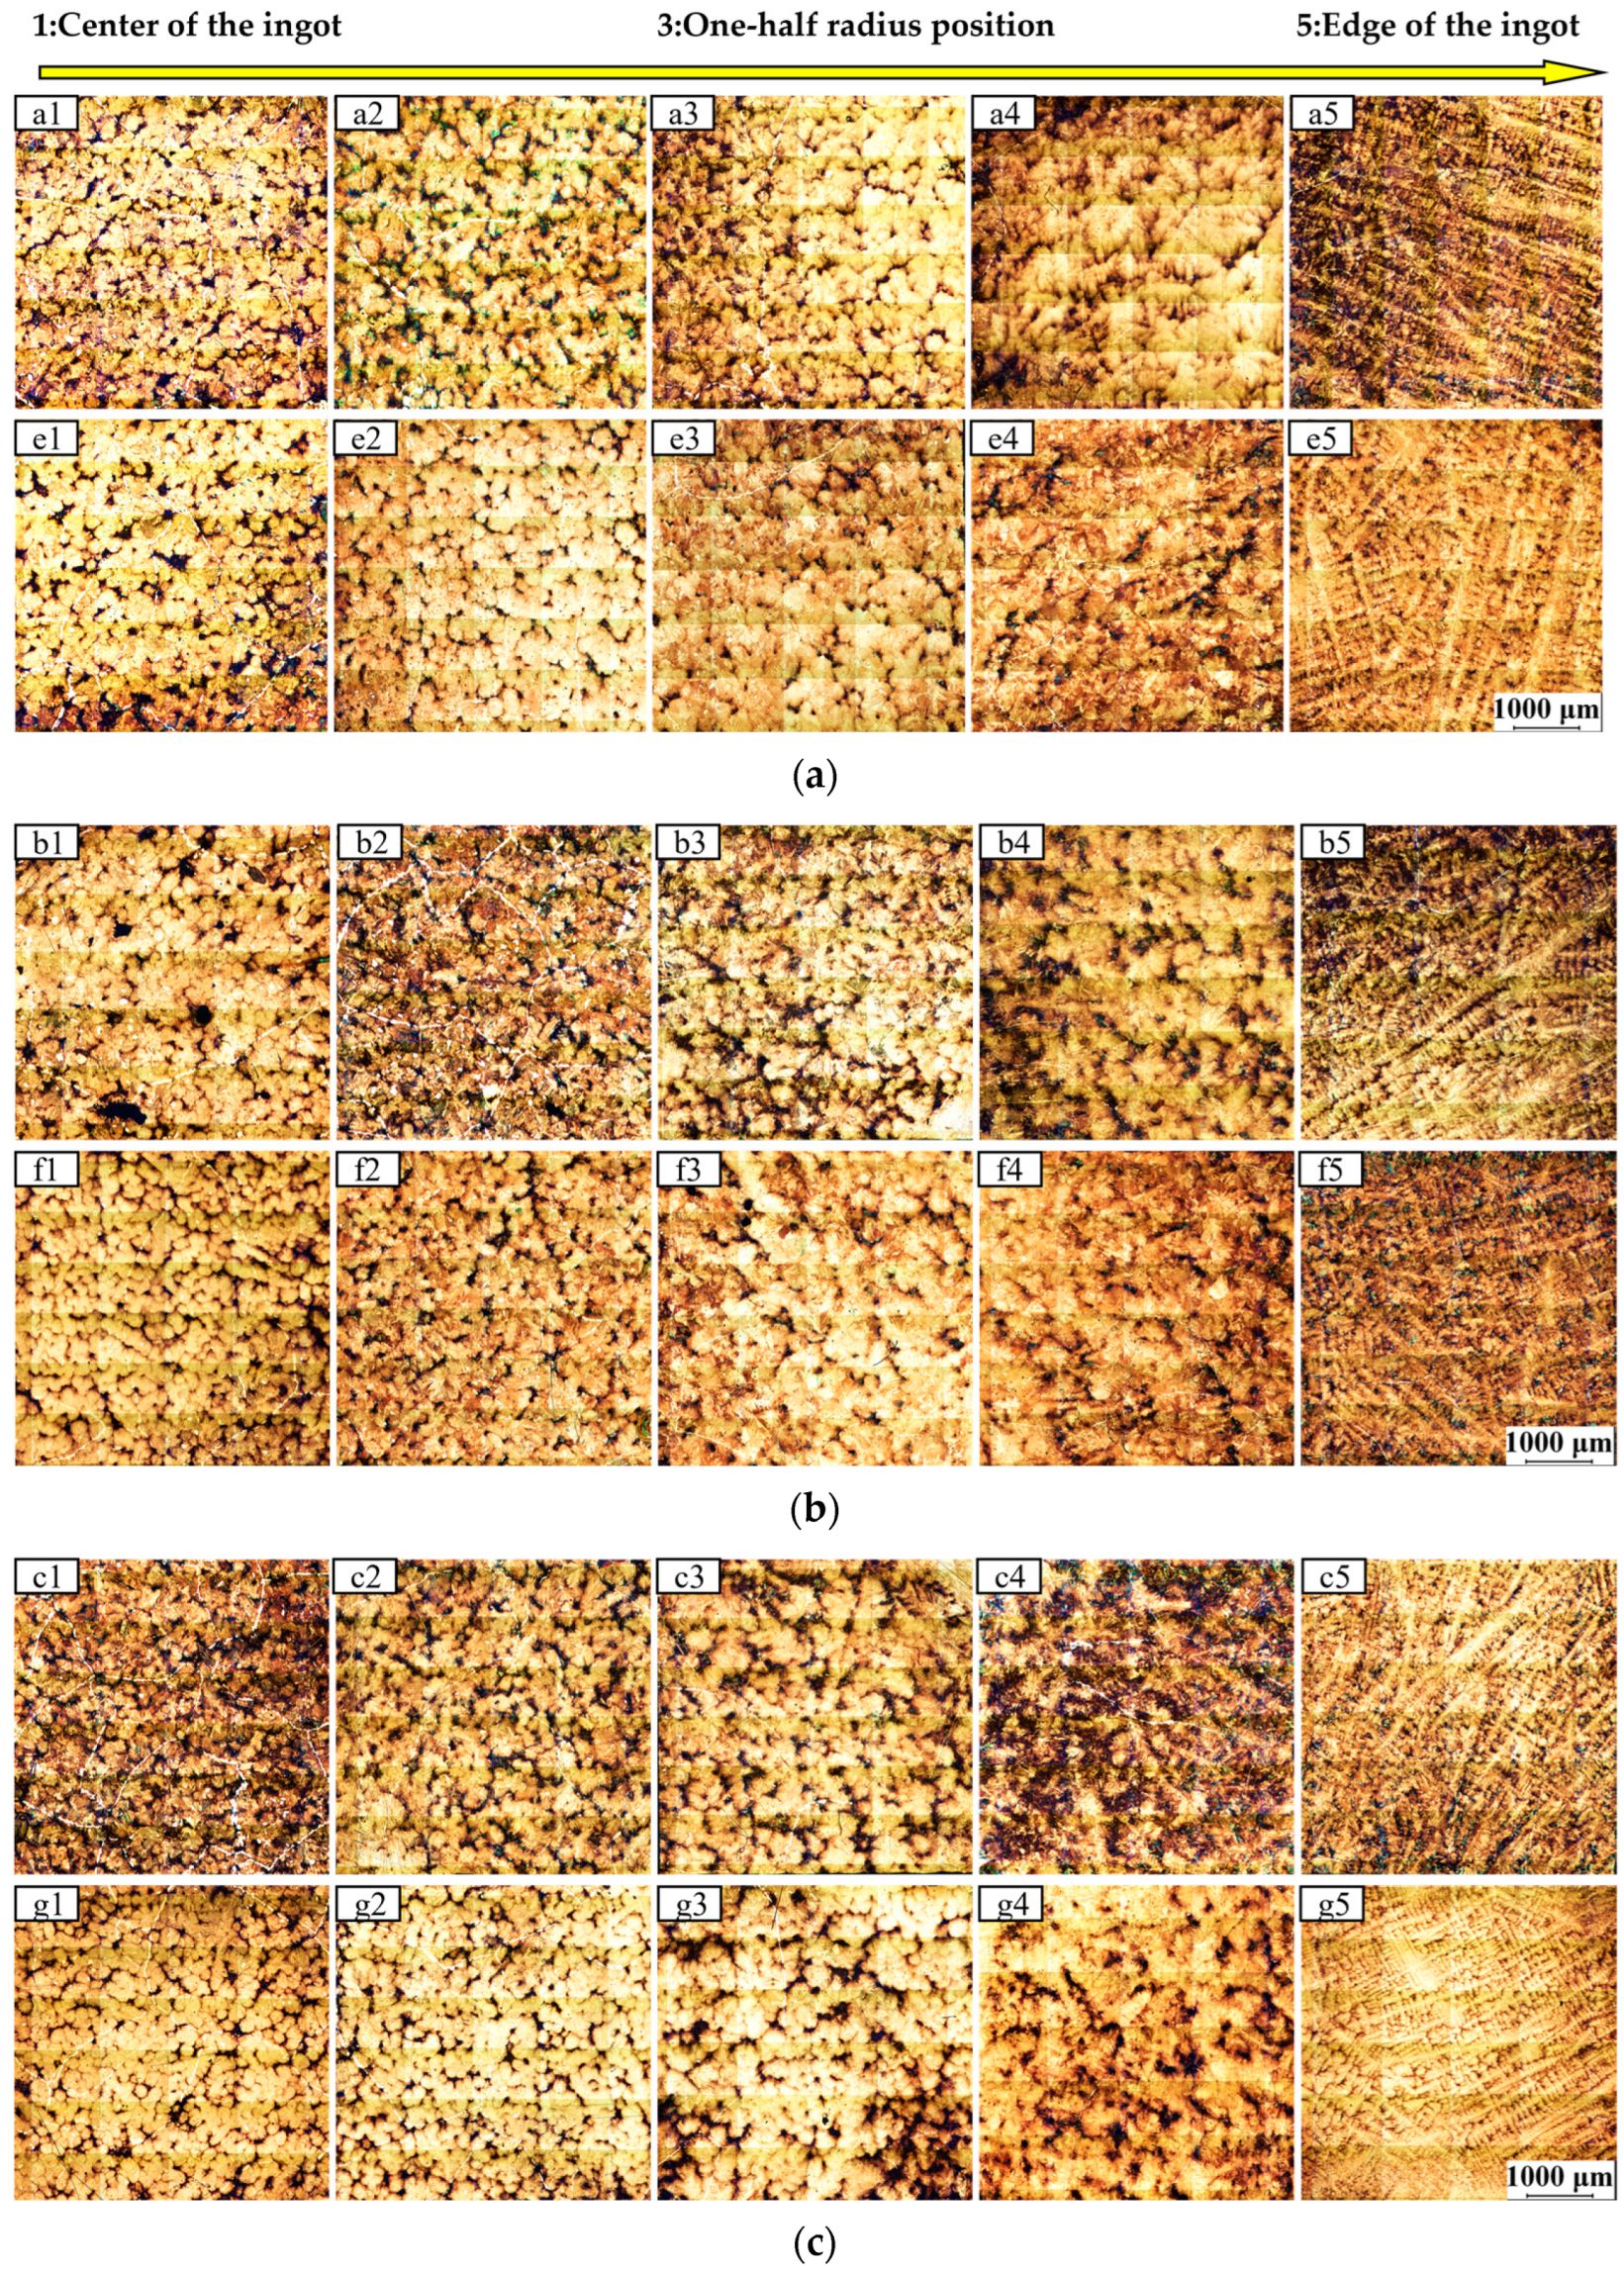
4.2. Metallographic Analysis

In Figure 9 of the metallographic images, it is evident that as the placement depth increases, the interstitial spaces between the equiaxed grains at the center become narrower, resulting in grain refinement. Particularly, as depicted in images a2 and e2 at the 1/4 radius of the ingot, the interstitial spaces between the equiaxed grains at the deeper placement depth (e2) are smaller and more tightly distributed. Near the surface of the ingot, as illustrated by images a5 and e5, compared to Ingot A, the columnar crystals at the periphery of Ingot B become denser, and the decrease in secondary dendrite spacing indicates a significantly enhanced cooling rate following an increase in placement depth [22].
Observations from the metallographic images of the central portions reveal relatively minor differences in grain structure at corresponding locations between the ingots. Notably, the columnar crystals near the edge of Ingot A appear coarser than those of Ingot B. Examination of the morphology of the dendrites at the bottom cross-section further reveals that the equiaxed grains at the center of Ingot B are smaller and more refined compared to those of Ingot A.
From the metallographic Figure 9b in the middle of the sample, it is observed that there is little difference in the morphology of equiaxed grains in various corresponding parts, but the columnar grains near the edge of Ingot A are thicker than those of Ingot B (b5 and f5). Observed from the dendrite morphology at the bottom of the longitudinal section sample plate in Figure 9c, the size of the equiaxed grains in the center of Ingot B is smaller than that of Ingot A, and the grains are more refined (the average grain size decreased by 87 µm). Compared with Ingot A, the dendrite trunks of the columnar grains g5 at the edge of Ingot B are more closely arranged on the ingot surface.
The study shows that the secondary dendrite arm spacing (SDAS) mainly depends on the cooling rate, and the faster the cooling rate, the smaller the spacing [23]. The secondary dendrite arm spacing at three sets of positions, a5 and e5, b5 and f5, c5 and g5, was measured by the spacing method shown in Figure 10 [24]. From the comparison of SDAS in the columnar crystal zones of the two ingots, it can be found that the SDAS of Ingot B is smaller than that of Ingot A at all positions, indicating that the increased depth of inorganic material placement accelerates the cooling rate of the molten steel at the test positions.

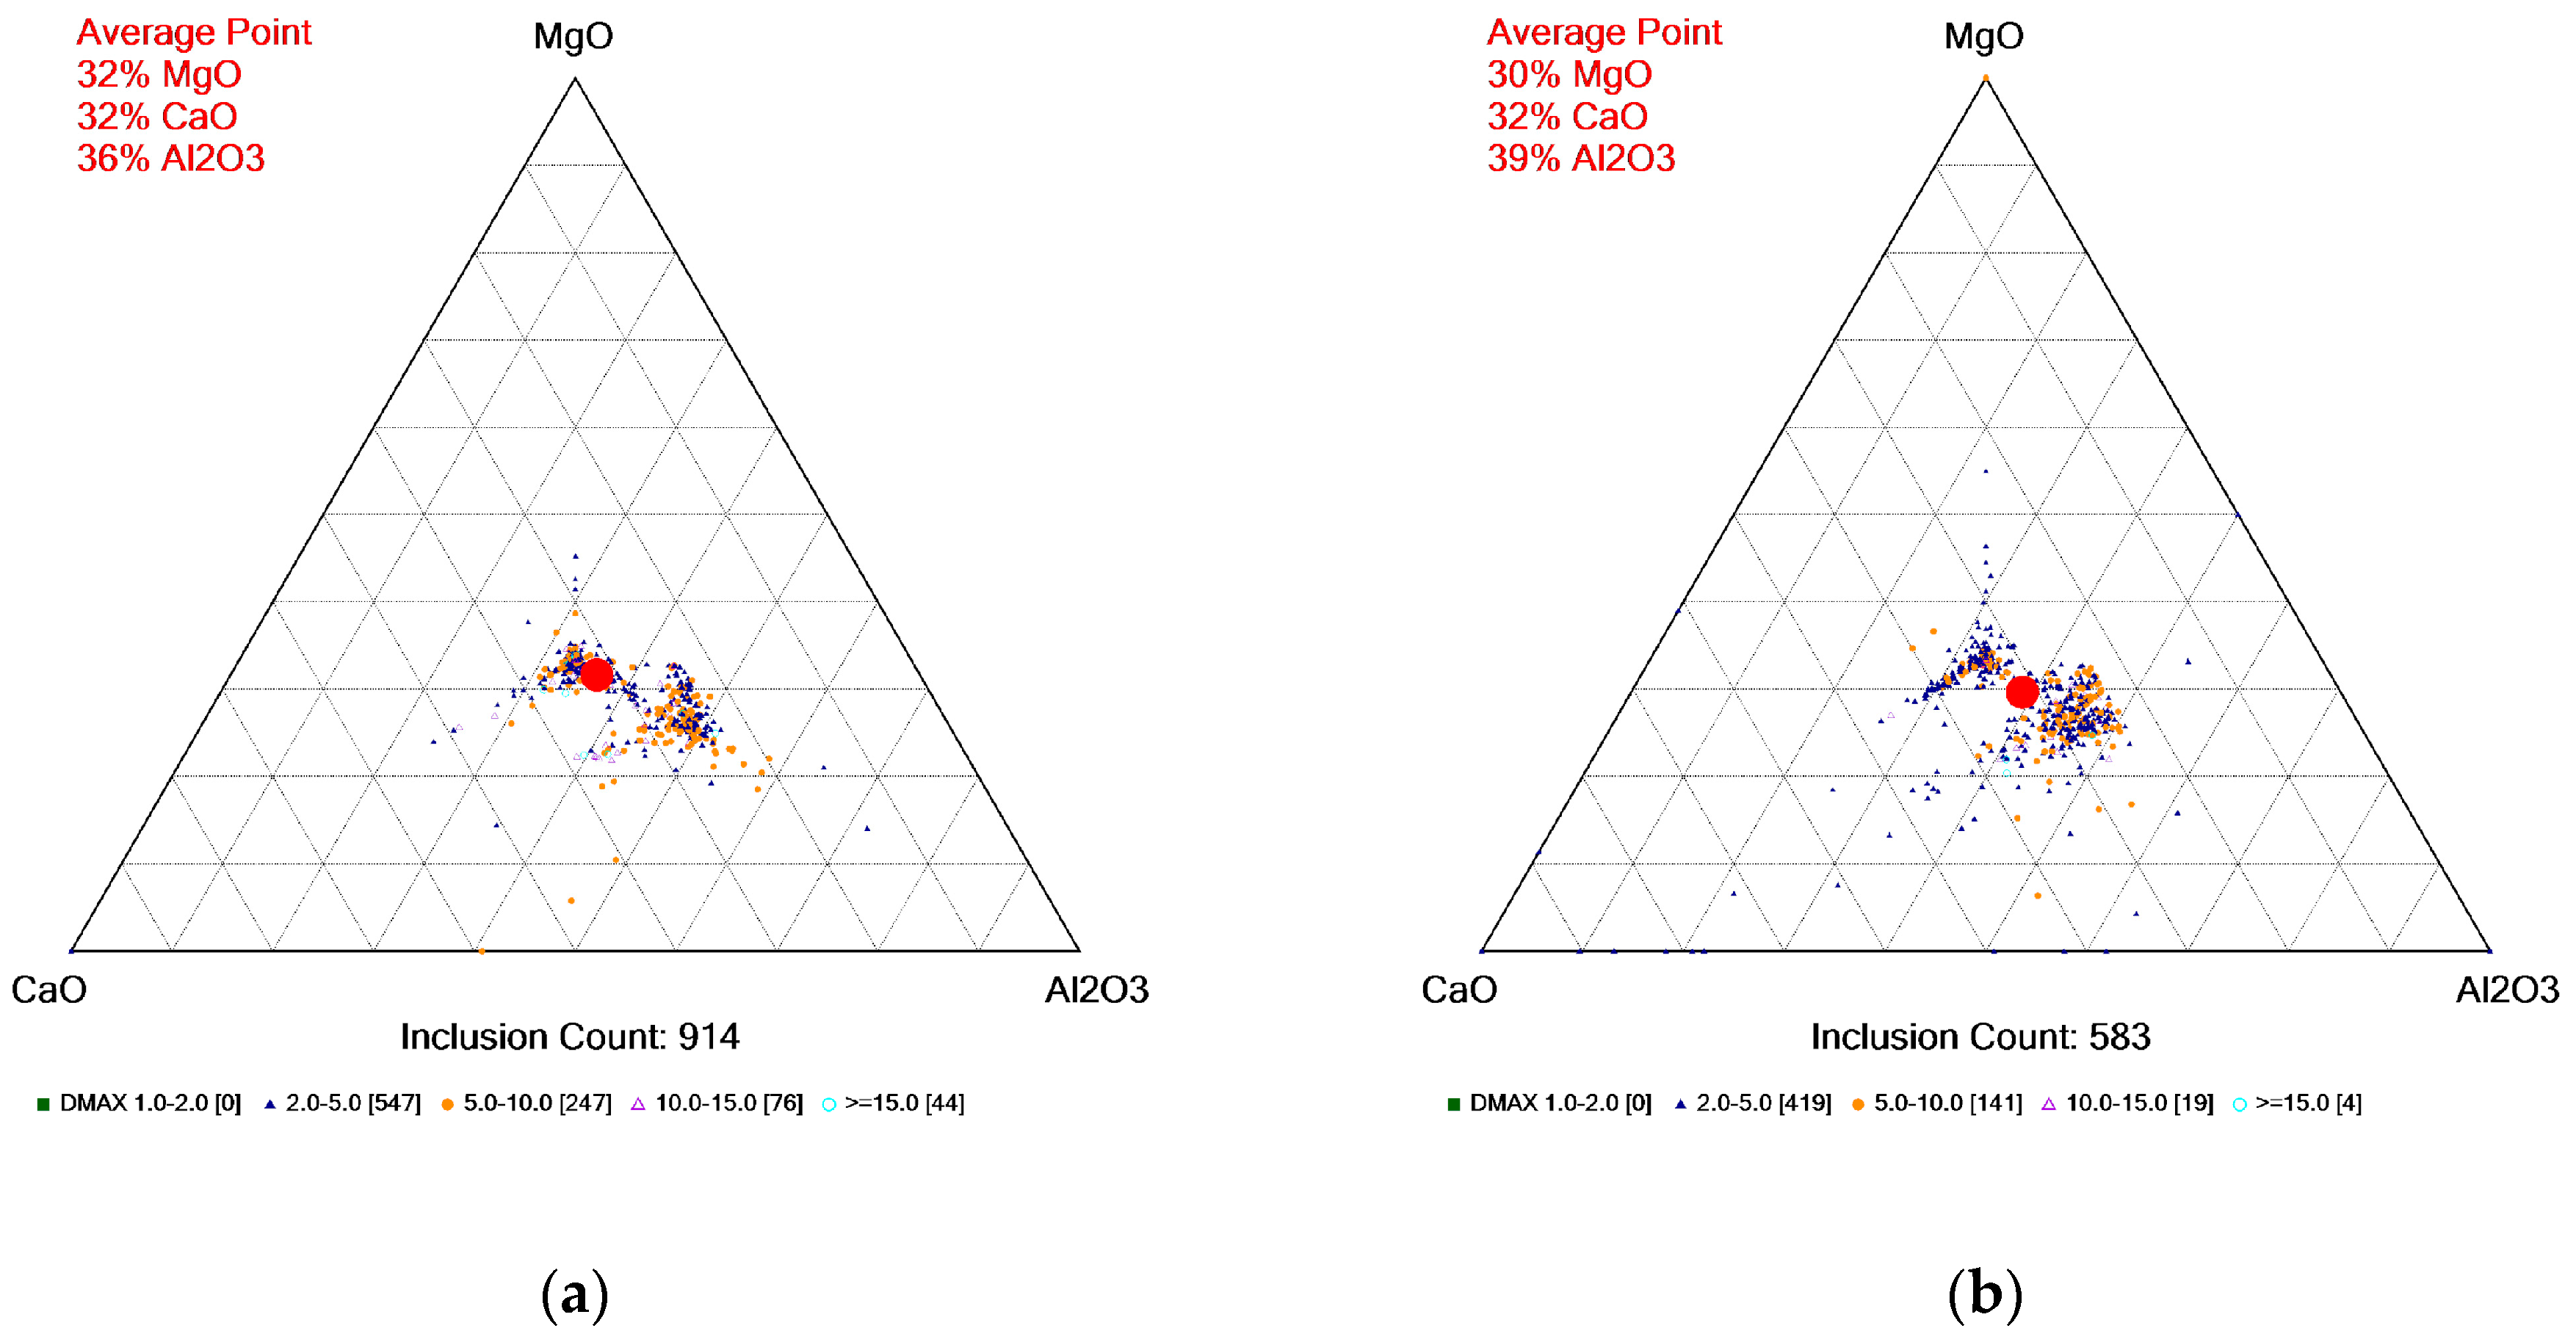
4.3. Inclusion Analysis

To investigate the influence of different processing windows on the quantity, composition, and morphology of inclusions in the ingots, the inclusions in the ingots were statistically analyzed using an Aspex scanning electron microscope. The scanning area of the samples was 10 mm × 10 mm, and the quantity of inclusions, classified by size, is shown in Figure 11. Compared to Ingot A, Ingot B, with a deeper placement of the inorganic material rods, exhibited a significant reduction in the quantity of inclusions of all sizes. Particularly noteworthy is the significant decrease in the quantity of large-sized inclusions (x ≥ 10 μm) in the samples from Ingot B, with only 26 observed, compared to 120 in Ingot A, indicating a substantial improvement in ingot quality.
The composition distribution of all inclusions is illustrated in the MgO-CaO-Al2O3 ternary distribution diagram, shown in Figure 12. From the diagram, it can be observed that the content of spinel and alumina-type inclusions in the samples from Ingot B has decreased. Spinel, rich in magnesium and aluminum, forms in steel when magnesium and aluminum elements combine at specific temperatures [25]. Additionally, research indicates that inclusions in steel can be removed using the flotation/settling method [26]. We speculate that this reduction may be attributed to the increased depth of placement of the inorganic materials, leading to faster cooling rates of the steel and enhanced fluidity of the melt. Consequently, compared to Ingot A, the quantity of large-sized inclusions, such as spinel and alumina-type inclusions, is notably reduced in Ingot B.

4.4. Mechanical Properties of Final Products

In accordance with the sampling scheme illustrated in Figure 4c, the specimens for room temperature impact testing are V-shaped samples, while those for room temperature tensile testing are cylindrical specimens. Upon completion of the tests, the mechanical properties of the products produced from ingots A and B at various locations are presented in Table 2 and Table 3, respectively.
Based on the results from Table 2, it is evident that both the radial and transverse impact energies of sample B are higher than those of sample A, indicating that the product processed from Ingot B possesses better toughness. The finer microstructure and smaller SDAS contribute to the enhancement of impact performance. Therefore, it is reasonable to conclude that the deeper position of inorganic material rods in Ingot B leads to a greater internal steel temperature gradient during the solidification process. Thereby, it can promote grain refinement and reduce SDAS.
The tensile performance test results in Table 3 indicate that the tangential tensile strength of sample B is slightly higher than that of sample A, reaching 1116 MPa and 1157 MPa, respectively. Compared to sample A, the tangential yield strength of sample B has increased by 4.7%, reaching 1063 MPa. Similarly, in the radial direction, there is a slight increase in various tensile performance indicators of sample B. This is presumed to be due to the finer grain size at sample location B compared to A, according to the Hall–Petch relationship [27,28], wherein the performance of sample B is expected to surpass that of sample A.
Samples collected from the transverse position of Product A exhibited a relatively low reduction of area (53%) and possessed characteristics of brittle fracture. This embrittlement may be attributed to the central shrinkage porosity observed in Figure 8a.

4.5. Numerical Simulation Results

The melting and floating process of inorganic material rods at different depths in the ingot was numerically simulated using Ansys Fluent software. The phase fraction changes during the casting process of the ingot are shown in Figure 13. When the inorganic material encounters the molten steel, its melting process gradually progresses from the edge to the center. Due to the much lower density of the inorganic material compared to the molten steel, the melted droplets naturally float up and eventually stabilize on the surface of the molten steel. Taking the start of mold filling as the zero time point, in Ingot A, the inorganic material completely melts and floats to the surface of the molten steel at 683 s; in contrast, the same melting–floating process is completed in Ingot B at 633 s. This comparison indicates that the deeper the inorganic material is inserted, the earlier it melts in the molten steel and floats to the surface. This not only helps reduce the risk of introducing inclusions, but also results in a longer holding time, as the steel surface is covered earlier, which has a positive impact on improving the quality of the upper end of the ingot. In addition, by comparing the entire action time of the inorganic material from contacting the molten steel to completely melting and floating to the surface, the action time of the inorganic material in Ingot A is shorter than that in Ingot B. The simulation results further confirm that under different process parameters, the inorganic material can completely melt without causing inclusion hazards to the internal molten steel. On the other hand, the flotation of inorganic material droplets can effectively reduce the number of inclusions in the ingot. When the inorganic material is placed deeper, its scope and duration of action are wider and longer, significantly improving the inclusion removal effect (see Figure 11).
Figure 14 illustrates the temperature field variations of ingots with inorganic materials placed at different depths at the same time. As shown in the figure, the deeper the placement of the inorganic material rod, the more significant its impact on the temperature field of the molten steel. At a solidification time of 462 s, the central temperature of Ingot A remains between 1748 K and 1773 K, and its internal temperature is maintained at the casting temperature. In contrast, the central temperature of the molten steel in Ingot B has dropped to between 1715 K and 1750 K in most areas. At 683 s, when both steel liquids have completely filled their respective molds, it is evident that the overall temperature of Ingot B is lower than that of Ingot A, especially in the areas near the mold wall, where the temperature difference is as high as 60 K. These analytical data indicate that the deeper placement of the inorganic material heat-absorbing rod accelerates the cooling rate of the molten steel. This condition is conducive to the columnar to equiaxed transition (CET) of the solidified structure and promotes a reduction in secondary dendrite arm spacing. The simulation results of the temperature field further confirm that placing the inorganic material heat-absorbing rod deeper improves the quality of the solidified structure of the steel ingot. The most important characteristics for quality improvement are grain refinement and reduction of carbon segregation. This behavior is due to the more effective heat absorption by the deeper-inserted inorganic materials, promoting uniform cooling.
The flow of the melt during solidification is a significant factor contributing to macrosegregation, and the addition of inorganic materials directly alters the flow state of molten steel, thereby affecting the solidification quality of the ingot. Figure 15 illustrates the velocity vectors of molten steel at different time points during the pouring process. During the filling process, two vortices can be observed forming on both sides of the inorganic material, a phenomenon that aids in the diffusion of internally cooled molten steel towards the mold wall, thereby lowering the overall temperature of the ingot. Notably, in Ingot B, where the inorganic material is placed deeper, the upward flow rate of the molten steel is faster than that in Ingot A. This not only enhances the flotation effect of the inorganic material droplets but, more importantly, the increased flow rate of the molten steel facilitates faster dissipation of internal temperature, thereby improving the cooling rate. This is beneficial for CET and grain refinement.

5. Conclusions

The technology for internal heat absorption solidification with inorganic materials has been proven effective in improving the solidification microstructure and macrosegregation of large ingots. Based on industrial trials conducted on a 2.5-ton ingot, the following conclusions are drawn:
  • After altering the process parameter of the placement depth of inorganic materials, we have identified better process windows through a series of comparative studies. Industrial trial results demonstrate that Ingot B, with deeper placement of inorganic materials, exhibits a significantly refined solidification microstructure, resulting in a significant reduction in equiaxed grain size at the ingot center, with fewer coarse columnar grains and a smaller spacing between secondary dendrite arms.
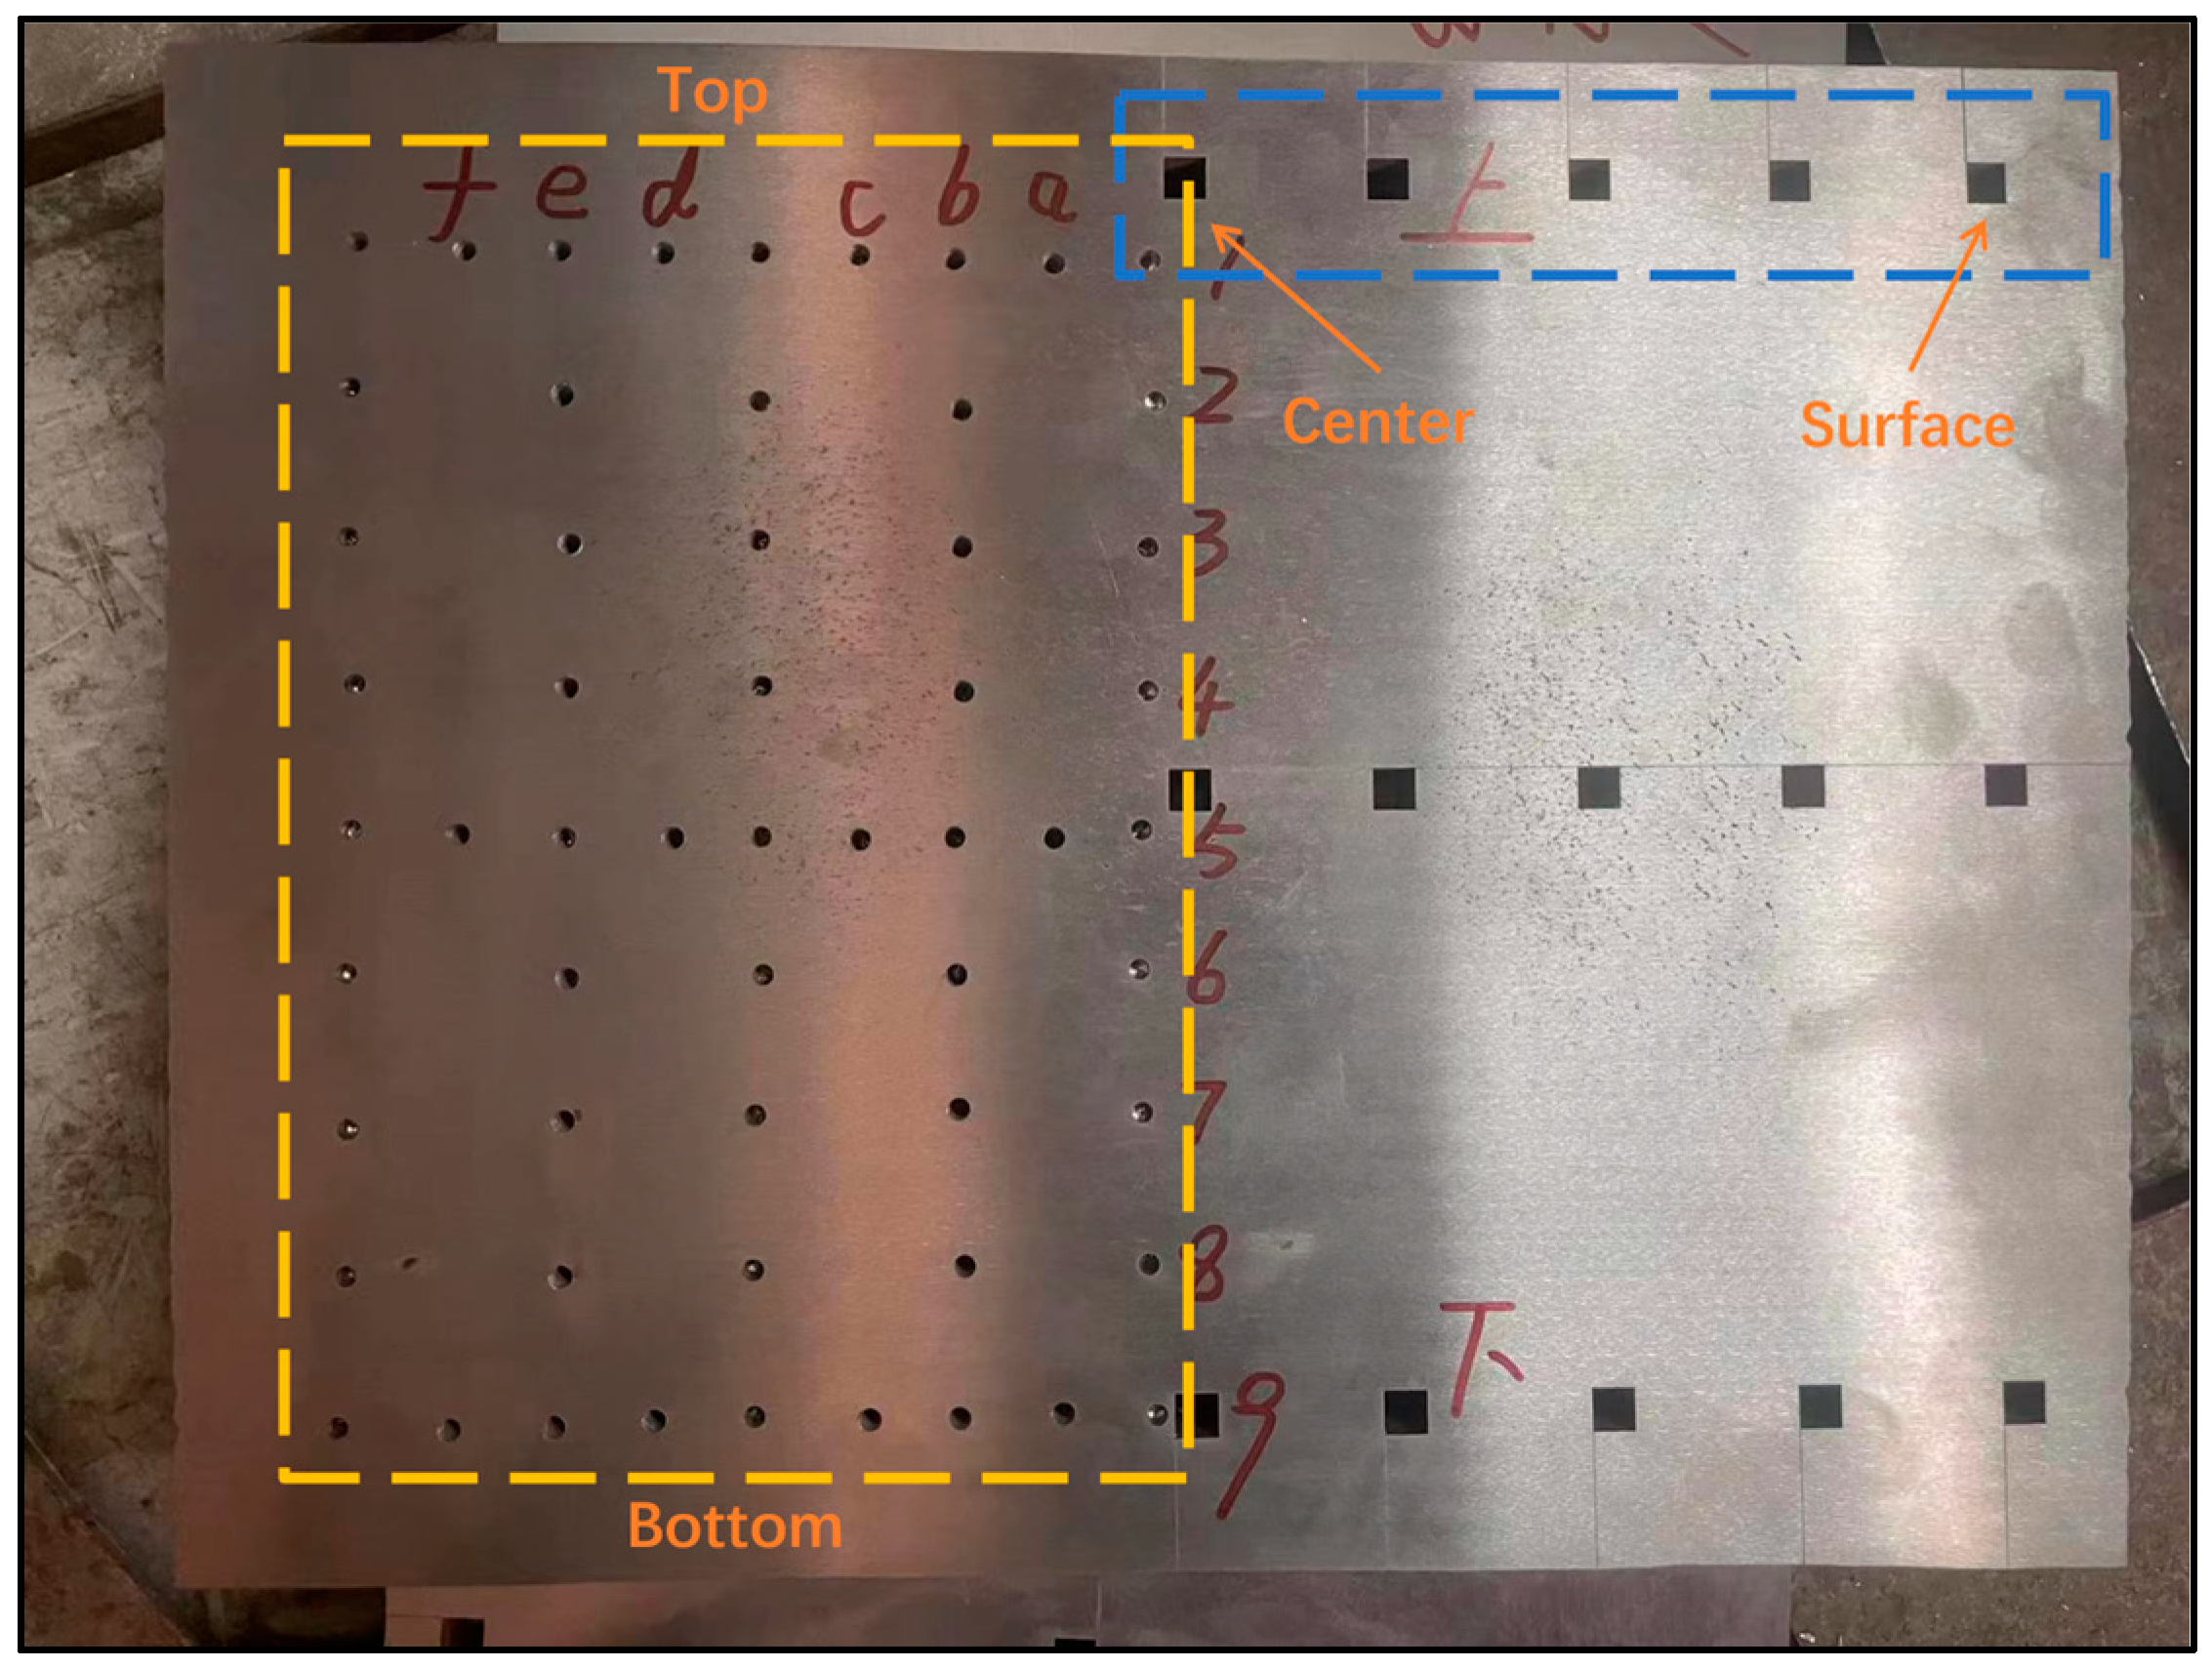
  • From the perspective of the macrosegregation degree, Ingot B, with inorganic material rods placed deeper, is superior to Ingot A. This is demonstrated by a 10.35% reduction in the area percentage of the positive segregation zone on the test surface and a 15.32% decrease in the area of the negative segregation zone. Additionally, the fluctuation degree and range of carbon segregation values at two specific positions in the vertical direction are smaller in Ingot B compared to Ingot A.
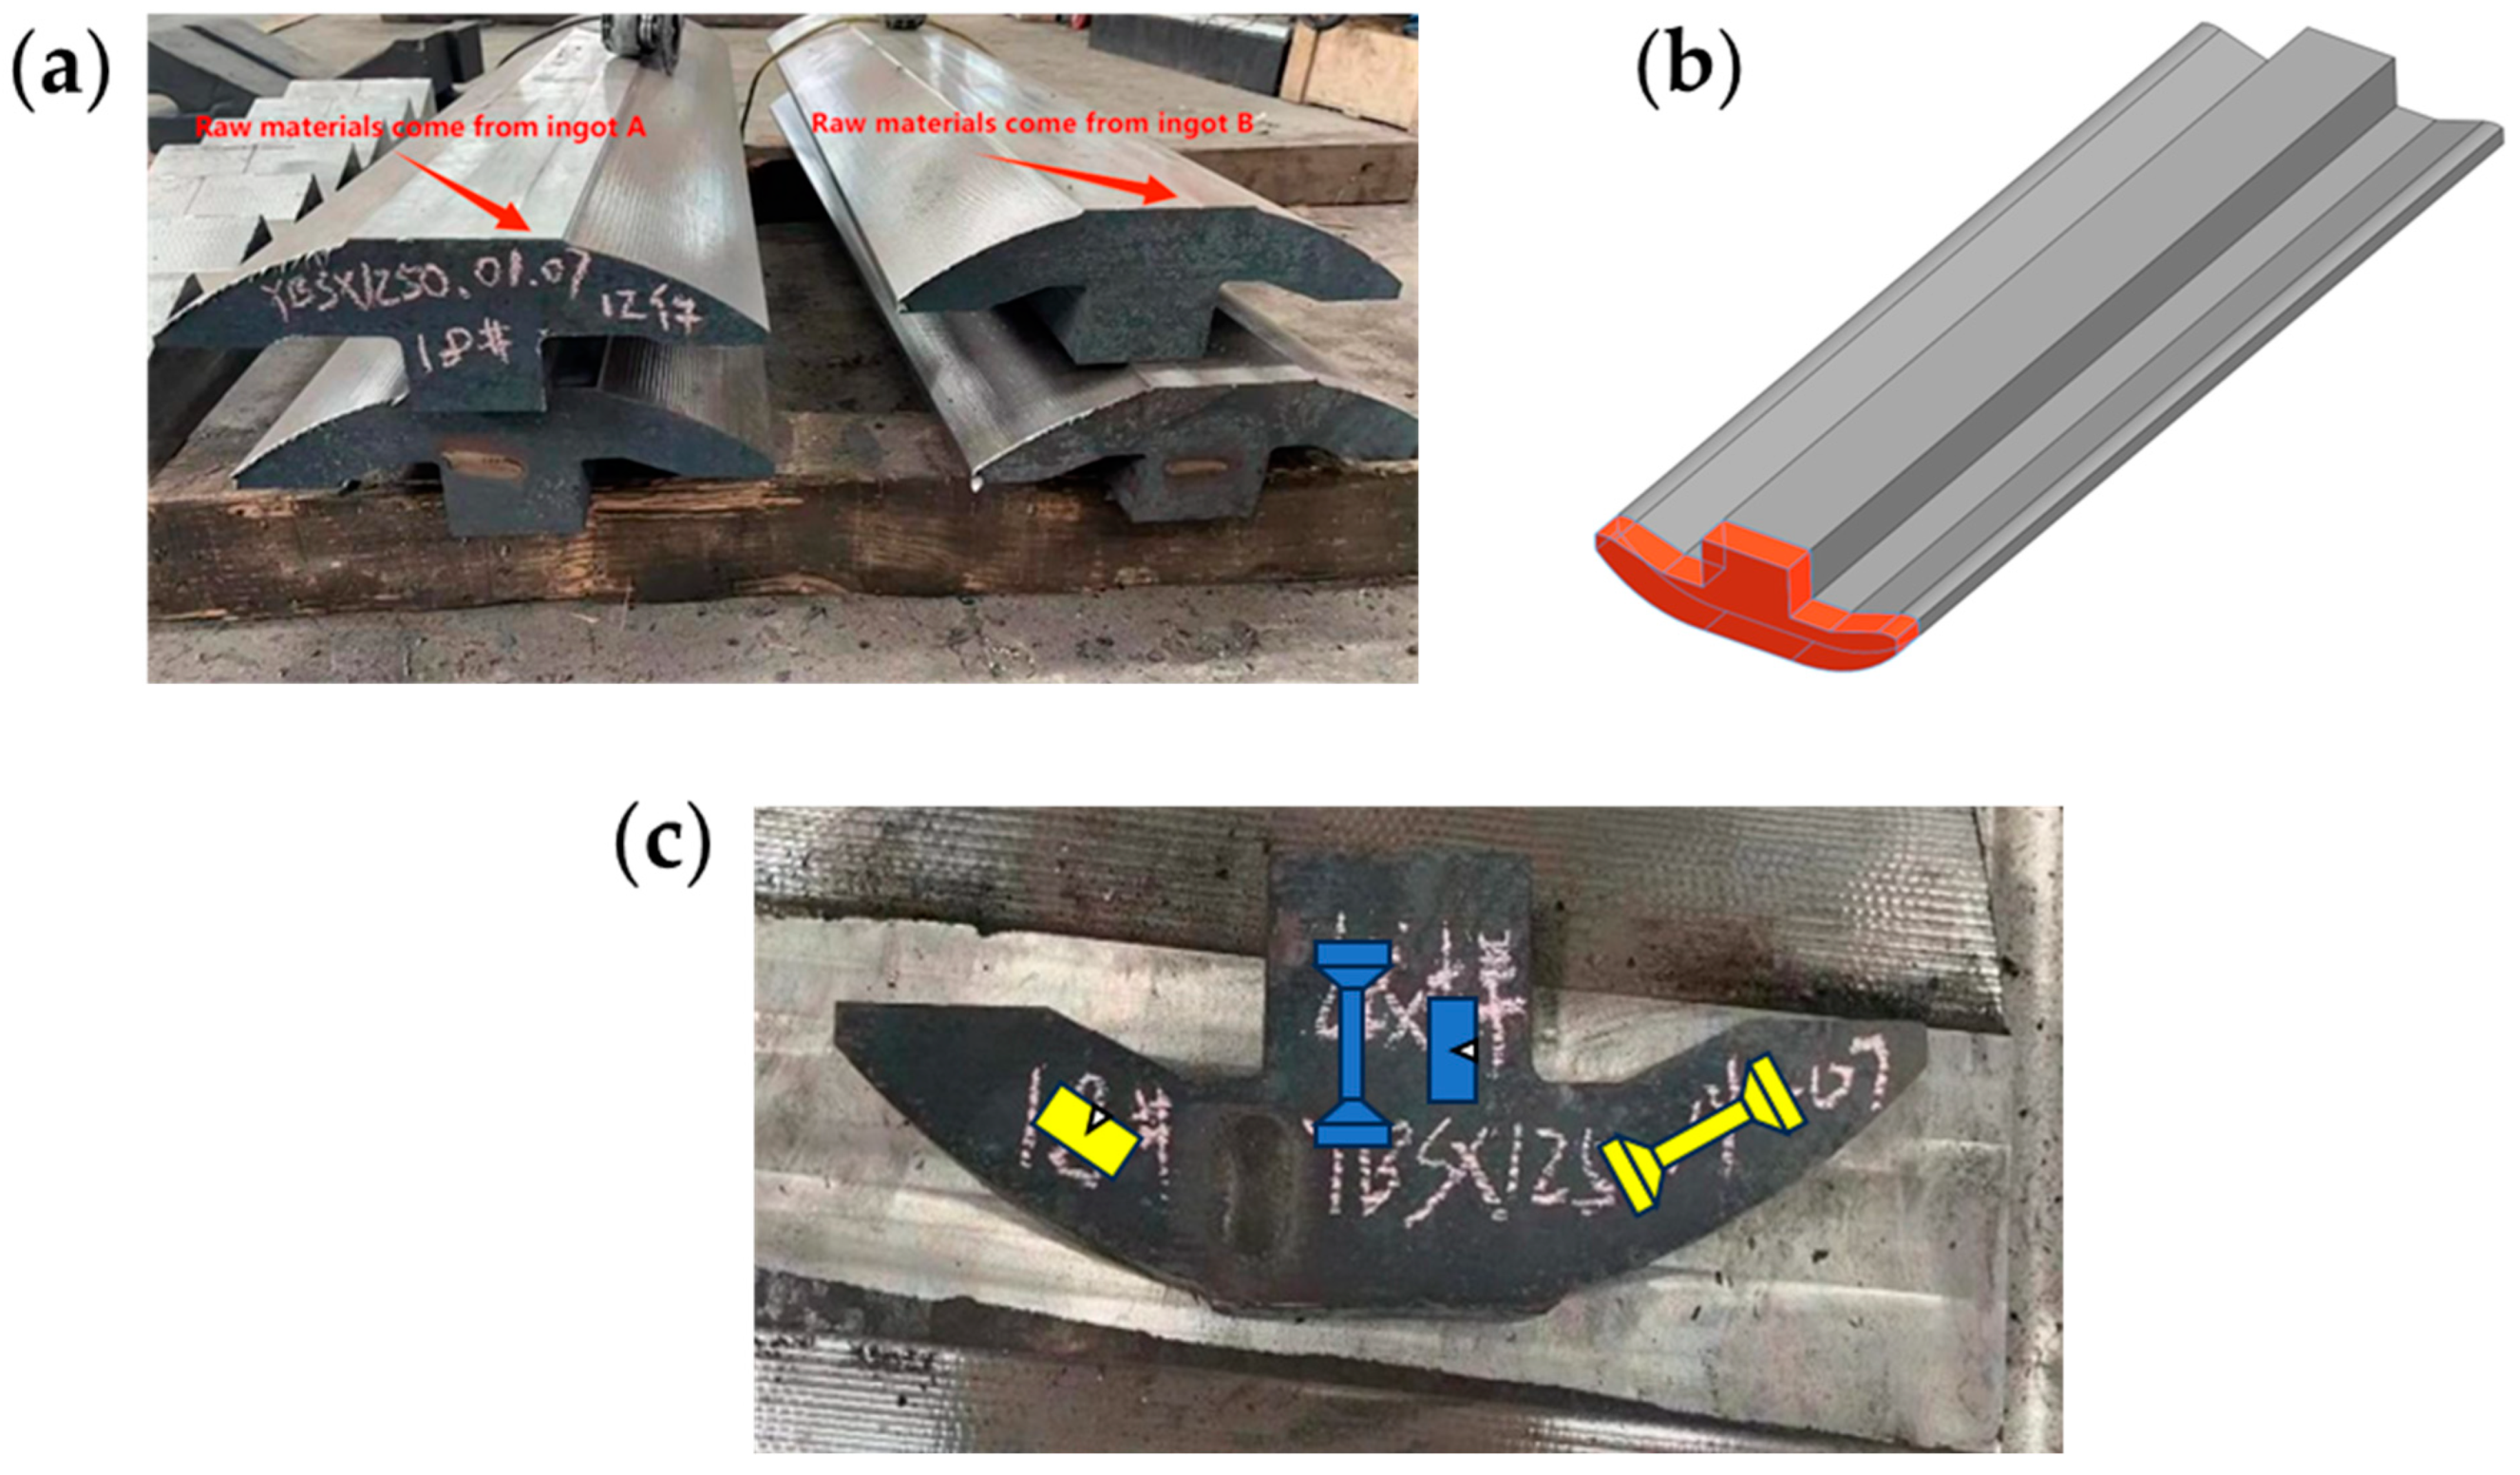
  • The mechanical performance analysis of rough processed products from ingots A and B indicates a slight increase in various properties in the impact and tensile strength specimens of Ingot B. The transverse position mechanical properties are significantly improved, with tensile strength increased by 41 MPa and yield strength increased by 46 MPa.
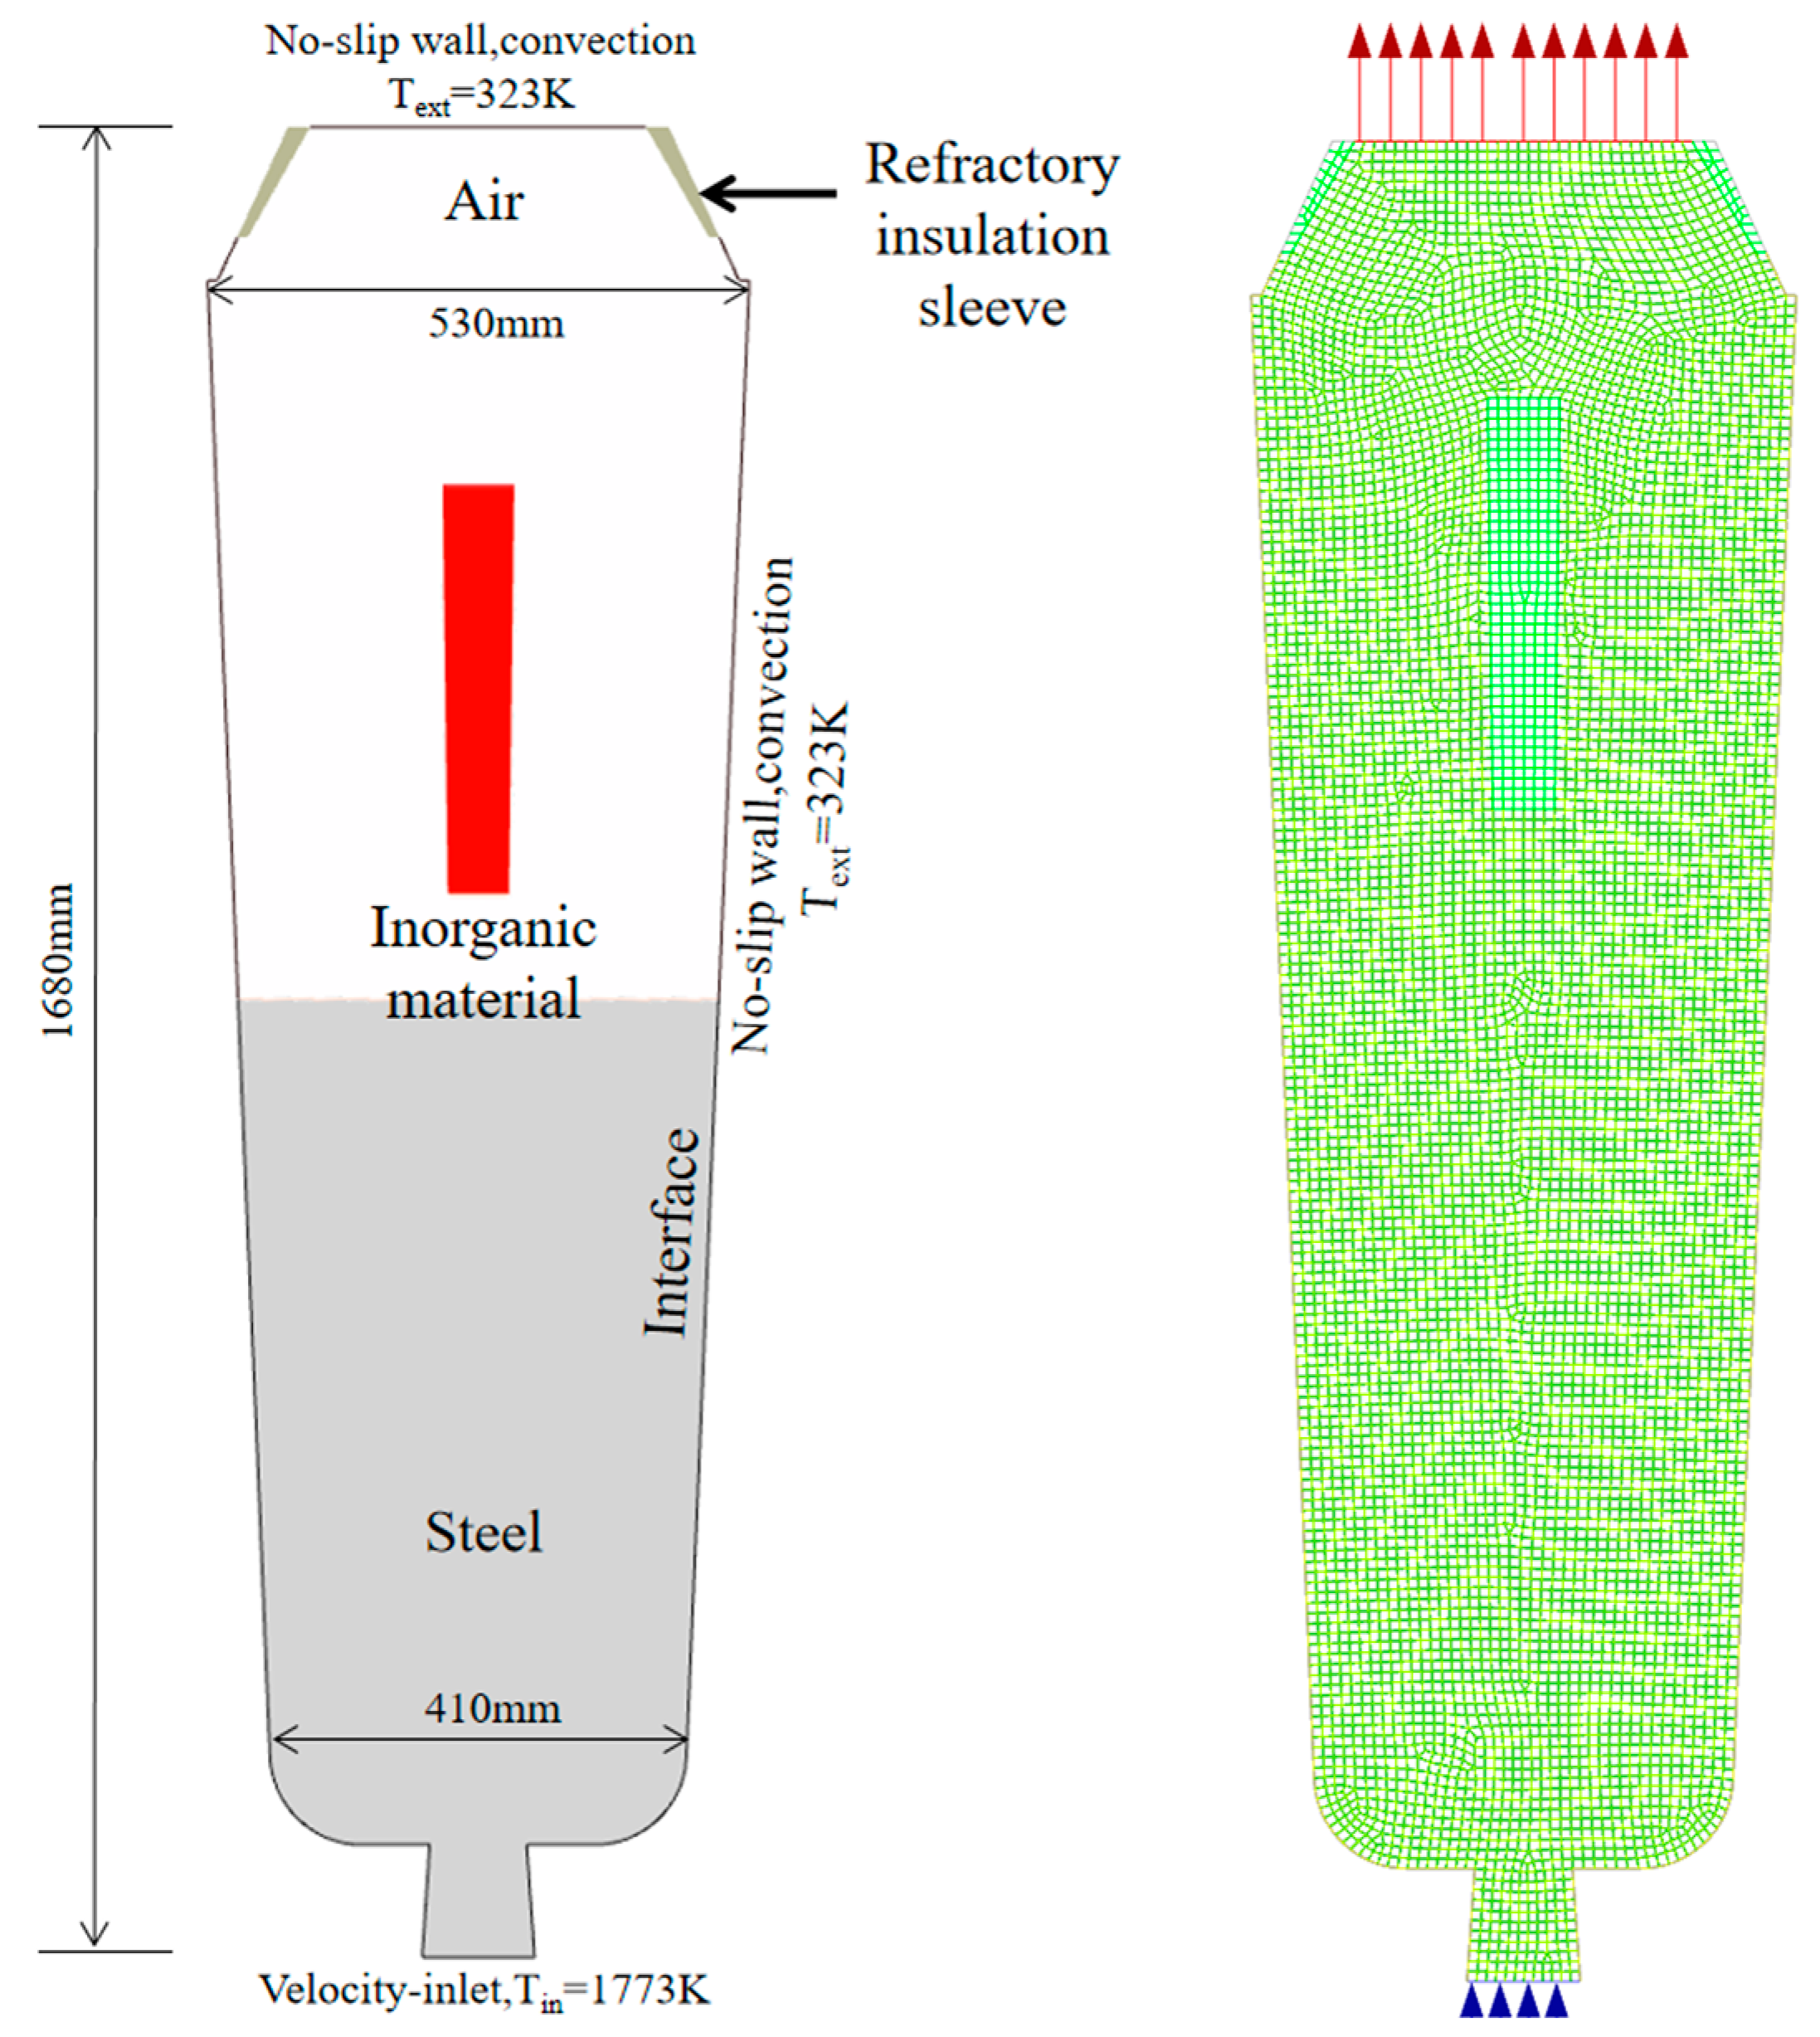
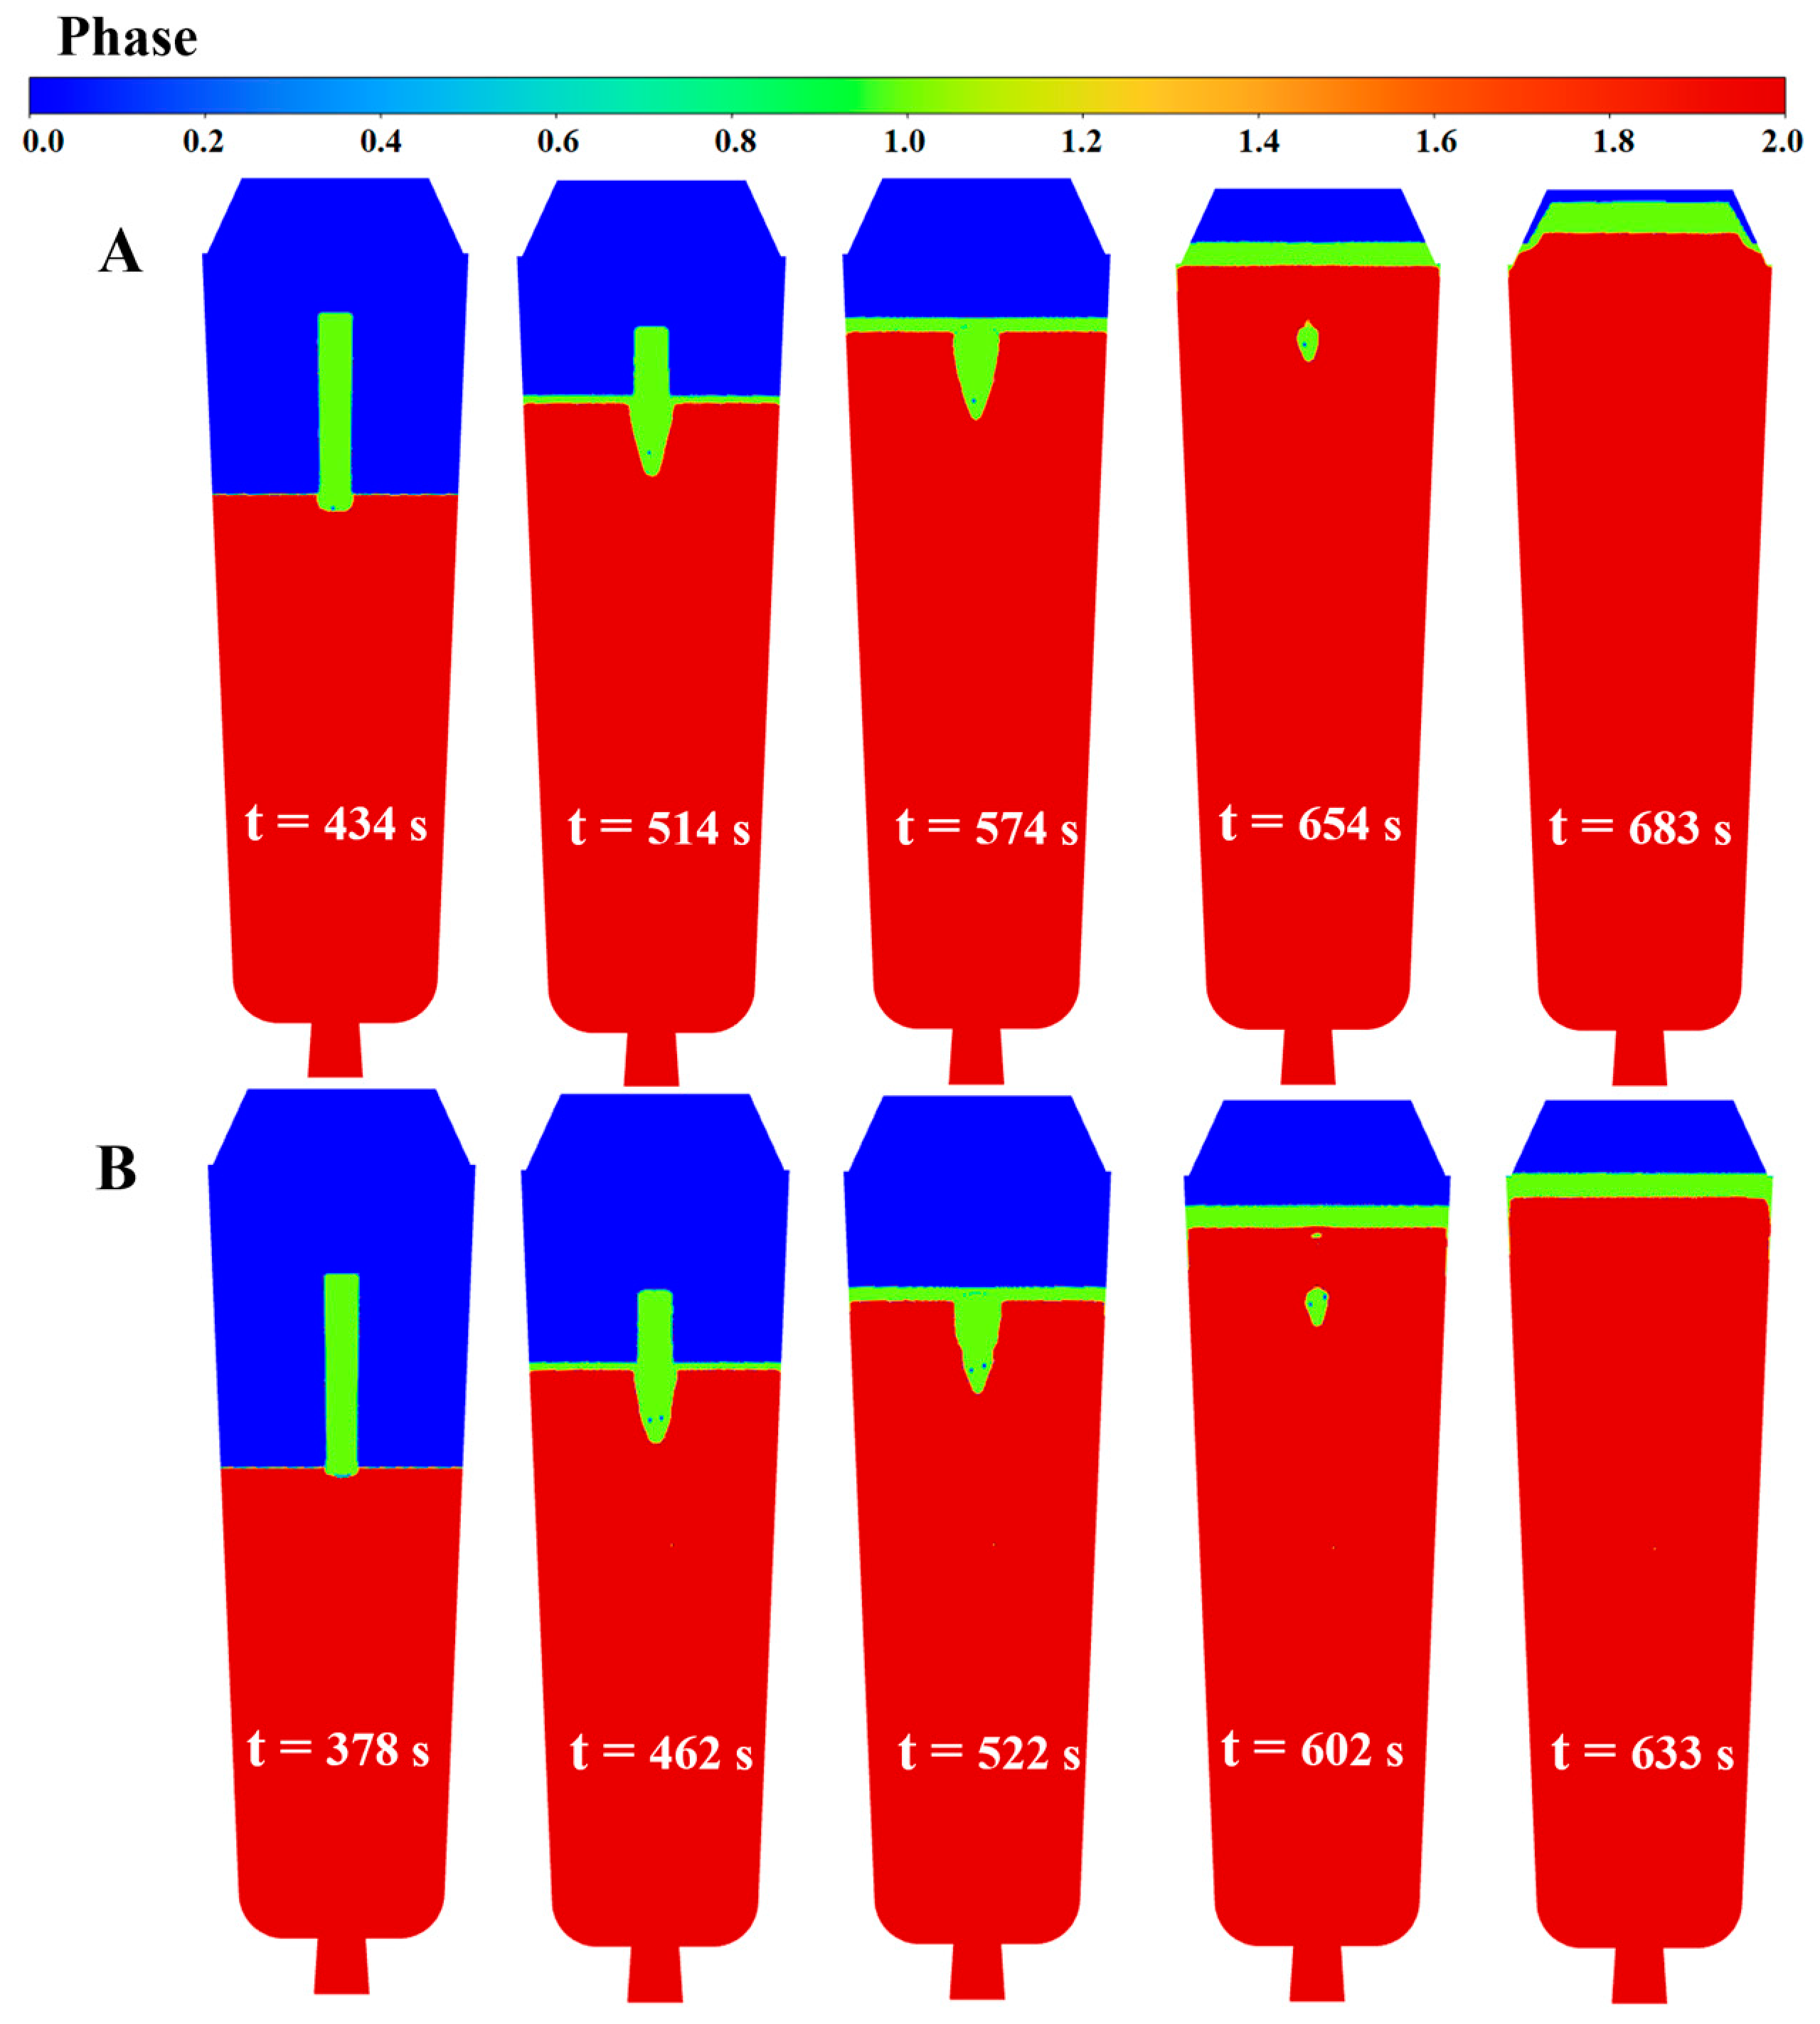
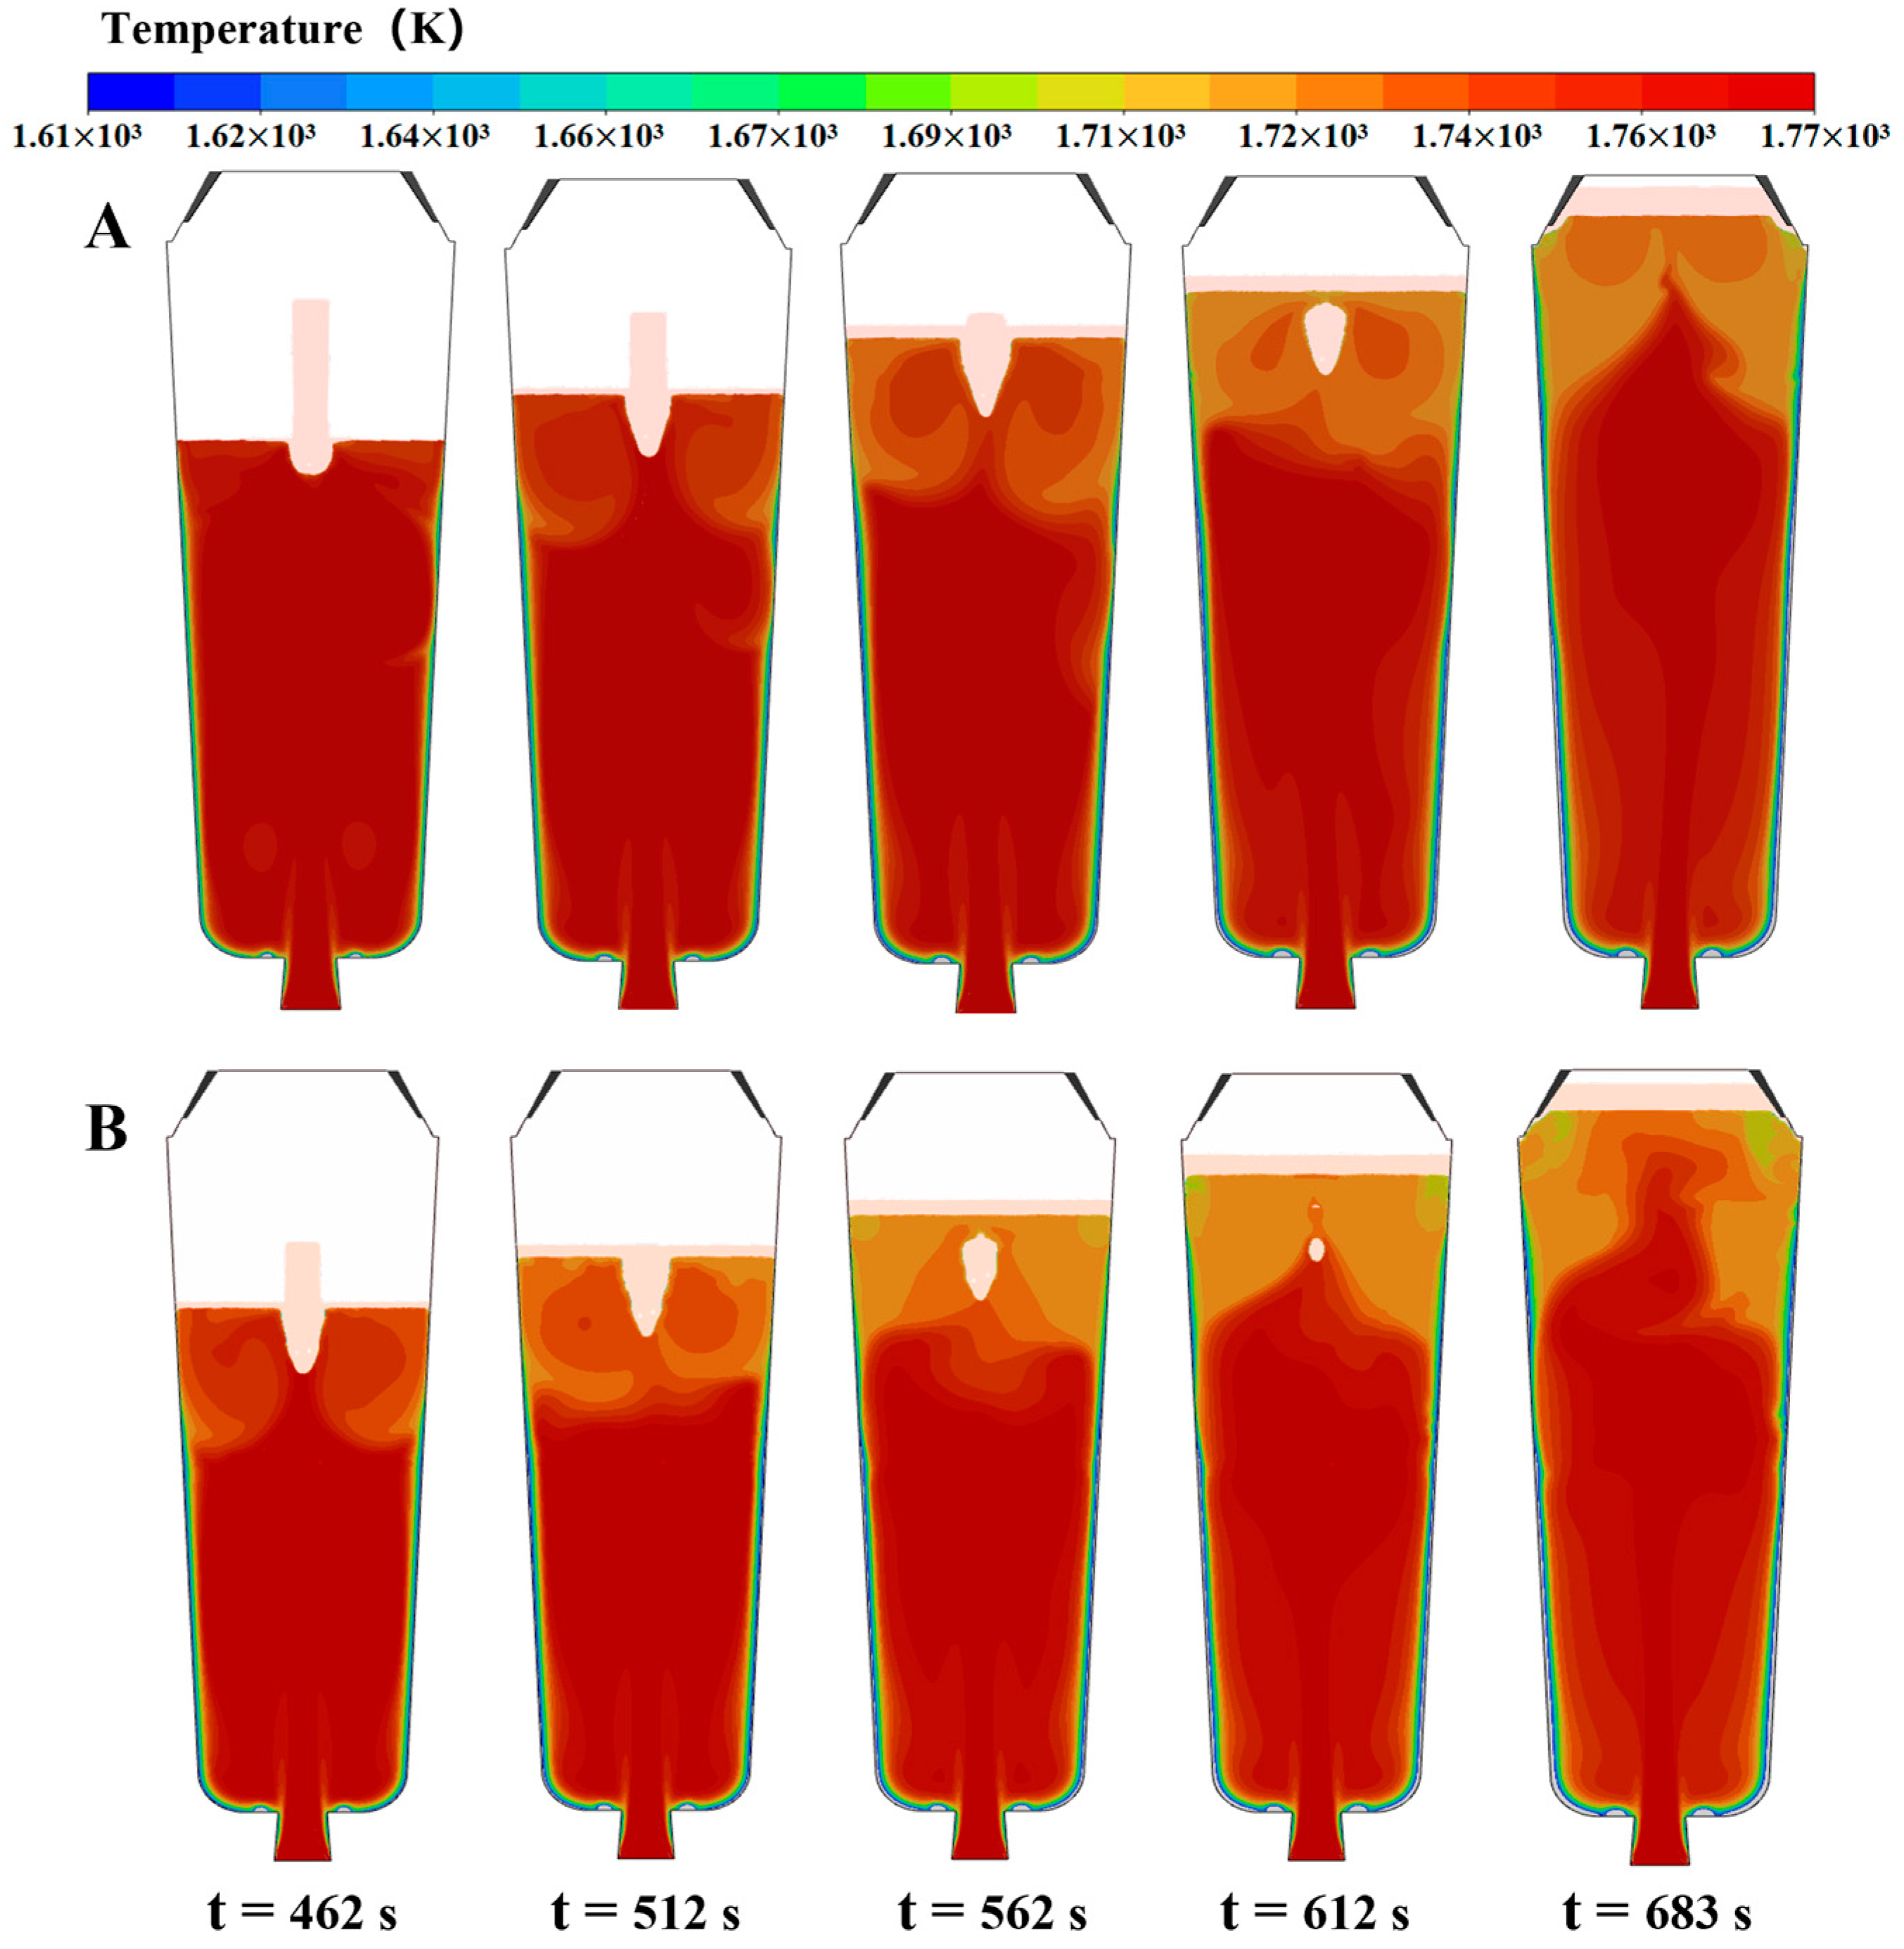
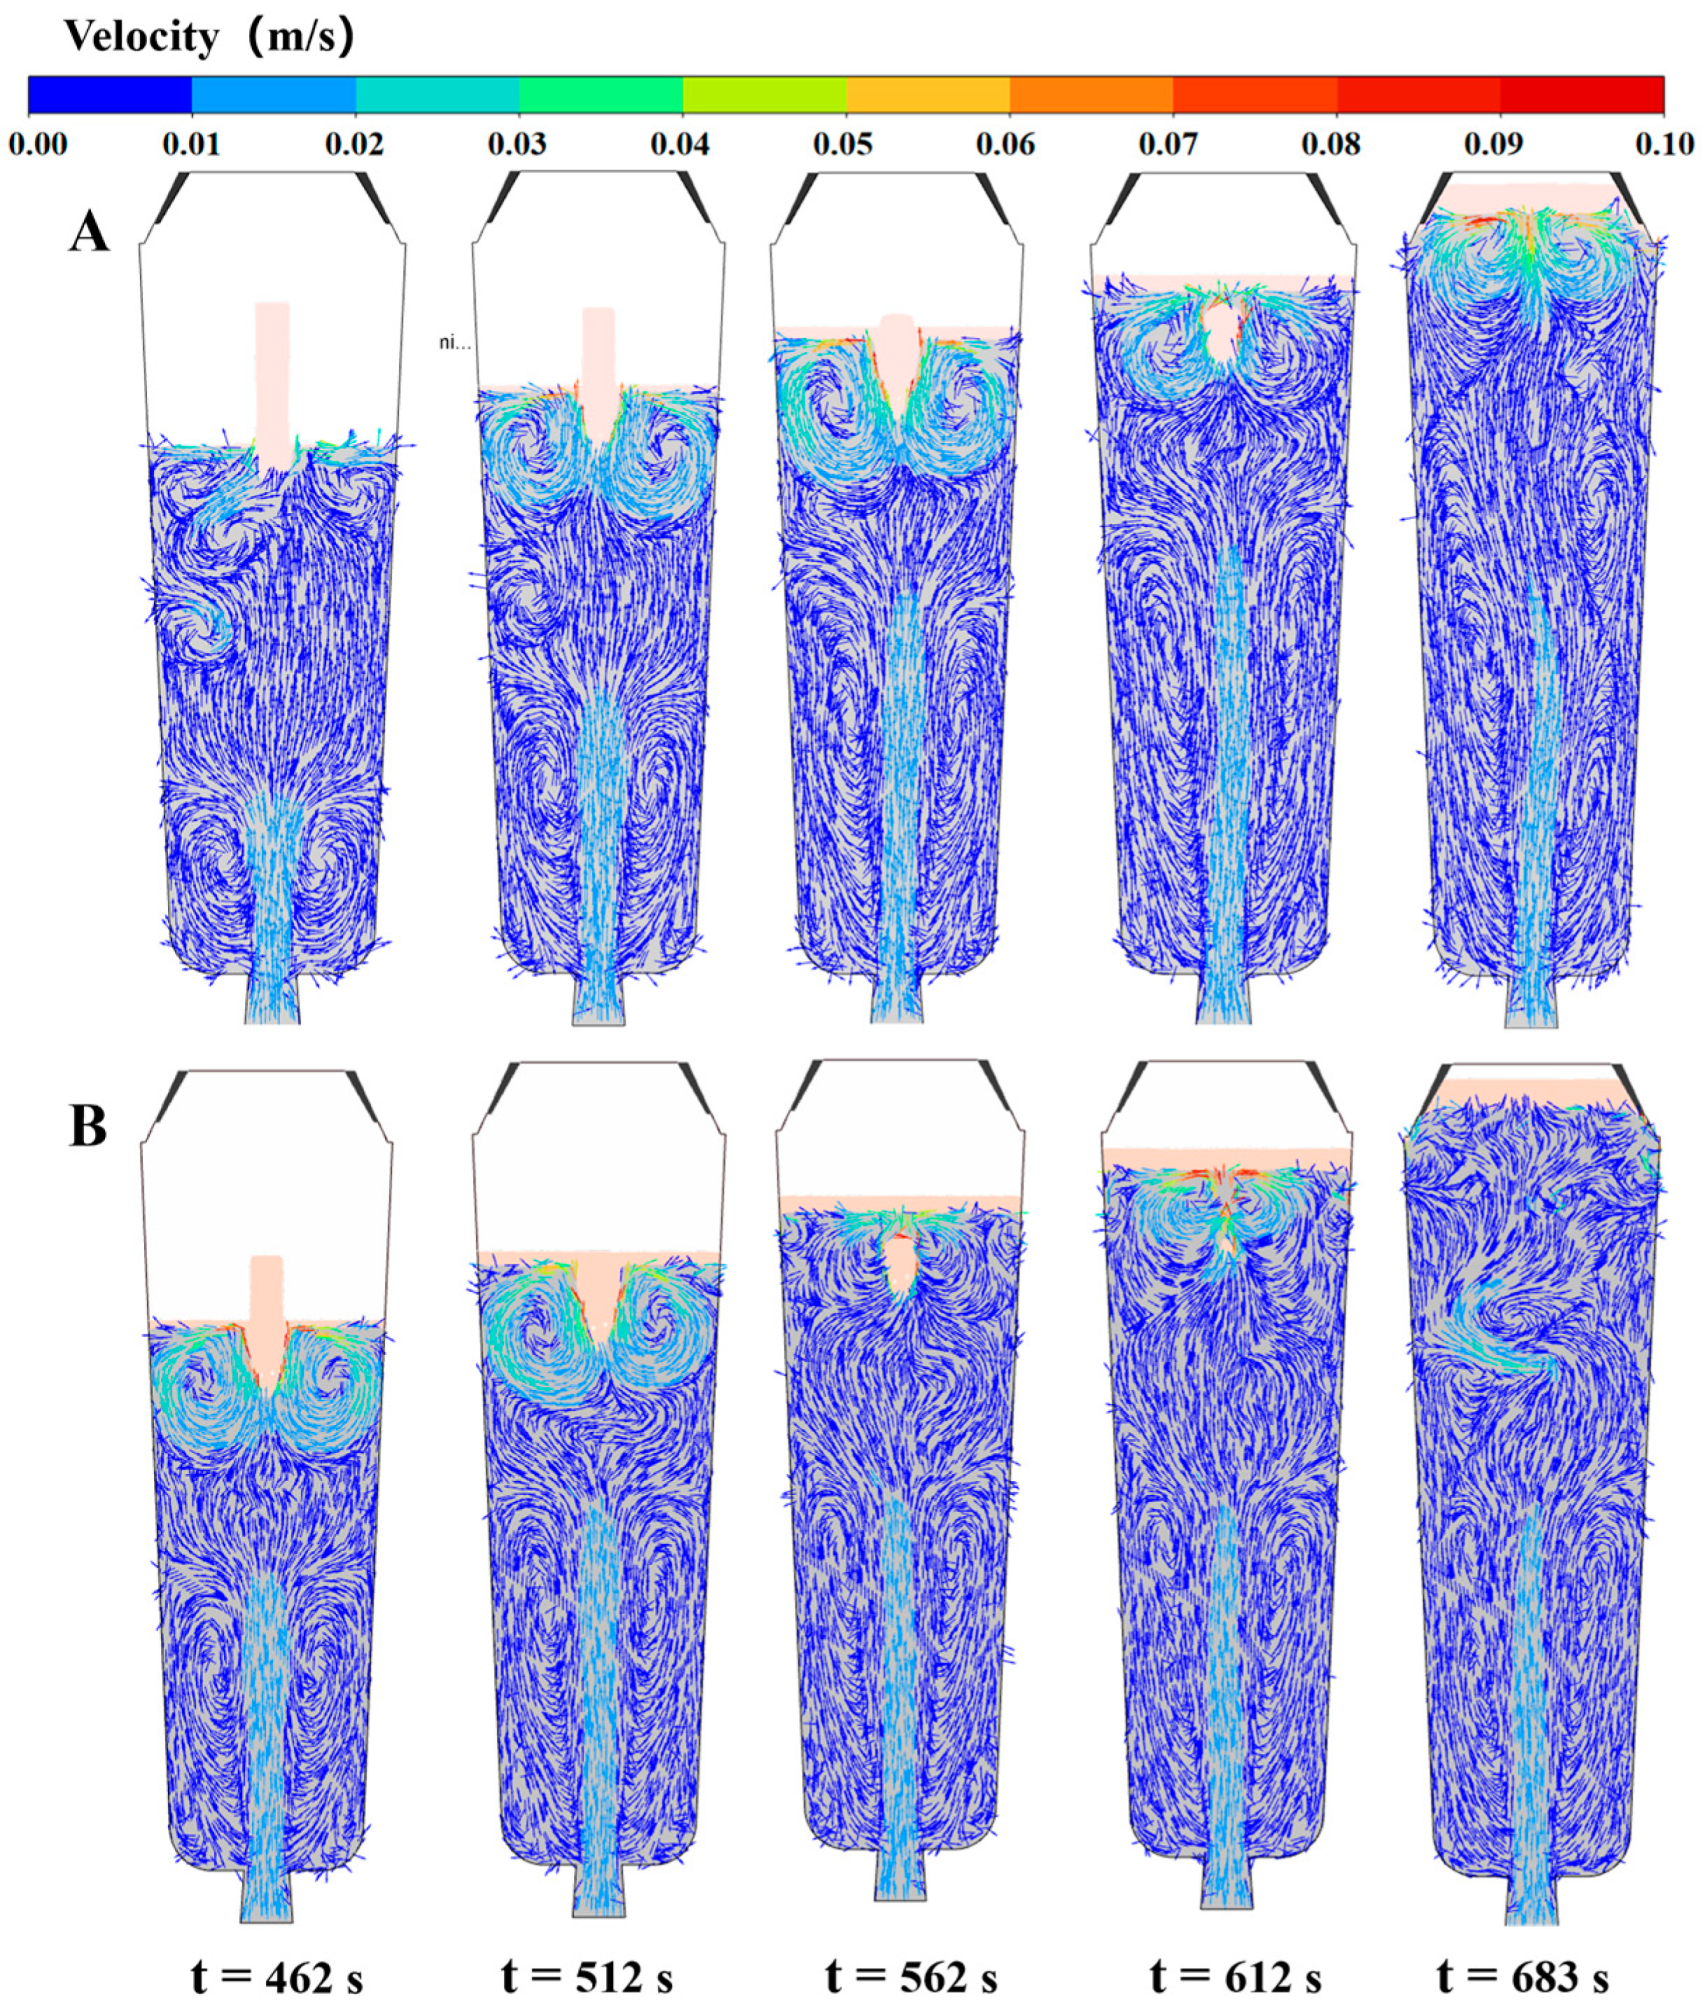
  • The simulation results reveal a series of coupling effects generated by the inorganic material internal heat absorption technology during the solidification of the ingot, specifically including an increase in temperature gradient and the induction of forced convection. When the placement depth of the inorganic materials within the ingot mold is increased, the cooling effect becomes more significant, the flow area of molten steel induced by the inorganic materials expands, and the linear velocity of the double-circle flow increases. This further explains why the solidification quality of the ingot improves with an increase in the placement depth of the inorganic materials.

Author Contributions

Conceptualization, D.J. and Z.R.; methodology, D.J. and S.X.; software, Y.D.; validation, Y.D.; formal analysis, S.S.; resources, Z.Z.; data curation, S.S.; writing—original draft, S.S.; writing—review and editing, S.S., Y.D., Z.Z., D.J. and Z.R.; visualization, S.S.; supervision, Z.Z., D.J. and S.X.; project administration, Z.R.; funding acquisition, Z.R. All authors have read and agreed to the published version of the manuscript.

Funding

This work was supported by the Shanghai Municipal Commission of Economy and Informatization (No. GYQJ-2022-2-02).

Data Availability Statement

The data presented in this study are available on request from the corresponding author. The data are not publicly available due to privacy.

Conflicts of Interest

The authors declare no conflicts of interest.

References

  1. Zhang, W.F.; Zhang, Y.L.; Cheng, G.G.; Wang, G.B.; Qiao, T.; Shi, R.X. Formation mechanism of inspection defects in hundred-ton class 55NiCrMoV7 die steel forging. Ironmak. Steelmak. 2024, 51, 316–327. [Google Scholar] [CrossRef]
  2. Liu, X.; Zhang, C.; Hu, S.; Zhang, L.; Wang, H. Research progress and prospects on the formation mechanism of macrosegregation and shrinkage porosity in large steel ingots. Prog. Nat. Sci. Mater. Int. 2024, in press. [CrossRef]
  3. Cao, Y.F.; Liu, H.W.; Fu, P.X.; Chen, Y.; Chen, Z.Z.; Miao, Y.Y.; Liu, H.H.; Sun, C.; Li, D.Z. Distinct Mechanisms for Channel Segregation in Ultra-Heavy Advanced Steel Ingots Numerical Simulation and Experimental Characterization. Metall. Mater. Trans. B 2023, 54, 2771–2783. [Google Scholar] [CrossRef]
  4. Lesoult, G. Macrosegregation in steel strands and ingots: Characterisation, formation and consequences. Mater. Sci. Eng. A 2005, 413–414, 19–29. [Google Scholar] [CrossRef]
  5. Pickering, E.J.; Chesman, C.; Al-Bermani, S.; Holland, M.; Davies, P.; Talamantes-Silva, J. A Comprehensive Case Study of Macrosegregation in a Steel Ingot. Metall. Mater. Trans. B 2015, 46, 1860–1874. [Google Scholar] [CrossRef]
  6. Wang, T.; Wang, E.; Delannoy, Y.; Fautrelle, Y.; Budenkova, O. Numerical Simulation of Macrosegregation Formation in a 2.45 ton Steel Ingot Using a Three-Phase Equiaxed Solidification Model. Metals 2021, 11, 262. [Google Scholar] [CrossRef]
  7. Flemings, M.C. Our Understanding of Macrosegregation. Past and Present. ISIJ Int. 2000, 40, 833–841. [Google Scholar] [CrossRef]
  8. Nishimura, T.; Kishimoto, A.; Tani, K.; Saito, T. Development of 3D Macrosegregation Analysis Technique for a 19-Ton Steel Ingot with Complex Shape. Int. J. Met. 2023, 17, 2958–2968. [Google Scholar] [CrossRef]
  9. He, Z.Y.; Zhu, H.C.; Li, H.B.; Ni, Z.W.; Luo, H.X.; Feng, H.; Zhang, S.C.; Jiang, Z.H. Carbon Macrosegregation Pattern in 30Cr15Mo1N Ingot: Impact of Pouring Rate. Steel Res. Int. 2024, 2300908. [Google Scholar] [CrossRef]
  10. Ghodrati, N.; Champliaud, H.; Morin, J.B.; Jahazi, M. Influence of the Hot-Top Thermal Regime on the Severity and Extent of Macrosegregation in Large-Size Steel Ingots. J. Manuf. Mater. Process. 2024, 8, 74. [Google Scholar] [CrossRef]
  11. Tanaka, Y.; Sato, I. Development of high purity large forgings for nuclear power plants. J. Nucl. Mater. 2011, 417, 854–859. [Google Scholar] [CrossRef]
  12. Tu, W.T.; Shen, H.F.; Liu, B.C. Modelling of macrosegregation in a 231-ton steel ingot with multi-pouring process. Mater. Res. Innov. 2015, 19, S59–S63. [Google Scholar] [CrossRef]
  13. Ren, F.; Li, J.; Ge, H.; Cai, D.; Hu, Q.; Li, J. A comprehensive study of layer casting process by a four-phase filling-solidification model. J. Mater. Process. Technol. 2020, 284, 116737. [Google Scholar] [CrossRef]
  14. Wang, Y.; Guo, Q.; Ren, N.; Zhang, W.; Hu, S.; Zhang, Y.; Li, J.; Xia, M.; Li, J. Experimental and simulation studies of layer casting on industrial-scale Al-4.5 wt Pct Cu ingot: Effect, defect, and optimization. J. Mater. Process. Technol. 2023, 322, 118205. [Google Scholar] [CrossRef]
  15. Isayev, O.; Hress, O.; Hu, C.Y.; Xin, R.; Wu, K.M. The Development of Steel Band Feeding for HSLA Heavy Plates. Metallurgist 2016, 59, 1238–1243. [Google Scholar] [CrossRef]
  16. Yao, Y.; Liu, Z.; Li, B.; Xiao, L.; Gan, Y. Effect of steel strip feeding on the columnar-equiaxed solidification in a large continuous casting round bloom. J. Mater. Res. Technol. 2022, 20, 1770–1785. [Google Scholar] [CrossRef]
  17. Niu, R.; Li, B.-k.; Liu, Z.-q.; Li, X.-l. Effect of strip feeding into mold on fluid flow and heat transfer in continuous casting process. J. Iron Steel Res. Int. 2020, 27, 295–309. [Google Scholar] [CrossRef]
  18. Sang, B.; Kang, X.; Li, D. A novel technique for reducing macrosegregation in heavy steel ingots. J. Mater. Process. Technol. 2010, 210, 703–711. [Google Scholar] [CrossRef]
  19. Lai, J.-h.; Yu, S.; Xu, Y.-j.; Jiang, D.-q.; Shuai, S.-s.; Wang, J.; Ren, Z.-m. Melting and floating processes of inorganic materials in molten steel: Visualization physical simulation and mathematical modelling. China Foundry 2023, 20, 89–98. [Google Scholar] [CrossRef]
  20. Xu, Y.; Wang, J.; Shuai, S.; Yu, S.; Jiang, D.; Chen, C.; Hu, T.; Ren, Z. Improving microstructure and segregation of steel ingot by inorganic heat absorption method. Mater. Sci. Technol. 2023, 39, 2544–2555. [Google Scholar] [CrossRef]
  21. Yu, S.; Zhu, L.; Lai, J.; Pan, M.; Liu, Y.; Xuan, W.; Wang, J.; Li, C.; Ren, Z. Application of heat absorption method to reduce macrosegregation during solidification of bearing steel ingot. J. Iron Steel Res. Int. 2022, 29, 1915–1926. [Google Scholar] [CrossRef]
  22. Strickland, J.; Nenchev, B.; Dong, H. On Directional Dendritic Growth and Primary Spacing—A Review. Crystals 2020, 10, 627. [Google Scholar] [CrossRef]
  23. Kim, H.S.; Kobayashi, Y.; Tsukamoto, S.; Nagai, K. Effect of cooling rate on microstructure evolution of rapidly cooled high-impurity steels. Mater. Sci. Eng. A 2005, 403, 311–317. [Google Scholar] [CrossRef]
  24. Vandersluis, E.; Ravindran, C. Comparison of Measurement Methods for Secondary Dendrite Arm Spacing. Metallogr. Microstruct. Anal. 2017, 6, 89–94. [Google Scholar] [CrossRef]
  25. Jung, I.-H.; Decterov, S.A.; Pelton, A.D. Critical Thermodynamic Evaluation and Optimization of the MgO-Al2O3 CaO-MgO-Al2O3, and MgO-Al2O3-SiO2 Systems. J. Phase Equilibria Diffus. 2004, 25, 329–345. [Google Scholar] [CrossRef]
  26. Engh, T.A.; Sigworth, G.K.; Kvithyld, A.; Engh, T.A.; Sigworth, G.K.; Kvithyld, A. Principles of Metal Refining and Recycling; Oxford University Press: Oxford, UK, 2021; pp. 303–364. [Google Scholar]
  27. Petch, N.J. The Cleavage Strength of Polycrystals. J. Iron Steel Inst. 1953, 174, 25–28. [Google Scholar]
  28. Hall, E.O. The Deformation and Ageing of Mild Steel: III Discussion of Results. Proc. Phys. Soc. Lond. 1951, B64, 747. [Google Scholar] [CrossRef]
Figure 1. (a) Casting mold schematic illustration employing inorganic material internal heat absorption technology; (b) the on-site mold arrangement before casting.
Metals 14 00753 g001
Figure 2. Schematic diagram of steel ingot sectional sampling. (a) The sawing machine cuts longitudinally along half of the surface; (b) a 35 mm thick slice is obtained; (c) milling and grinding treatment is applied; (d) the riser and the lower half of the ingot slice is discarded.
Metals 14 00753 g002
Figure 3. Physical diagram of sampling locations. Left side: Drilling for steel chips used for carbon element content determination. Right side: Five specimens are taken at three different heights for metallographic observation.
Metals 14 00753 g003
Figure 4. (a) The rough-machined finished product of the fan blade; (b) 35 mm thick partial test specimen cut from the rough-machined product; (c) schematic diagram of sampling positions for mechanical performance testing specimens. Blue: radial tensile and impact specimens; yellow: transverse tensile and impact specimens.
Metals 14 00753 g004
Figure 5. Geometric model and boundary conditions of steel ingot. Text—external temperature; Tin—inlet temperature.
Metals 14 00753 g005
Figure 6. (a) The hot acid etched results of the dissected specimen from Ingot A; (b) the hot acid etched results of the dissected specimen from Ingot B.
Metals 14 00753 g006
Figure 7. (a) Carbon segregation cloud map of the left half of Ingot A; (b) carbon segregation cloud map of the left half of Ingot B.
Metals 14 00753 g007
Figure 8. Carbon segregation in the vertical direction: (a) along the central axis, from the bottom toward the top at a 350 mm distance below the riser; (b) along the vertical line at the half-radius position, from the bottom toward the top.
Metals 14 00753 g008
Figure 9. (a) Top metallography of ingots A and B; (b) middle metallography of ingots A and B; (c) bottom metallography of ingots A and B.
Metals 14 00753 g009
Figure 10. SDAS of columnar crystal zone at different positions of the sample.
Metals 14 00753 g010
Figure 11. Graph depicting the quantity of inclusions based on size.
Metals 14 00753 g011
Figure 12. The distribution of inclusion components: (a) sample from Ingot A; (b) sample from Ingot B.
Metals 14 00753 g012
Figure 13. Variation in volume fraction of inorganic materials over time. (A): Insertion depth of 100 mm; (B): insertion depth of 200 mm.
Metals 14 00753 g013
Figure 14. The variation in temperature field over time. (A): Insertion depth of 100 mm; (B): insertion depth of 200 mm.
Metals 14 00753 g014
Figure 15. Variation in velocity vectors of liquid steel with time. (A): Insertion depth of 100 mm; (B): insertion depth of 200 mm.
Metals 14 00753 g015
Table 1. Chemical composition of the 42CrMo steel (wt.%).
CSiMnPSCrMoFe
0.410.220.630.0680.0091.100.18Balance
Table 2. The results of the impact performance testing.
PositionKV2
J
Transverse Direction of A66.6
Transverse Direction of B71.9
Radial Direction of A70.9
Radial Direction of B75.8
Table 3. Tensile performance test results.
PositionRm
MPa
Rp0.2
MPa
A
%
Z
%
Transverse
Direction of A
1116101713.553
Transverse
Direction of B
1157106315.558
Radial Direction
of A
101592716.243
Radial Direction
of B
102895918.549
Disclaimer/Publisher’s Note: The statements, opinions and data contained in all publications are solely those of the individual author(s) and contributor(s) and not of MDPI and/or the editor(s). MDPI and/or the editor(s) disclaim responsibility for any injury to people or property resulting from any ideas, methods, instructions or products referred to in the content.

