Article

Microstructure Image Segmentation of 23crni3mo Steel Carburized Layer Based on a Deep Neural Network

1
College of Big Data and Information Engineering, Guizhou University, Guiyang 550025, China
2
Guizhou Xishan Technology Co., Ltd., Guiyang 550025, China
3
School of Materials and Architectural Engineering, Guizhou Normal University, Guiyang 550025, China
*
Author to whom correspondence should be addressed.
Metals 2024, 14(7), 761; https://doi.org/10.3390/met14070761
Submission received: 22 May 2024 / Revised: 14 June 2024 / Accepted: 23 June 2024 / Published: 27 June 2024

Abstract

:
This paper identifies and analyzes the microstructure of a carburized layer by using a deep convolutional neural network, selecting different carburizing processes to conduct surface treatment on 23CrNi3Mo steel, collecting many metallographic pictures of the carburized layer based on laser confocal microscopy, and building a microstructure dataset (MCLD) database for training and testing. Five algorithms—a full convolutional network (FCN), U-Net, DeepLabv3+, pyramid scene parsing network (PSPNet), and image cascade network (ICNet)—are used to segment the self-built microstructural dataset (MCLD). By comparing the five deep learning algorithms, a neural network model suitable for the MCLD database is identified and optimized. The research results achieve recognition, segmentation, and statistic verification of metallographic microstructure images through a deep convolutional neural network. This approach can replace the high cost and complicated process of experimental testing of retained austenite and martensite. This new method is provided to identify and calculate the content of residual austenite and martensite in the carburized layer of low-carbon steel, which lays a theoretical foundation for optimizing the carburizing process.

1. Introduction

Because the mechanical properties of steel are usually determined by its internal structure, precise identification of the microstructure content of the carburized layer is crucial for assessing the mechanical properties under different carburizing processes [1,2,3,4]. Traditional methods such as X-ray diffraction (XRD) [5,6] and electron backscatter diffraction (EBSD) [7,8] are commonly used for identifying and statistically analyzing the microstructure of carburized layers. However, traditional detection methods are plagued by complex sample preparation methods, cumbersome operation steps, and low efficiency. In recent years, deep convolutional neural networks have realized image recognition and segmentation by extracting and classifying image features. Therefore, it is important to segment the microstructure of the carburized layer accurately by using a deep convolutional neural network.
A deep convolutional neural network is a kind of mapping from feature space to target attributes. It does not need to consider internal complex transformation rules but is transformed into a set of trainable weights, which can theoretically approach any kind of nonlinear transformation [9,10]. Therefore, an increasing number of researchers use neural networks for image segmentation. For image segmentation in the metallurgical field, Masci et al. [11] used a convolutional neural network (CNN) to find defects in steel, laying the foundation for deep learning to identify microstructures. Subsequently, Bai Long et al. [12] used the support vector machine (SVM) method to extract the morphological features of cast iron. Azimi et al. [13] used a full convolutional neural network (FCNN) for the pixel-level segmentation of steel microstructures, which laid a foundation for the accurate segmentation of microstructures. Bulgarevich et al. [14] recognized the optical microscopic image of steel and automatically segmented the microstructure of steel based on a random forest statistical algorithm in machine learning. It can accurately identify the microstructure of steel and process a large amount of image data in a short period.
The different contents of martensite and retained austenite in the carburized layer have a great impact on the mechanical properties, so optimizing and accurately identifying martensite and retained austenite in the carburized layer is very important [15,16]. Shen et al. [17] used a combination of machine learning and genetic algorithms to identify the microstructure and designed a new type of high-strength stainless steel, verifying its excellent hardness through experiments. Datta et al. [18] used neural networks and multiobjective genetic algorithms to design high-strength multiphase steel with customized performance balance. Aristeidakis et al. [19] proposed an ICME method for alloy and process design based on thermodynamic and kinetic CALPHAD models, combined with multiobjective optimization techniques for a gradient algorithm and genetic algorithm, to develop manganese steel containing d-ferrite. Tang et al. [20] proposed an improved neural network for predicting the mechanical properties in the design and development of new magnesium alloys.
Therefore, based on a deep convolution neural network, this paper uses five algorithms—an FCN, U-Net, DeepLabv3+, PSPNet, and ICNet—to segment the metallographic picture of a carburized layer, select the neural network model with the best segmentation effect, optimize the neural network model, and calculate the percentage of residual austenite and martensite in the carburized layer. The contributions of this article can be summarized as follows:
(1)
Establish five high-precision neural network models, namely, an FCN, U-Net, DeepLabv3+, PSPNet, and ICNet, and train them on a self-built 23CrNi3Mo steel carburized layer microstructure dataset (MCLD) to determine the best neural network model for carburized layer microstructure segmentation.
(2)
Improve the segmentation accuracy of the deep neural network model for the microstructure of the carburized layer by optimizing the neural network model.

2. Experiment and Model Building

2.1. Experiment

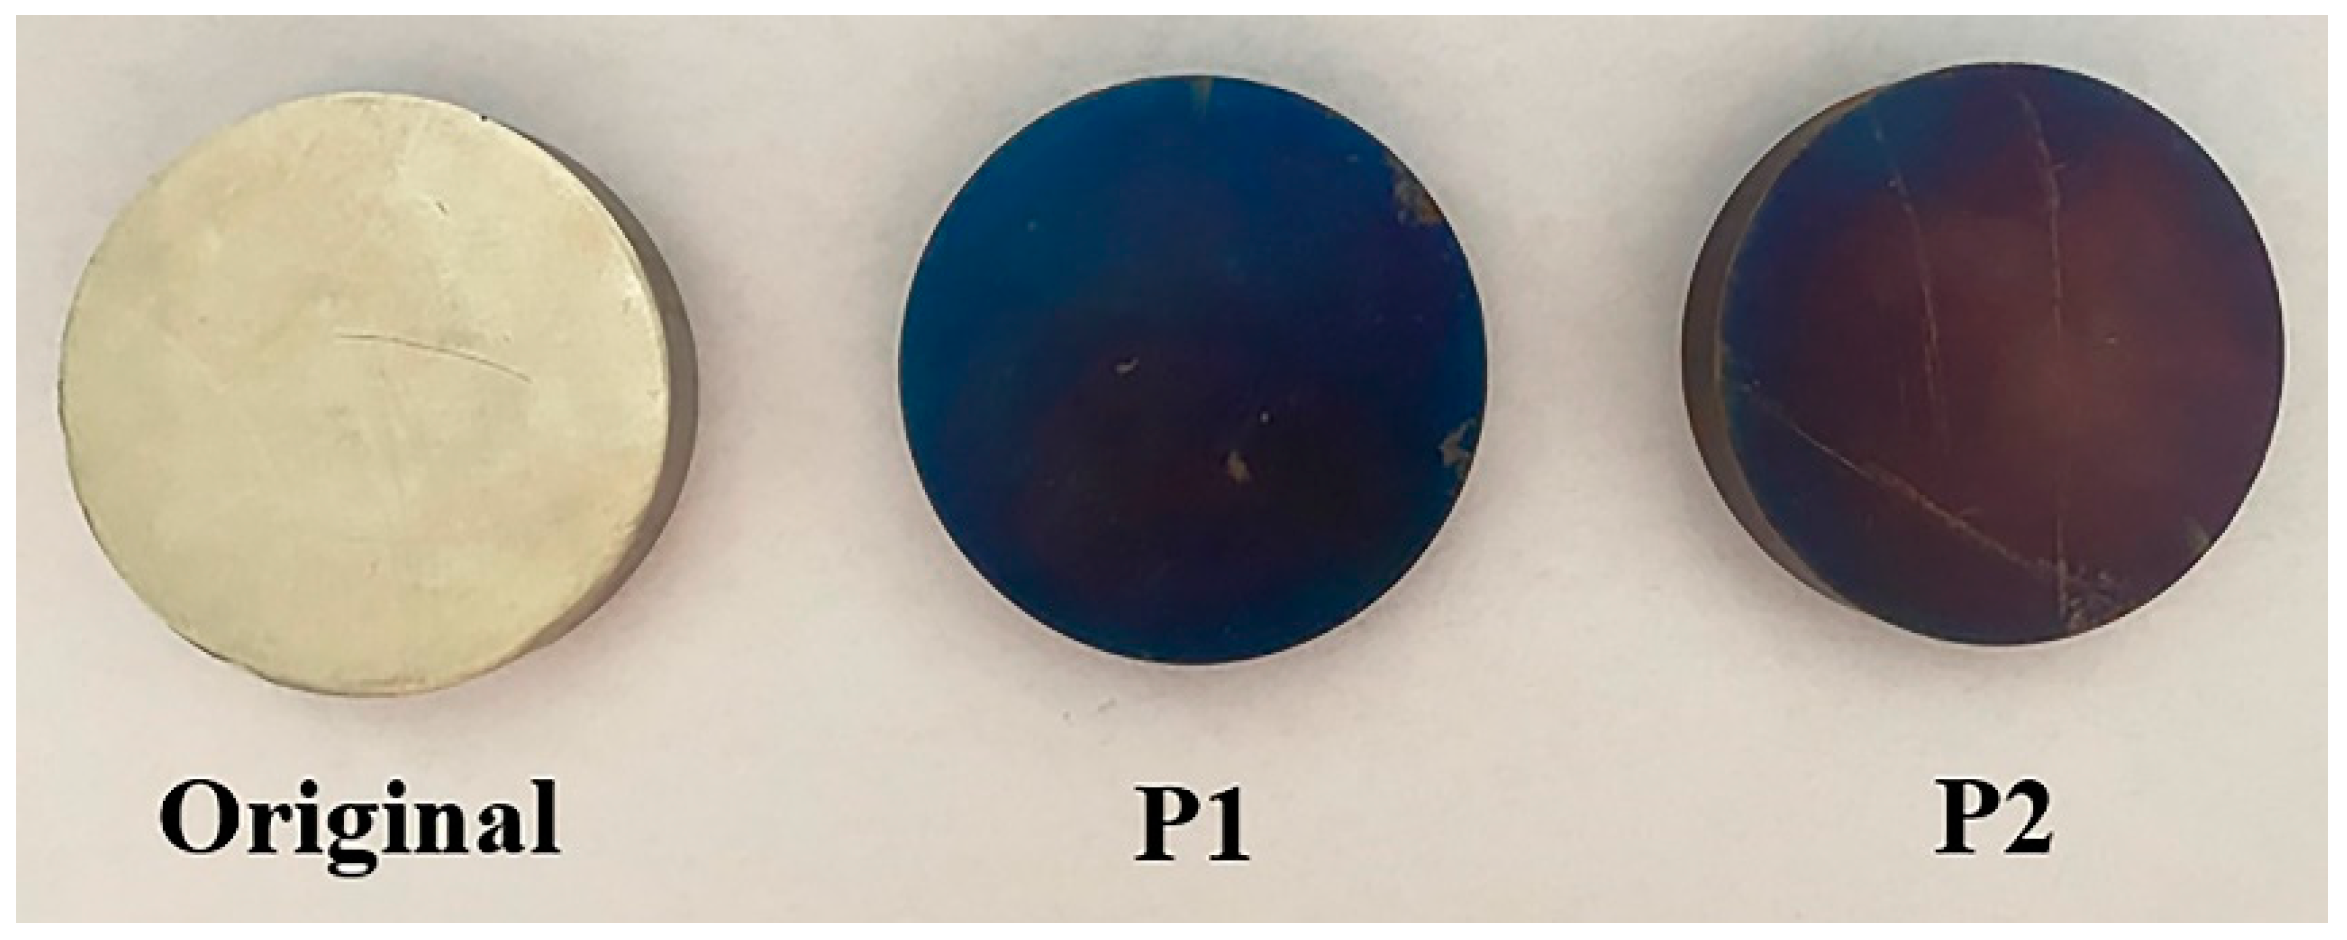
2.1.1. Heat Treatment Process

In the overall experiment, a deep convolutional neural network is used to identify and segment the microstructure of different carburized layers. First, 23CrNi3Mo (its chemical composition: 0.22% C, 0.66% Mn, 1.33% Cr, 2.90% Ni, 0.23% Mo, 0.026% Al, 0.0067% V) steel was selected as the experimental material. The sample was processed into a round rod with a diameter of 10 mm and a thickness of 100 mm for carburization and heat treatment experiments. Second, the total carburization time and the ratio of strong carburizing time to diffusion time were adjusted to obtain different carburizing layer structure gradients and carbon concentration gradients. Table 1 shows that P1 to P8 represent 8 carburizing processes. Finally, samples with different carburizing processes were prepared into cross-section OM samples by wire cutting, rough grinding, grinding, polishing, and other methods and then corroded with 4% nitric acid in alcohol. The microstructure morphology was observed under a confocal laser scanning microscope (CLSCM) as the primeval number. Figure 1 shows the comparison before and after carburization treatment.

2.1.2. Microstructure and Electron Back Scatter Diffraction (EBSD)

The production of microstructure images first used wire cutting to cut the cross-section of the carburized layer. Next, use water sandpaper to grind from coarse (400 #) to fine (5000 #), and gently polish with 1 μm polishing paste on a polishing machine. The final sample was cleaned and dried using 99.7% anhydrous ethanol in ultrasound. Observation of metallographic microstructure was carried out using 4% nitric acid and alcohol for light corrosion to display the microstructure morphology of the carburized layer. After washing and drying the sample, the microstructure was observed and photographed using a laser confocal microscope (LSCM, OLS5000, Hong Kong).
Electron back scatter diffraction (EBSD) production first uses argon ion technology to finely polish the sample and then uses field emission scanning electron microscopy (SEM, SUPRA40-41-90, (Zeiss, Jena, Germany) to observe the gradient structure of the carburized layer by EBSD. Use a high-energy electron beam of 20 kV to bombard the surface of the sample, with a working distance typically of 11 mm. The CCD camera obtains images through the lead glass screen connected to the fluorescent screen and transmits them to the terminal computer for processing. Identify and statistically analyze the phase distribution of the carburized layer using the matching software Channel5.0.

2.2. Construction of a Microstructure Segmentation Model of a Carburized Layer

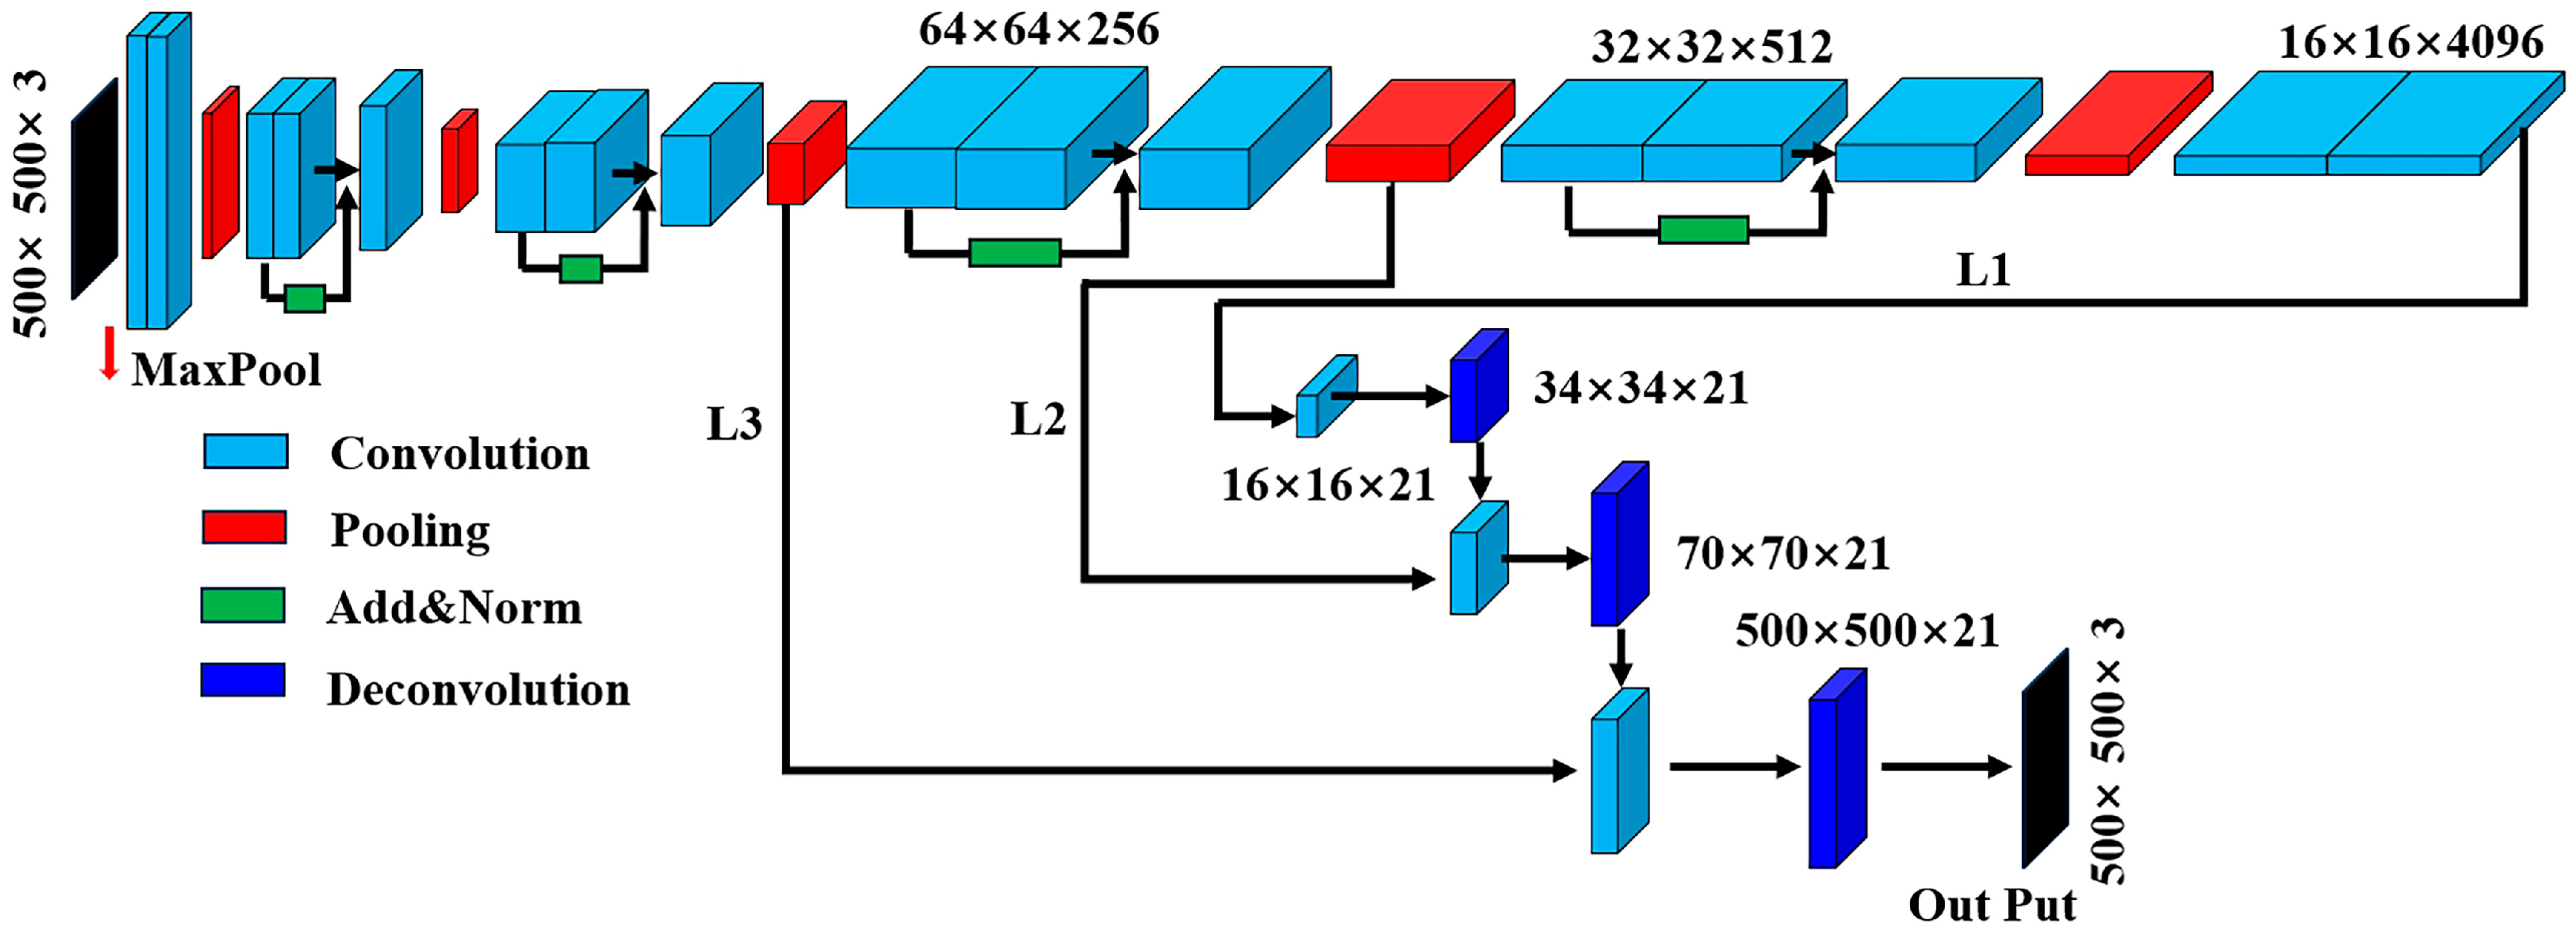
2.2.1. Full Convolutional Network (Fcn) Segmentation Model

Figure 2 shows a full convolutional network (FCN) for image semantic segmentation proposed by Jonathan Long et al. [21,22] in 2014. Its main function is to design an encoder–decoder structure based on a full convolutional neural network. The FCN model can perform pixel-level image segmentation tasks, making semantic image segmentation possible. For image segmentation tasks, the FCN model can allow any size of image input without the need for cropping image blocks. The original image can be directly fed into the network for feature learning, and the model classifies each pixel of the input image to achieve image segmentation.

2.2.2. U-Net Segmentation Model

Figure 3 shows the U-Net model, which builds a new convolutional neural network model on the basis of an FCN. Because the network structure is symmetrical and the shape is similar to the letter “U”, it is called a U-Net [23,24]. The model is mainly composed of three parts: a contraction path, an expansion path, and concatenation. The contraction path is a common convolutional neural network (CNN) structure that is composed of a convolution layer, pooling layer, and activation function, also known as a downsampling path. The contraction path of a U-Net consists of four identical modules, and each module contains a convolution layer (convolution core size 3 × 3, activation function GELU) and a maximum pooling layer (pooling size 3 × 3, step size 2). The convolution of the contraction path doubles the channel, and each pooling reduces the pixel size of the feature map by half. The expansion path, also known as the upsampling path, restores the resolution of feature maps as much as possible through upsampling technology. The expansion path is completely symmetrical with the contraction path and consists of four identical modules. Each module contains a deconvolution layer (deconvolution core size 2 × 2, step size 2), a jump connection, and a convolution layer (convolution core size 1 × 1, Sigmoid activation function). Every time a deconvolution is performed, the size of the feature map is doubled, and the number of channels is halved. Jump connections concatenate and fuse abstract feature maps in the expansion path with shallow feature maps in the corresponding contraction path, enabling deep convolution in the expansion path to obtain richer image detail information. Unlike other CNN models, the U-Net model has a deeper network structure and richer upsampling layers, which can extract rich, detailed features of images. Moreover, the U-Net model allows the network to rely on a small number of training sets to achieve accurate image segmentation, making it highly suitable for image segmentation tasks with scarce datasets.

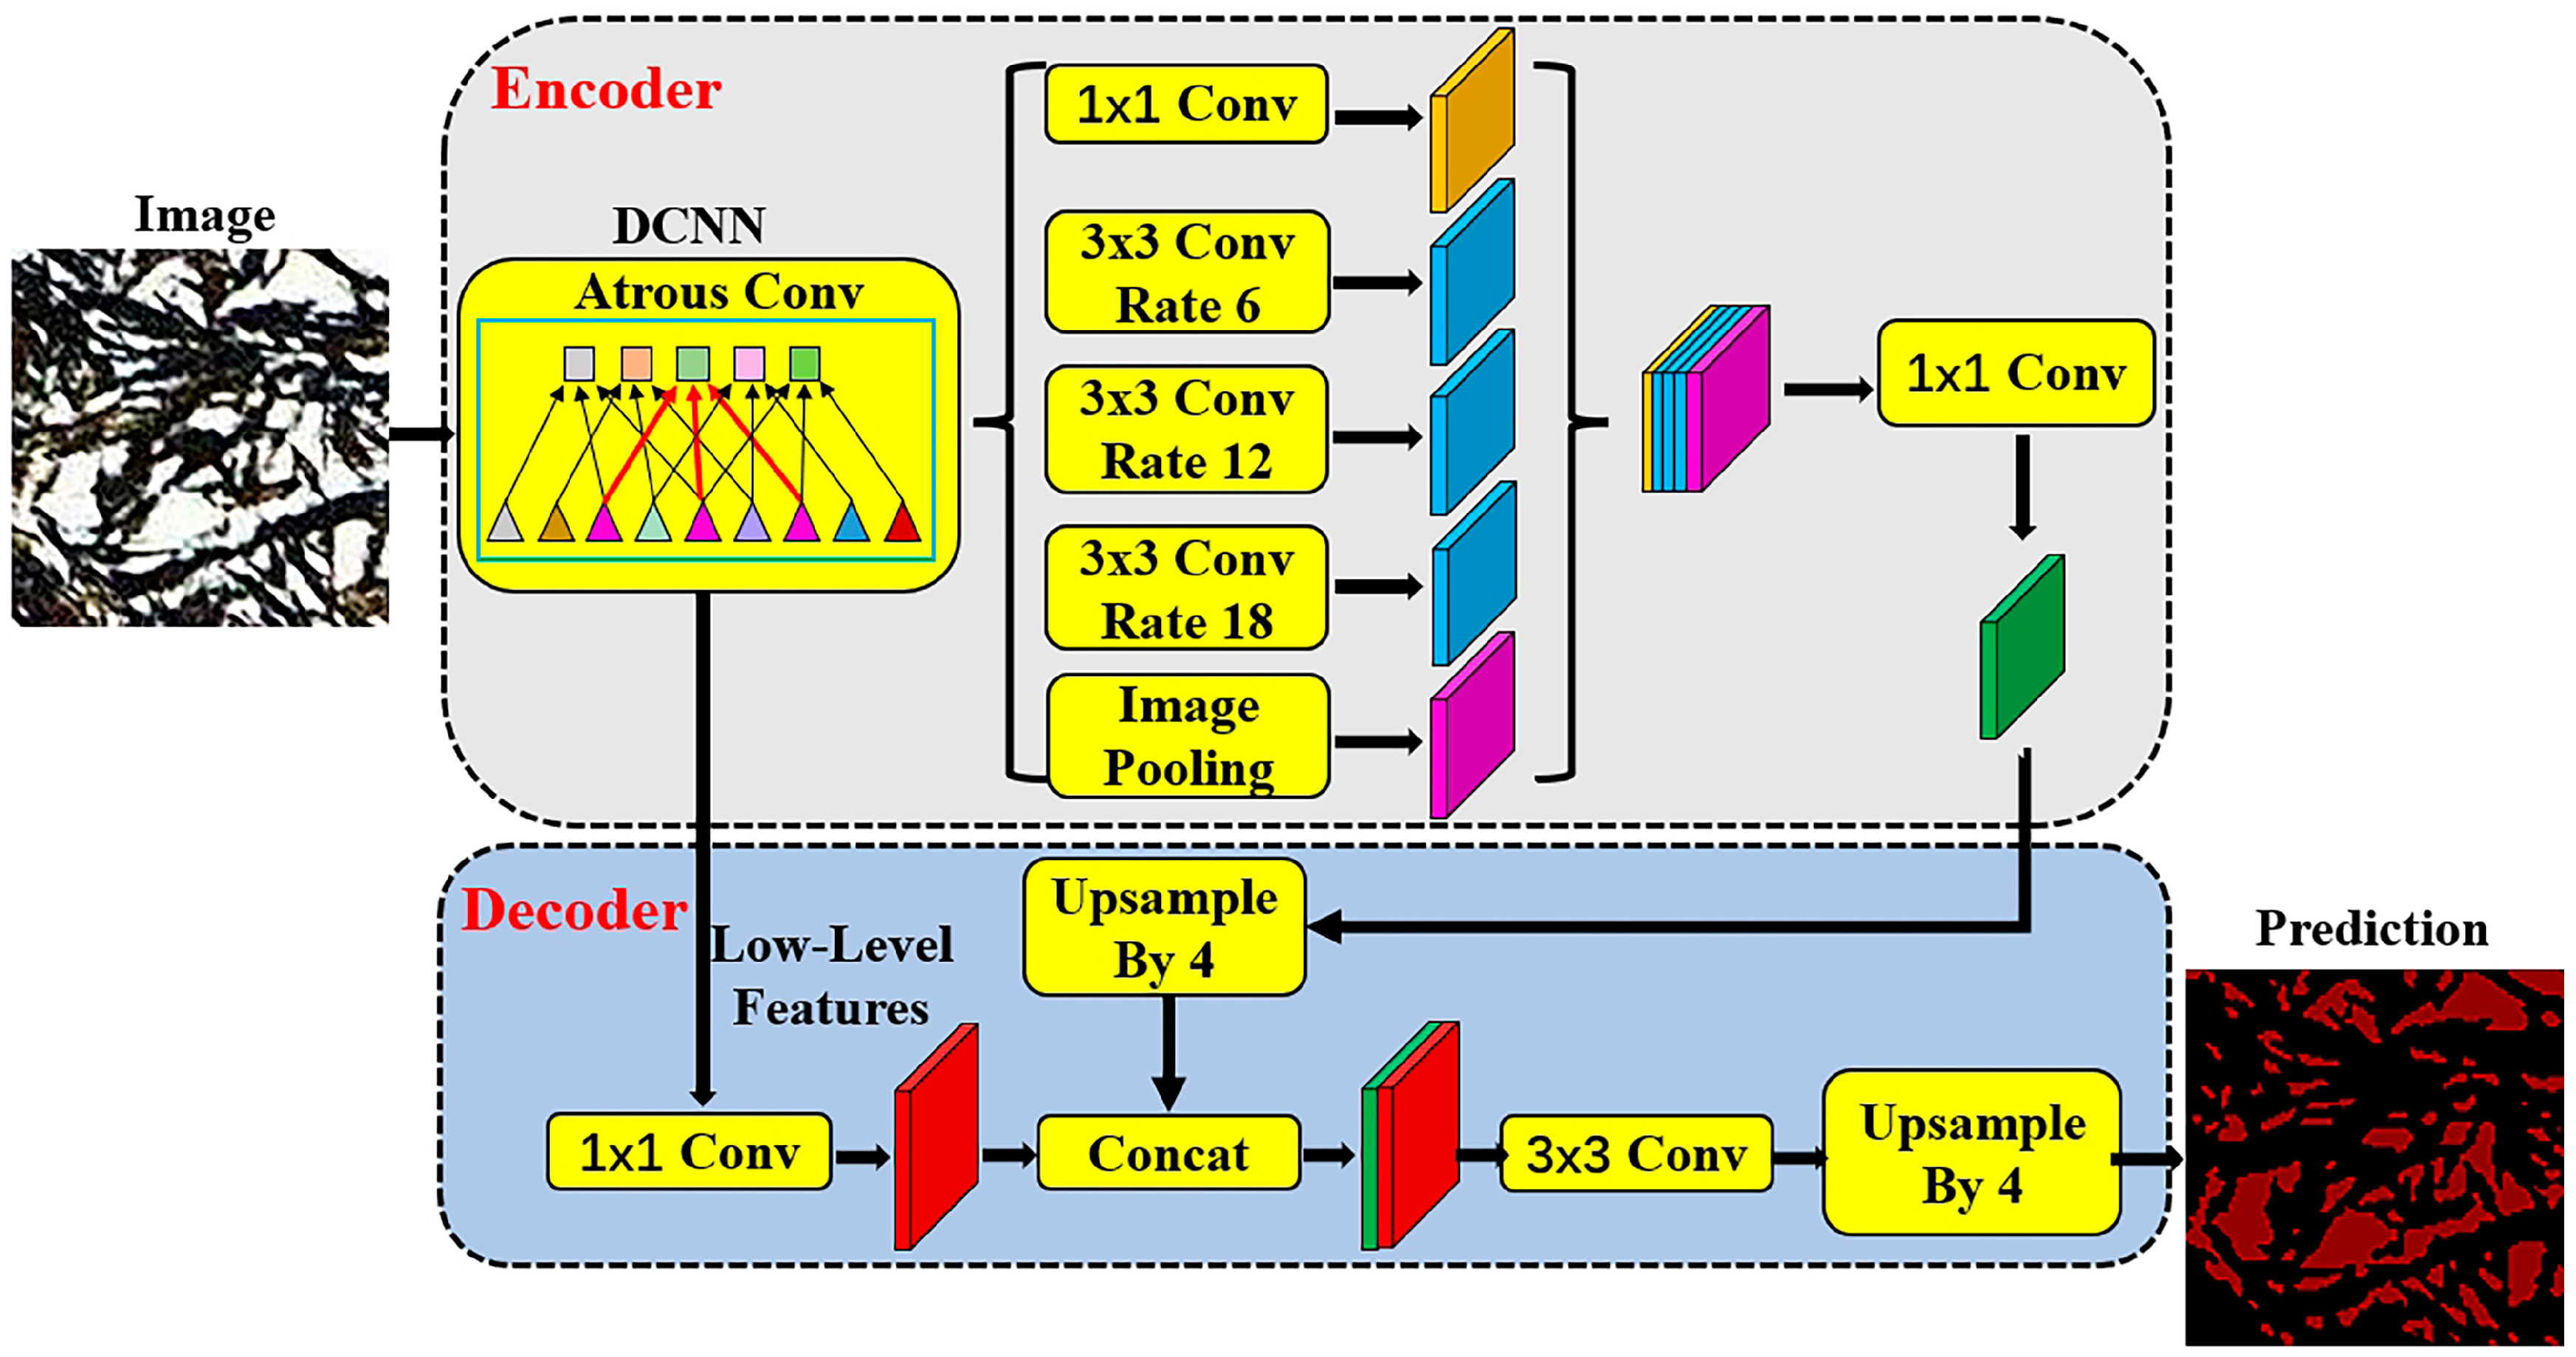
2.2.3. DeepLabv3_plus Segmentation Model

The DeepLabv3_plus model builds a new image segmentation model based on a full convolutional neural network (FCN) [25,26], which combines the advantages of the two algorithms to achieve the end-to-end segmentation of images, in Figure 4. The DeepLabv3_plus [27] network model is an image segmentation model with relatively high accuracy in the field of semantic segmentation, and it is also a relatively typical semantic segmentation network architecture. Feature extraction is performed on the input image in the coding area, where the image feature extraction is divided into two categories. The first extracts the shallow features of the input image through the deep convolution neural network (DCNN) model. The second passes the feature map obtained after the entire backbone network training into the atrous spatial pyramid pooling (ASPP) module. Then, through the convolution of holes of different magnifications for fusion, a deep-level feature map with better fusion is obtained. The above operations together constitute the coding structure of DeepLabv3_plus. The model decoding area performs feature fusion between the shallow eigenvalues generated in the encoding process and the deep eigenvalues that have undergone deep training. To allow these two parts to be smoothly fused, the deep-level features are upsampled in the decoding stage and then fused with the shallow-level features to perform a 3 × 3 convolution together. To make the model output the same size as the original image, upsampling is performed at the end of the model to obtain the model result.

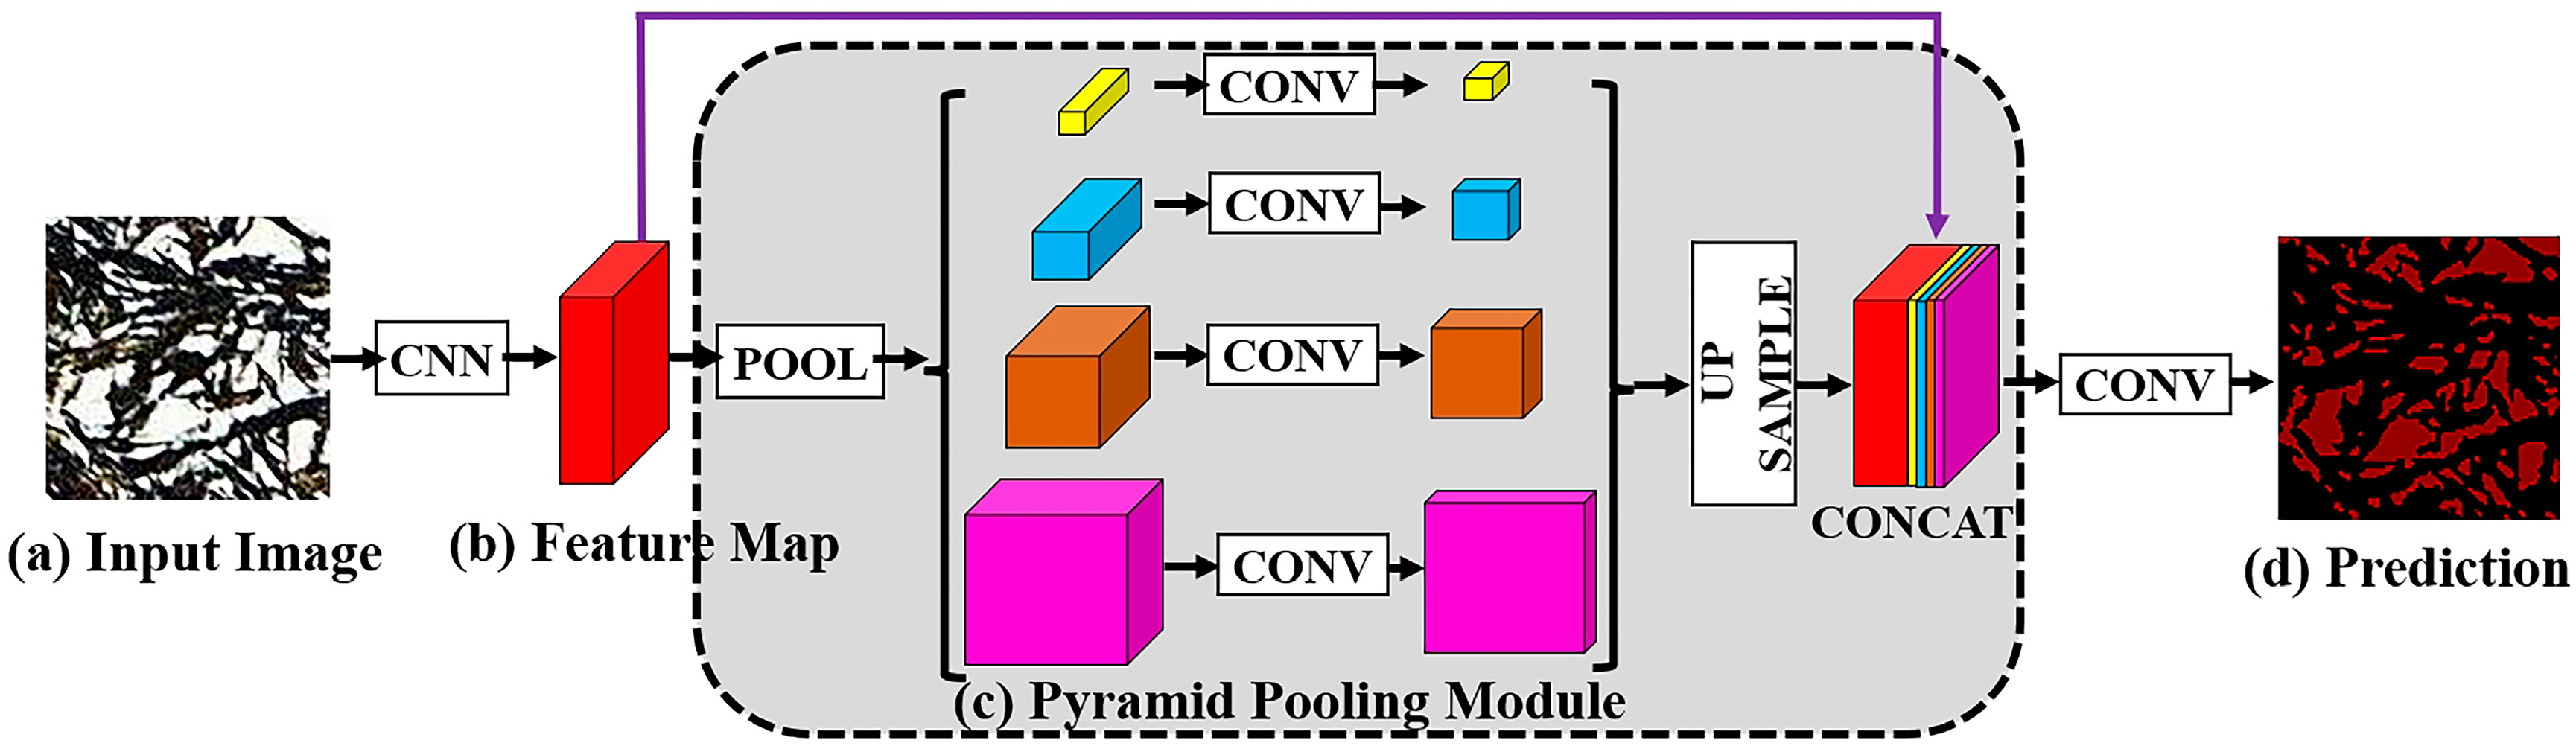
2.2.4. Pyramid Scene Parsing Network (PSPNet) Segmentation Model

The PSPNet algorithm continues to use the encoder–decoder structure of the FCN algorithm [28,29]. Compared with other semantic segmentation algorithms, its core concept is the introduction of a pyramid pooling module in the decoder, which enriches the extracted data by fusing the feature information in different regions of global information. As shown in Figure 5, the principle of the PSPNet algorithm is to perform preliminary feature extraction on the input image through the backbone feature extraction network ResNet and use the PSP module to enhance feature extraction. Finally, the prediction of the category of each pixel in the picture is achieved through the convolution operation and the overall framework of the PSPNet algorithm. PSPNet fuses contextual information from different regions. The feature extraction network uses a pre-trained model and a dilated convolution strategy to extract feature maps, and the extracted feature maps are 1/8 of the original input. The feature map is fused with the features with overall information through the pyramid pooling module, the fused features are upsampled and matched with the initial feature map in the channel dimension, and finally, the final prediction map is output through a deconvolution layer. The PSP module is the pyramid pooling module, which is an enhanced feature extraction network module in the PSPNet algorithm. The PSP module integrates the features of four different convolution scales. The first row of the yellow pooling layer in the figure has a pooling kernel of 1 × 1 and a step size of 1. The roughest feature value is extracted, and the entire pooled feature layer directly performs average pooling. The following three layers of blue, orange, and pink pooling kernels are 2 × 2, 3 × 3, and 6 × 6, respectively. The pooled feature layers are divided and then average pooled. They divide the feature map into different subregions, form collective representations for different locations, and extract pooled features at different scales. To maintain the weight of the global feature, a 1 × 1 convolution is used after each level to reduce the feature dimension to 1/4 of the original. Finally, bilinear interpolation is used to upsample the low-dimensional feature layer to stack it with the original feature layer without pooling to obtain the final output feature layer. Compared with global pooling, pyramid pooling can extract multiscale feature information.

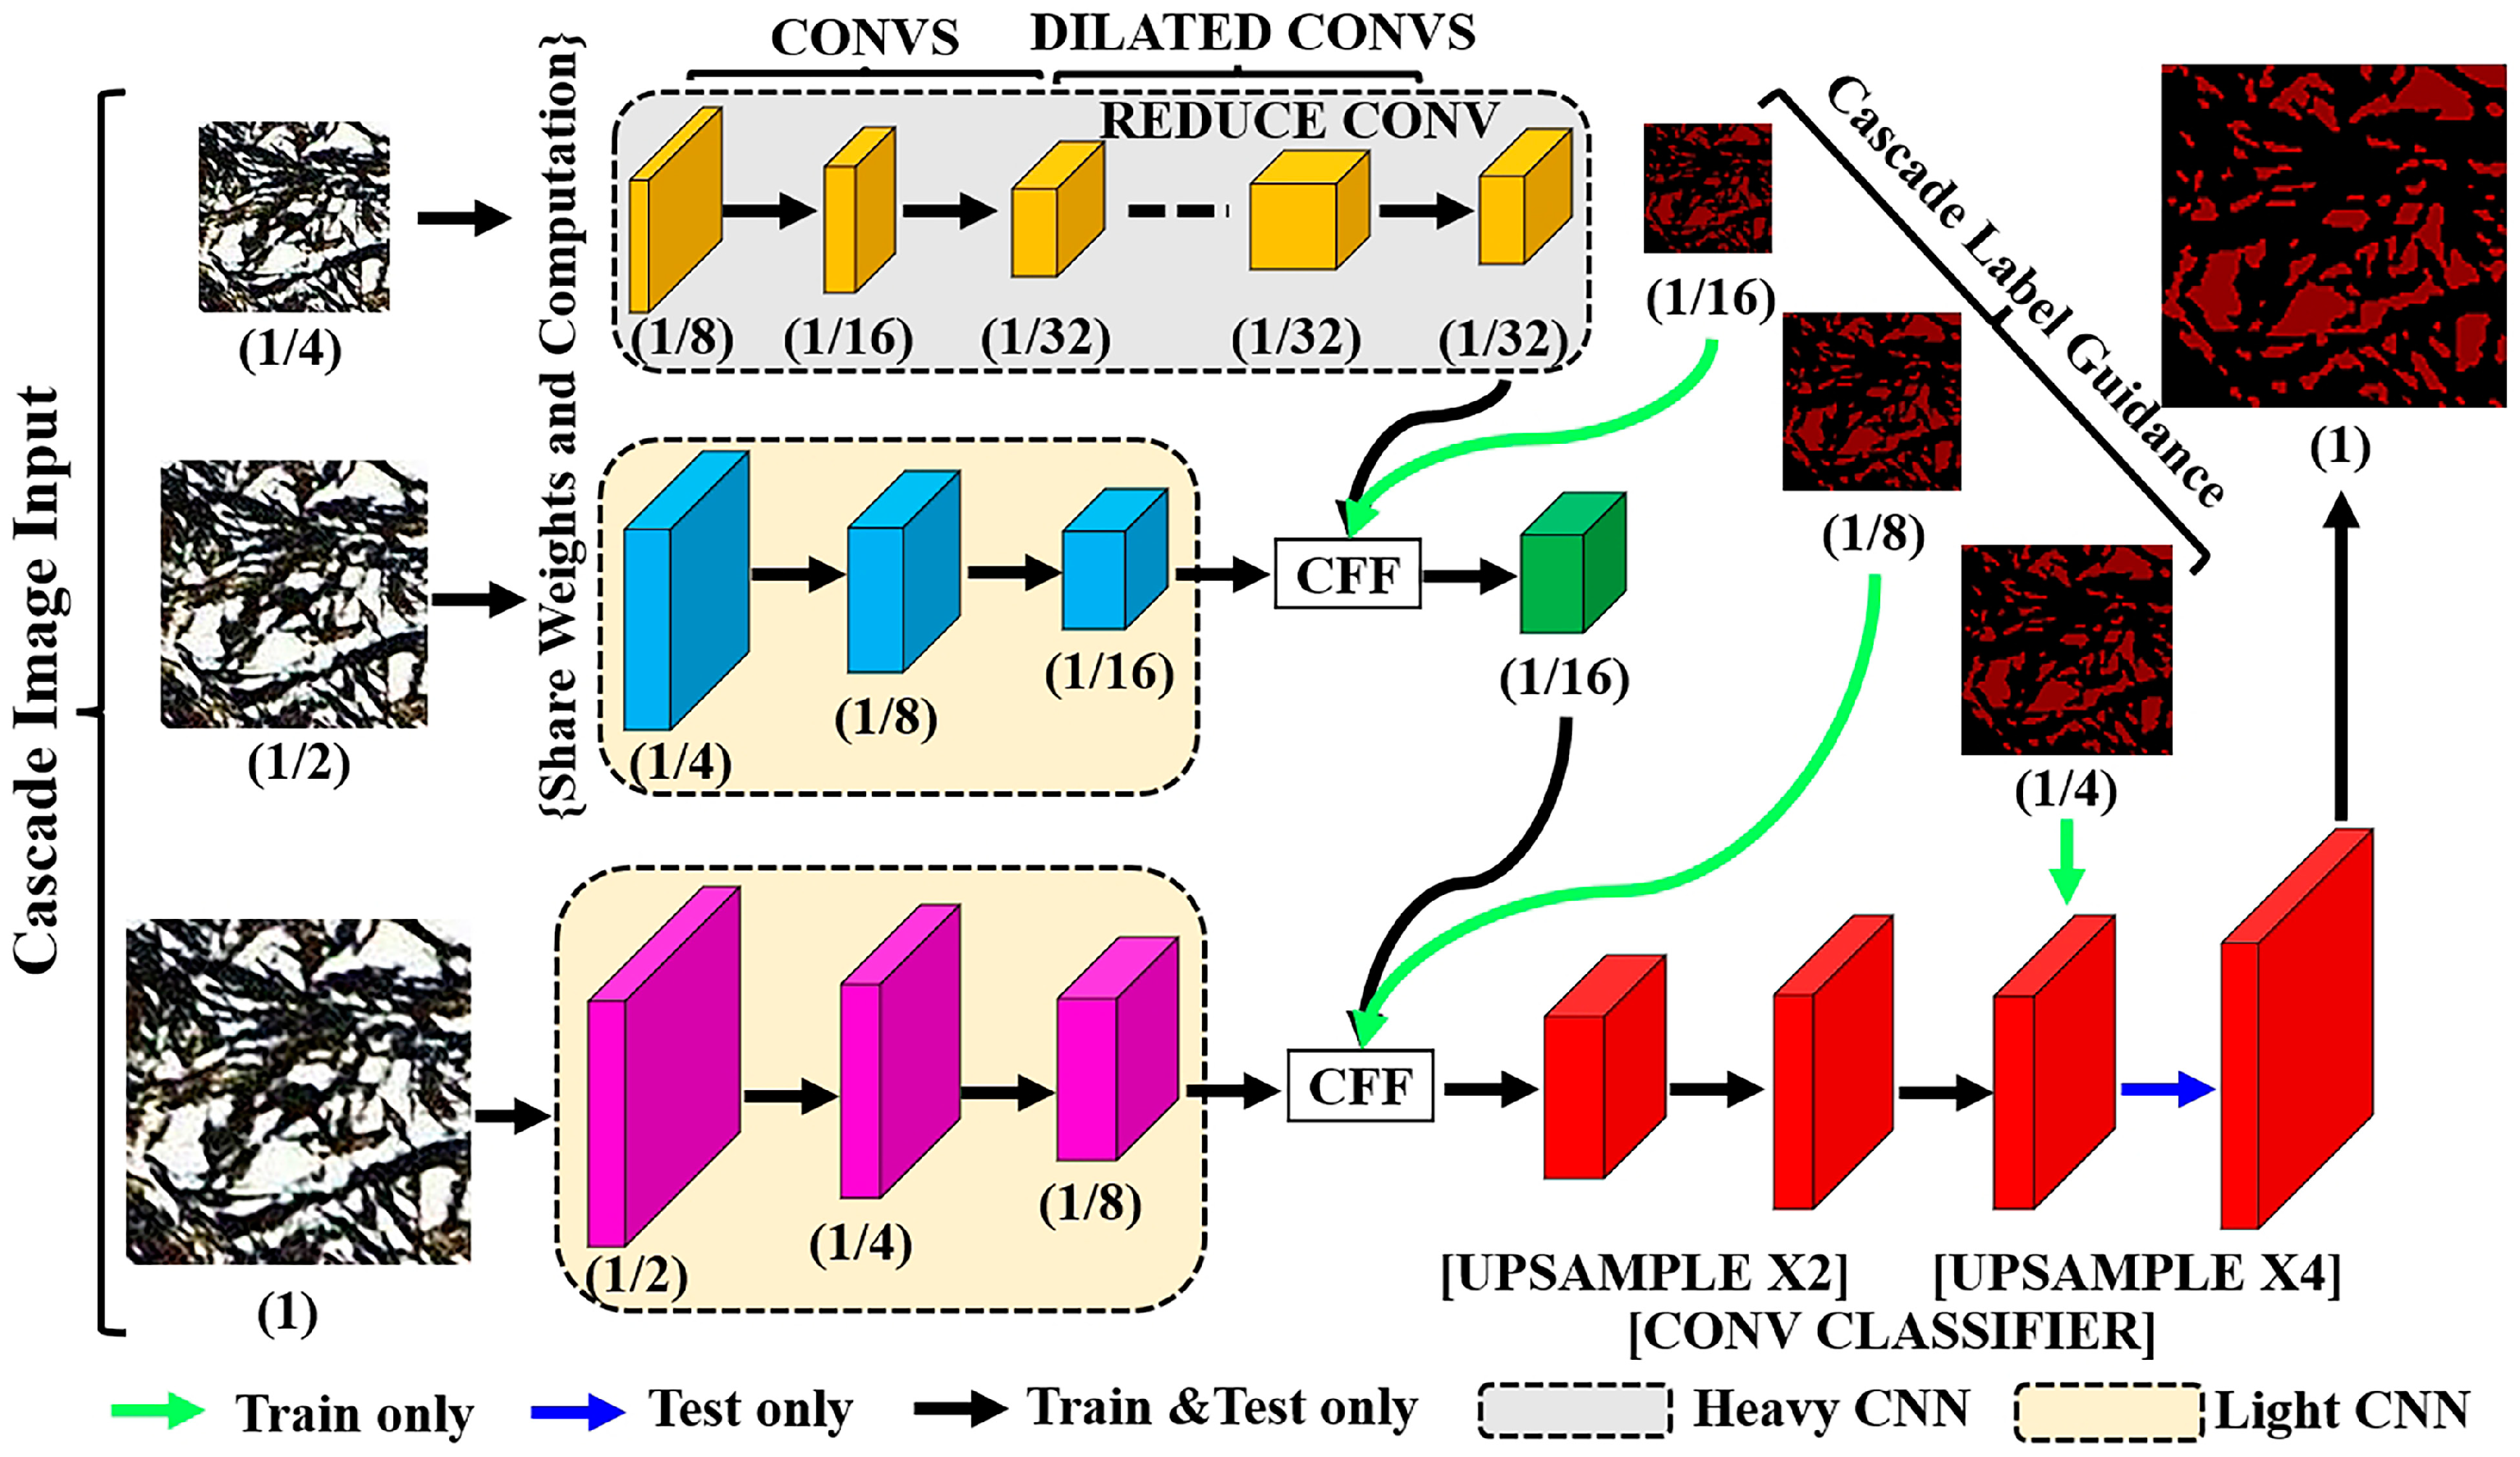
2.2.5. Image Cascade Network (ICNet) Segmentation Model

The image cascade network (ICNet) model is a real-time semantic segmentation network based on PSPNet [30]. The core concept is to reduce the time consumption in the PSPNet inference process, introduce a cascaded feature fusion module, effectively utilize high- and low-resolution feature information, refine the segmentation results at low computational complexity, find a balance between speed and accuracy, and ensure segmentation accuracy while improving speed. Figure 6 shows the input images of three different branches of the ICNet network structure. For the output features of each branch, the upsampling is processed twice before outputting. During training, three sizes of ground truth (GT) are used to guide the training of each branch: 1/16, 1/8, and 1/4. This auxiliary training strategy smoothens gradient optimization and facilitates training convergence. As each branch’s learning ability increases, prediction is not dominated by any branch. The use of gradient feature fusion and a cascaded guided structure can generate reasonable prediction results.

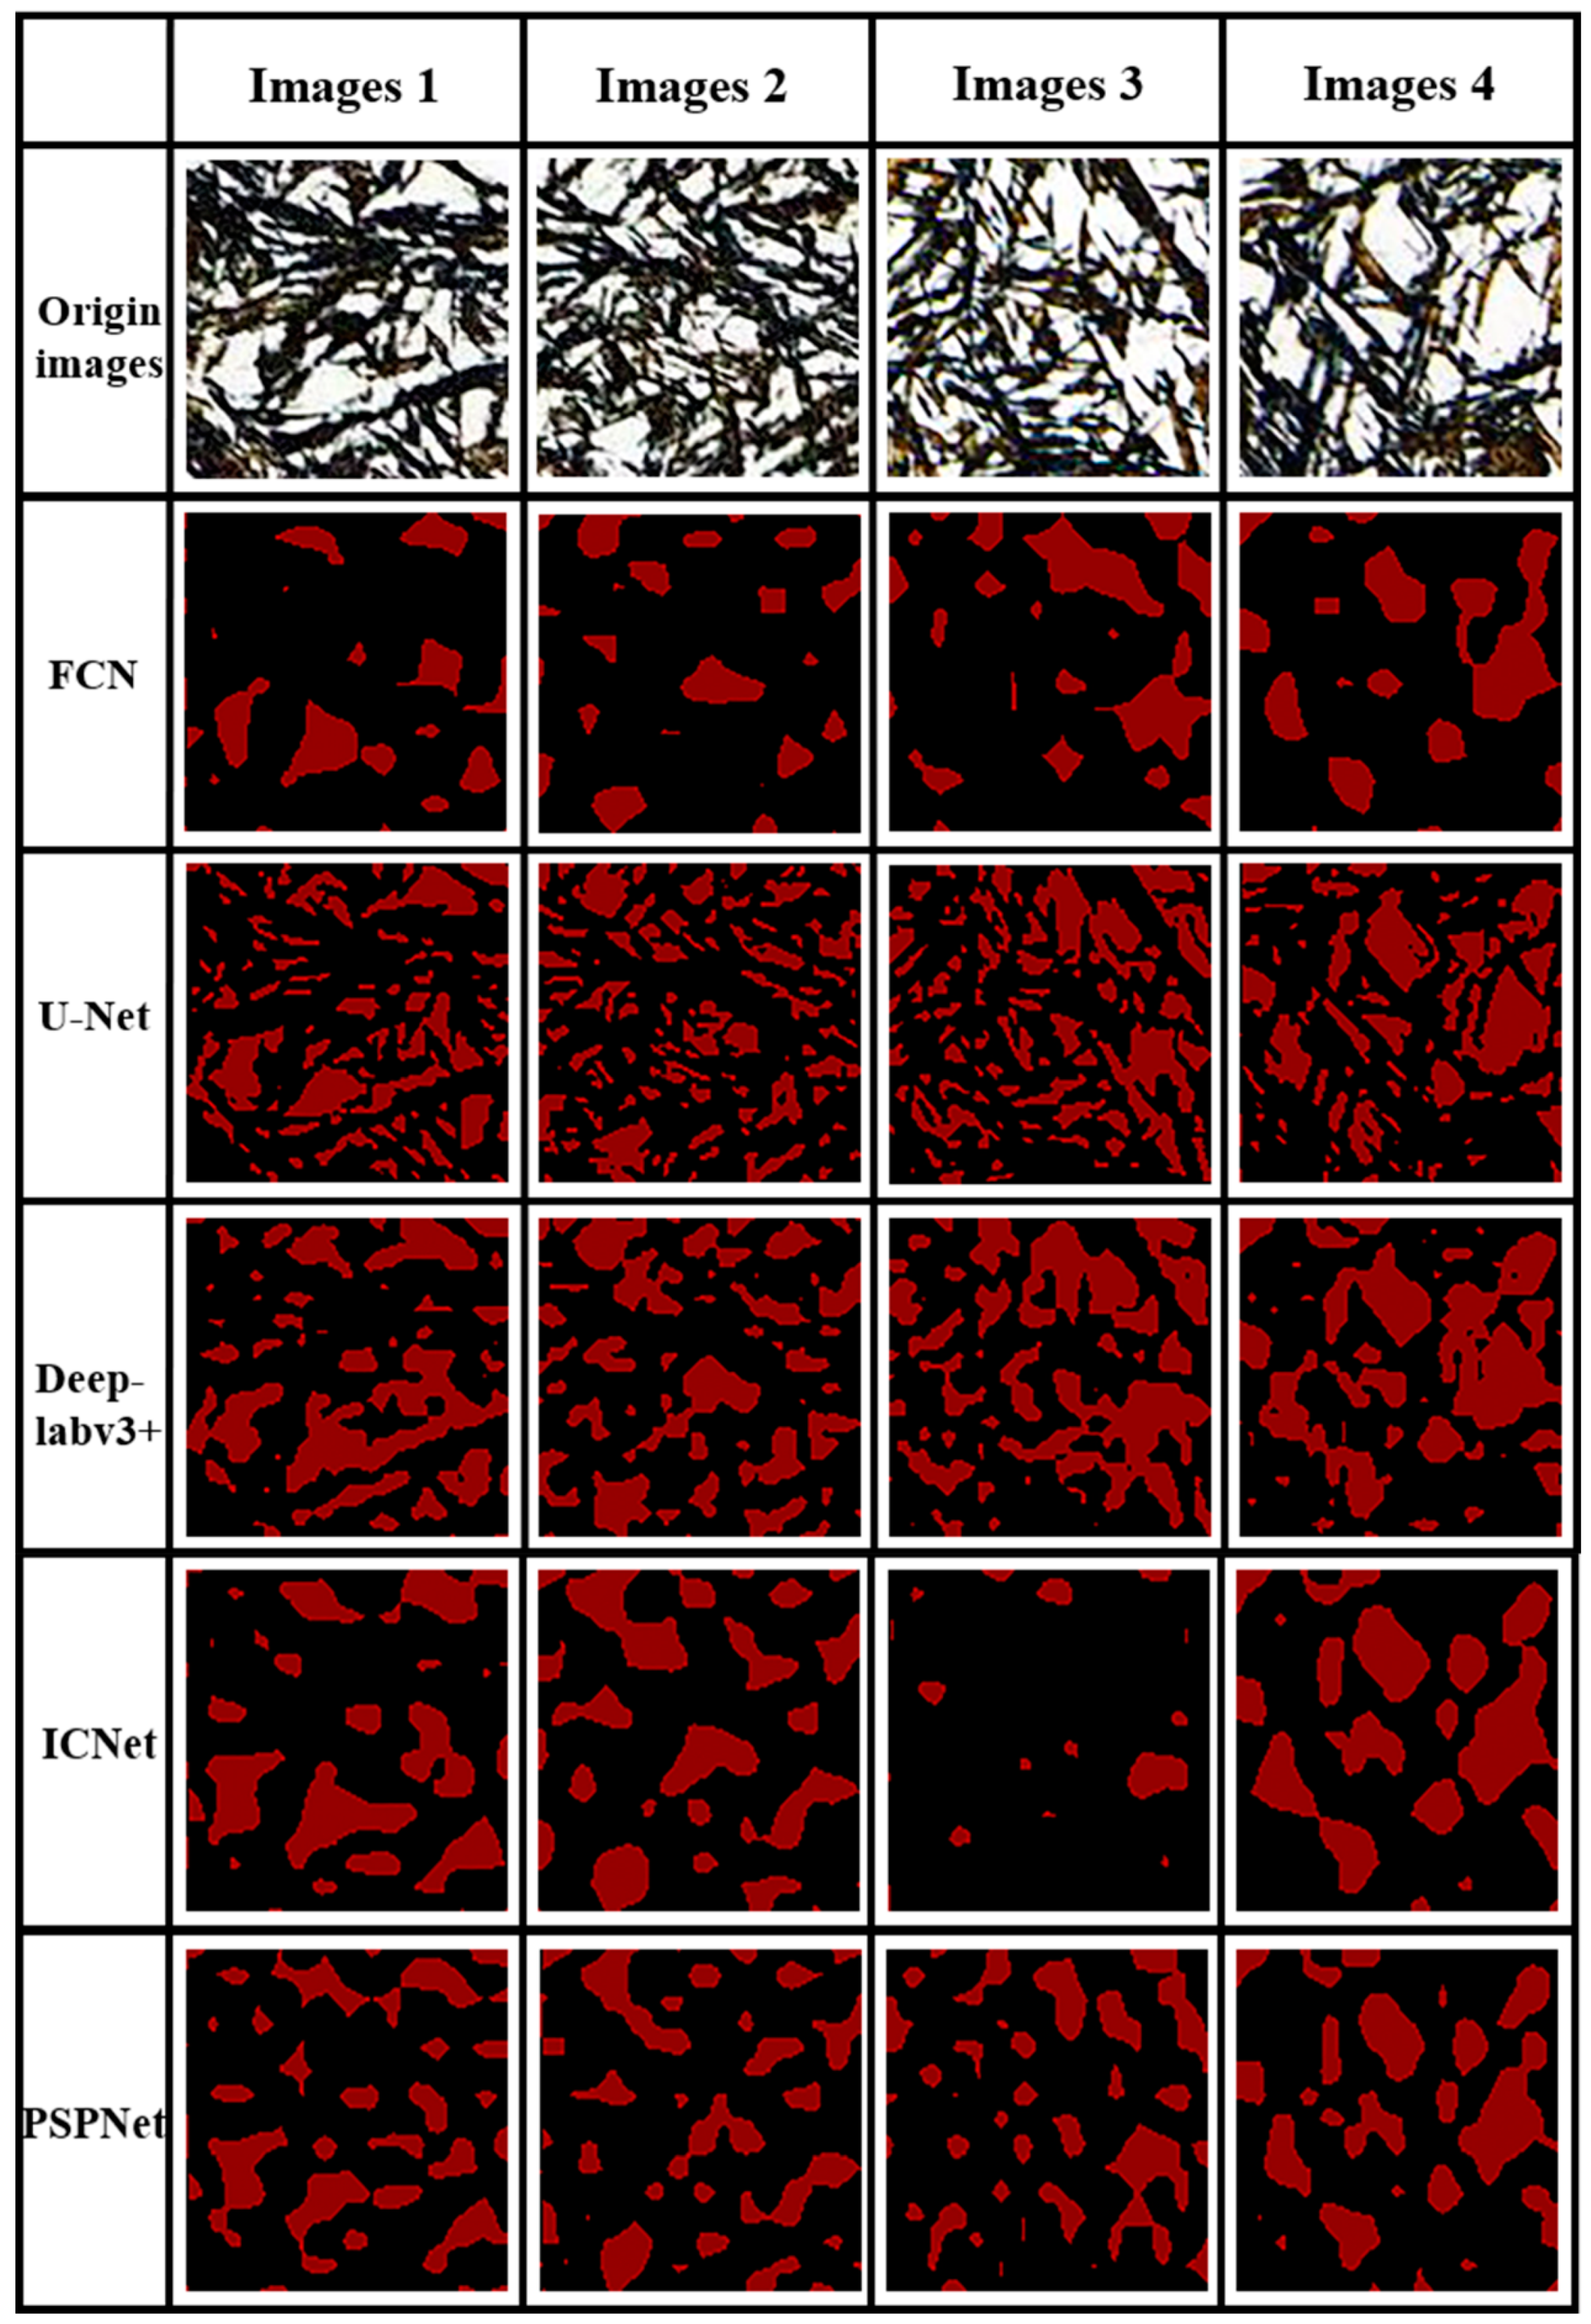
3. Experimental Results and Analysis

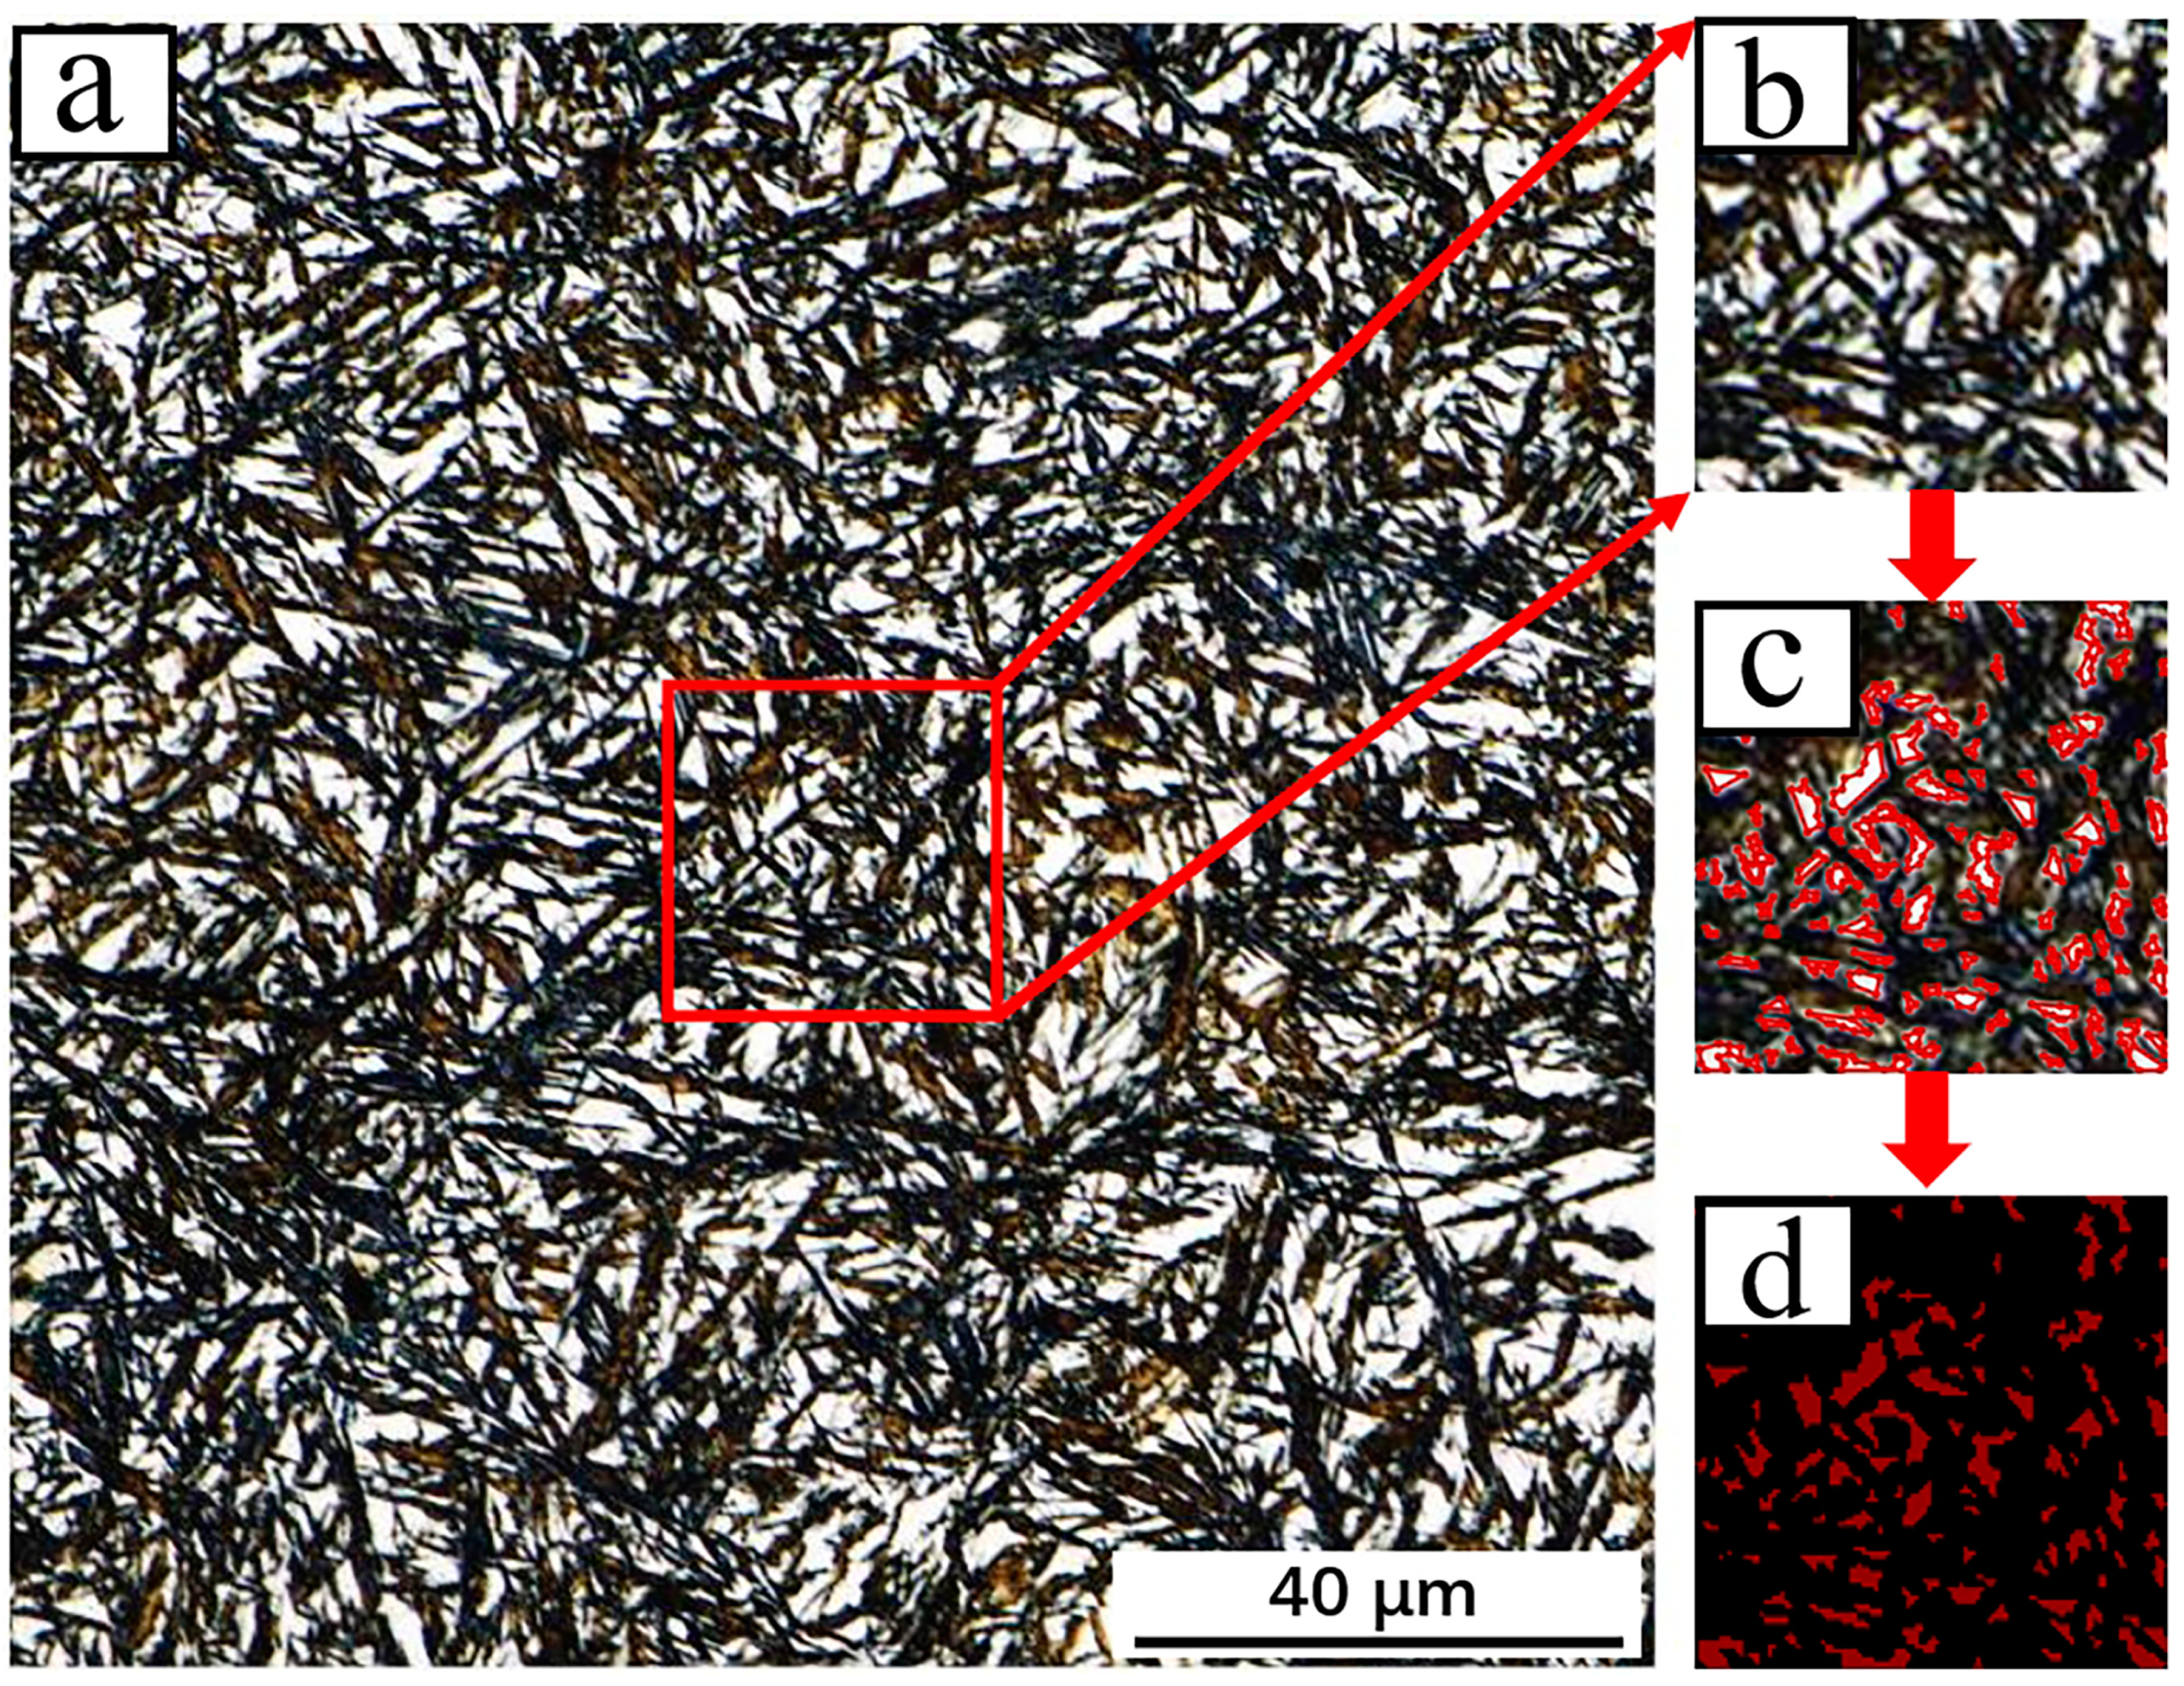
3.1. Data Processing

This article constructs a microstructure of the carburized layer dataset (MCLD) for 23CrNi3Mo steel. First, the microstructure images are captured using laser confocal imaging, as shown in Figure 7a. Each microstructure image is divided into 25 pixels, which are 116 × 116 images, as shown in Figure 7b. In this paper, a total of 600 high-definition microstructure images are produced as a dataset. LabelMe software is used to manually mark the location of needle martensite and residual austenite in each microstructure image, as shown in Figure 7c. During the marking process, the label information of the microstructure is stored in JSON format, which is a text format that primarily uses key value pairs to store semantic annotation results of images. Although the annotation file for semantic segmentation in JSON format stores considerable semantic segmentation information, it is not intuitive and difficult to read. Therefore, this article converts the label image in JSON format into a .png single-channel label image with the same size as the annotation image, as shown in Figure 7d. A total of 600 sets of single channel label images were used to construct a microstructural dataset (MCLD), and the dataset was input into five deep neural network models: FCN, UNet, DeepLabv3+, PSPNet, and ICNet for training. We will use 80% of the input dataset for training and 20% for testing and analyze it using four evaluation metrics: MIOU, MPA, MFWIOU, and loss function, and select the optimal neural network model.

3.2. Model Segmentation Evaluation Metrics

The performance evaluation indicators for the output model of semantic segmentation network training mainly include average pixel accuracy and average intersection-to-union ratio.
(1) Average intersection and union ratio MIOU: the ratio of the intersection and union of the predicted area pixel set of each category and the real area pixel set, taking the average as shown in Formula (1).
M I O U = 1 N i = 1 N n i i i = 1 N ( m i + j = 1 N n j i n i i )
(2) Average pixel accuracy: the proportion of correctly classified pixels in each category, taking the average as shown in Formula (2) [31].
M P A = 1 N i = 1 N n i i i = 1 N m i
where N—the total number of semantic segmentation categories;
nij—the number of pixels belonging to class i that are classified into class j;
mi—total number of pixels labeled as class i.
(3) Frequency weight intersection ratio [32]:
The frequency weight intersection ratio is an improvement of MIOU, which sets weights for each class based on its frequency of occurrence, as shown in Formula (3).
M F W I O U = 1 i = 0 k j = 0 k p i j i = 0 k p i i j = 0 k p i j + j = 0 k p j i p i i
(4) Loss Function [33]:
The loss function is used to measure the error between the predicted and true values of a neural network, thereby guiding the network in finding the optimal weight parameters. as shown in Formula (4).
L = 1 m i = 1 m ( y i Y i ) 2
Among, yi represents the output of the neural network, Yi represents the real label, m represents the number of samples.

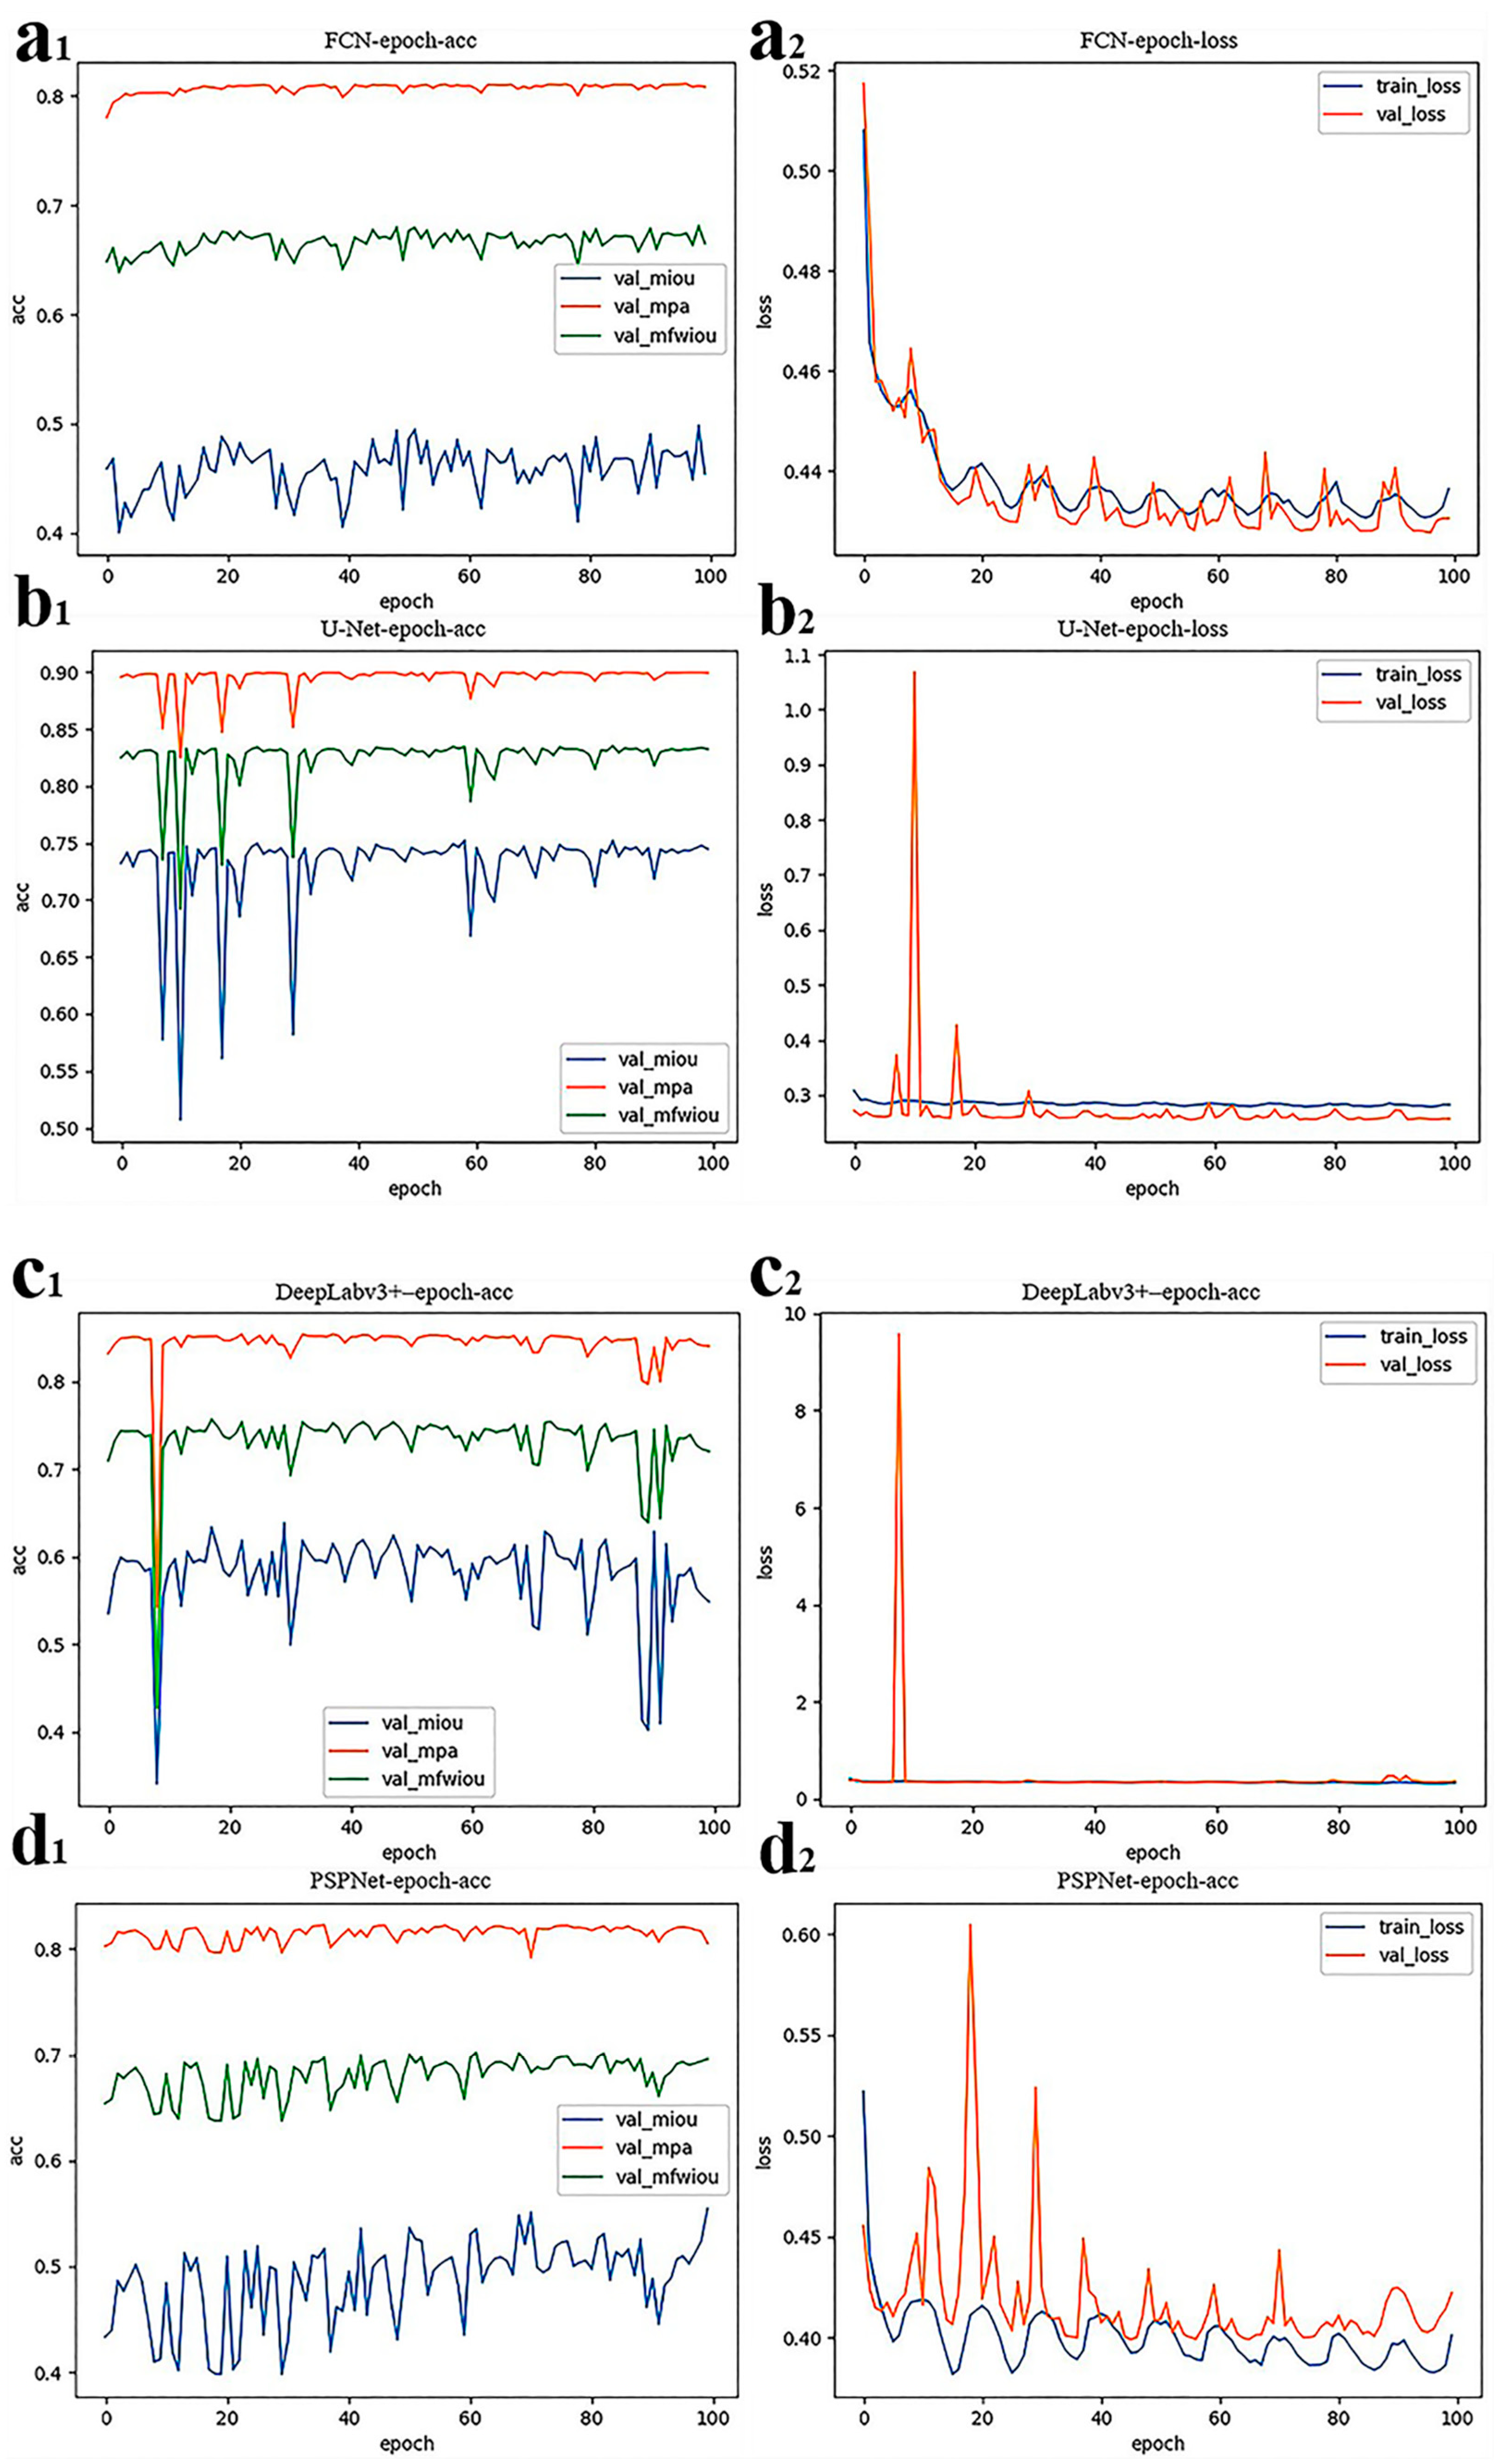
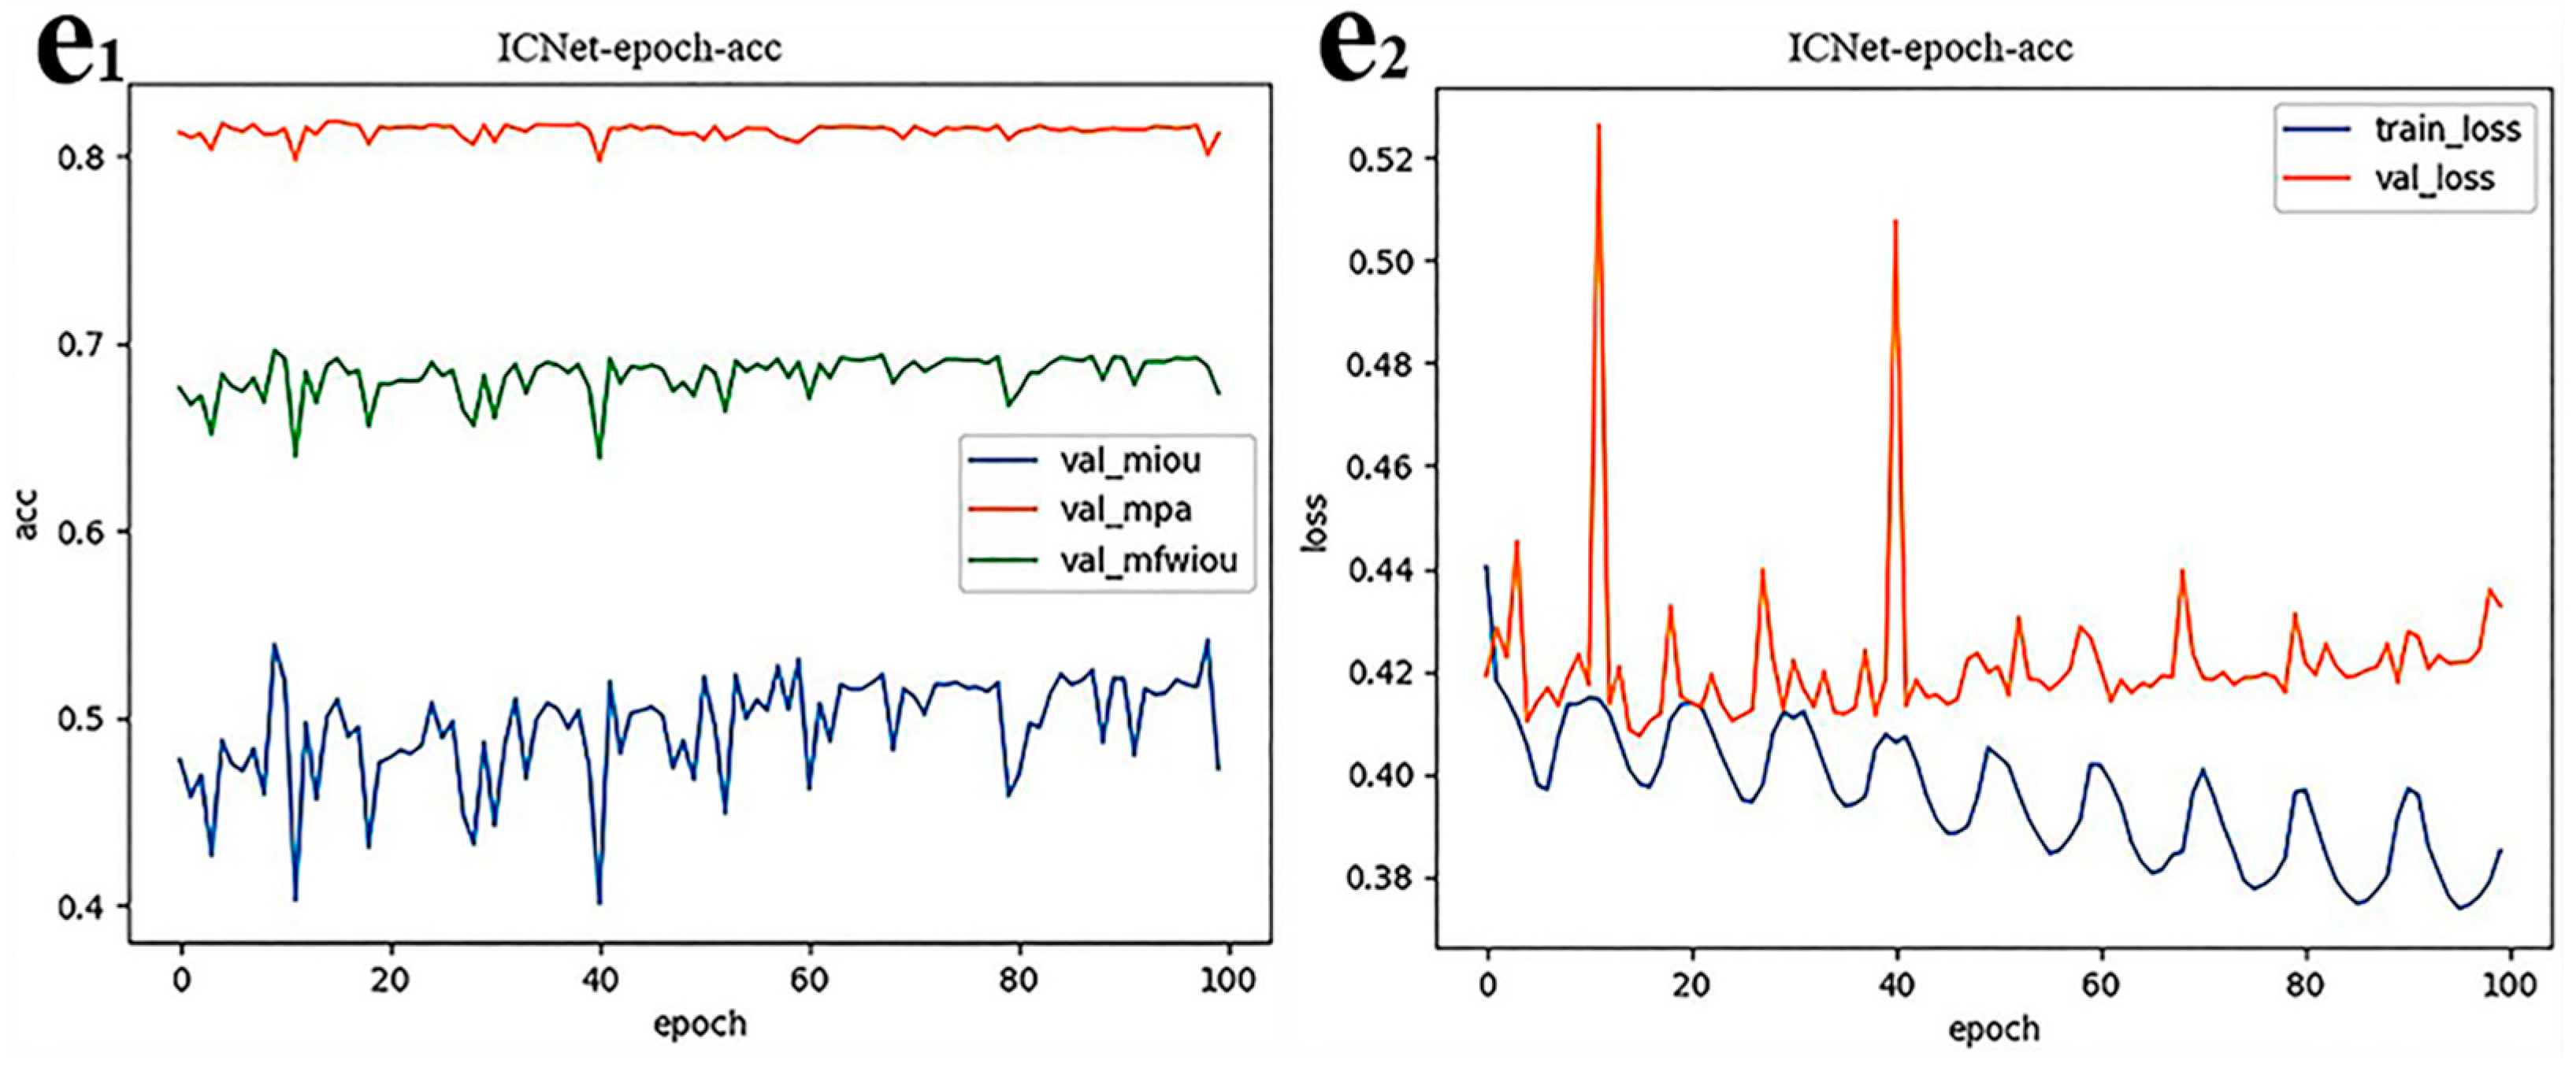
3.3. DeepLabv3_plus Model Segmentation Results of Microstructure Images

Table 2, Figure 8 and Figure 9 show the segmentation results of the five algorithms—the FCN, U-Net, DeepLabv3+, PSPNet, and ICNet—on the self-built 23CrNi3Mo steel carburized layer microstructure dataset (MCLD). The MIOU results were 0.50, 0.75, 0.64, 0.55, and 0.54, while the MAP results were 0.81, 0.89, 0.84, 0.81, and 0.80. The MFWIOU results were 0.68, 0.83, 0.75, 0.70, and 0.69. It can be seen that the U-Net three evaluation indicators are 0.75, 0.89, and 0.83, and the segmentation performance of the five algorithms is the best. At the same time, U-Net has the best convergence of the loss function. There are two main challenges in the segmentation of microstructure images. One is that the boundaries of residual austenite and martensite are easily confused, and the other is that there are many fine and irregularly sized microstructures in the residual austenite and martensite. The U-Net algorithm is superior to the FCN, DeepLabv3+, PSPNet, and ICNet algorithms, mainly because the U-Net network is an encoding and decoding network with a symmetric structure. Its unique structure can fully utilize the global and local details of the image, reducing dependence on the amount of training data. In other words, even without a sufficiently large dataset, the U-Net network can perform the best in microstructure image segmentation. The most prominent advantage of the U-Net network is that it can achieve better segmentation results in fewer microstructural datasets compared to other networks that rely on many datasets.

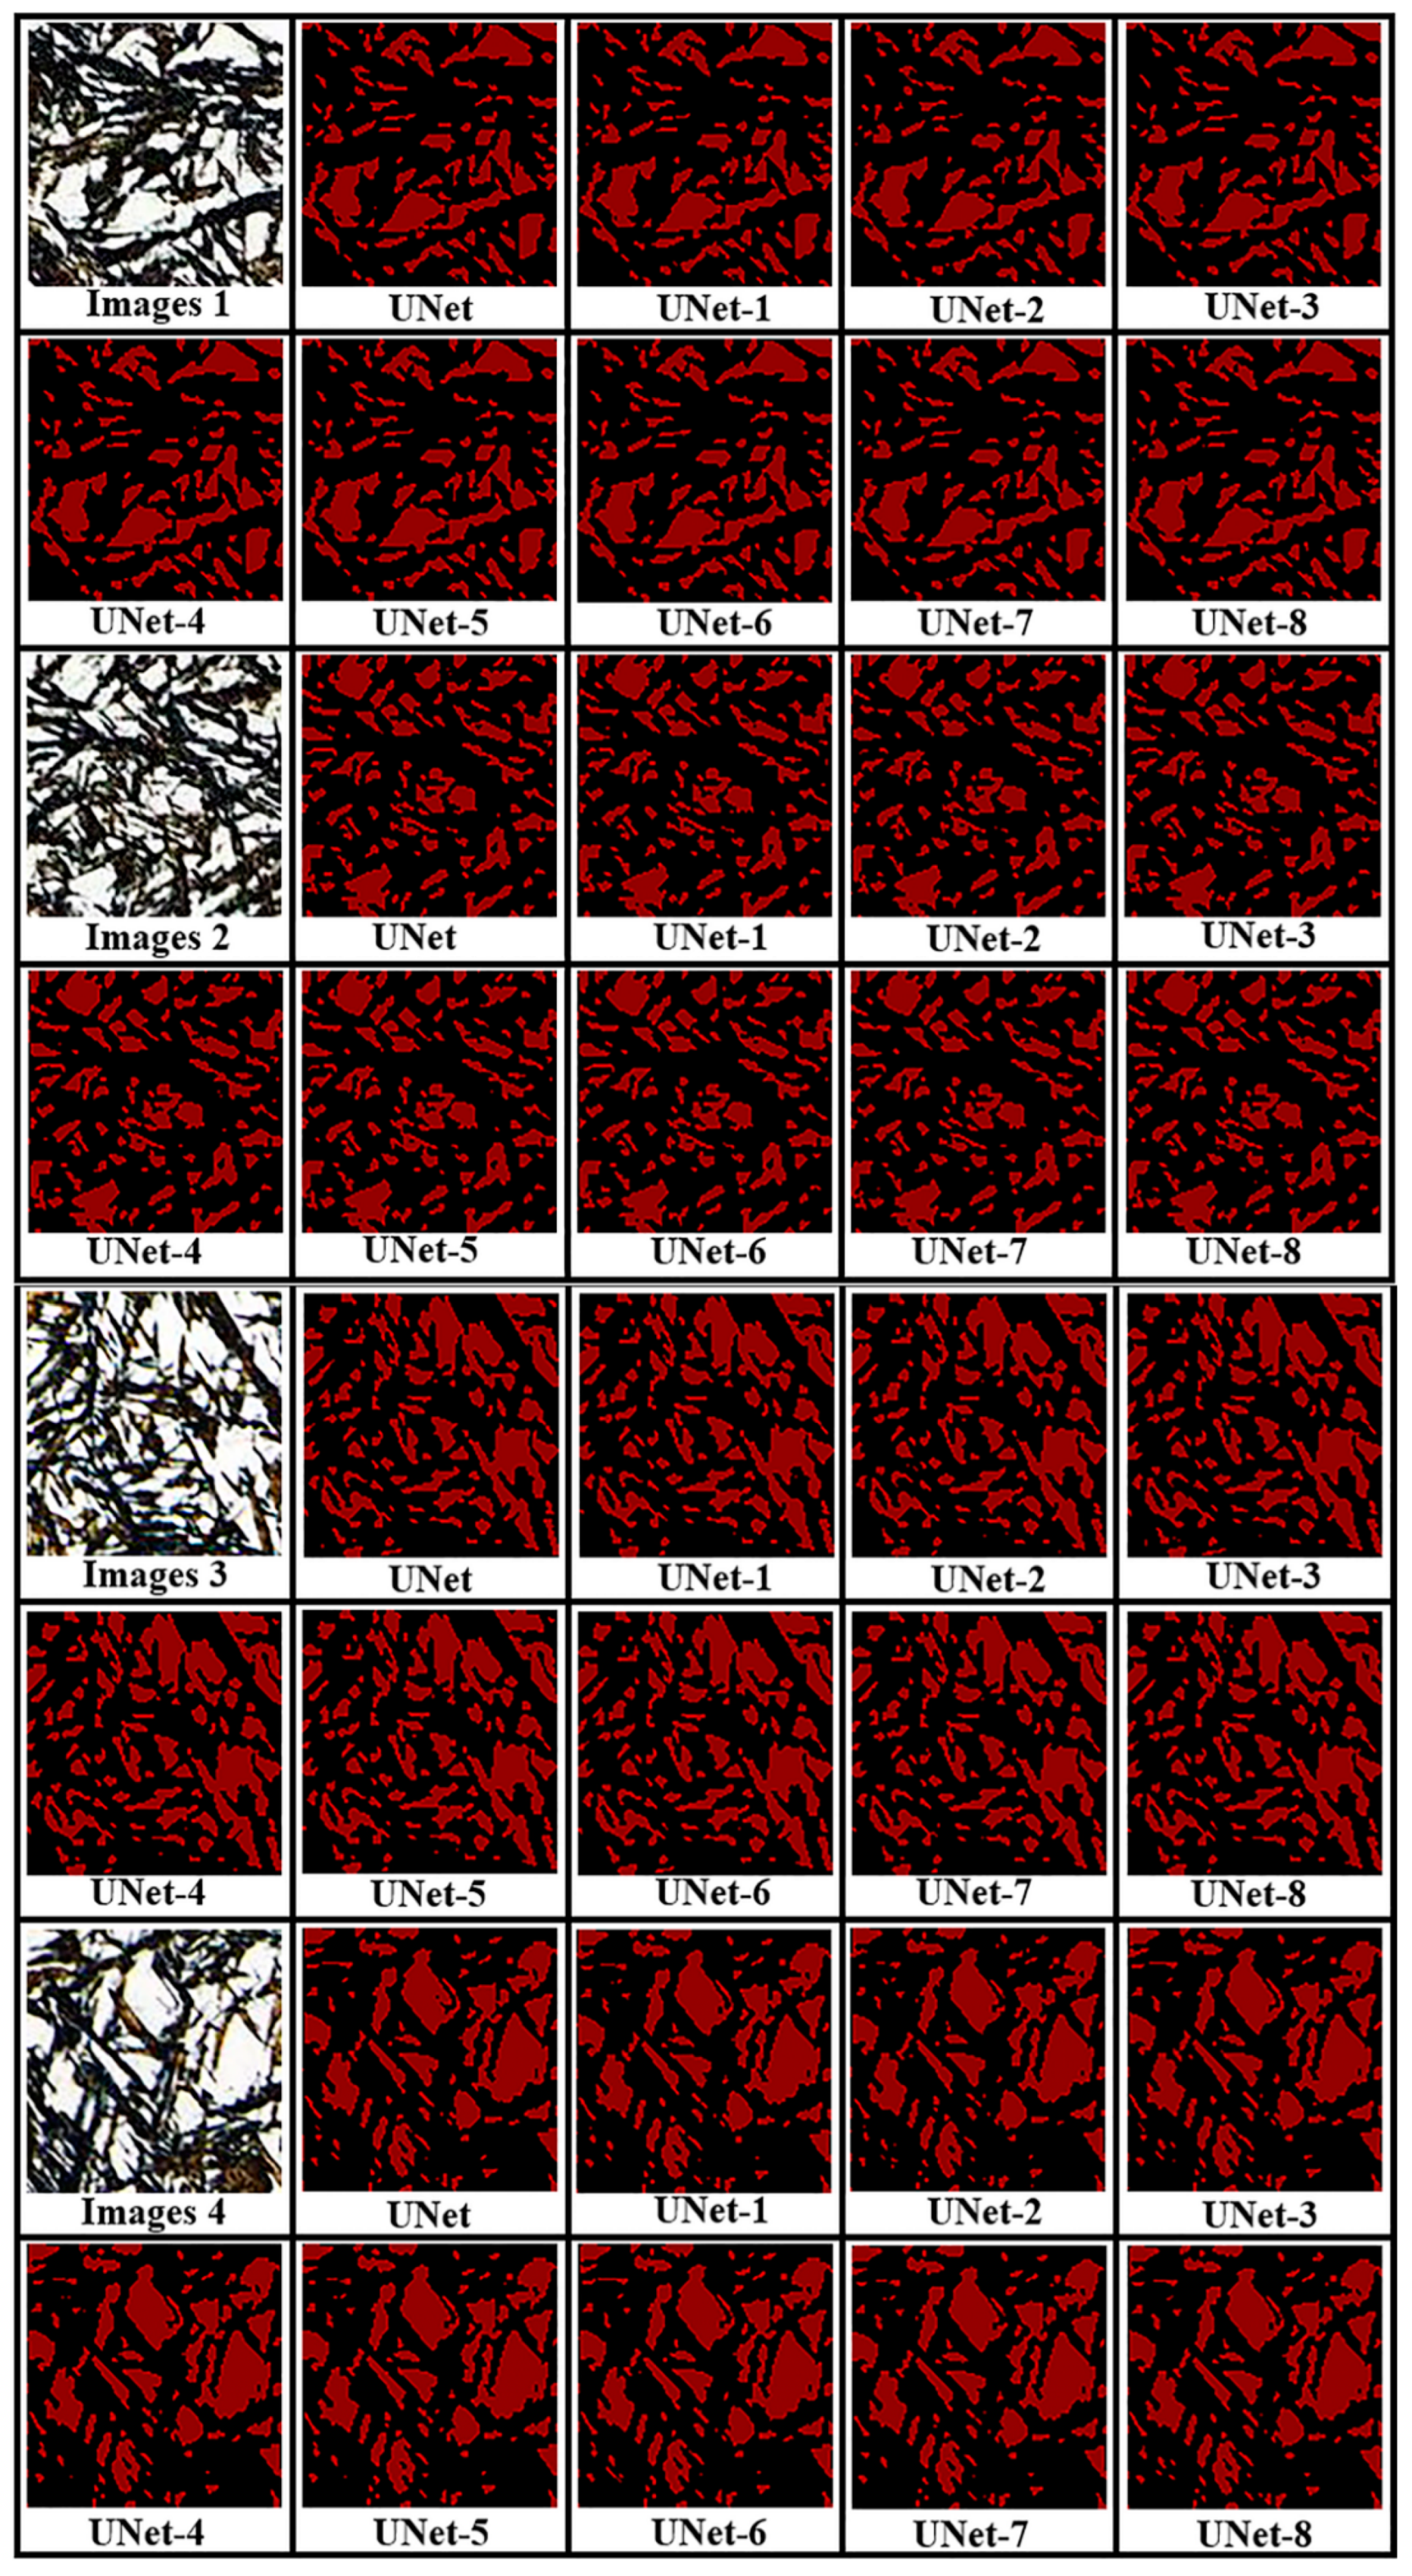
3.4. Optimization of the U-Net Network Model

To further improve the segmentation accuracy of the convolutional neural network U-Net model for the carburized layer microstructure, the activation function, the DropBlock regularization method and the ECA attention mechanism are changed to optimize the model and improve the segmentation accuracy of the U-Net model.
The specific improvement methods for the U-Net model are as follows:
(1)
U-Net-1: replace the activation function RELU of the U-Net model with the GELU activation function;
(2)
U-Net-2: replace the backbone network of the U-Net model with efficientnetb0;
(3)
U-Net-3: set the batch size of the training phase of the U-Net model to 16;
(4)
U-Net-4: add ECA attention mechanism and DropBlock regularization method to the U-Net model;
(5)
U-Net-5: replace the activation function RELU of the U-Net model with the Mish activation function and add the ECA attention mechanism;
(6)
U-Net-6: replace the activation function RELU of the U-Net model with the Mish activation function, add the ECA attention mechanism, and add the DropBlock regularization method;
(7)
U-Net-7: add network skip layer component U-Net++model;
(8)
U-Net-8: add residual network Resnet50 to the U-Net model_ U-net.
Table 3 and Figure 10 show the evaluation indicators and segmentation results of the U-Net convolutional neural network through eight optimization methods. After replacing the activation function RELU with GELU in the U-Net-1 model, the segmentation model evaluation index is MIOU = 0.74, MAP = 0.89, and MFWIOU = 0.83. Compared with the U-Net model, the segmentation accuracy decreases slightly. The U-Net-2 model replaces the backbone network with efficientnetb0, and the segmentation model evaluation indicators are MIOU = 0.74, MAP = 0.89, and MFWIOU = 0.82. Compared with the U-Net model, MIOU and MFWIOU are both reduced. The U-Net-3 model changes the training model batch size to 16, the U-Net-4 model adds the ECA attention mechanism and the DropBlock regularization method to the training model, and the U-Net-5 model changes the activation function RELU into Mish and adds the ECA attention mechanism at the same time. After optimization, the evaluation indicators MIOU, MAP, and MFWIOU of the U-Net-3, U-Net-4, and U-Net-5 models are the same, with values of 0.75, 0.90, and 0.83, respectively. It can be seen that the three optimization models have slightly improved segmentation accuracy MAP compared to the U-Net model. The U-Net-6 model replaces the activation function RELU with Mish, adds the ECA attention mechanism, and adds the DropBlock regularization method. After optimization, the segmentation model evaluation index is MIOU = 0.76, MAP = 0.92, and MFWIOU = 0.85, and compared with the U-Net model, the overall evaluation indicators of the optimized segmentation model are improved. The U-Net-7 model constructs a U-Net++network model by adding more skip layers. After optimization, the segmentation model evaluation index is MIOU 0.75, MAP 0.90, and MFWIOU 0.83. Compared with the U-Net model, the optimized segmentation model evaluation index MAP is slightly improved. The U-Net-8 model adds residual network Resnet50_U-Net to prevent overfitting. After optimization, the evaluation indicators of the segmentation model are MIOU of 0.75, MAP of 0.89, and MFWIOU of 0.83. The evaluation indicators of the optimized segmentation model are the same as those of the U-Net model. As mentioned above, the U-Net-6 model has the best segmentation effect on the microstructure of the carburized layer and can more accurately identify martensite and residual austenite in the carburized layer.

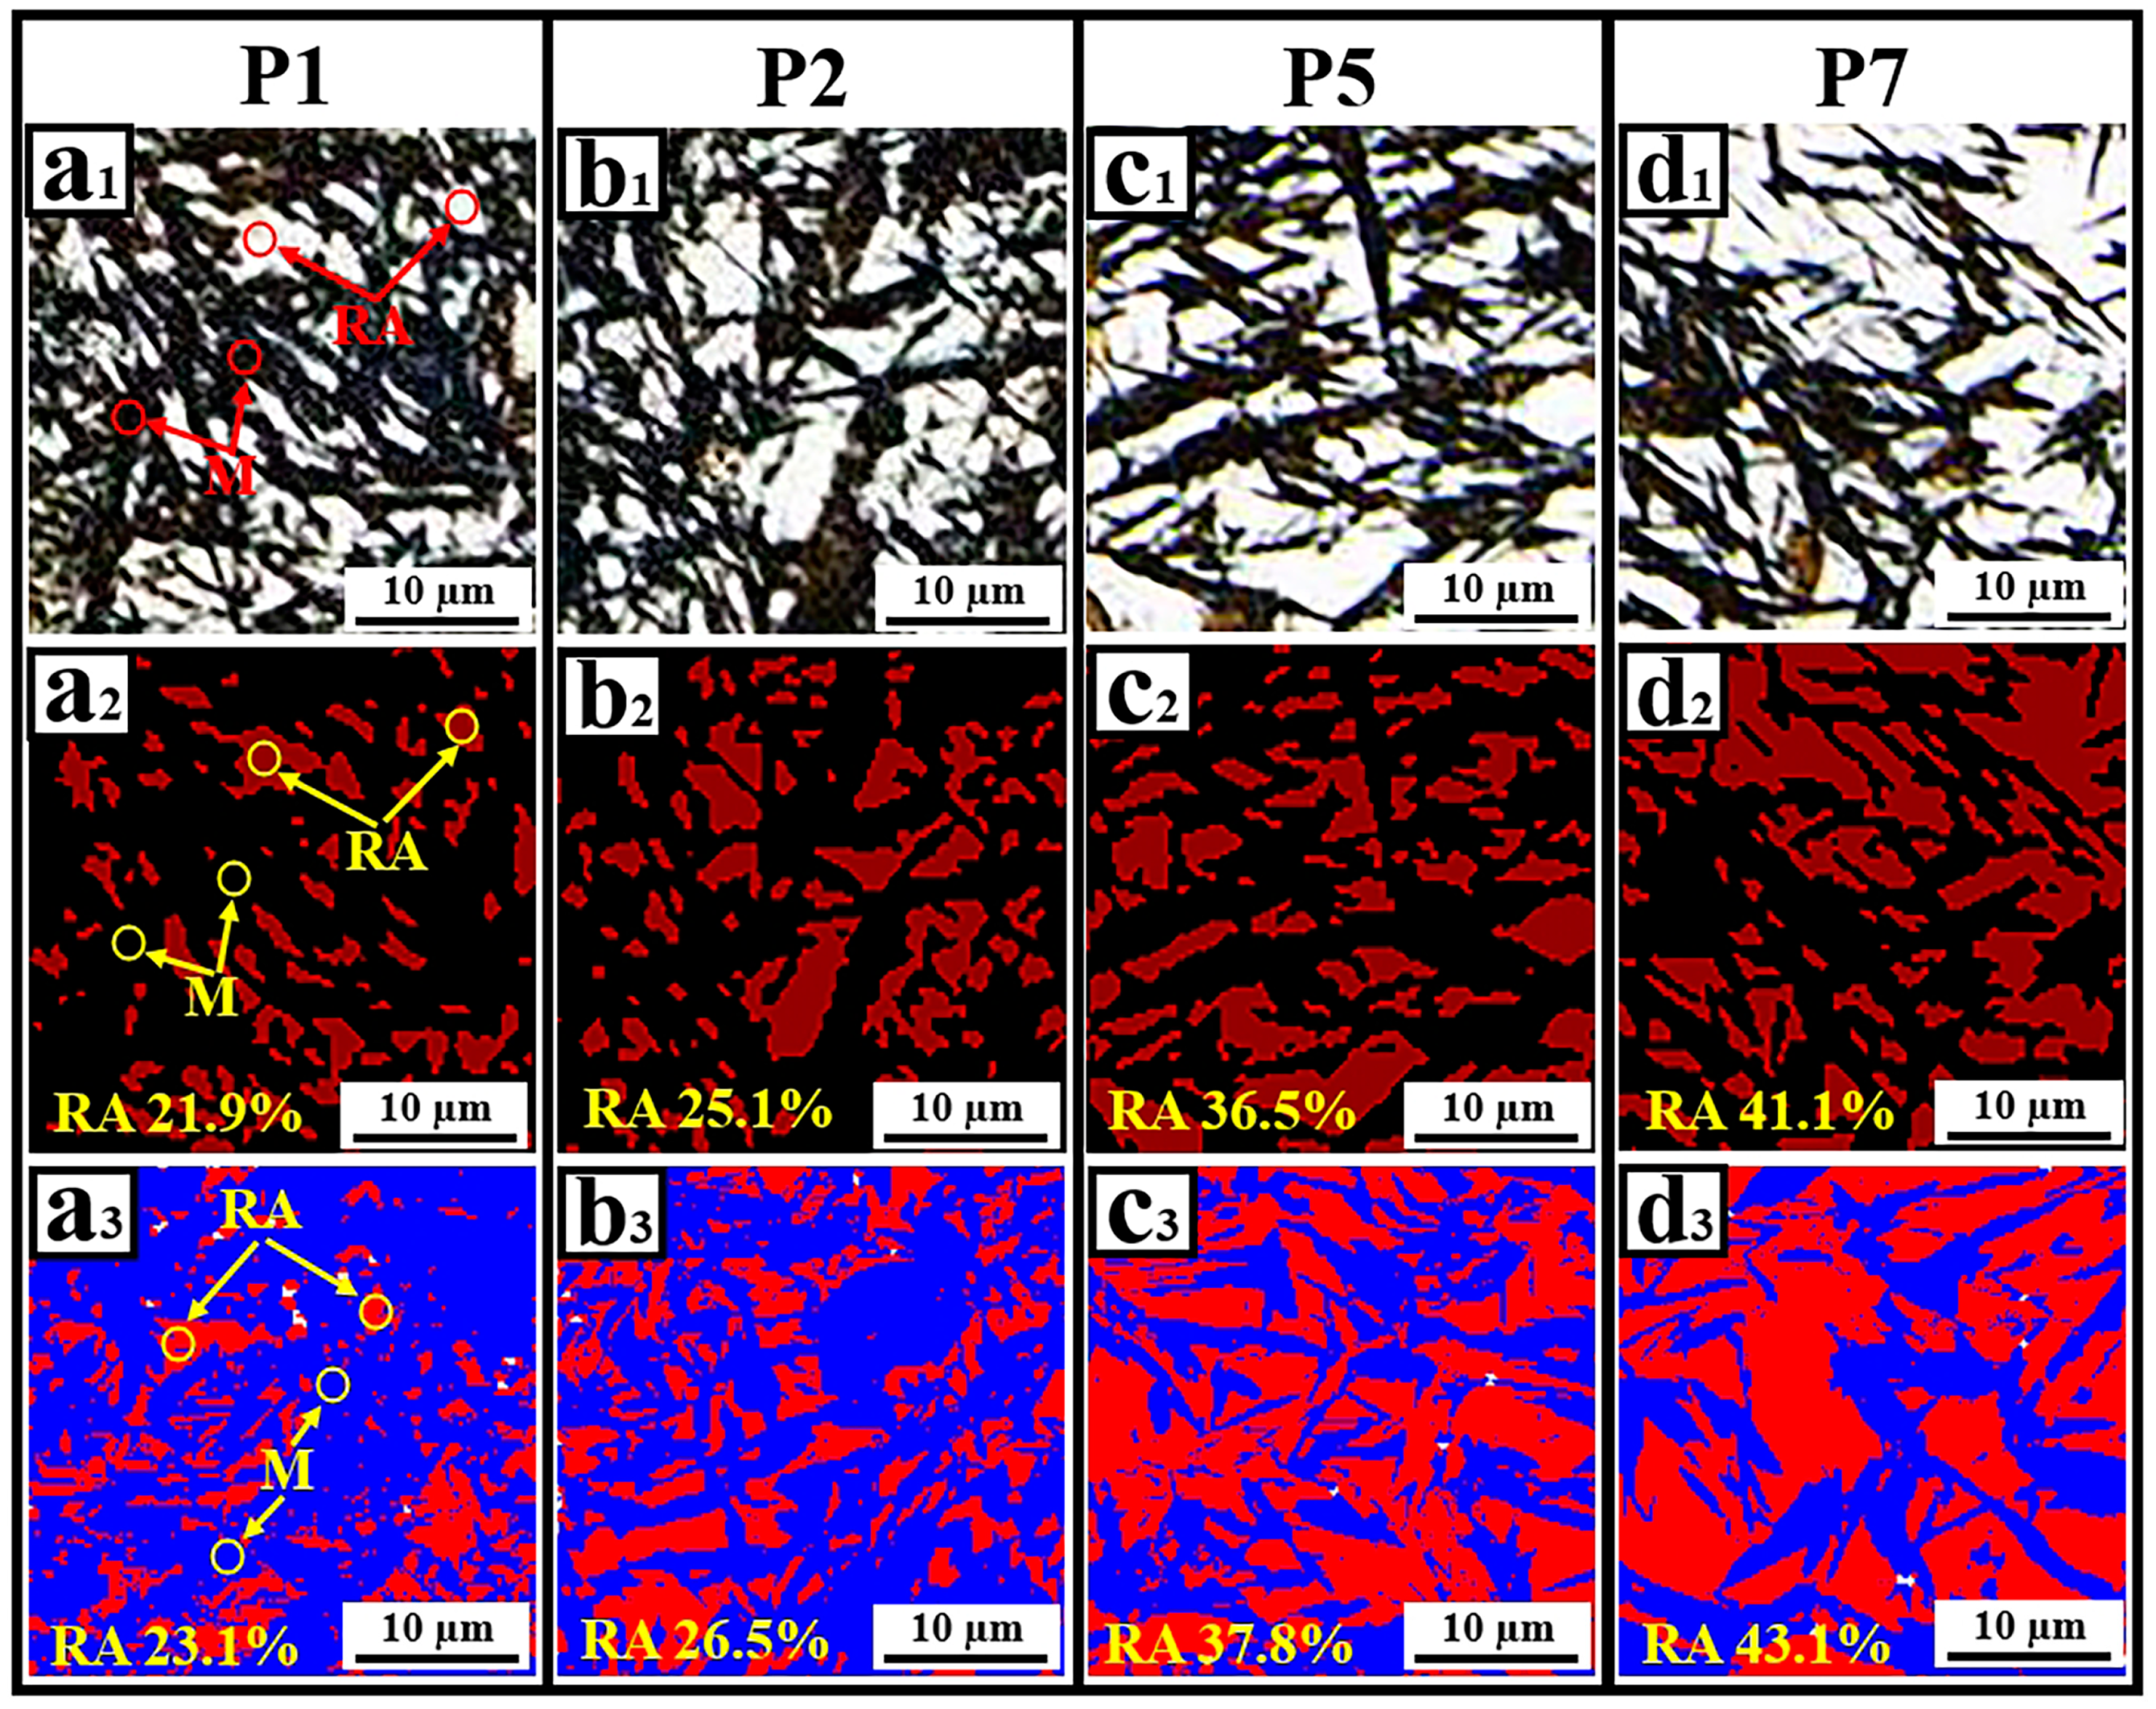
3.5. U-Net-6 Model for Residual Austenite Segmentation in the Carburized Layer Compared to EBSD

Figure 11 shows the segmentation recognition and EBSD comparative analysis of the metallographic images of the carburized surface treated by four different carburizing processes, P1, P2, P5, and P7, using the U-Net-6 algorithm. Figure 11(a1) shows the microstructure of the carburized surface layer of process P1, and Figure 11(a2) shows the segmentation of the residual austenite and martensite in the microstructure by the U-Net-6 model. The segmentation result of the residual austenite in Figure 11(a1) by the U-Net-6 model is 21.9%, and Figure 11(a3) shows the EBSD image of the carburized surface layer of process P1. The percentage content of residual austenite identified by EBSD is 23.1%, and the segmentation results of the U-Net-6 model for residual austenite have an error of 5.2% compared to the EBSD recognition results. Similarly, the segmentation results of residual austenite in the carburized surface microstructure of processes P2, P5, and P7 using the U-Net-6 model were 25.1%, 36.5%, and 41.1%, respectively, and the recognition results of residual austenite in the surface microstructure of processes P2, P5, and P7 carburization by EBSD were 26.5%, 37.8%, and 43.1%, respectively. The segmentation results of the U-Net-6 model for residual austenite on the carburized surface of processes P2, P5, and P7 were compared with the EBSD recognition results, with errors of 5.3%, 3.4%, and 4.6%. The segmentation results of the U-Net-6 model and the EBSD recognition results are approximately 5%, indicating that the U-Net-6 model has high accuracy in segmenting the microstructure of the carburized layer and is suitable for this experiment.

4. Conclusions

This paper identifies and analyzes the microstructure of a carburized layer by using a deep convolutional neural network, selects different carburizing processes for the surface treatment of 23CrNi3Mo steel, collects many metallographic pictures of the carburized layer based on laser confocal microscopy, and builds an MCLD database for training and testing. By comparing five deep learning algorithms, a basic model suitable for the MCLD database is identified and optimized. The research results are expected to replace the expensive and cumbersome residual austenite experimental testing through deep learning and processing of metallographic images, providing new methods to identify and calculate residual austenite in low-carbon steel carburizing layers and laying a theoretical foundation for optimizing carburizing processes. The specific conclusions are as follows:
(1)
Five neural network models based on deep learning—an FCN, U-Net, DeepLabv3+, PSPNet, and ICNet—were trained on the self-built 23CrNi3Mo steel carburized layer microstructure dataset (MCLD). The experimental results show that the U-Net model has the best segmentation effect on the microstructure of the carburized layer, with three evaluation indicators: MIOU of 0.75, MPA of 0.89, and MFWIOU of 0.83.
(2)
After optimizing the U-Net model, it is found that the U-Net-6 model, after replacing the activation function RELU with Mish and adding an attention mechanism and regularization treatment, has more advantages for the metallographic structure segmentation of the carburized layer. The evaluation indexes MIOU, MPA, and MFWIOU of the U-Net-6 model for microstructure segmentation are 0.76, 0.92, and 0.85, respectively.
(3)
Segmentation recognition and EBSD comparative analysis were performed on the metallographic images of the carburized surface treated with four different carburizing processes—P1, P2, P5, and P7—using the U-Net-6 algorithm. The segmentation results of the U-Net-6 model for residual austenite on the carburized surface of processes P1, P2, P5, and P7 were compared with the EBSD recognition results, with errors of 5.2%, 5.3%, 3.4%, and 4.6%, respectively.

Author Contributions

Conceptualization, B.G. and Z.Z.; Methodology, B.G. and Z.Z.; Software, B.G. and Z.Z.; Validation, B.G. and Z.Z.; Formal Analysis, B.G. and Z.Z.; Data Curation, B.G. and Z.Z.; Writing—Original Draft Preparation, B.G. and Z.Z.; Writing—Review & Editing, B.G. and Z.Z. All authors have read and agreed to the published version of the manuscript.

Funding

The authors acknowledge support from the Natural Science Foundation of Guizhou Province (Grant No. ZK [2024]-419).

Data Availability Statement

The datasets presented in this article are not readily available because the data are part of an ongoing study.

Conflicts of Interest

Author Boxiang Gong was employed by the company Guizhou Xishan Technology Co., Ltd. The remaining author declares that the research was conducted in the absence of any commercial or financial relationships that could be construed as a potential conflict of interest.

References

  1. Bodyakova, A.; Belyakov, A. Microstructure and Mechanical Properties of Structural Steels and Alloys. Materials 2023, 16, 5188. [Google Scholar] [CrossRef]
  2. Xiao, H.; Zhang, C.; Zhu, H. Effect of direct aging and annealing on the microstructure and mechanical properties of AlSi10Mg fabricated by selective laser melting. Rapid Prototyp. J. 2023, 29, 118–127. [Google Scholar] [CrossRef]
  3. Jiang, H.; Zhang, Z.-X. Effect of annealing temperature on microstructure and mechanical properties of nanocrystalline Incoloy800 alloy. J. Plast. Eng. 2023, 30, 184–190. [Google Scholar] [CrossRef]
  4. Ma, G.; Zhu, S.; Wang, D.; Xue, P.; Xiao, B.; Ma, Z. Effect of heat treatment on microstructure, mechanical properties, and fracture behaviors of ultra-high strength SiC/Al-Zn-Mg-Cu composite. Int. J. Miner. Metall. Mater. 2024. [Google Scholar] [CrossRef]
  5. Itoh, A.; Imafuku, M. Applicability Limit of X-ray Line Profile Analysis for Curved Surface by Micro-focus XRD. Tetsu-to-Hagane 2023, 109, 267–276. [Google Scholar] [CrossRef]
  6. Bolzoni, L.; Yang, F. X-ray Diffraction for Phase Identification in Ti-Based Alloys: Benefits and Limitations; IOP Publishing Ltd.: Bristol, UK, 2024. [Google Scholar] [CrossRef]
  7. Peruzzo, L. Electron Backscatter Diffraction (EBSD); American Cancer Society: Atlanta, GA, USA, 2018. [Google Scholar] [CrossRef]
  8. Gardner, J.; Wallis, D.; Hansen, L.N.; Wheeler, J. Weighted Burgers Vector analysis of orientation fields from high-angular resolution electron backscatter diffraction. Ultramicroscopy 2024, 257, 113893. [Google Scholar] [CrossRef] [PubMed]
  9. Impraimakis, M. A convolutional neural network deep learning method for model class selection. Earthq. Eng. Struct. Dyn. 2024, 53, 784–814. [Google Scholar] [CrossRef]
  10. Gertsvolf, D.; Horvat, M.; Aslam, D.; Khademi, A.; Berardi, U. A U-net convolutional neural network deep learning model application for identification of energy loss in infrared thermographic images. Appl. Energy 2024, 360, 122696. [Google Scholar] [CrossRef]
  11. Masci, J.; Meier, U.; Ciresan, D.; Schmidhuber, J.; Fricout, G. Steel Defect Classification with Max-pooling Convolutional Neural Networks. In Proceedings of the 2012 International Joint Conference on Neural Networks (IJCNN), Brisbane, QLD, Australia, 10–15 June 2012. [Google Scholar]
  12. Long, J.; Shelhamer, E.; Darrell, T. Fully convolutional networks for semantic segmentation. In Proceedings of the IEEE Conference on Computer Vision and Pattern Recognition (CVPR), Boston, MA, USA, 7–12 June 2015. [Google Scholar]
  13. Azimi, S.M.; Britz, D.; Engstler, M.; Fritz, M.; Mücklich, F. Advanced Steel Microstructural Classification by Deep Learning Methods. Sci. Rep. 2018, 8, 2128. [Google Scholar] [CrossRef]
  14. Bulgarevich, D.S.; Tsukamoto, S.; Kasuya, T.; Demura, M.; Watanabe, M. Pattern recognition with machine learning on optical microscopy images of typical metallurgical microstructures. Sci. Rep. 2018, 8, 2078. [Google Scholar] [CrossRef]
  15. Pustovoit, V.N.; Dolgachev, Y.I. Structural State of Martensite and Retained Austenite in Carbon Steels after Quenching in Magnetic Field. Met. Sci. Heat Treat. 2023, 64, 688–692. [Google Scholar] [CrossRef]
  16. Sun, D.; Wang, H.; An, X. Quantitative evaluation of the contribution of carbide-free bainite, lath martensite, and retained austenite on the mechanical properties of C-Mn-Si high-strength steels. Mater. Charact. 2023, 199, 112802. [Google Scholar] [CrossRef]
  17. Shen, C.; Wang, C.; Wei, X.; Li, Y.; van der Zwaag, S.; Xu, W. Physical metallurgy-guided machine learning and artificial intelligent design of ultrahigh-strength stainless steel. Acta Mater. 2019, 179, 201–214. [Google Scholar] [CrossRef]
  18. Datta, S.; Pettersson, F.; Ganguly, S.; Saxén, H.; Chakraborti, N. Designing High Strength Multiphase Steel for Improved Strength–Ductility Balance Using Neural Networks and Multiobjective Genetic Algorithms. ISIJ Int. 2007, 47, 1195–1203. [Google Scholar] [CrossRef]
  19. Aristeidakis, J.S.; Haidemenopoulos, G.N. Composition and processing design of medium-Mn steels based on CALPHAD, SFE modeling, and genetic optimization. Acta Mater. 2020, 193, 291–310. [Google Scholar] [CrossRef]
  20. Wang, H.; Liu, S.; Yao, Z. Prediction of mechanical properties of AZ91 magnesium alloys based on genetic neural network. J. Jiangsu Univ. (Nat. Sci. Ed.) 2006, 27, 67–70. [Google Scholar]
  21. Chen, Q.; Xu, J.; Koltun, V. Fast Image Processing with Fully-Convolutional Networks. In Proceedings of the 2017 IEEE International Conference on Computer Vision (ICCV), Venice, Italy, 22–29 October 2017. [Google Scholar] [CrossRef]
  22. Chen, X.; Tang, X.; Xiong, J.; He, R.; Wang, B. Pore characterization was achieved based on the improved U-net deep learning network model and scanning electron microscope images. Pet. Sci. Technol. 2024, 1–5. [Google Scholar] [CrossRef]
  23. Zheng, N. A Co-Point Mapping-Based Approach to Drivable Area Detection for Self-Driving Cars. Engineering 2018, 4, 479–490. [Google Scholar]
  24. Zhao, G.; Zhang, Y.; Ge, M.; Yu, M. Bilateral U-Net semantic segmentation with spatial attention mechanism. CAAI Trans. Intell. Technol. 2023, 8, 297–307. [Google Scholar] [CrossRef]
  25. Wang, Y.; Luo, L.; Zhou, Z. Road scene segmentation based on KSW and FCNN. J. Image Graph. 2019, 24, 4. [Google Scholar]
  26. Zhang, Y.; Wang, J.; Wang, X.; Dolan, J.M. Road-Segmentation-Based Curb Detection Method for Self-Driving via a 3D-LiDAR Sensor. IEEE Trans. Intell. Transp. Syst. 2018, 19, 3981–3991. [Google Scholar] [CrossRef]
  27. Xue, F.F.; Peng, J.; Wang, R.; Zhang, Q.; Zheng, W.S. Improving Robustness of Medical Image Diagnosis with Denoising Convolutional Neural Networks. In Proceedings of the International Conference on Medical Image Computing and Computer-Assisted Intervention, Shenzhen, China, 13–17 October 2019. [Google Scholar] [CrossRef]
  28. Yang, C.; Guo, H.; Yang, Z. A Method of Image Semantic Segmentation Based on PSPNet. Math. Probl. Eng. 2022, 2022, 8958154. [Google Scholar] [CrossRef]
  29. Wang, W. Using PSPNet and UNet to analyze the internal parameter relationship and visualization of the convolutional neural network. 2020. ArXiv 2020, arXiv:2008.03411. [Google Scholar] [CrossRef]
  30. Zhao, H.; Qi, X.; Shen, X.; Shi, J.; Jia, J. ICNet for Real-Time Semantic Segmentation on High-Resolution Images; Springer: Cham, Switzerland, 2018. [Google Scholar] [CrossRef]
  31. Ming, D.; Du, J.; Zhang, X.; Liu, T. Modified average local variance for pixel-level scale selection of multiband remote sensing images and its scale effect on image classification accuracy. Am. Hist. Rev. 2013, 96, 3565. [Google Scholar] [CrossRef]
  32. Darling, D.A. Low-Frequency Expansions for Scattering by Separable and Nonseparable Bodies. J. Acoust. Soc. Am. 1965, 37, 228–234. [Google Scholar] [CrossRef]
  33. Pazhanikumar, K.; Kuzhalvoimozhi, S.N. Remote sensing image classification using modified random forest with empirical loss function through crowd-sourced data. Multimed. Tools Appl. 2024, 83, 53899–53921. [Google Scholar] [CrossRef]
Figure 1. Comparison between before and after processing.
Metals 14 00761 g001
Figure 2. FCN Image Segmentation Model.
Metals 14 00761 g002
Figure 3. U-Net Image Segmentation Model.
Metals 14 00761 g003
Figure 4. DeepLabv3_plus model running diagram.
Metals 14 00761 g004
Figure 5. PSPNet segmentation model diagram.
Metals 14 00761 g005
Figure 6. ICNet Image Segmentation Model.
Metals 14 00761 g006
Figure 7. (a) Microstructure image of carburizing process P4 (strong carburization for 120 min, diffusion for 240 min), (b) segmentation of 116 × 116 pixels in carburizing process P4, (c) manual labeling of images using LabelMe software, (d) conversion of .png images in JSON format.
Metals 14 00761 g007
Figure 8. (a1) FCN Segmentation accuracy evaluation indicators, (a2) FCN Loss Function, (b1) U-Net Segmentation accuracy evaluation indicators, (b2) U-Net Loss Function, (c1) DeepLabV3 Segmentation accuracy evaluation indicators, (c2) DeepLabV3 Loss Function, (d1) PSPNet Segmentation accuracy evaluation indicators, (d2) PSPNet Loss Function, (e1) ICNet Segmentation accuracy evaluation indicators, (e2) ICNet Loss Function.
Metals 14 00761 g008aMetals 14 00761 g008b
Figure 9. Segmentation results of four sets of microstructure pictures of the carburized layer by five convolutional neural network models, namely, FCN, U-Net, DeepLabV3, PSPNet, and ICNet.
Metals 14 00761 g009
Figure 10. The segmentation results from four sets of microstructure images of the carburized layer using optimized U-Net models from U-Net-1 to U-Net-8.
Metals 14 00761 g010
Figure 11. (a1,b1,c1,d1) shows the microstructure of the carburized surface layer of carburized processes P1, P2, P5, and P7 (where black is high-carbon martensite and white is residual austenite), (a2,b2,c2,d2) shows the segmentation diagram of the UNEt-6 model for the microstructure of the carburized surface layer of carburized processes P1, P2, P5 and P7 (where black is high-carbon martensite and red is residual austenite), and (a3,b3,c3,d3) shows the carburized processes P1, P2, EBSD diagram of the carburized surface layer of P5 and P7 (where blue is high-carbon martensite and red is residual austenite).
Metals 14 00761 g011
Table 1. Heat treatment process.
Carburization ProcessesOil Quenching Temperature (°C)Tempering Temperature (°C)Tempering Time (h)
Carburizing Temperature (°C)Boost Stage Time (h)Diffusion Stage Time (h)
P1930128602002
P213
P314
P424
P525
P626
P735
Table 2. Evaluation indicators of different neural network models for image segmentation of carburized layer microstructure.
ModelMIOUMPAMFWIOU
FCN0.500.810.68
U-Net0.750.890.83
DeepLabv3+0.640.840.75
PSPNet0.550.810.70
ICNet0.540.800.69
Table 3. Evaluation index of the segmentation model of the microstructure image after optimization of the U-Net convolutional neural network model.
ModelMIOUMPAMFWIOU
U-Net0.750.890.83
U-Net-10.740.890.83
U-Net-20.740.890.82
U-Net-30.750.900.83
U-Net-40.750.900.83
U-Net-50.750.900.83
U-Net-60.760.920.85
U-Net-70.750.900.83
U-Net-80.750.890.83
Disclaimer/Publisher’s Note: The statements, opinions and data contained in all publications are solely those of the individual author(s) and contributor(s) and not of MDPI and/or the editor(s). MDPI and/or the editor(s) disclaim responsibility for any injury to people or property resulting from any ideas, methods, instructions or products referred to in the content.

