Article

Numerical Study on Fretting Wear of DZ125/FGH99 Tenon/Mortise Joint Structure

1
Key Laboratory of High Efficiency and Clean Mechanical Manufacture (Ministry of Education), Shandong University, Jinan 250061, China
2
School of Mechanical Engineering, Shandong University, Jinan 250061, China
3
State Key Laboratory of Reliability and Intelligence of Electrical Equipment, School of Mechanical Engineering, Hebei University of Technology, Tianjin 300130, China
*
Authors to whom correspondence should be addressed.
Metals 2024, 14(7), 830; https://doi.org/10.3390/met14070830
Submission received: 28 June 2024 / Revised: 15 July 2024 / Accepted: 18 July 2024 / Published: 19 July 2024

Abstract

:
Fretting wear in the contact area between the aero-engine blade tenon and turbine disk mortise has an important influence on the performance of the aero-engine. In this paper, the tenon joint structure of the DZ125/FGH99 superalloy material is taken as the research object, and the finite element model of the fir-tree tenon joint structure is established. Through subroutine invocation and mesh adaptive control technology, the fretting wear problem of dissimilar material contact pairs under composite load is numerically studied. The results show that for the specific tenon joint structure and load and boundary conditions studied in this paper, the maximum wear occurs on the contact surface of the first tooth, and the surface will show different partial slip states in different load cycles. The slip region always extends from the two contact edges to the interior, and the upper side has a larger range. Wear has a significant effect on the stress distribution and stick–slip state of the contact surface. The second and third teeth have a small amount of wear and are basically in a stick state during the entire wear process. Therefore, wear has little effect on the stress distribution and the stick–slip state of the contact surface. This study reveals the coupling relationship between the fretting wear and contact state of the tenon joint structure.

1. Introduction

Aero-engine turbine components are in service under the extreme environmental conditions of high temperature and high speed, which puts forward strict requirements for the performance of superalloy materials used in blades and discs [1,2]. As the main material of aero-engine blades, cast superalloys have been widely used due to their excellent properties and low costs. From equiaxed crystal and directional casting crystal to single crystal, the temperature bearing capacity of cast superalloys has been gradually improved [3,4,5]. Powder superalloy has the characteristics of uniform structure and fine grains, which can significantly improve the mechanical and thermal properties of alloys, and are widely used in the turbine disk structure of aero-engines [6,7]. Aero-engine turbine components are subjected to complex centrifugal, aerodynamic, temperature, vibration, and other loads, and its contact surfaces are susceptible to wear and fatigue cracks, which ultimately lead to structural damage. Among them, fatigue-related failures account for 49% of the overall failure modes [8]. Under the combined action of high- and low-cycle loads, the contact surface of the tenon joint structure tends to slip slightly, which eventually leads to fretting fatigue failure. Fretting fatigue can cause crack nucleation when the stress level is lower than 20~30% of the conventional fatigue strength, which seriously weakens the fatigue performance of the structure [9]. Cyclic contact stress and wear on the contact surface will continuously peel off the surface material and form wear scars, thereby promoting fretting fatigue crack nucleation. Therefore, the fretting wear of the contact area between the tenon and the mortise is one of the key factors affecting the fatigue life of the aero-engine turbine and blade.
Fretting theory is a complex theoretical system considering tribology, contact mechanics, and fatigue theory. There are many variables affecting fretting behavior, mainly normal load, friction coefficient, and slip amplitude, and there is also a mutual coupling relationship between these variables. The stick–slip state of the contact interface in the fretting process is divided into three types: stick, partial slip, and gross slip. The damage mechanism in the dominant state is different [10]. According to the different profiles of contact objects and the difference in contact stress distribution on the contact surface, the contact types are mainly divided into two categories, namely complete contact and incomplete contact [11]. The tenon joint structure between the root of the aero-engine blade and the edge of the disk is a typical incomplete contact form. Each contact pair can be simplified as a half-plane incomplete contact problem [12]. For the problem of incomplete contact partial slip in the half-plane, many scholars have conducted in-depth research and gradually constructed a complete theoretical system [13,14,15,16,17].
Due to the availability of the closed-form solution of the elastic half-plane contact, many analysis works are based on this theory. However, the application of this theory is limited by assumptions such as material idealization and geometric simplification. With the improvement of computer computing power and the development of numerical simulation software, numerical simulation of fretting problems has gradually become a reality. The finite element method is widely used in various studies because of its high fidelity and ability to capture the size effect of fretting fatigue. In terms of the fretting wear mechanism, researchers have explored the effects of displacement amplitude, frequency, and material properties (such as elastic modulus, hardness, and friction coefficient) on fretting wear through experimental and theoretical models of different contact configurations (spherical/plane, cylindrical/plane, plane/plane) and contact modes (tangential, radial, torsional, and rotational) [18,19]. Based on the theory of cumulative dissipated energy and continuum damage mechanics, a finite element model can be established to predict and analyze the surface morphology, wear rate, and fatigue life of fretting wear [20,21]. At present, the numerical study of fretting wear of mortise–tenon joints is mainly based on the finite element method, and different types of wear models are established through subroutine development to study the fretting wear behavior of the structure [22]. These studies mainly focus on the influence of fretting direction, time, and load on fretting wear behavior, which not only reveals the distribution and evolution of the fretting wear of mortise and tenon joint structures but also discusses the influence of fretting wear on structural vibration characteristics and fatigue life [23]. In addition, some researchers have also focused on the relationship between fretting wear and fatigue crack initiation and propagation [24,25], as well as the effects of different processing techniques and material coatings on the fretting wear mechanism [26,27,28,29,30,31,32]. Through the combination of experiment and simulation, the complexity and diversity of the fretting wear mechanism are revealed, which provides an important theoretical basis for the optimal design and maintenance of mortise–tenon joint structures [33,34,35,36].
In summary, the research on fretting wear problems is mainly based on simple contact configurations (such as spherical/plane, cylindrical/plane, and plane/plane contact). There are few studies on the fretting wear characteristics of tenon joints of dissimilar superalloy materials. Secondly, the coupling relationship between the stick–slip state and fretting wear of the contact surface is not clear. Aiming at the fretting wear problem of the tenon joint structure of DZ125/FGH99 superalloy materials under combined loads, this paper establishes a finite element model of a three-tooth fir-tree tenon joint structure, applies high- and low-cycle loads, and combines the ABAQUS 2021 UMESHMOTION subroutine based on the Archard wear theory to perform finite element analysis. The development of fretting wear on the contact surface of the tenon joint structure, as well as stress distribution and the evolution of stick–slip state during different cycles, are obtained, and the coupling relationship between fretting wear and contact state is further analyzed.

2. Theoretical Foundation

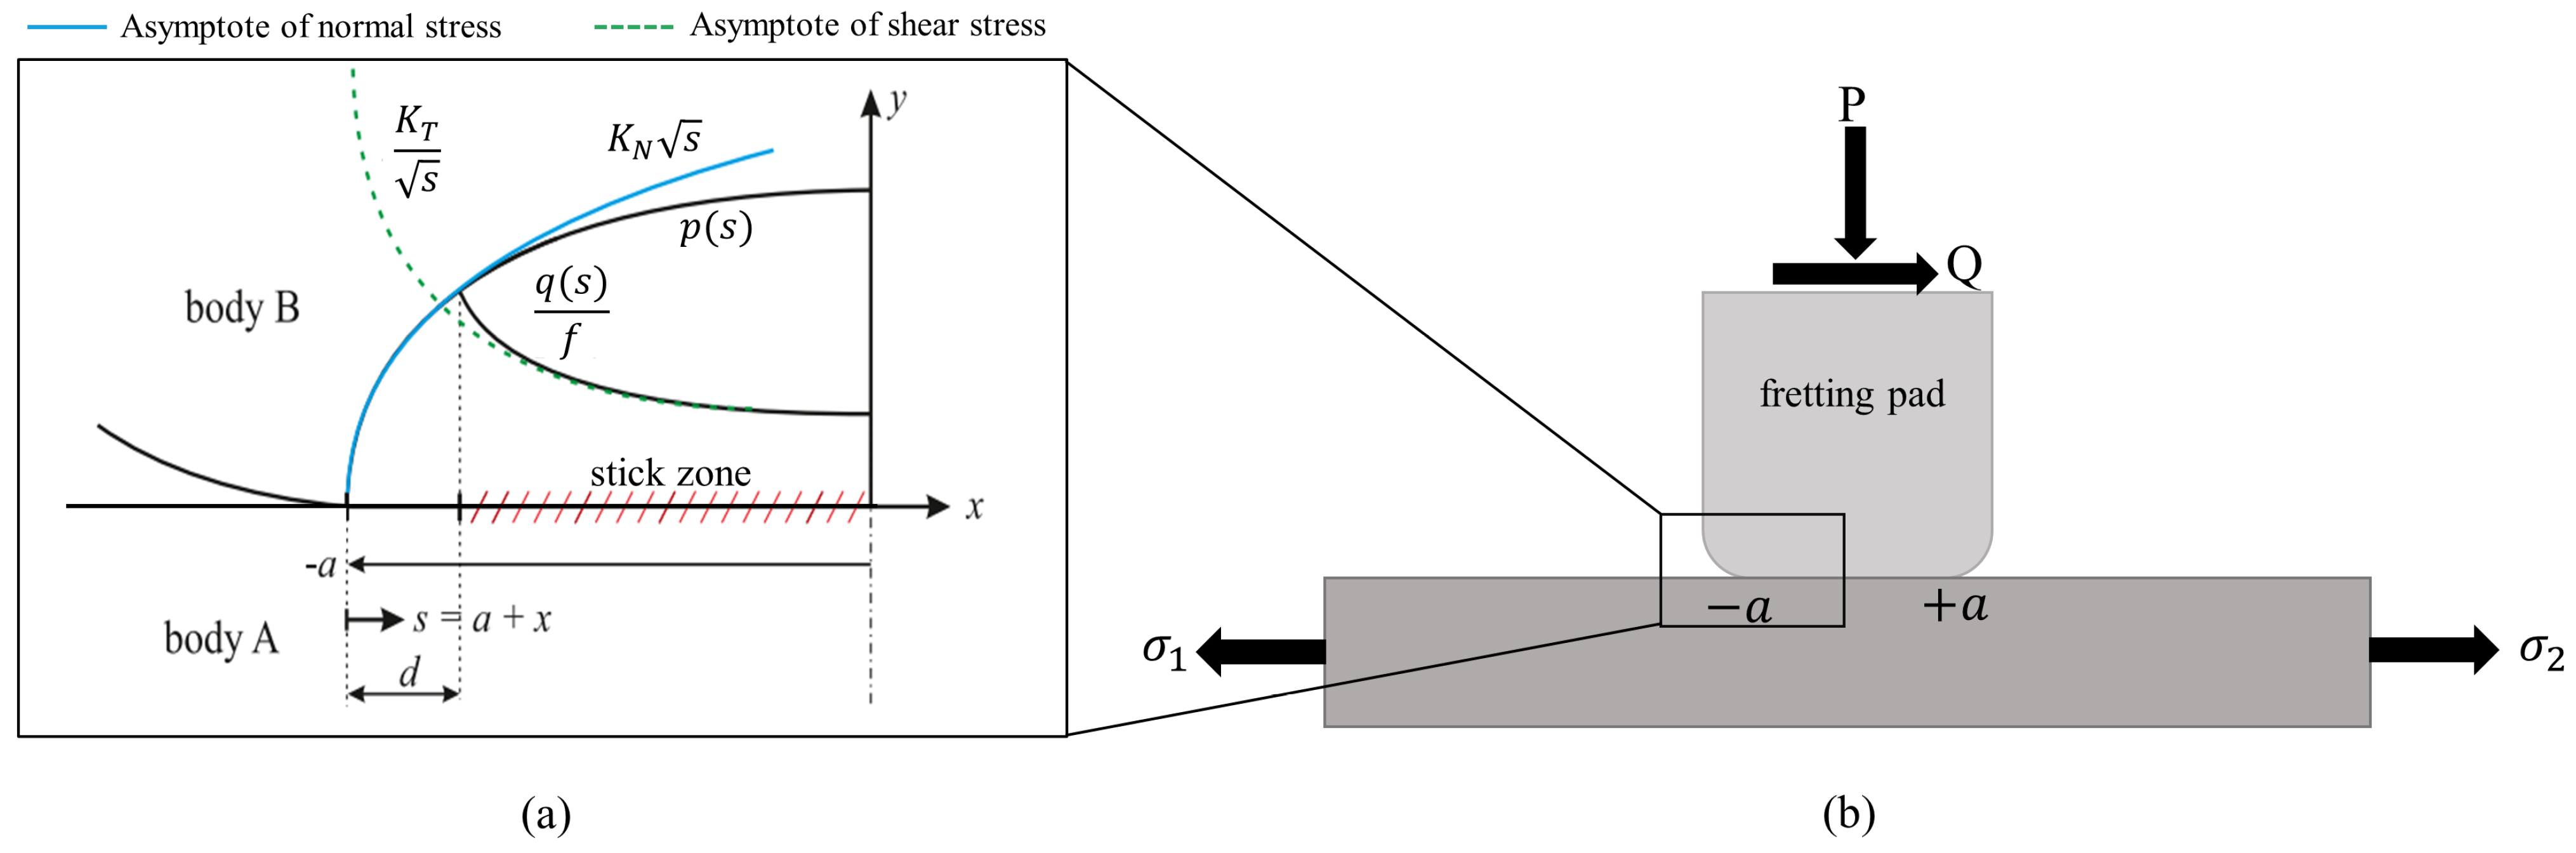
2.1. Asymptotic Approach for Incomplete Half-Plane Contacts

Due to the limitation of the theoretical solution of the incomplete contact partial slip problem, it is impossible to obtain the closed-form solution for more general geometric contact forms and more complex load conditions. The asymptotic method can compare the contact behavior of different geometric edges according to the local stress state [37], which has big advantages in that it (a) is independent of the overall contact geometry, (b) removes the need for symmetry/anti-symmetry across the whole contact, and (c), as a consequence of (a), may be used as quantifiers of fretting fatigue enabling laboratory specimens test to be applied to very different problems.
Initially, we assume that an incomplete contact of half-width a is fully stuck, so that the local shearing traction distribution, q ( x ) , at the left-hand edge of the contact, x a + , is given by
q x = K T x + a = K T s
where s = a + x (see Figure 1) and the generalized stress intensity factor, K T , may be induced by a shear force, Q , or a differential bulk tension, σ 0 .
K T = ± Q π 2 a + σ 0 2 a 2
Note that this result is wholly independent of the geometry of the problem in cases where the body may be thought of as a half-plane. The contact problem will be assumed to be uncoupled, and so we may write the local contact pressure at the end x a + in the form
p x = K N a + x = K N s
Here, the value of the generalized stress intensity factor, K N , is geometry dependent.
K N = 1 π 2 a d P d a
Here, P is the normal load on the contact giving rise to a contact of half-width a . Note that only a limited number of problems will have a closed-form contact law. For these, an analytical equation for K N may also be obtained. For more complex problems, a semi-analytical formulation may be obtained by using the finite element method to find the calibration.
When both the shear and normal forces applied to the contact change, and meet the condition: d Q d P < f . In this case, the additional near-edge shear traction is given by
q x = K Q s
where the generalized intensity factor K Q may be obtained from the normal generalized stress intensity factor as
K Q = ± d Q d P + π a 4 d σ 0 d P K N
A more general representation of the bounded shear intensity factor, K Q , was also given by Hills et al. [38]. Although more restrictive in its range of application, Equation (6) is more convenient to use and provides a good approximation in the range where the asymptotic approach is valid.
In the following, we will use the asymptotic form of the contact edge stress distribution to evaluate the influence of mesh accuracy on the calculation results and determine the most suitable mesh size for the wear finite element analysis.

2.2. Wear Model

The wear simulation used in this paper is based on the classical Archard equation [39], which is a commonly used model for sliding wear damage:
V = K P S H
where V is the wear volume, S is the sliding distance, K is the wear coefficient, P is the normal load, and H is the hardness of the material.
For a given point on one of the contacting surfaces, Equation (7) can be expressed as
h S = k l p
where h is the wear depth (mm), k l is the dimensional local wear coefficient, defined as the wear per unit local slip per unit local contact pressure, and p is the contact pressure. The differential formulation of Equation (8) is
d h d S = k l p
McColl et al. [40] developed a numerical approach to simulate fretting wear using Equation (9). For a given contacting geometry, the initial distributions of contact pressure and relative slip between the contact surfaces are calculated by the finite element method. The modified Archard equation is then applied as follows:
Δ h x , t = k l p x , t δ x , t
where h x , t , p x , t , and δ ( x , t ) are the incremental wear depth, contact pressure, and relative slip at point x and time t , respectively.
Due to computational constraints, it is not efficient to model each cycle explicitly. Instead, a cycle jumping technique is employed, where the assumption is made that wear is constant over a small number of cycles. By multiplying the incremental wear by a cycle jumping factor Δ N , one FE cycle simulation is used to model the effect of Δ N actual wear cycles. Equation (10) becomes
Δ h x , t = Δ N k l p x , t δ x , t
Combined with the contact pressure and relative displacement data of the current increment, the improved wear model is used to calculate the wear increment of each node on the contact surface, and then the normal displacement of the node along the local surface is controlled. By repeating this process, the wear simulation can be realized. The method is implemented in ABAQUS by calling the UMESHMOTION subroutine and using the Arbitrary Lagrangian Eulerian adaptive meshing technology (ALE). The analysis process is shown in Figure 2.

3. Establishment of Fretting Wear Finite Element Model

We establish the finite element model of the fir-tree tenon joint structure in ABAQUS software and call the UMESHMOTION subroutine to realize the Archard wear process. The modeling process is described below.

3.1. Geometric Model Construction

Firstly, based on the structure of an engine turbine disk and blade, we retain the geometric characteristics of the tenon and the mortise, simplify the remaining structure, and establish a two-dimensional geometric model (Figure 3).

3.2. Definition of Material Properties

DZ125 is a kind of nickel-based precipitation-hardening directionally solidified columnar crystal superalloy. It is one of the highest-performance alloys in the same kind of alloy at a temperature below 1050 °C. It has been widely used to make directional hollow turbine rotor blades of advanced aero-engines. FGH4099 (or FGH99) is a powder metallurgy superalloy with high rupture strength, high creep resistance, and low crack growth rate. It is usually used at temperatures below 750 °C, and it is the key material for the preparation of high thrust–weight ratio engine turbine disks. Therefore, DZ125 is selected as the tenon material and FGH99 is selected as the mortise in this paper. The required material mechanics performance parameters are shown in Table 1, Table 2 and Table 3. Here, we do not consider the temperature as a variable, and we select the mechanical properties of two materials at room temperature (25 °C).

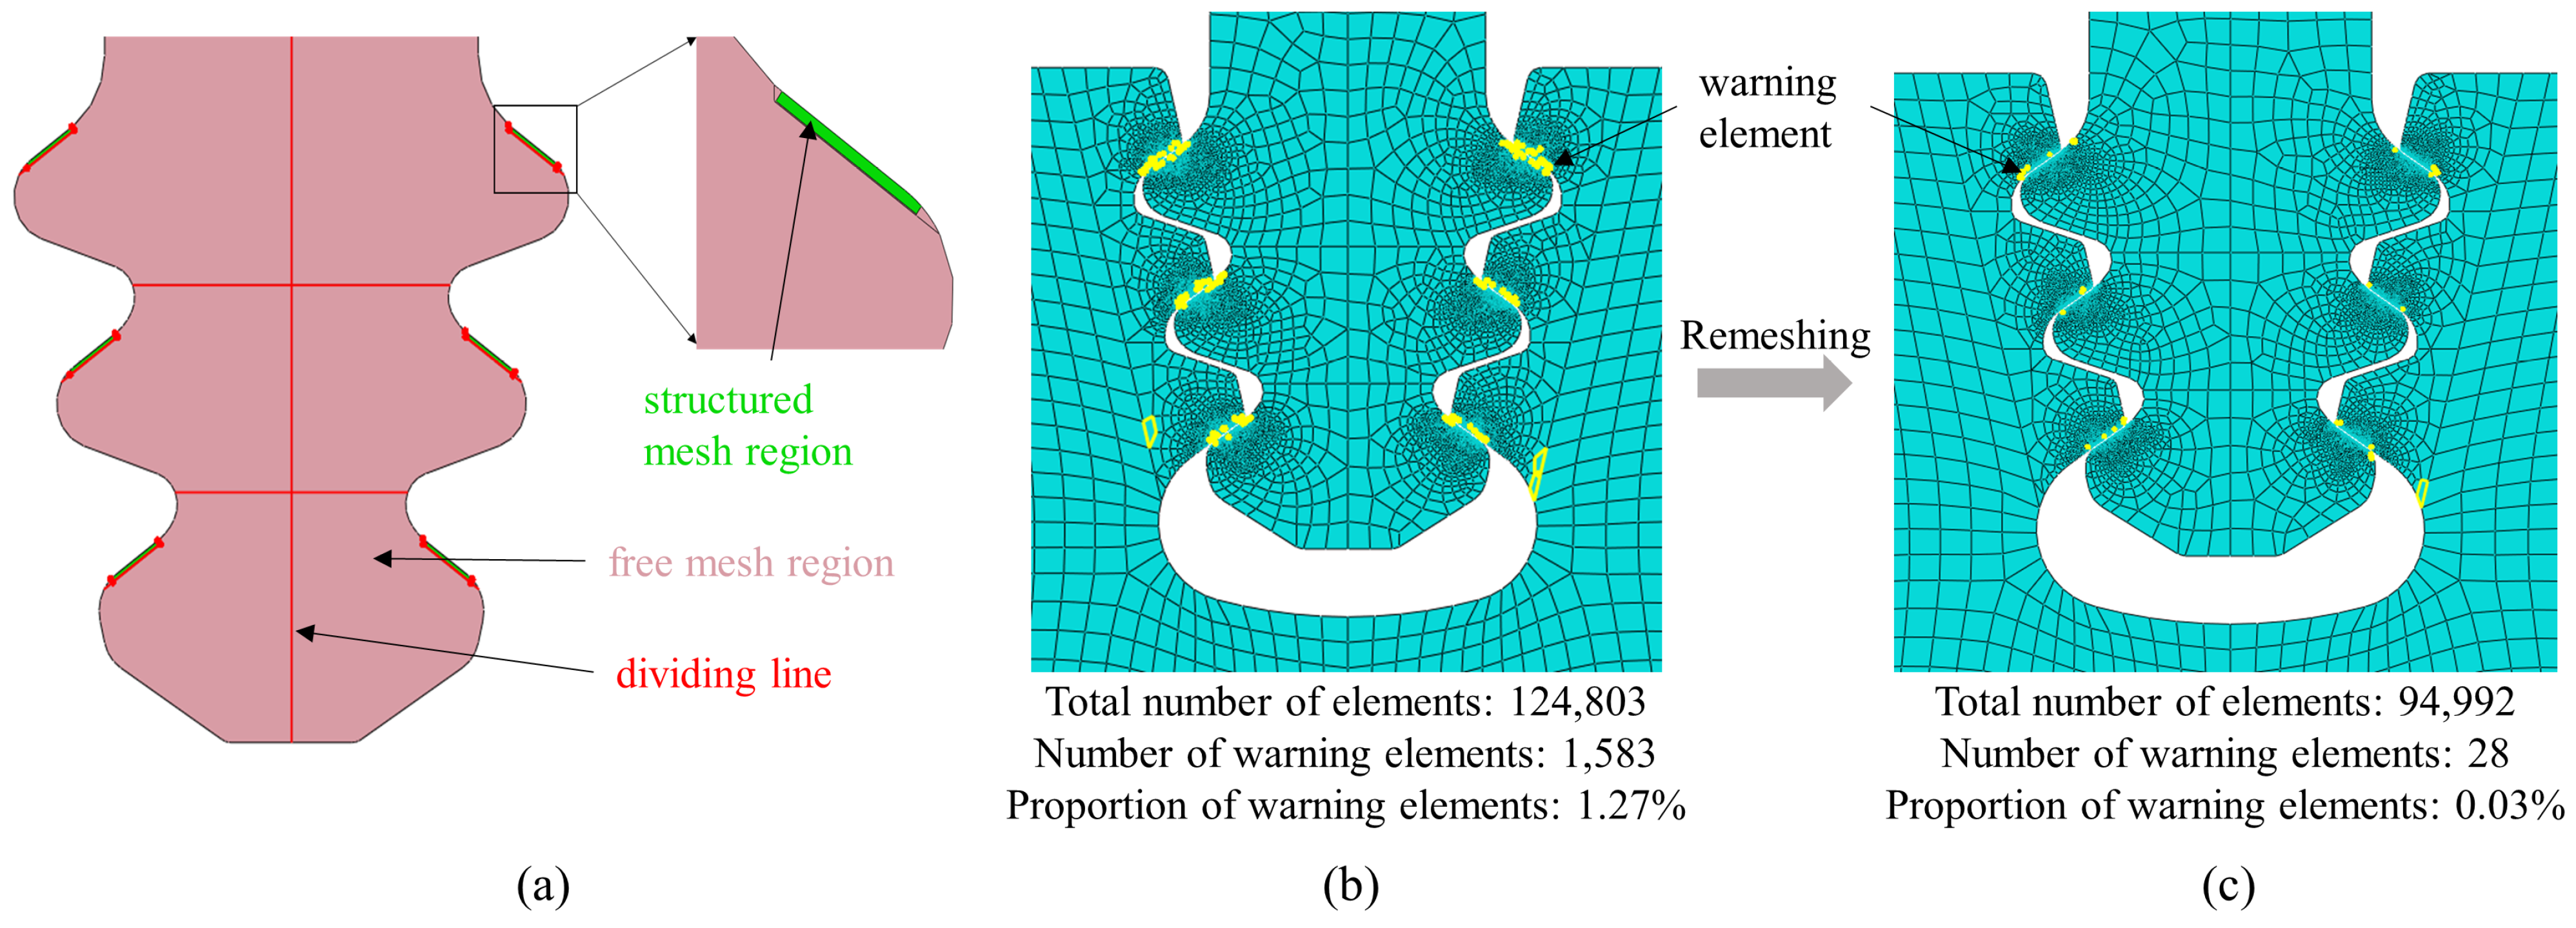
3.3. Mesh Generation Process

To improve the calculation accuracy and ensure that the finite element model captures the high stress gradient information at the contact edge, as well as to improve the computational efficiency, the contact region needs to be partitioned. The dividing line is shown by the red line in Figure 4a. The mesh control attribute of the contact area is assigned as a quadrilateral structured mesh with mesh encryption (green area in Figure 4a), and the rest is free mesh division based on the quadrilateral as the main mesh shape (red area in Figure 4a). The element type of the whole model is set as a four-node bilinear plane strain quadrilateral element (CPE4).
After the meshing is completed, it is necessary to check the shape, size, and quality of the mesh to find the elements that will cause errors or warning messages during the analysis process. If there are too many errors or warnings of elements, it is necessary to remove the current mesh and then re-segment the model, modify the parameters, and re-mesh the model. In the case of local and global element sizes being unchanged, errors and warnings of the model can be greatly reduced by properly setting the mesh of the transition regions, so that the calculation accuracy can be guaranteed (Figure 4b,c).

3.4. Analysis Step Settings

In order to impose nodal constraints through the subroutine, Static and General analysis steps need to be created and the geometric nonlinearity option turned on. The increment is controlled automatically, up to a maximum of 0.01, so that at least 20 incremental steps are needed to complete a high-cycle load cycle, ensuring the accuracy of the analysis.
The wear process is realized by applying displacement to the surface contact nodes. Therefore, we set the structured mesh region around each pair of contact zones as the ALE adaptive mesh control region (Figure 5a). We apply ALE adaptive mesh constraints to the contact surface nodes (Figure 5c). The meshing frequency is once per increment and the mesh smoothing algorithm is selected as the default.

3.5. Define Contact Properties, Loads, and Boundary Conditions

We define each pair of contacts as surface/surface contact and allow small slips (Figure 5e). The normal contact property of the contact surface is hard contact, the tangential property select penalty friction formula, and the friction coefficient is set to 0.3.
Two types of loads are applied at the reference point at the top of the blade. One is to simulate the low-cycle fatigue load caused by centrifugal load and temperature load along the radial direction, and the other is to simulate the high-cycle fatigue load caused by aerodynamic disturbance and system vibration along the circumferential direction (Figure 5b). Because the mortise structure is symmetrically distributed along the edge of the turbine disk, the circumferential symmetrical boundary conditions are set on both sides of the simplified model, and the fixed boundary conditions are set at the bottom (Figure 5d).
After the above settings are completed, the subroutine will be called to carry out the wear simulation process.

4. Results and Discussion

4.1. The Influence of Element Size on the Accuracy of Numerical Calculations

The element size of the contact area has a great influence on the accuracy of the calculation results. In order to determine the optimal element size of the contact area during the numerical analysis of fretting wear, mesh independence analysis is necessary. Firstly, we set the contact surface of the tenon joint finite element model to a fully stick state and apply a constant radial force on the top. Then, we change the element size of the structured mesh in the contact area and perform multi-group statics analysis.
Figure 6e is the von Mises stress distribution of the structure. It can be seen that the stress concentration occurs at the contact edge of the mortise and tenon teeth. Figure 6b is the normal and shear stress distribution of the first tooth. We only take the stress distribution at the lower edge ( x a ) of the contact area as the research object. The stress of five element sizes is compared based on the asymptotic theory at the contact edge of the half-plane (Figure 6a,c). The normal stress and shear stress are fitted in the form of Equation (3) and Equation (1), respectively. The root mean square error (RMSE) of the curve fitting is listed in Table 4.
It can be seen that as the element size gradually decreases from 0.02 mm, the normal stress p x and the tangential stress q x of the contact edge tend to change in the form of a square root, and the mean square error value gradually decreases (Figure 6d). When the element size is 0.005 mm, the minimum RMSE values are 76.11 and 53.94, respectively. When the element size is further reduced from 0.005 mm, the root mean square error of the normal and shear stress increases again, indicating that the curve fitting effect gradually deteriorates. Combined with image analysis, the reason for this result is that the stress at the contact edge fluctuates when the element size is too small, as shown in the red circle of Figure 6c. Therefore, to improve the accuracy of the calculation results, the best element size of the contact area is 0.005 mm when carrying the fretting wear finite element analysis of the tenon joint structure under a composite load.

4.2. Evolution of Fretting Wear on Contact Surface of Tenon Joint Structure

Compared with the low-cycle load, the high-cycle load has a higher frequency and smaller amplitude, so we assume that the former is a constant load. Therefore, only the evolution of wear with a high-cycle load is analyzed. We define a complete high load cycle as shown in Figure 7a. Considering that the structure and load of the model satisfy the symmetry condition, we only study the wear of the contact surface of the three teeth on the left side of the tenon, as shown in Figure 5d, and the object of the following sections below is consistent with this. Figure 7b shows the contact surface morphology of the three pairs of tenon teeth after wear calculation (magnified by 50 times), and Figure 7d–f correspond to the wear evolution process of each pair of tenon teeth per 100,000 cycles. It can be seen that as the number of cycles increases, the wear depth of each pair of tenon teeth gradually increases, and the right side of the curves is higher than the left, indicating that the wear depth of the upper side of the contact surface increases faster than that of the lower side. The growth rate of the average wear depth of the first tooth contact surface is much larger than that of the second and third teeth (about 10 times), with the third tooth having the smallest average wear depth (Figure 7c).

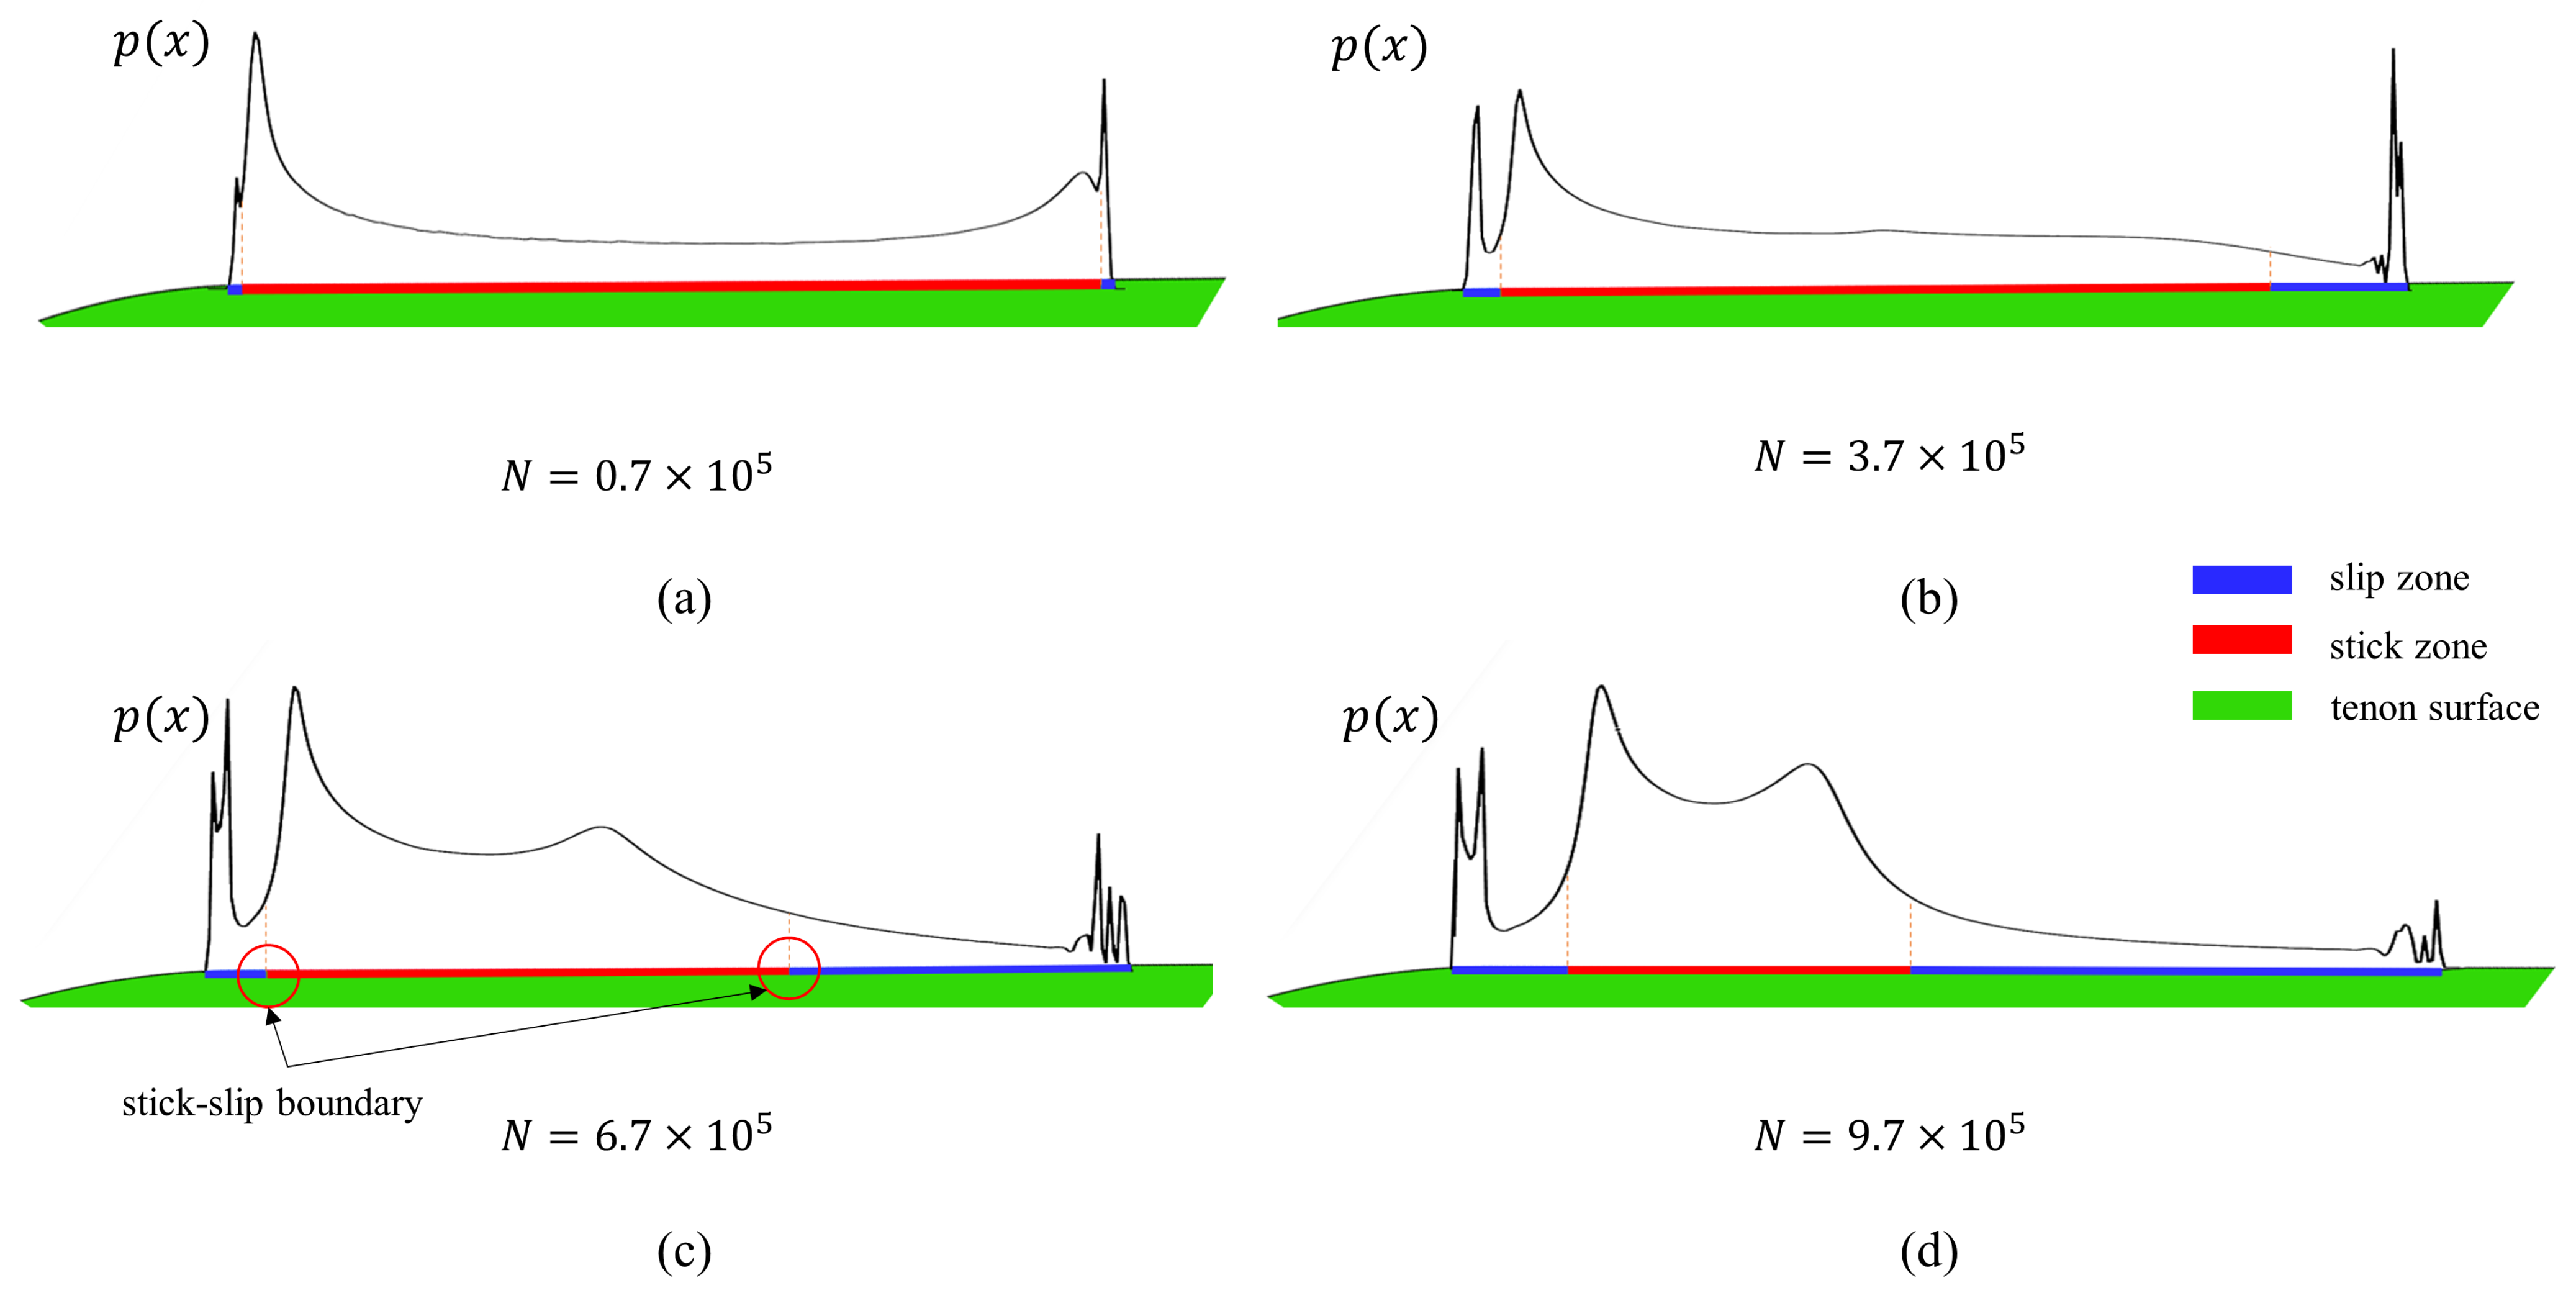
4.3. Stress Distribution and the Evolution of the Stick–Slip State during Different Cycles

During the initial load cycle, wear did not occur, and the stress distribution on the first tooth is shown in Figure 8a. The whole load cycle is divided into 20 incremental steps of the same time, numbered 0–20. It can be seen that stress concentration occurs at the contact edge of both normal stress and shear stress, and the peak value at the upper edge (x is positive) is larger than that of the lower edge (x is negative). In addition, the normal and shear stress changes periodically with the load cycle, and the normal stress is in the opposite phase on the upper and lower edges, but the shear stress is in the same phase on both edges.
Figure 8b shows the ratio curve of shear stress to normal stress on the contact surface in the initial load cycle. t = 1–11 corresponds to the first half-load cycle (0-T/2), and t = 12–21 corresponds to the second half-load cycle (T/2-T). The two dotted lines of 0.3 and −0.3 in the figure represent the limit value of the ratio determined by the friction coefficient. The curve between the two dotted lines indicates that part of the contact is in the stick state, and the part where the curve coincides with the dotted line indicates that this contact area is in the slip state.
In the first half cycle, as the load increases from the minimum ( F > 0 ), the stress ratio curve gradually decreases, the curve begins to coincide with the −0.3 dotted line from the two edges, and the overlap range between the right side of the curve and the dotted line increases faster, indicating that the slip region appears from two contact edges and gradually extends to the interior. The load reaches the maximum at T/2, and the slip area also reaches the maximum. At this time, the ratio of shear stress to normal stress and the distribution of the stick–slip area of the contact surface is shown in Figure 9a. At the moment of passing the maximum load point, the entire contact area will be all in the stick state. During the second half-load cycle, the ratio curve begins to rise from the −0.3 dotted line. As the load further decreases ( F < 0 ) , the curve begins to coincide with the 0.3 dotted line from the two edges, and the overlap range between the right side of the curve and the dotted line increases faster, indicating that the slip region appears from two contact edges and gradually extends to the interior again. At the T moment, the load reaches the minimum value, and the slip area reaches the maximum value. At this time, the ratio of shear stress to normal stress and the distribution of the stick–slip area of the contact surface is shown in Figure 9b.
Figure 8c shows the evolution of the stick–slip state of the contact surface during the entire initial load cycle. Note that both half-load cycles show a partial slip state, and the slip directions of the two edges are the same but the two half-cycles have opposite slip directions. The slip region extends from the two edges to the inside, and the slip range of the upper edge increases faster than that of the lower edge. In addition, the maximum slip range in the first half cycle (T/2 moment) is smaller than that in the second half cycle (T moment).
During the last load cycle, wear has a great influence on stress distribution, and Figure 10a shows the stress distribution on the first tooth. It can be seen that there are two additional stress concentration points fluctuating with the load cycle near the lower edge of the contact area, and the stress peak at the contact edge is greatly reduced compared with the initial cycle (Figure 8a).
Figure 10b shows the ratio curve of shear stress to normal stress on the contact surface in the last load cycle. Compared with the process of the initial load cycle, it can be found that the stress ratio curve of the last cycle has the same evolution law as that of the initial load cycle process, but the intersection time between the curve edges and the two dotted lines are earlier, and the ranges of coincidence are larger. Figure 10c shows the evolution of the stick–slip state of the contact surface during the entire last load cycle. It can be seen from the diagram that due to the influence of fretting wear, the slip area appears earlier from the edge of the contact surface, and the slip range is larger than that of the initial cycle process. In addition, the maximum slip range in the first half last cycle (T/2 moment) is larger than that in the second half last cycle (T moment), which is in contrast to the position of the maximum slip range that appears in the initial cycle.
For the second and third tooth of the tenon, since the wear amount is much smaller than that of the first tooth, the stress distribution and stick–slip state evolution of the contact surface in each high load cycle are basically the same. The stress ratio curve of the contact surface of the second and third tooth of the tenon during the last load cycle is shown in Figure 11. At different times during the whole load cycle, the normal stress and shear stress on the contact surface of the two pairs of tenon teeth only change within a small range, resulting in a small change in the stress ratio curves. The ratio curve of shear stress to the normal stress of the second tooth is all within the range of the −0.3~0.3 dotted line (Figure 11a), indicating that the whole contact surface is always in a stick state during the whole load cycle. Compared with the second tooth, the variation range of the ratio curve of the third tooth is slightly larger (Figure 11b), and only at the T moment when the load is reduced to the minimum value, the whole contact surface of the third tooth is in a sliding state for a short period and the rest of the time is all in stick state.

4.4. The Coupling Relationship between Fretting Wear and Contact State

In the previous section, we analyzed the stress distribution and the evolution of the stick–slip state in a single load cycle, regardless of whether the wear is considered or not. In this section, we will explore the coupling relationship between fretting wear and stress distribution by analyzing the variation of stress distribution and stick–slip state at the same time in different cycles. The first tenon tooth will obviously show a variety of stick–slip states in each half-load cycle (stick state, partial slip state, and gross slip state), and the slip areas in the opposite direction appear alternately and expand from the edge to the inside, so the first tooth surface has a large amount of slip. But the second and third tooth surfaces are mainly in a stick state during the whole wear process, and their relative slip amount is smaller, so the wear depth of the first tooth is larger than that of the second and third tooth. In addition, wear always occurs first at the edge of the contact surface and gradually expands into the interior, and the wear rate of the upper area of the contact surface increases faster because the slip region of the upper area of the contact surface expands faster than that of the lower area.
Figure 12 shows the evolution of contact stress at the T/4 moment of the first tooth with the increase in wear cycles. It is observed that fretting wear causes two obvious peak points in the normal and shear stress curves, which develop from both sides to away from the contact edge. The evolution of the additional peak stress points is related to the location of the stick–slip boundary. It can be seen from Figure 13 that with the increase in the number of cycles, the slip area at both ends gradually expands at the T/4 moment of the load cycle. The additional peak pressure actually appears near the stick–slip interface in the stick area. This is due to the discontinuity between the wear of the slip zone and the non-wear of the stick zone, which causes the discontinuity of geometry and load, resulting in stress concentration. The load is gradually concentrated in the stick zone and the peak stress at the contact edge is gradually reduced.
Figure 14 shows the evolution of contact stress at the T/4 moment of the second and third tooth with the increase in wear cycles. The contact surface of the second tooth is almost in a stick state during the whole load cycle, and its wear amount is very small, so the wear damage has little effect on the surface stress distribution (Figure 14a,b). The average wear amount of the third tooth is the smallest compared with the other two teeth, but it is in a slip state for a very short period during the whole load cycle. Therefore, wear will also have an impact on the stress distribution of the third tooth, but the impact is small. As shown in Figure 14c,d, there is also a stress peak near the contact edge of the third tooth, but its propagation speed is very slow compared with the development of the stress distribution of the first tooth.
In general, stress concentration is directly related to crack formation. This means that the analysis of the cracking position in the case of a partial slip will become more complicated than that in a stick or gross slip. When the wear is neglected, it is expected that only cracks are generated at the contact edge, while when considering wear, in the case of a partial slip, the predicted crack position may occur at the contact edge or the stick–slip interface, depending on the interaction between the rate of fatigue damage accumulation and the fretting stress evolution caused by wear. In the initial stage, a small number of load cycles have a small amount of wear, so the stress concentration at the contact edge is significant. At this time, cracks are most likely to occur at the contact edge. As the amount of wear gradually increases, the peak stress of the stick–slip interface gradually increases and the stress concentration at the contact edge is alleviated, so the failure risk of the stick–slip interface increases, which is most likely caused by the accumulation of wear damage.

5. Conclusions

In this paper, based on the improved Archard wear theory, the fretting wear numerical analysis of the DZ125/FGH99 tenon/mortise joint structure is carried out. The development of fretting wear on the contact surface of the tenon joint structure, as well as stress distribution and the evolution of stick–slip state during different cycles, are obtained, and the coupling relationship between fretting wear and contact state is further analyzed. The main results are as follows:
  • The element size of the contact area has a great influence on the accuracy of the contact calculation results. As the element size gradually decreases, the error between the stress calculated by the numerical calculation and the theoretical value of the asymptotic form gradually decreases. However, when the element size is too small, the stress at the contact edge may fluctuate.
  • The wear depth of each pair of tenon teeth gradually increases as the number of load cycles increases, and the wear depth of the upper side of the contact surface increases faster than that of the lower side. The average wear depth of the first tooth contact surface is much larger than that of the second and third teeth (about 10 times), with the third tooth having the smallest average wear depth.
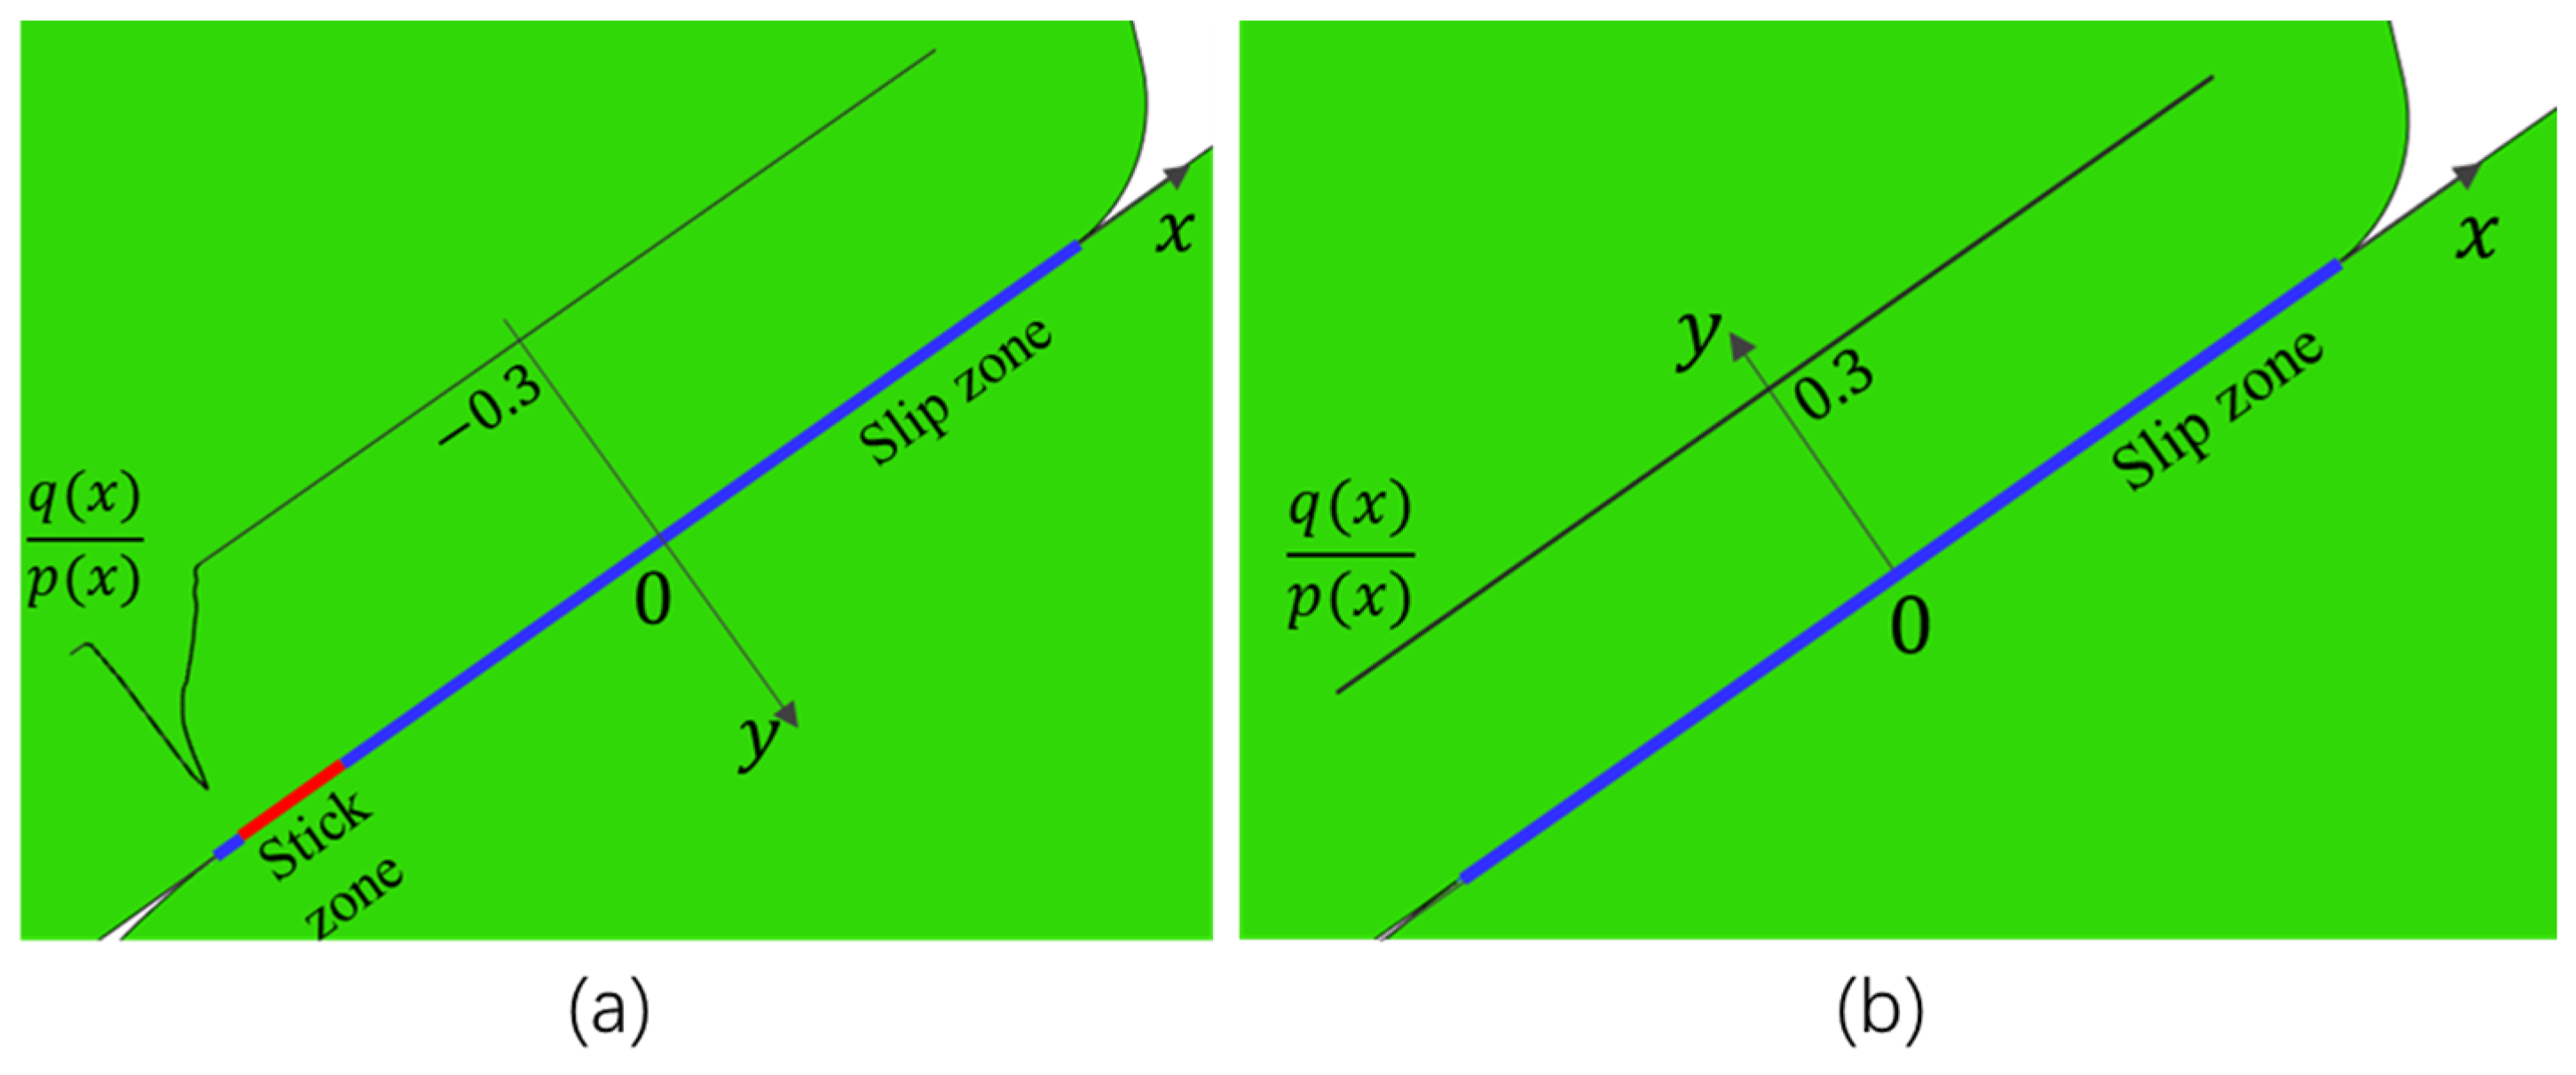
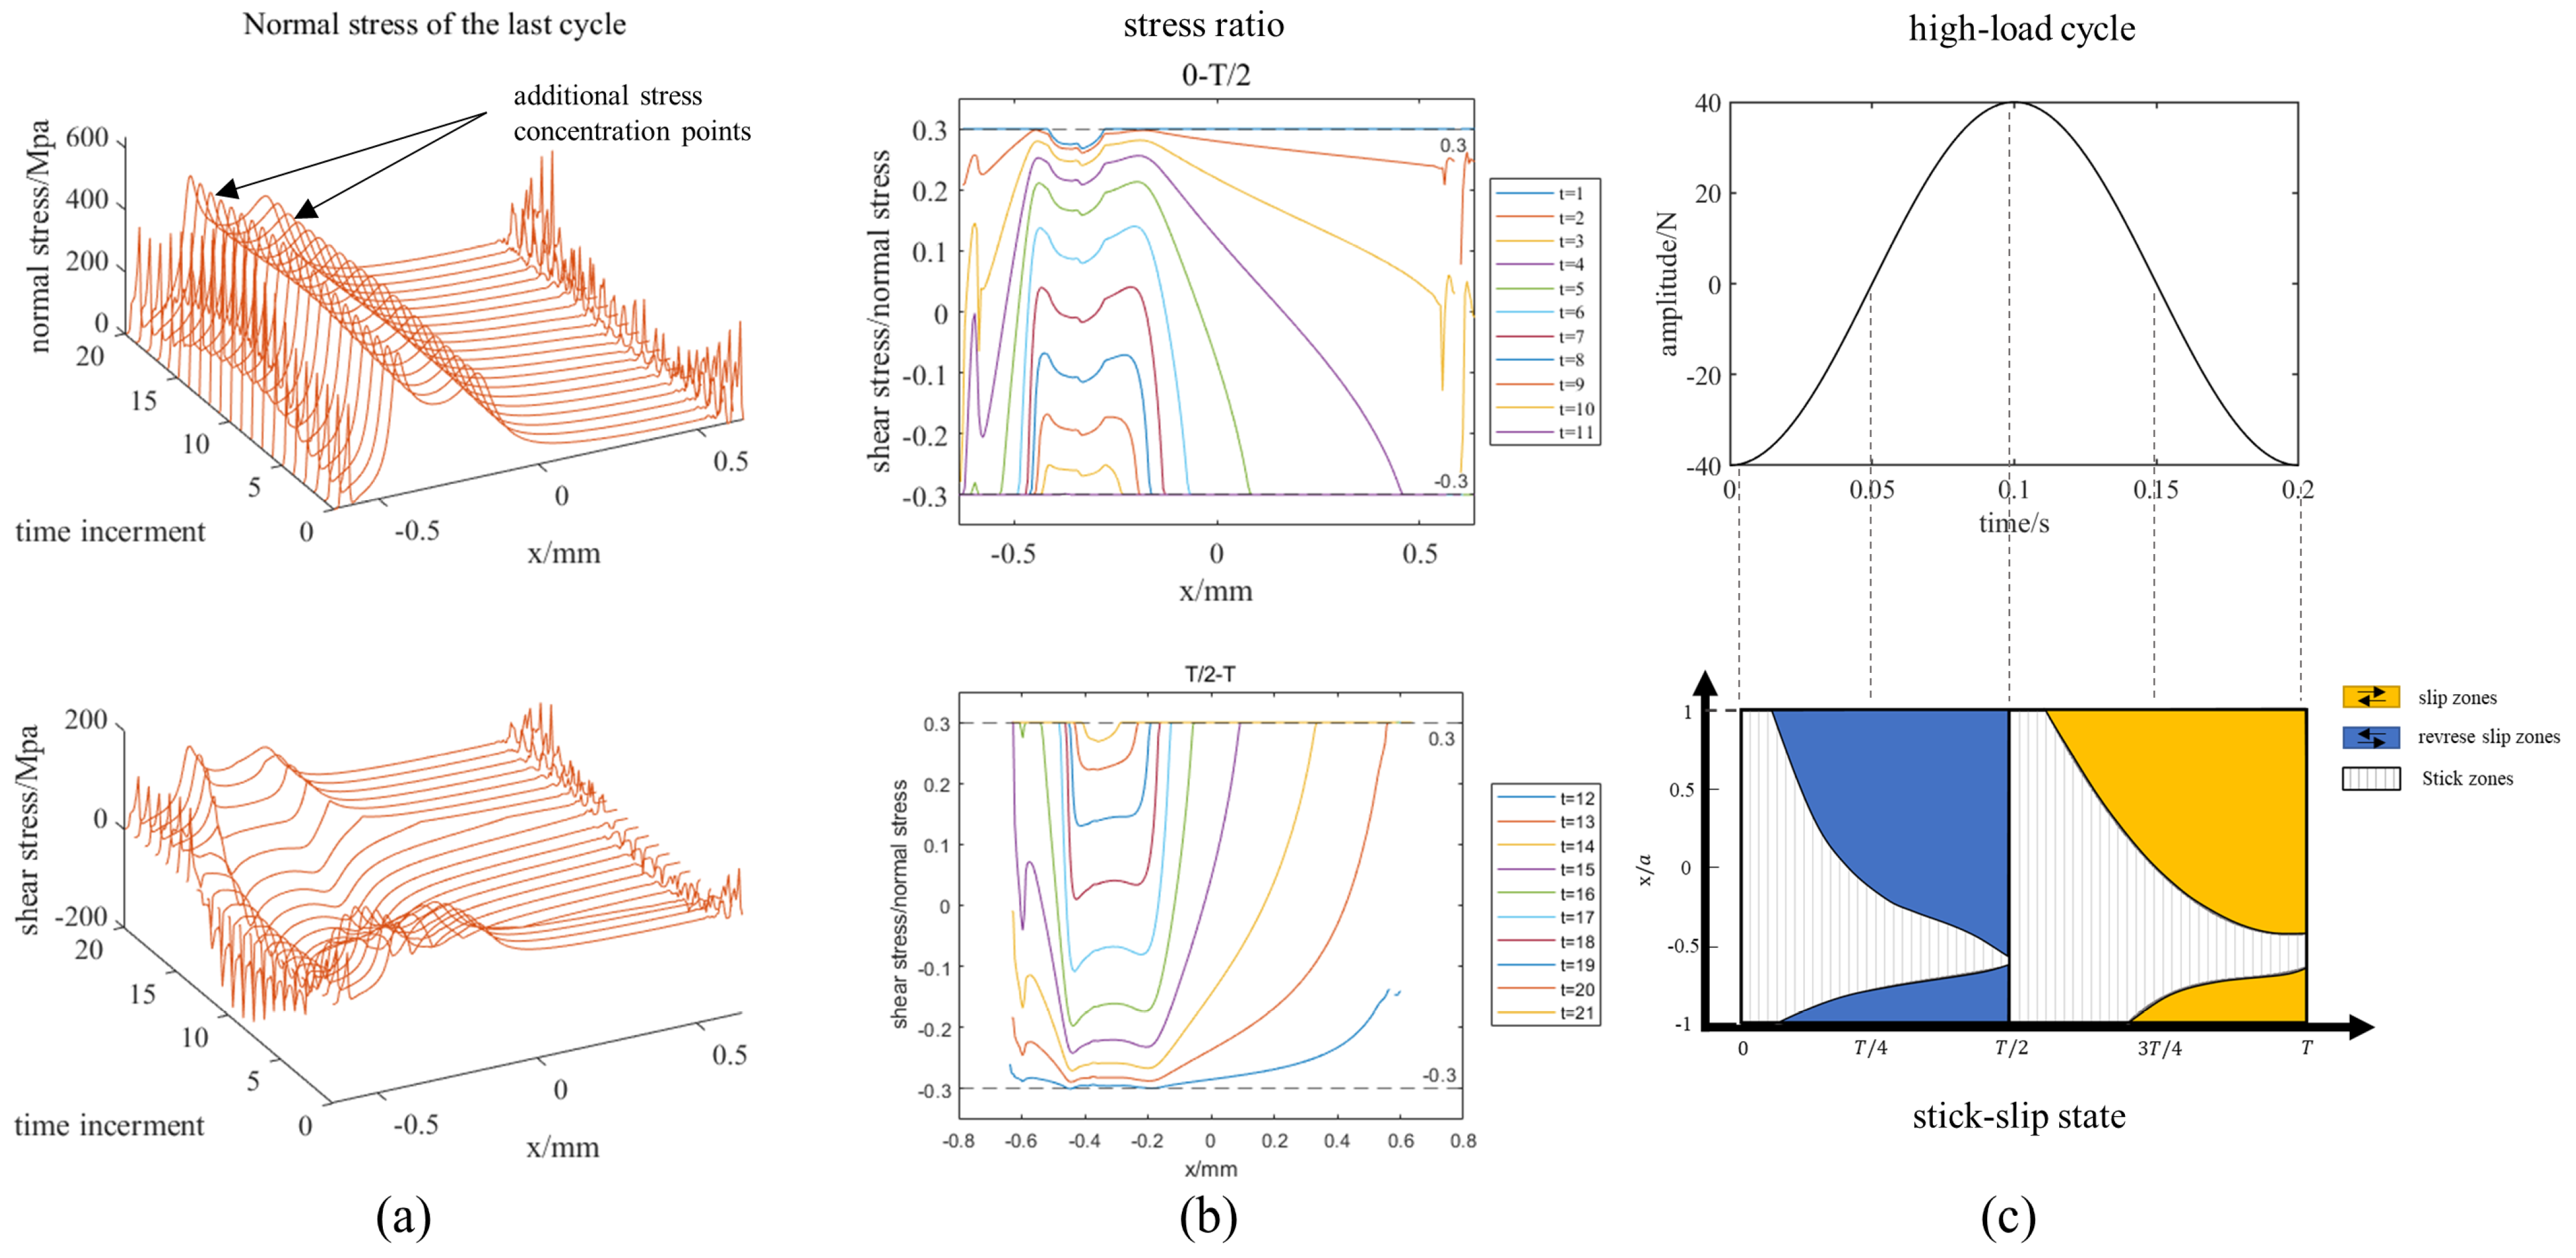
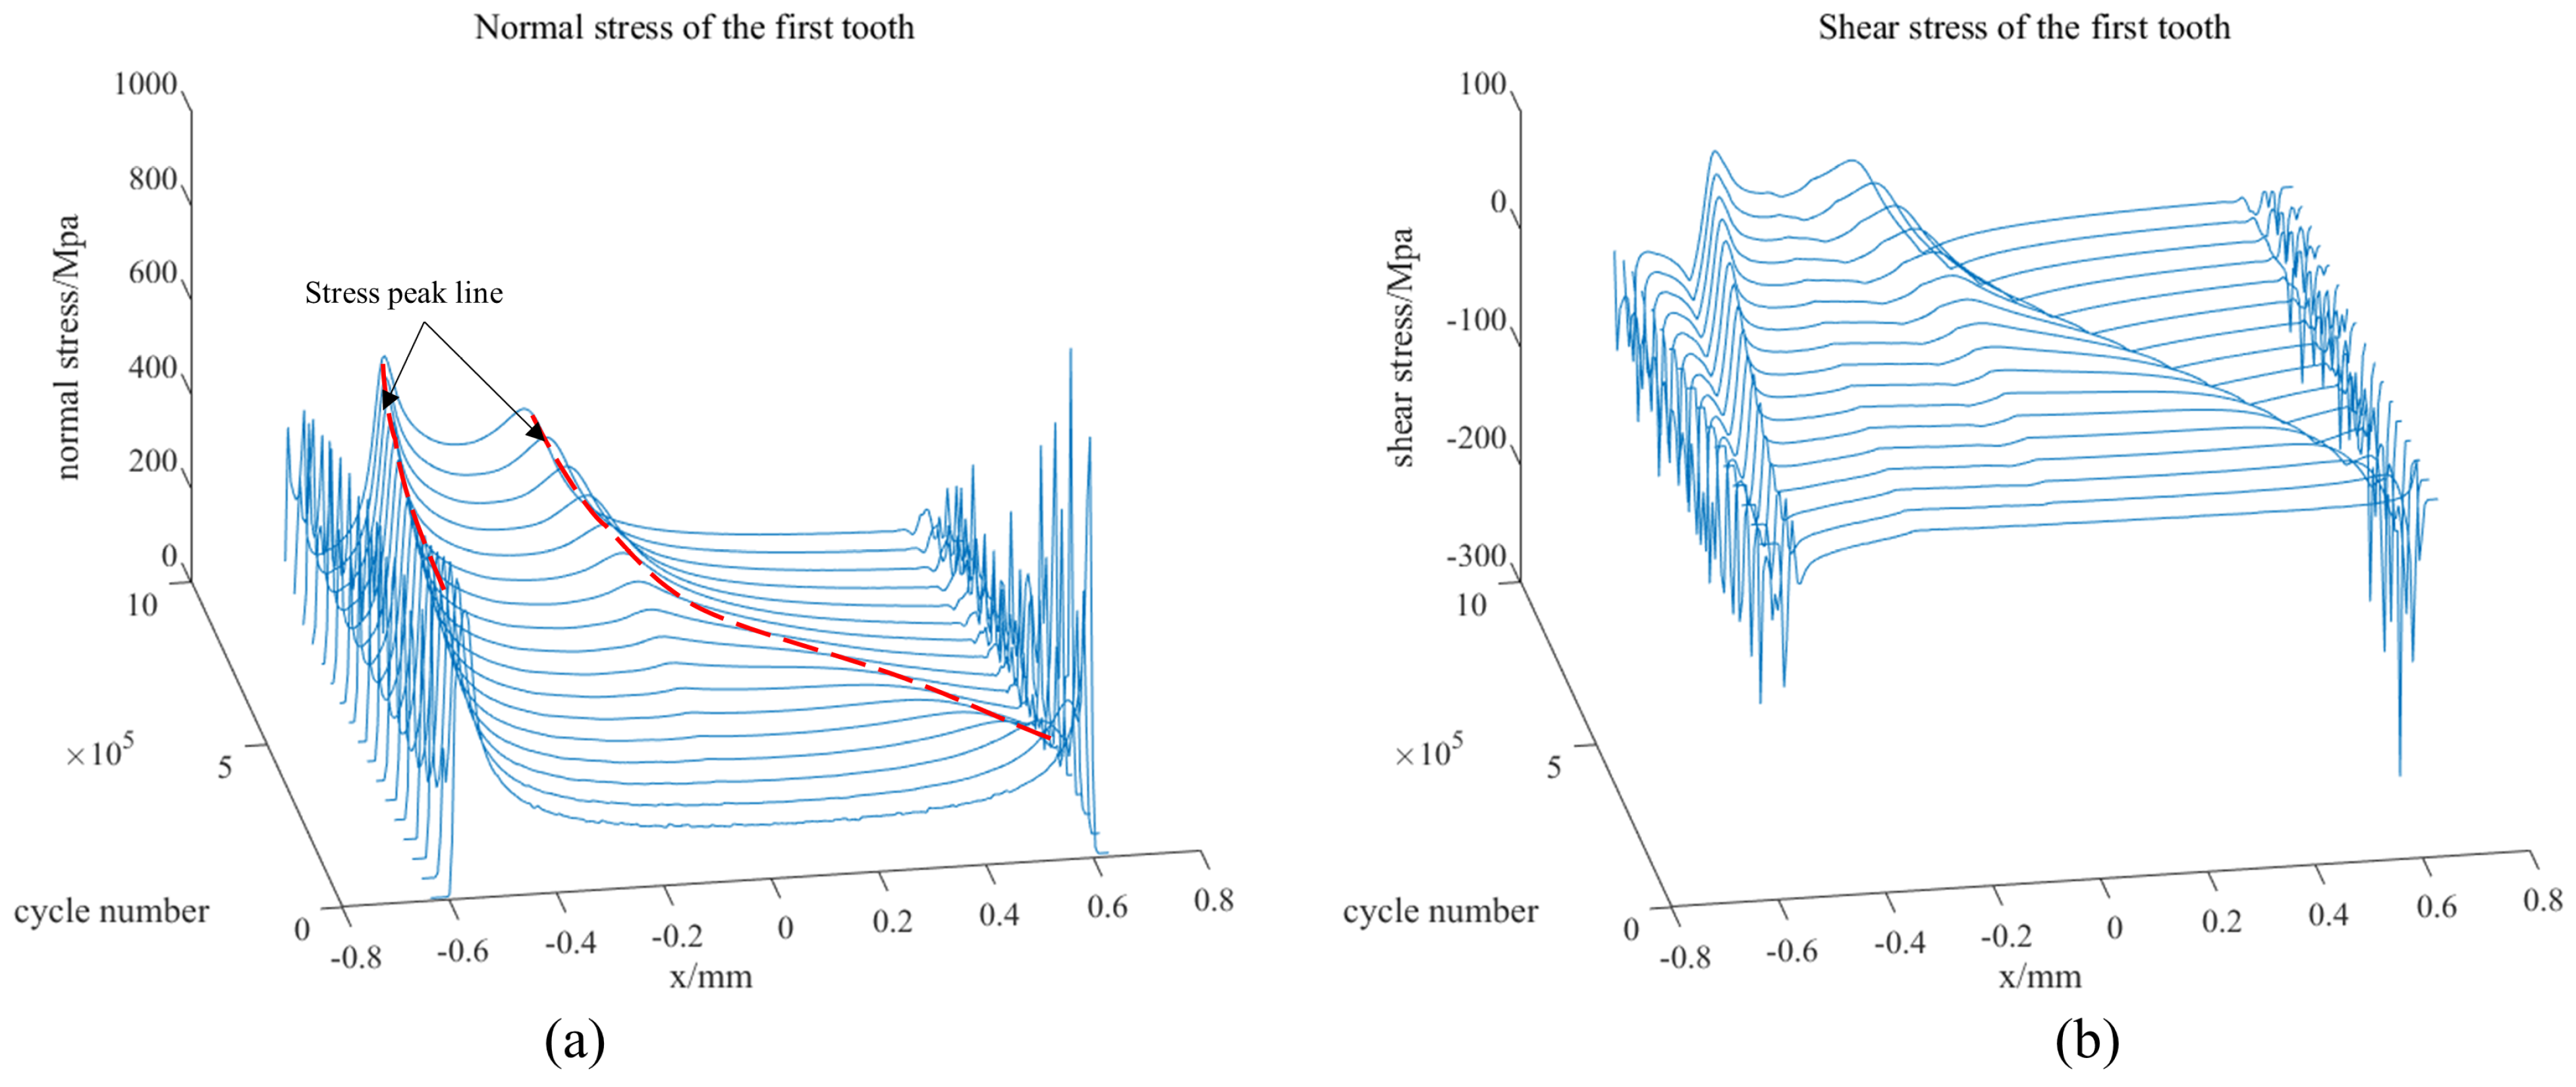
  • The stress distribution and stick–slip state are different in different load cycles. In the initial cycle, wear has not yet occurred, and the three teeth only have a stress peak at the contact edge. The variation range of the ratio of normal stress to shear stress on the contact surface of the first tooth is much larger than that of the second and third tooth. The first tooth will appear as a slip region extending from the two contact edges to the inside, and the slip direction is opposite in the two half-load cycles. The remaining two pairs of tenon teeth are basically in a stick state during the whole process. In the last load cycle, fretting wear has an obvious effect on the stress distribution on the contact surface of the first tooth. There are two additional stress concentration points fluctuating with the load cycle near the lower edge of the contact area, and the stress peak at the contact edge is greatly reduced compared with the initial cycle. The slip area of the first tooth appears earlier from the edge of the contact surface, and the slip range is larger than that of the initial cycle process.
  • There is a coupling relationship between fretting wear and stress distribution. On the one hand, the larger stress and slip at the contact edge will lead to larger fretting wear extending from the edge to the inside. On the other hand, the resulting fretting wear leads to changes in geometry, which in turn affects the stress distribution and stick–slip state of the contact surface. The range of the slip zone of the contact surface of the first tooth at a specific time gradually increases with the wear cycle, and the stress peak in the stick–slip transition area gradually evolves from the contact edge to the interior, leading to a gradual concentration of loads in the stick zone and an attenuation of the peak stresses at the contact edges, which may result in a decrease in the risk of cracking at the contact edges and an increase in the risk of cracking at the stick–slip interface.

Author Contributions

Conceptualization, Z.S.; methodology, L.S.; software, L.S. and Y.L.; validation, L.S.; formal analysis, L.S.; investigation, Y.L.; resources, Z.S.; data curation, L.S. and Y.L.; writing—original draft preparation, L.S.; writing—review and editing, Z.S.; visualization, Z.S.; supervision, C.Z.; project administration, Z.S. and C.Z.; funding acquisition, Z.S. and C.Z. All authors have read and agreed to the published version of the manuscript.

Funding

This work is financially supported by the National Key R&D Program of China (2022YFB3401902), the National Natural Science Foundation of China (U21A20134), and the Shandong Provincial Natural Science Foundation (Excellent Young Fund, ZR2022YQ48).

Data Availability Statement

The raw data supporting the conclusions of this article will be made available by the authors on request.

Acknowledgments

The authors would like to thank Ningmin Duan for his advice and support in the research method.

Conflicts of Interest

The authors declare no conflict of interest.

References

  1. Biswas, S.; Ramachandra, S.; Hans, P.; Kumar, S.P.S. Materials for gas turbine engines: Present status, future trends and indigenous efforts. J. Indian Inst. Sci. 2022, 102, 297–309. [Google Scholar] [CrossRef]
  2. Behera, A.; Sahoo, A.K.; Mahapatra, S.S. Application of Ni-based superalloy in aero turbine blade: A review. Proc. Inst. Mech. Eng. Part E J. Process Mech. Eng. 2023. [Google Scholar] [CrossRef]
  3. Zhang, J.; Jie, Z.; Huang, T.; Yang, W.; Liu, L.; Fu, H. Research and development of equiaxed grain solidification and forming technology for nickel-based cast superalloys. Acta Met. Sin. 2019, 55, 1145–1159. [Google Scholar]
  4. Zhang, J.; Wang, L.; Xie, G.; Wang, D.; Shen, J.; Lu, Y.; Huang, Y.; Li, Y. Recent progress in research and development of nickel-based single crystal superalloys. Acta Met. Sin. 2023, 59, 1109–1124. [Google Scholar]
  5. Ji, J.; Zhang, C.; Liang, Y.; Zhang, N.; Wang, J. Anisotropic V-Groove/Wrinkle Hierarchical Arrays for Multidirectional Strain Sensors with High Sensitivity and Exceptional Selectivity. ACS Appl. Mater. Interfaces 2024, 16, 29410–29420. [Google Scholar] [CrossRef] [PubMed]
  6. Zhang, L.; Wang, Y.; Yu, Z.; Jiang, R.; Baxevanakis, K.P.; Roy, A.; Zhao, L.; Tian, G.; Song, Y. Thermo-mechanical fatigue crack growth in a nickel-based powder metallurgy superalloy. Int. J. Fatigue 2024, 186, 108413. [Google Scholar] [CrossRef]
  7. Jiang, R.; Song, Y.D.; Reed, P.A. Fatigue crack growth mechanisms in powder metallurgy Ni-based superalloys—A review. Int. J. Fatigue 2020, 141, 105887. [Google Scholar] [CrossRef]
  8. Yan, X.; Nie, J. Turbine Blade Fatigue; Science Press: Beijing, China, 2013. [Google Scholar]
  9. Bhatti, N.A.; Wahab, M.A. A numerical investigation on critical plane orientation and initiation lifetimes in fretting fatigue under out of phase loading conditions. Tribol. Int. 2017, 115, 307–318. [Google Scholar] [CrossRef]
  10. Madge, J.J. Numerical Modelling of the Effect of Fretting Wear on Fretting Fatigue. Ph.D. Thesis, University of Nottingham, Nottingham, UK, 2009. [Google Scholar]
  11. Hills, D.A.; Andresen, H.N. Mechanics of Fretting and fretting Fatigue; Springer: Berlin/Heidelberg, Germany, 2021. [Google Scholar]
  12. Andresen, H.; Hills, D.A.; Moore, M.R. Representation of incomplete contact problems by half-planes. Eur. J. Mech. -A/Solids 2021, 85, 104138. [Google Scholar] [CrossRef]
  13. Truelove JP, J.; Hills, D.A.; Blades, L.E. Flat and rounded contacts: Modelling the effect of a moment with application to fretting fatigue tests. J. Strain Anal. Eng. Des. 2023, 58, 91–97. [Google Scholar] [CrossRef]
  14. Moore, M.R.; Hills, D.A. A novel asymptotic formulation for partial slip half-plane frictional contact problems. Theor. Appl. Fract. Mech. 2022, 121, 103457. [Google Scholar] [CrossRef]
  15. Hills, D.; Ramesh, R.; Barber, J.; Moore, M. Methods to solve half-plane partial slip contact problems. Int. J. Solids Struct. 2018, 155, 155–159. [Google Scholar] [CrossRef]
  16. Wang, T.; Shang, X.; Wang, H.; Wang, J.; Zhang, C. Porous nanofibers and micro-pyramid structures array for high-performance flexible pressure sensors. Compos. Part A Appl. Sci. Manuf. 2024, 181, 108163. [Google Scholar] [CrossRef]
  17. Andresen, H.; Hills, D.A. A review of partial slip solutions for contacts represented by half-planes including bulk tension and moments. Tribol. Int. 2020, 143, 106050. [Google Scholar] [CrossRef]
  18. Zhu, M.H.; Zhou, Z.R. On the mechanisms of various fretting wear modes. Tribol. Int. 2011, 44, 1378–1388. [Google Scholar] [CrossRef]
  19. Kirk, A.M.; Sun, W.; Bennett, C.J.; Shipway, P.H. Interaction of displacement amplitude and frequency effects in fretting wear of a high strength steel: Impact on debris bed formation and subsurface damage. Wear 2021, 482, 203981. [Google Scholar] [CrossRef]
  20. Ahmadi, A.; Sadeghi, F. A three-dimensional finite element damage mechanics model to simulate fretting wear of hertzian line and circular contacts in partial slip regime. J. Tribol. 2022, 144, 051602. [Google Scholar] [CrossRef]
  21. Shen, F.; Ke, L.L.; Zhou, K. A debris layer evolution-based model for predicting both fretting wear and fretting fatigue lifetime. Int. J. Fatigue 2021, 142, 105928. [Google Scholar] [CrossRef]
  22. Zhang, Z.; Zhao, G.; Yuan, Y.; Zhang, H.; Wu, Y. Finite Element Simulation and Fretting Wear Prediction of a Tenon Connection Structure. Lubricants 2023, 11, 421. [Google Scholar] [CrossRef]
  23. Qu, Z.; Yao, C.; Zhu, H.; Lin, X.; Chen, L.; Zhang, Z.; Fang, J. Research on the effect of fretting wear on the vibration characteristics of the tenon joint bladed disk. J. Phys. Conf. Ser. 2024, 2707, 012115. [Google Scholar] [CrossRef]
  24. Xue, F.; Wang, Z.X.; Zhao, W.S.; Zhang, X.L.; Qu, B.P.; Wei, L. Fretting fatigue crack analysis of the turbine blade from nuclear power plant. Eng. Fail. Anal. 2014, 44, 299–305. [Google Scholar] [CrossRef]
  25. Zhao, W.; Li, Y.; Xue, M.; Wang, P.; Jiang, J. Vibration analysis for failure detection in low pressure steam turbine blades in nuclear power plant. Eng. Fail. Anal. 2018, 84, 11–24. [Google Scholar] [CrossRef]
  26. Kuang, W.; Qing, M.I.; Wenfeng, D.I.; Yanjun, Z.H.; Biao, Z.H.; Xuebing, W.E.; Shaopeng, L.I. Fretting wear behaviour of machined layer of nickel-based superalloy produced by creep-feed profile grinding. Chin. J. Aeronaut. 2022, 35, 401–411. [Google Scholar] [CrossRef]
  27. Liu, Y.; Xu, J.; Ning, T.; Yang, H.; Tang, Z.; Guo, S.; Wang, P. Process optimization and microstructure evolution of Inconel718 alloy by laser powder bed fusion. China Powder Sci. Technol. 2024, 30, 23–35. [Google Scholar]
  28. Long, Q.L.; Wu, W.H.; Lu, L. Effect of power on properties of Ti−6Al−4V alloy powder prepared by EIGA process. China Powder Sci. Technol. 2018, 24, 49. [Google Scholar]
  29. Yang, Q.Y.; Wu, Y.D.; Sha, F.; Wu, W.; Xu, H.; Cai, B. Characteristic of Inconel625 alloy powders used in selective laser melting. China Powder Sci. Technol. 2016, 22, 27–32. [Google Scholar]
  30. Liu, F.F.; Xiao, X. Microwave Resonator Design and Simulate of Cemented Carbide Roll Rings. China Powder Sci. Technol. 2013, 19, 27–31. [Google Scholar]
  31. Fleury, R.; Hills, D.; Ramesh, R.; Barber, J. Incomplete contacts in partial slip subject to varying normal and shear loading, and their representation by asymptotes. J. Mech. Phys. Solids 2017, 99, 178–191. [Google Scholar] [CrossRef]
  32. Yao, M.M.; Gou, Y.J.; He, Y.D. Research progress on high-temperature protection coatings. China Powder Sci. Technol. 2005, 3, 32. [Google Scholar]
  33. Zhang, R.; Meng, X.; Sun, K.; Li, Q.; Zhao, F. An investigation of high and room temperature fretting fatigue of DD6-FGH96 dovetail joint in aero-engine: Experimental and numerical analysis. Int. J. Fatigue 2022, 154, 106537. [Google Scholar] [CrossRef]
  34. Hu, C.; Wei, D.; Wang, Y.; Shi, L. Experimental and numerical study of fretting fatigue in dovetail assembly using a total life prediction model. Eng. Fract. Mech. 2019, 205, 301–318. [Google Scholar] [CrossRef]
  35. Guo, K.; Li, J.; Cao, H.; Yuan, H. Experimental and computational investigation of fretting fatigue characterized by nominal contact pressure in dovetail structures. Fatigue Fract. Eng. Mater. Struct. 2022, 45, 3102–3117. [Google Scholar] [CrossRef]
  36. Qian, Z.; Mi, D.; Cheng, B.; Deng, L.; Li, S.; Zhang, H.; Cui, H. Optimization of a Certain Type of Aero-Engine Three-Tooth Mortise and Tenon Joint Structure against Fretting Fatigue. Metals 2023, 13, 1116. [Google Scholar] [CrossRef]
  37. Hills, D.A.; Fleury RM, N.; Dini, D. Partial slip incomplete contacts under constant normal load and subject to periodic loading. Int. J. Mech. Sci. 2016, 108, 115–121. [Google Scholar] [CrossRef]
  38. Hills, D.; Ramesh, R.; Fleury, R.; Parel, K. A unified approach for representing fretting and damage at the edges of incomplete and receding contacts. Tribol. Int. 2017, 108, 16–22. [Google Scholar] [CrossRef]
  39. Archard, J.F. Contact and rubbing of flat surfaces. J. Appl. Phys. 1953, 24, 981–988. [Google Scholar] [CrossRef]
  40. McColl, I.R.; Ding, J.; Leen, S.B. Finite element simulation and experimental validation of fretting wear. Wear 2004, 256, 1114–1127. [Google Scholar] [CrossRef]
  41. Aeroengine Design Materials Data Handbook Committee. Aeroengine Design Materials Data Handbook; Aviation Industry Press: Beijing, China, 2010. [Google Scholar]
  42. Qu, Z.; Liu, K.; Wang, B.; Chen, Z. Fretting fatigue experiment and finite element analysis for dovetail specimen at high temperature. Appl. Sci. 2021, 11, 9913. [Google Scholar] [CrossRef]
Figure 1. (a) Normal square root-bounded asymptote and tangential square root singular asymptote. (b) Half-plane incomplete contact configuration.
Metals 14 00830 g001
Figure 2. Finite element analysis process of fretting wear.
Metals 14 00830 g002
Figure 3. (a) Fir-tree tenon joint structure and its simplified configuration. (b) Geometric parameters of tenon and mortise (unit: mm).
Metals 14 00830 g003
Figure 4. (a) Schematic diagram of geometric structure division. (b) Mesh quality information before re-meshing. (c) Mesh quality information after re-meshing.
Metals 14 00830 g004
Figure 5. (a) ALE adaptive mesh control region. (b) High- and low-cycle load spectrum. (c) ALE node constraint region. (d) Finite element model of fir-tree tenon structure. (e) Setting of contact pairs.
Metals 14 00830 g005
Figure 6. (a) The normal stress distribution of the lower contact edge with different element sizes. (b) The stress distribution of the first tooth. (c) The shear stress distribution of the lower contact edge with different element sizes. (d) The RMSE of different element sizes. (e) The von Mises stress distribution of the structure.
Metals 14 00830 g006
Figure 7. (a) The definition of a high load cycle. (b) The contact surface morphology of the three pairs of tenon teeth after wear calculation. (c) The average wear depth of three tenon teeth. (d) The evolution of wear on the surface of the first tooth. (e) The evolution of wear on the surface of the second tooth. (f) The evolution of wear on the surface of the third tooth.
Metals 14 00830 g007
Figure 8. (a) The stress distribution on the first tooth contact surface in the initial load cycle. (b) The ratio curve of shear stress to normal stress on the contact surface in the initial load cycle. (c) The evolution of the stick–slip state of the contact surface during the entire initial load cycle.
Metals 14 00830 g008
Figure 9. The ratio of shear stress to normal stress and the distribution of the stick–slip area on the contact surface. (a) T/2 moment. (b) T moment.
Metals 14 00830 g009
Figure 10. (a) The stress distribution on the first tooth contact surface in the last load cycle. (b) The ratio curve of shear stress to normal stress on the contact surface in the last load cycle. (c) The evolution of the stick–slip state of the contact surface during the entire last load cycle.
Metals 14 00830 g010
Figure 11. The ratio curve of shear stress to normal stress on the contact surface of the second and third tooth of the tenon during the last load cycle. (a) The second tooth. (b) The third tooth.
Metals 14 00830 g011
Figure 12. The evolution of contact stress at the T/4 moment of the first tooth with the increase in wear cycles. (a) The normal stress distribution. (b) The shear stress distribution.
Metals 14 00830 g012
Figure 13. The normal stress distribution and stick–slip state of the first tooth surface at different cycles. (a) N = 0.7 × 10⁵. (b) N = 3.7 × 10⁵. (c) N = 6.7 × 10⁵. (d) N = 9.7 × 10⁵.
Metals 14 00830 g013
Figure 14. The evolution of contact stress at the T/4 moment of the second and third tooth with the increase in wear cycles. (a) The normal stress distribution of the second tooth. (b) The shear stress distribution of the second tooth. (c) The normal stress distribution of the third tooth. (d) The shear stress distribution of the third tooth.
Metals 14 00830 g014
Table 1. Longitudinal mechanical properties of DZ125 at different temperatures adapted from Ref. [41].
Temperature T/°CElastic Modulus E/GpaPoisson’s
Ratio μ
Yield Strength σ0.2/MPaTensile Strength σb/GPa
251270.3829901340
4001130.3889651280
600107.50.3969451220
Table 2. Transverse mechanical properties of DZ125 at different temperatures adapted from Ref. [41].
Temperature T/°CElastic Modulus E/GpaPoisson’s
Ratio μ
Yield Strength σ0.2/MPaTensile Strength σb/GPa
251620.499845880
4001360.522785898
600125.50.533765910
Table 3. Material parameters of FGH99 adapted from Ref. [42].
Temperature T/°C20200350400500600700750800
E/Gpa221216210205198180161193178
υ0.3
Table 4. RMSE of curve fitting under different element sizes.
Element Size/mm0.020.010.0050.0020.001
Normal stress/MPa271.690.6776.1192.2499.64
Shear stress/MPa189.760.753.9466.8479.32
Disclaimer/Publisher’s Note: The statements, opinions and data contained in all publications are solely those of the individual author(s) and contributor(s) and not of MDPI and/or the editor(s). MDPI and/or the editor(s) disclaim responsibility for any injury to people or property resulting from any ideas, methods, instructions or products referred to in the content.

