
Ultrasonic-Assisted Granular Medium Forming of Aluminum Alloy 6063-T5: Simulations and Experiments
 ,
,
Abstract
:1. Introduction
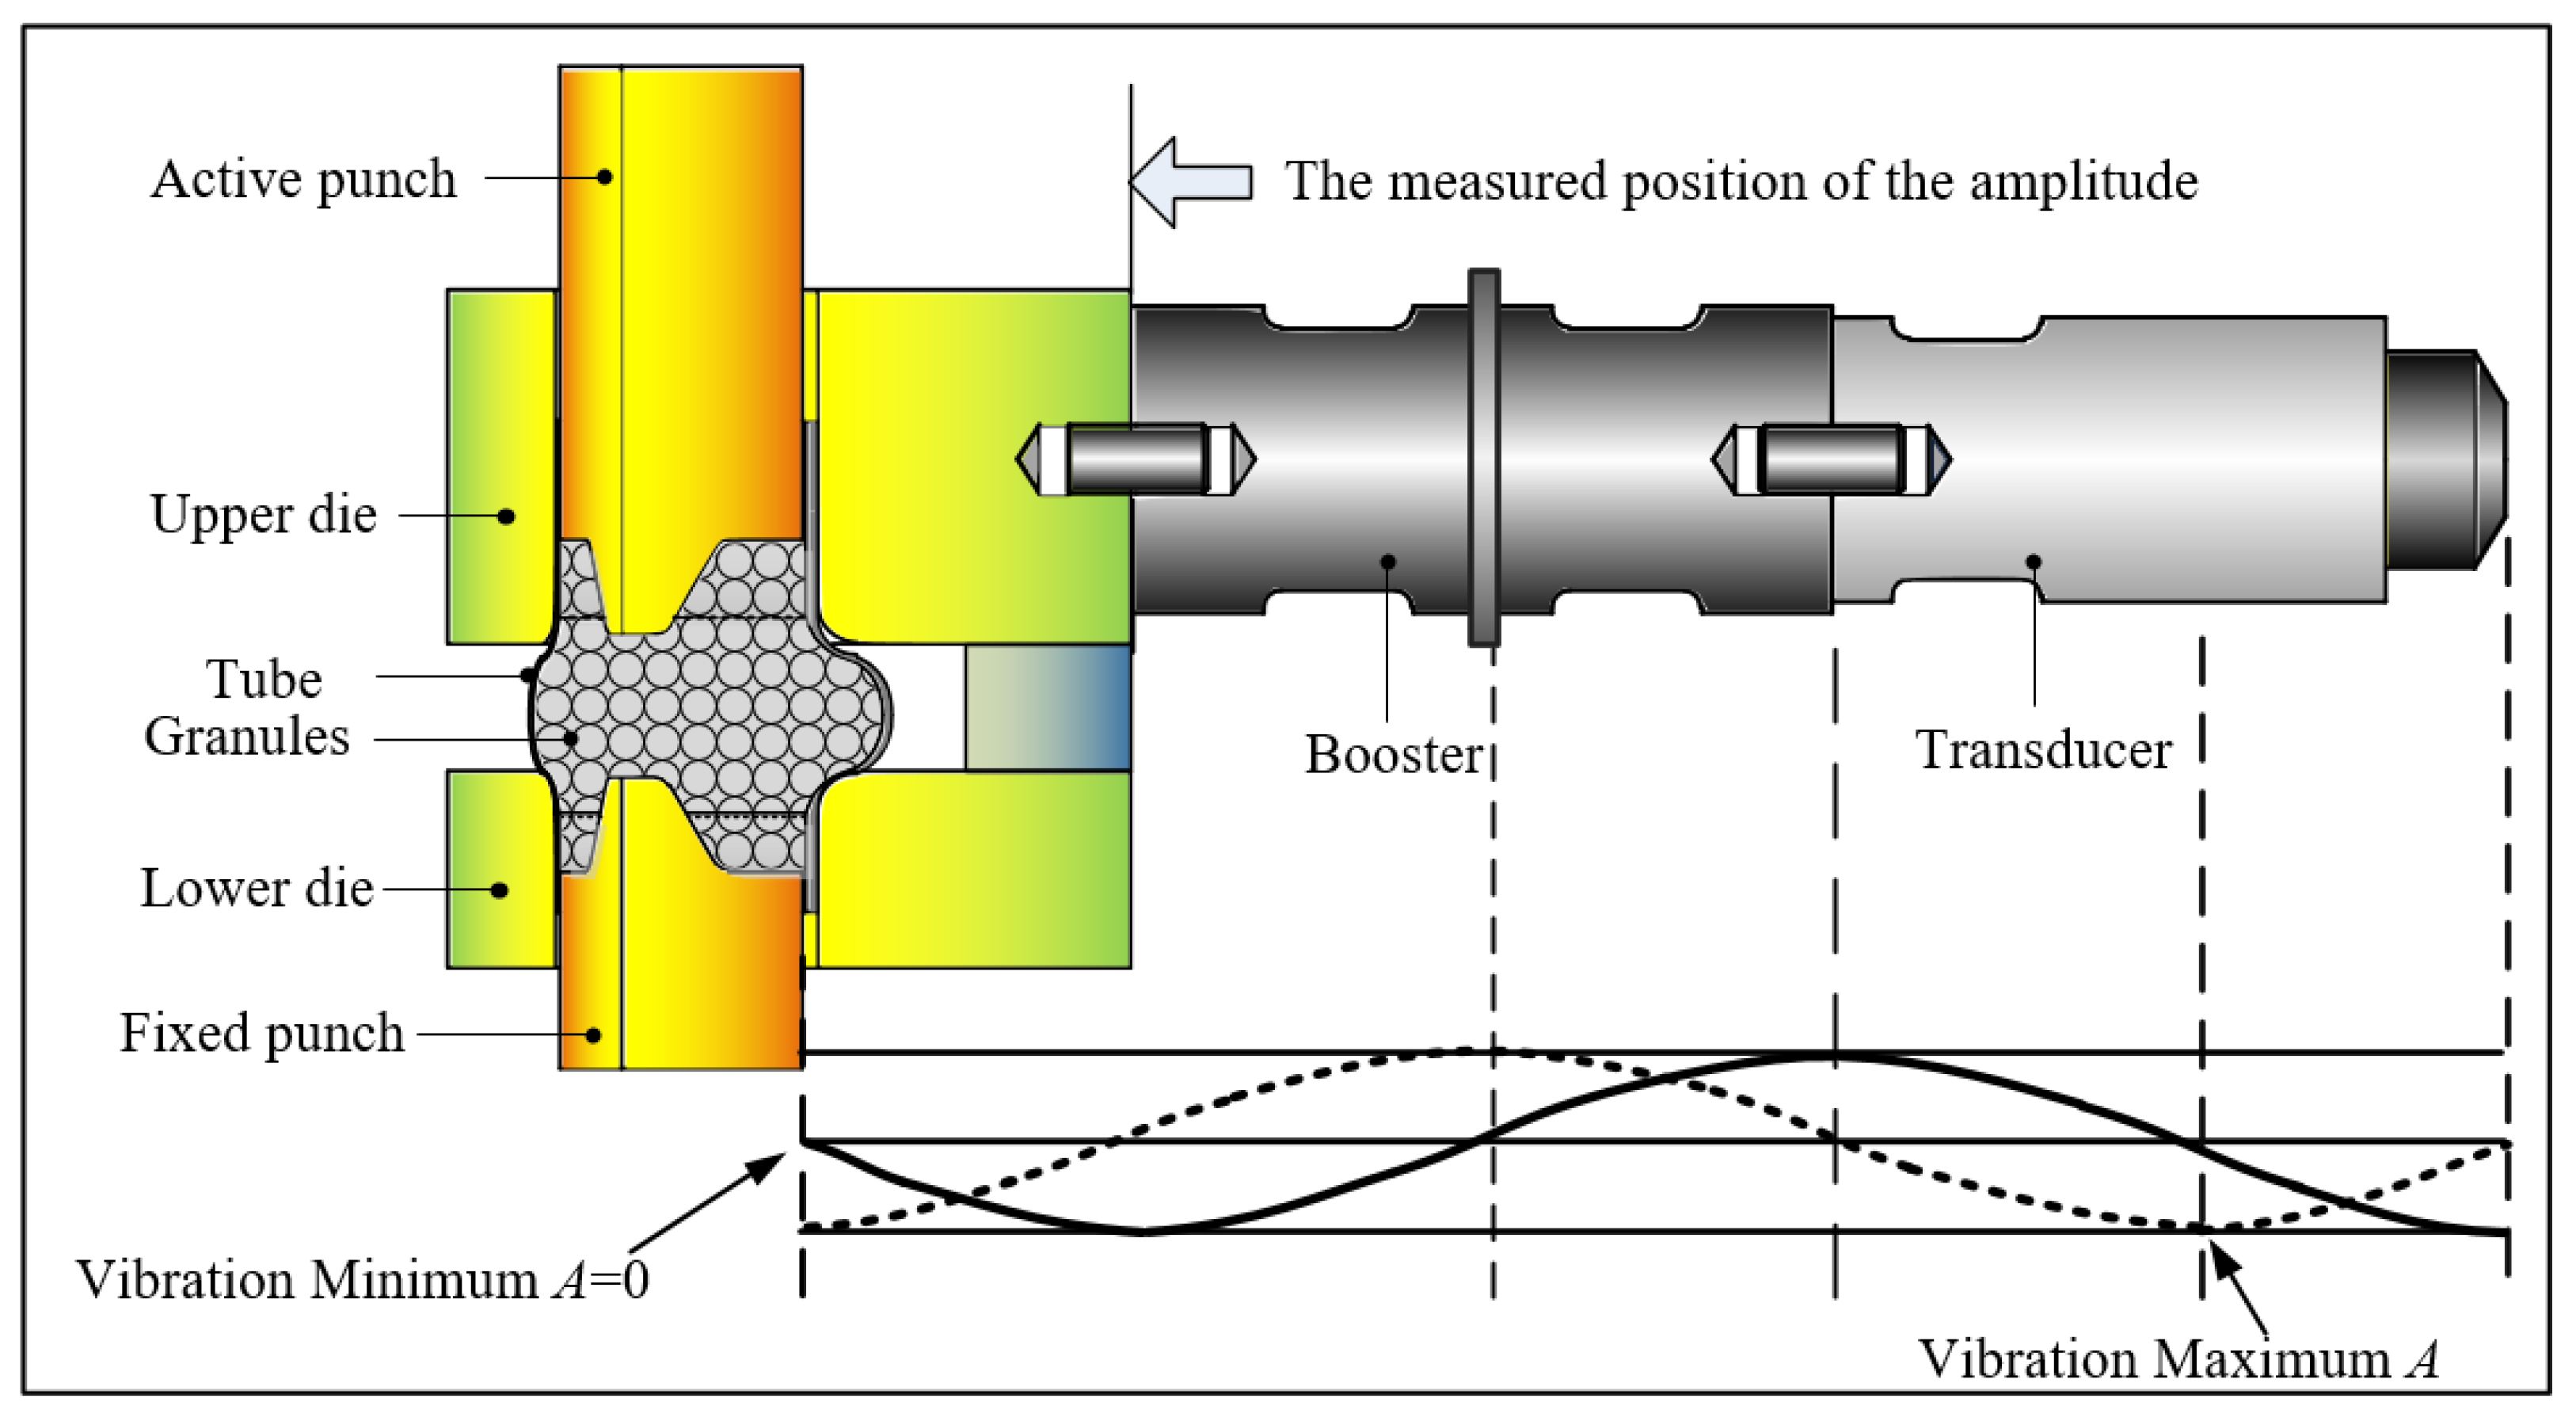
2. The Mechanism of Transverse UV Forming
2.1. Vibration Modal Analysis
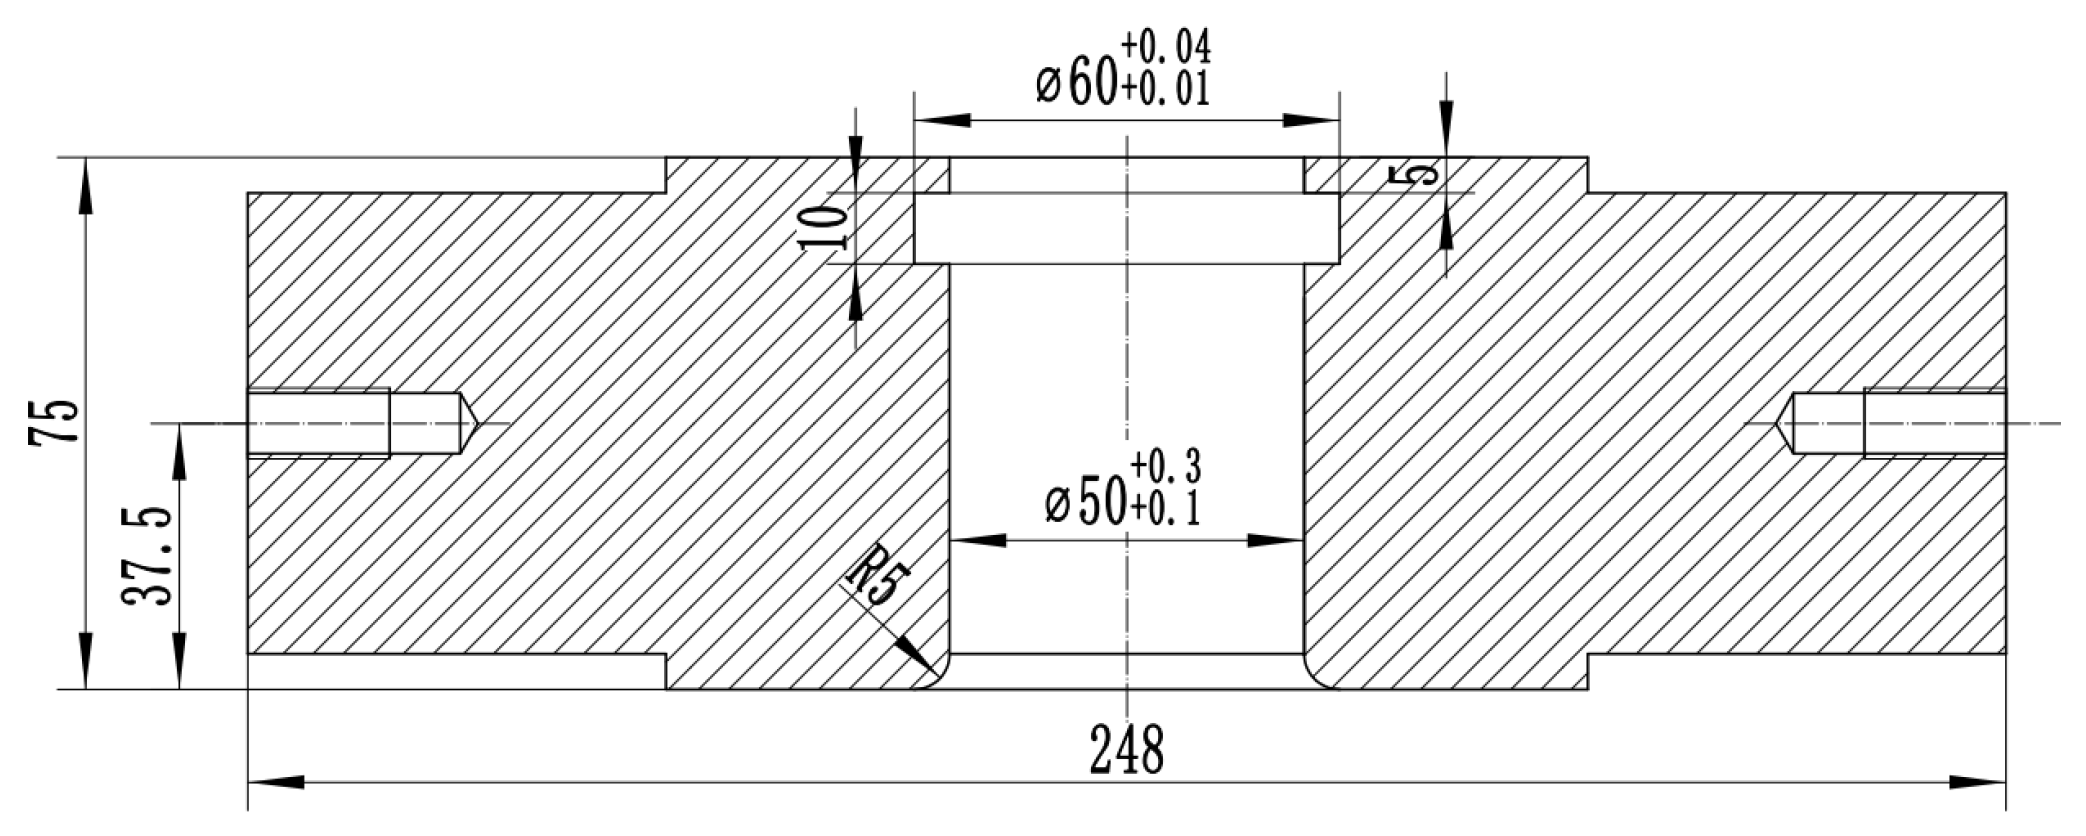
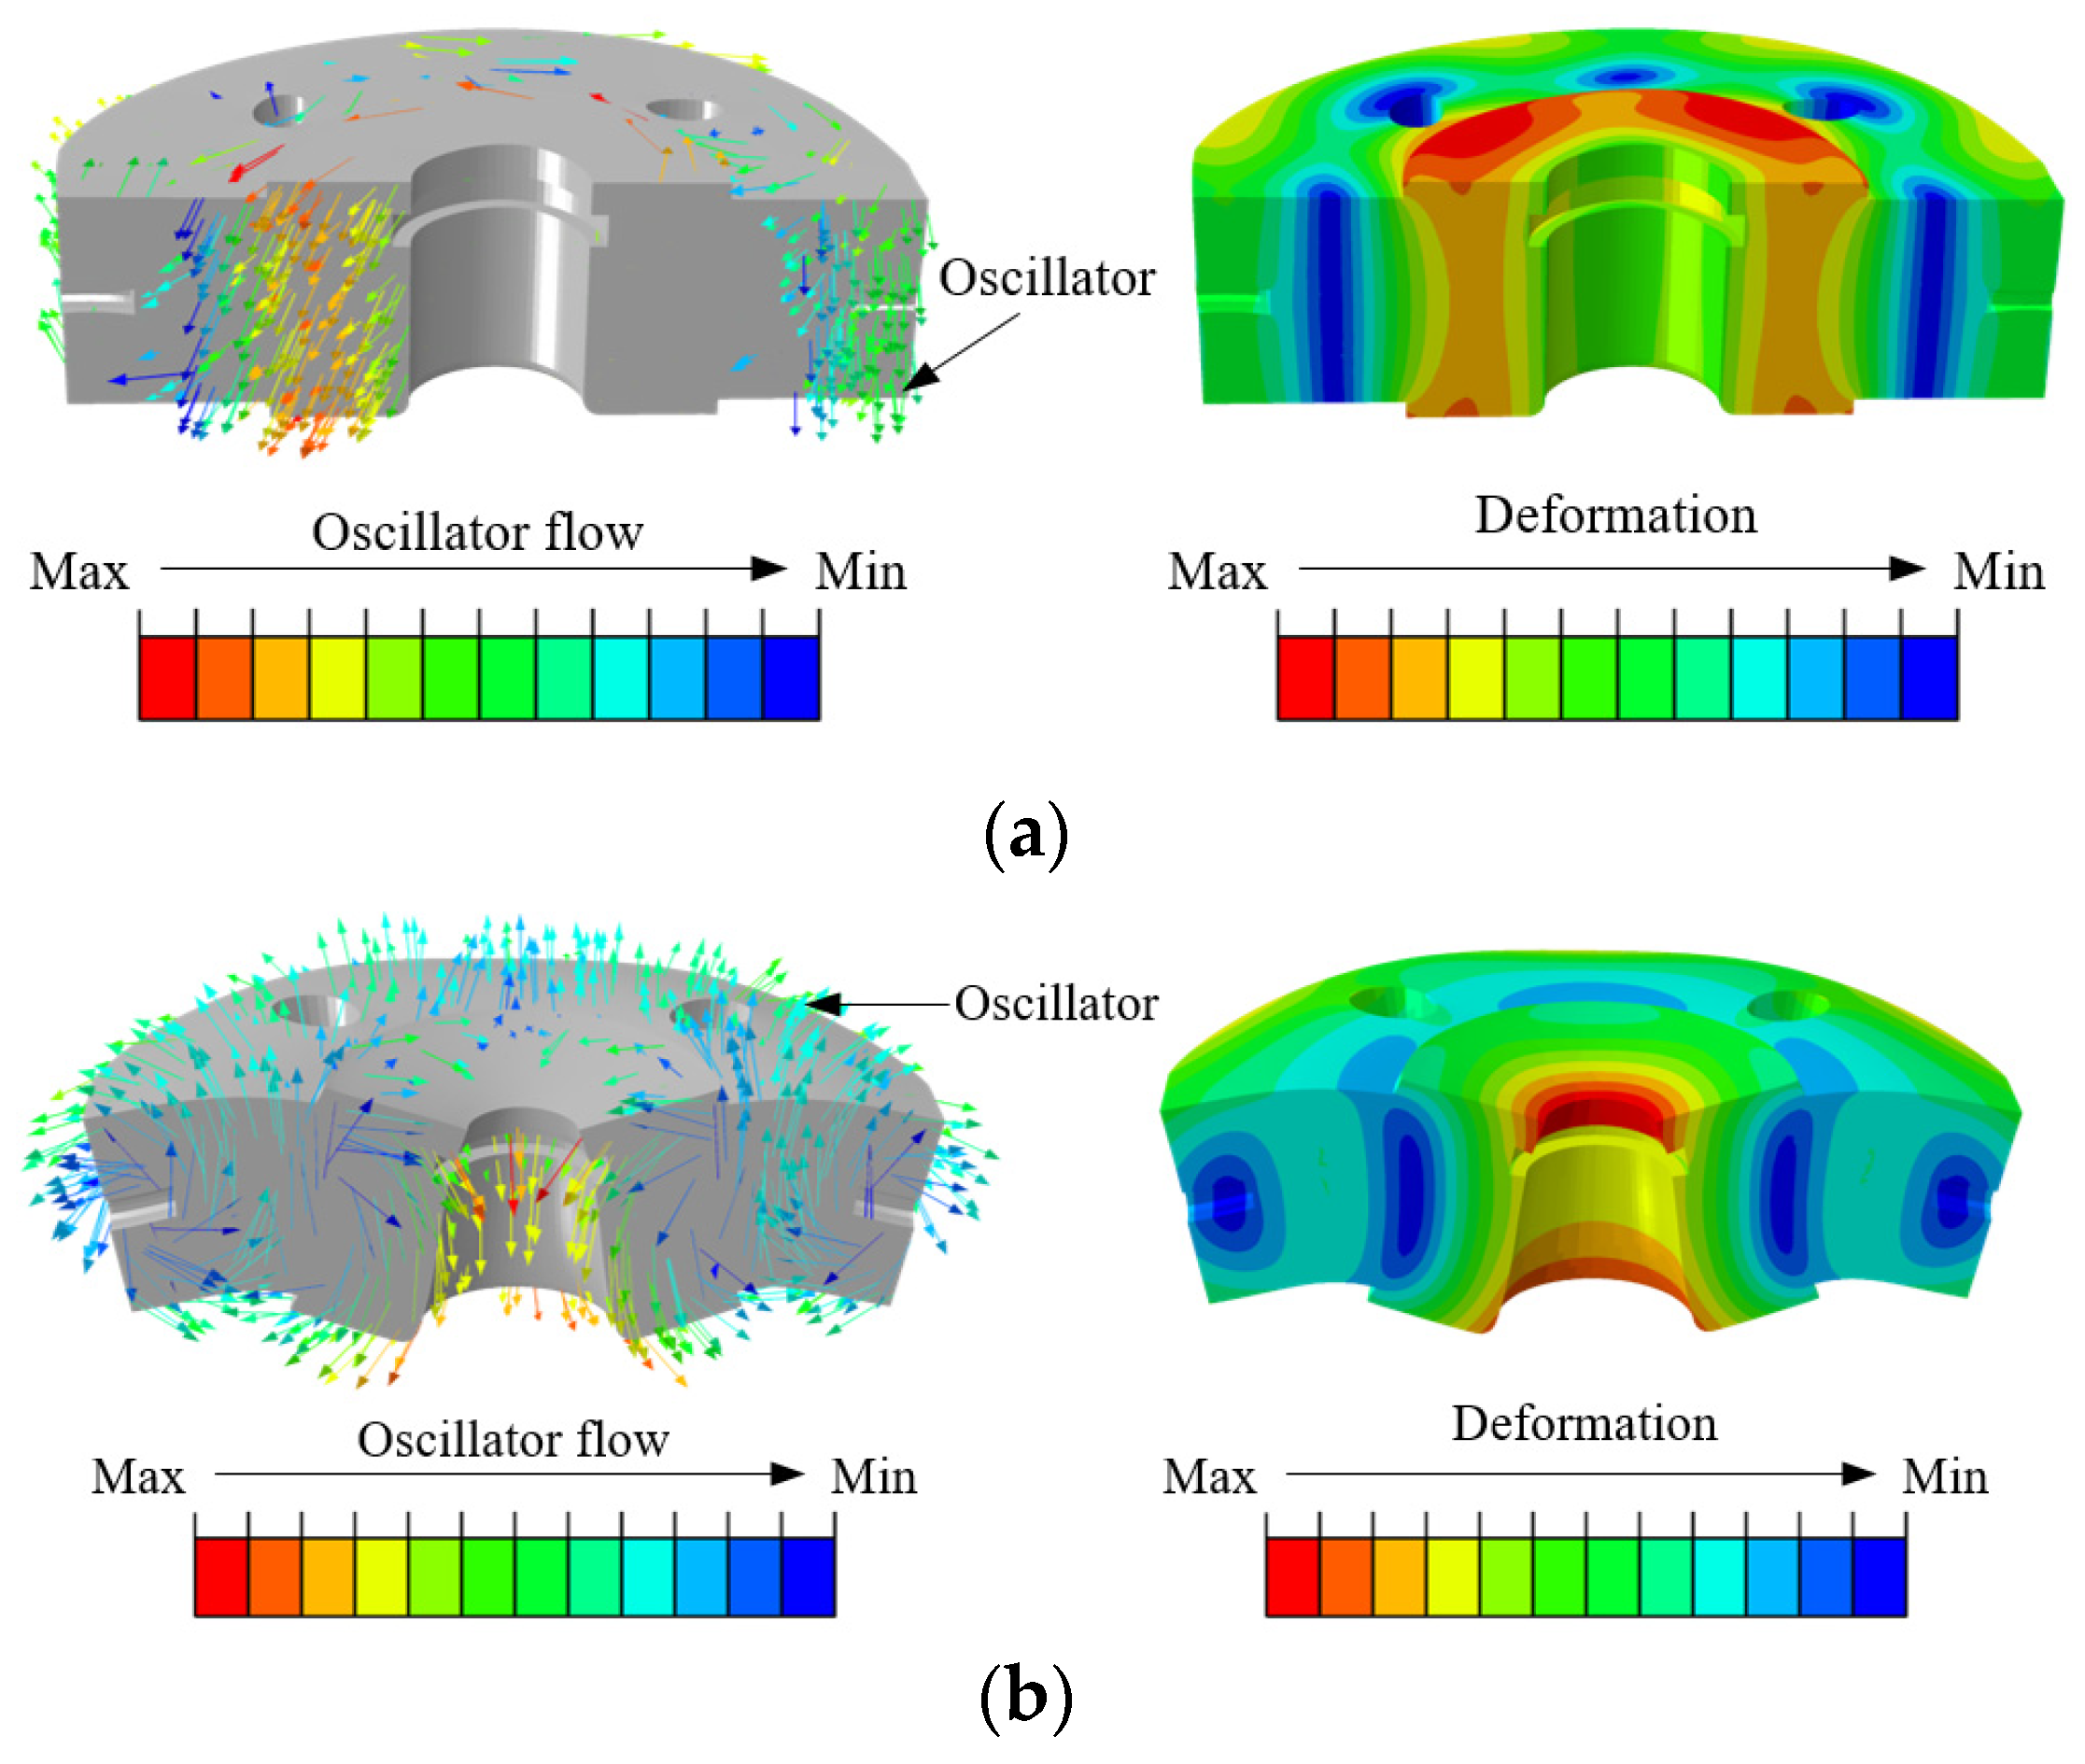
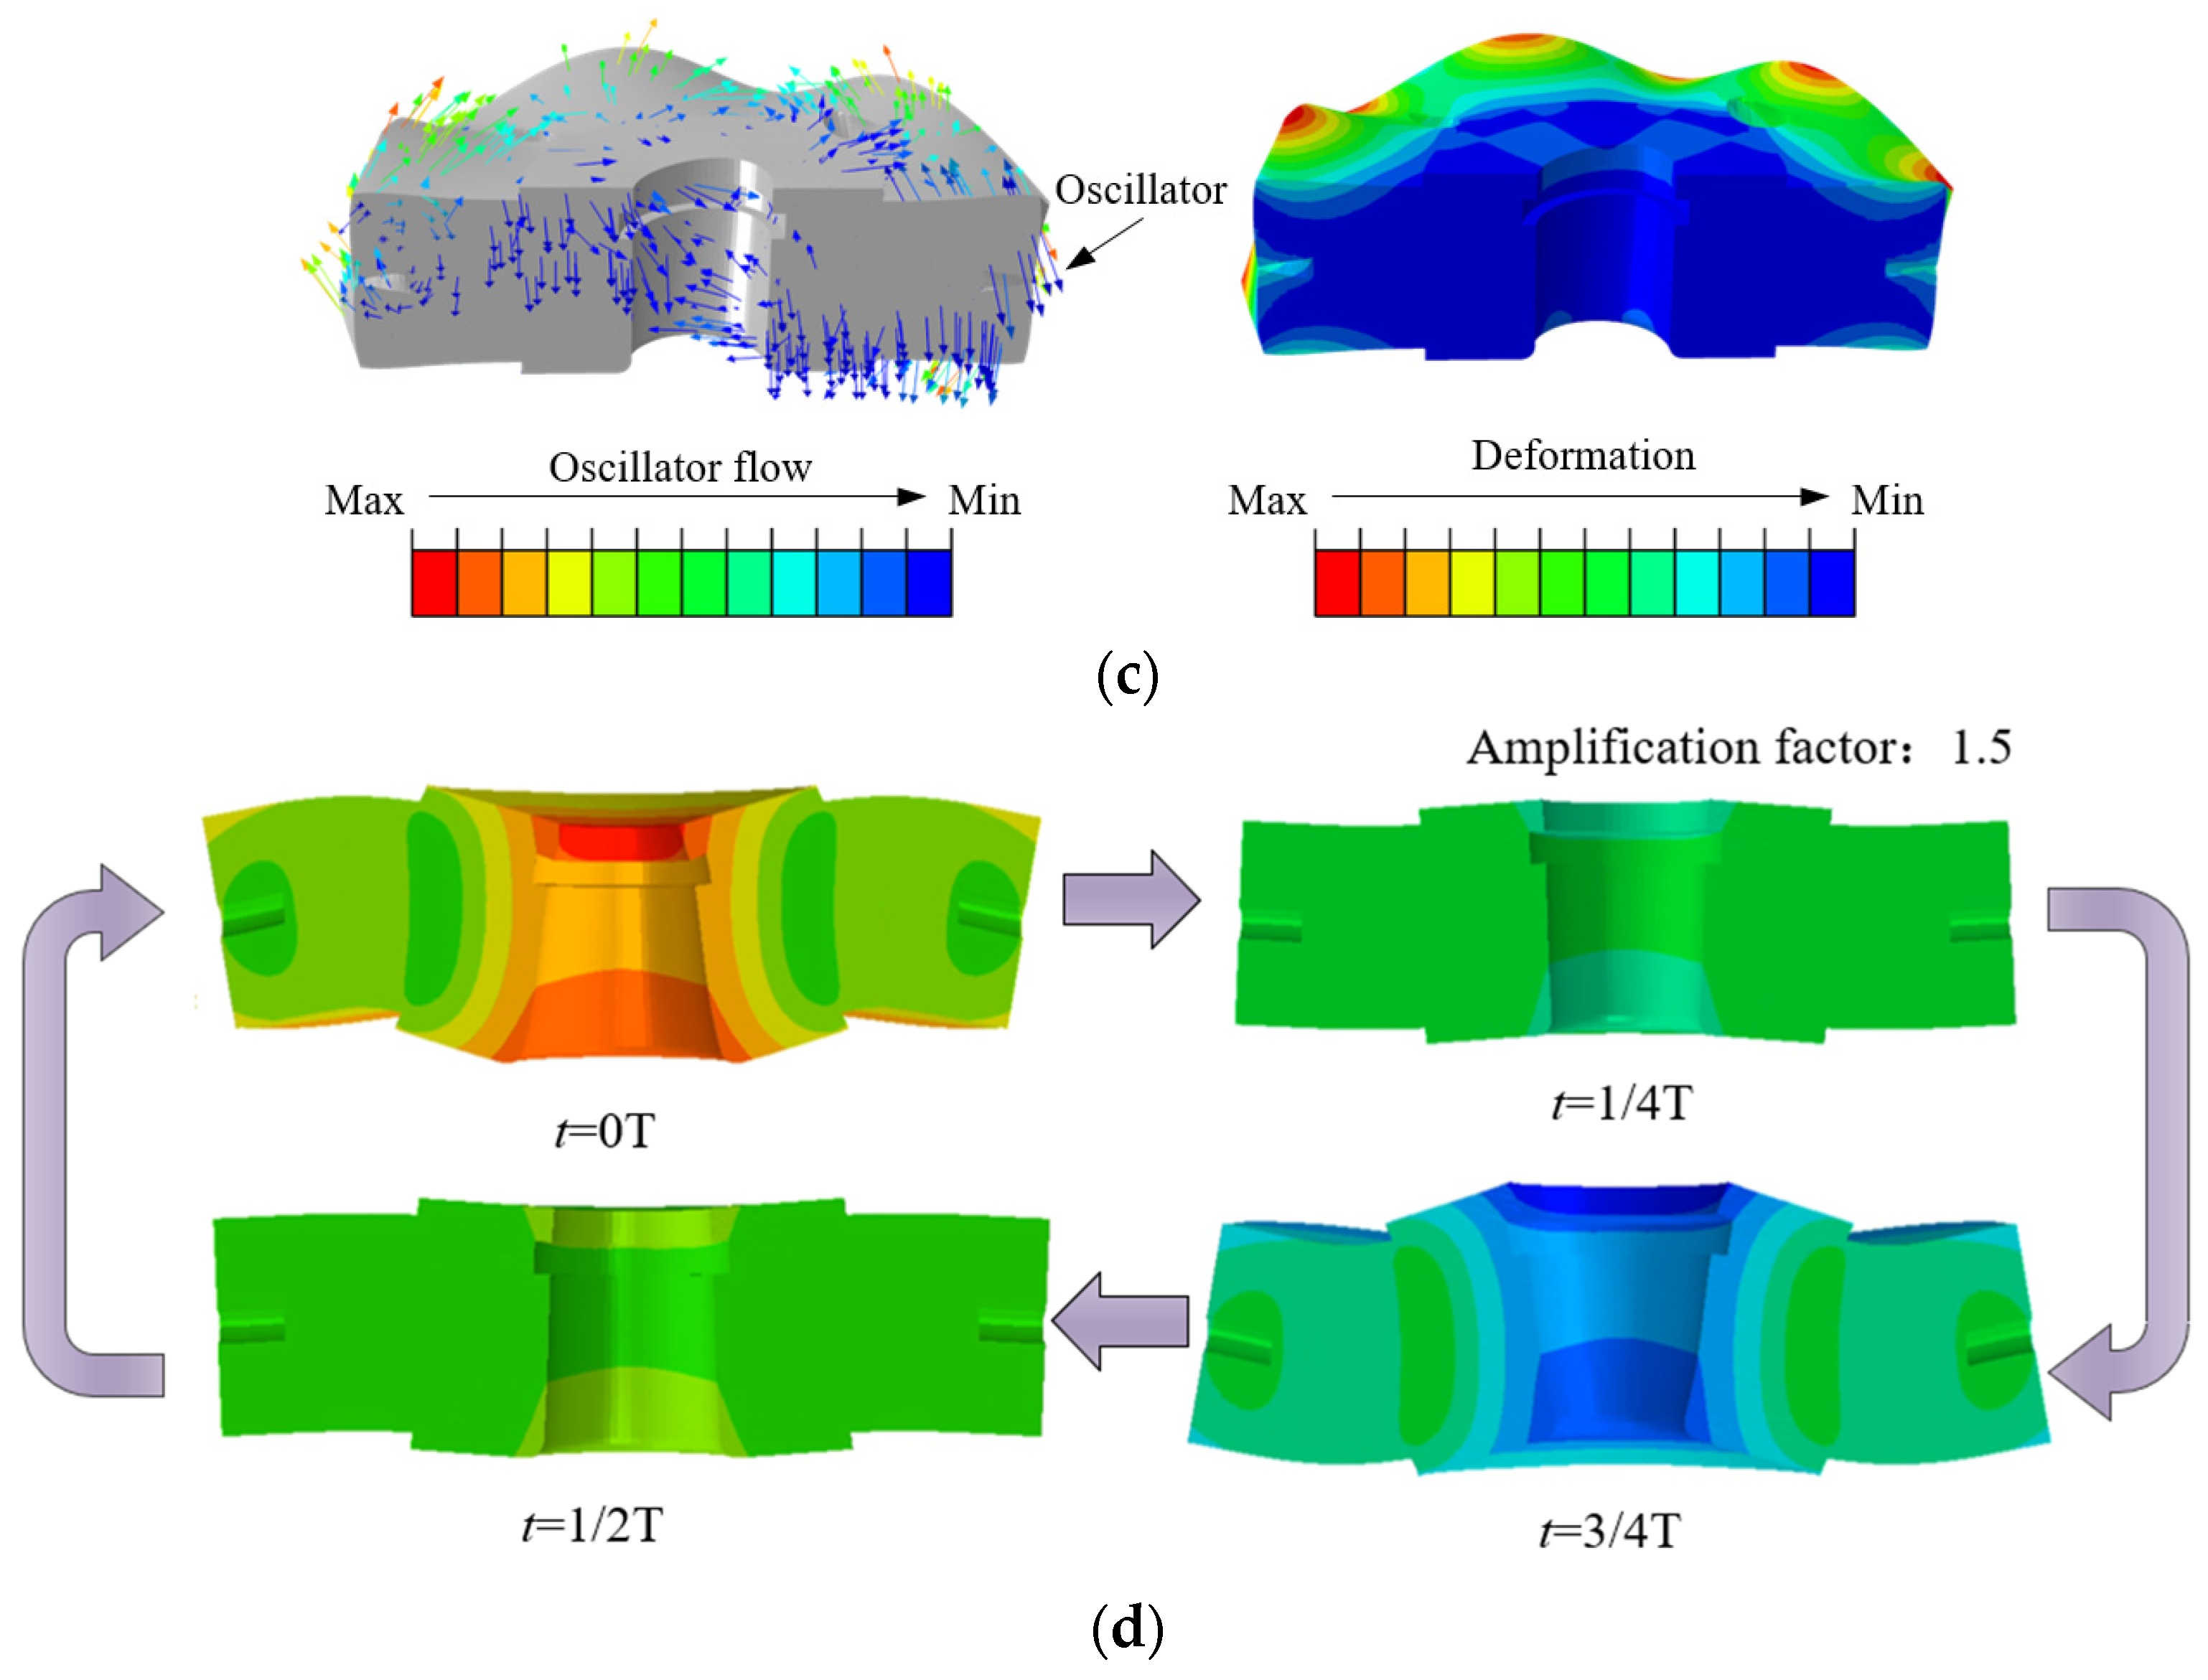
2.2. Die Design and Modal Analysis on UV
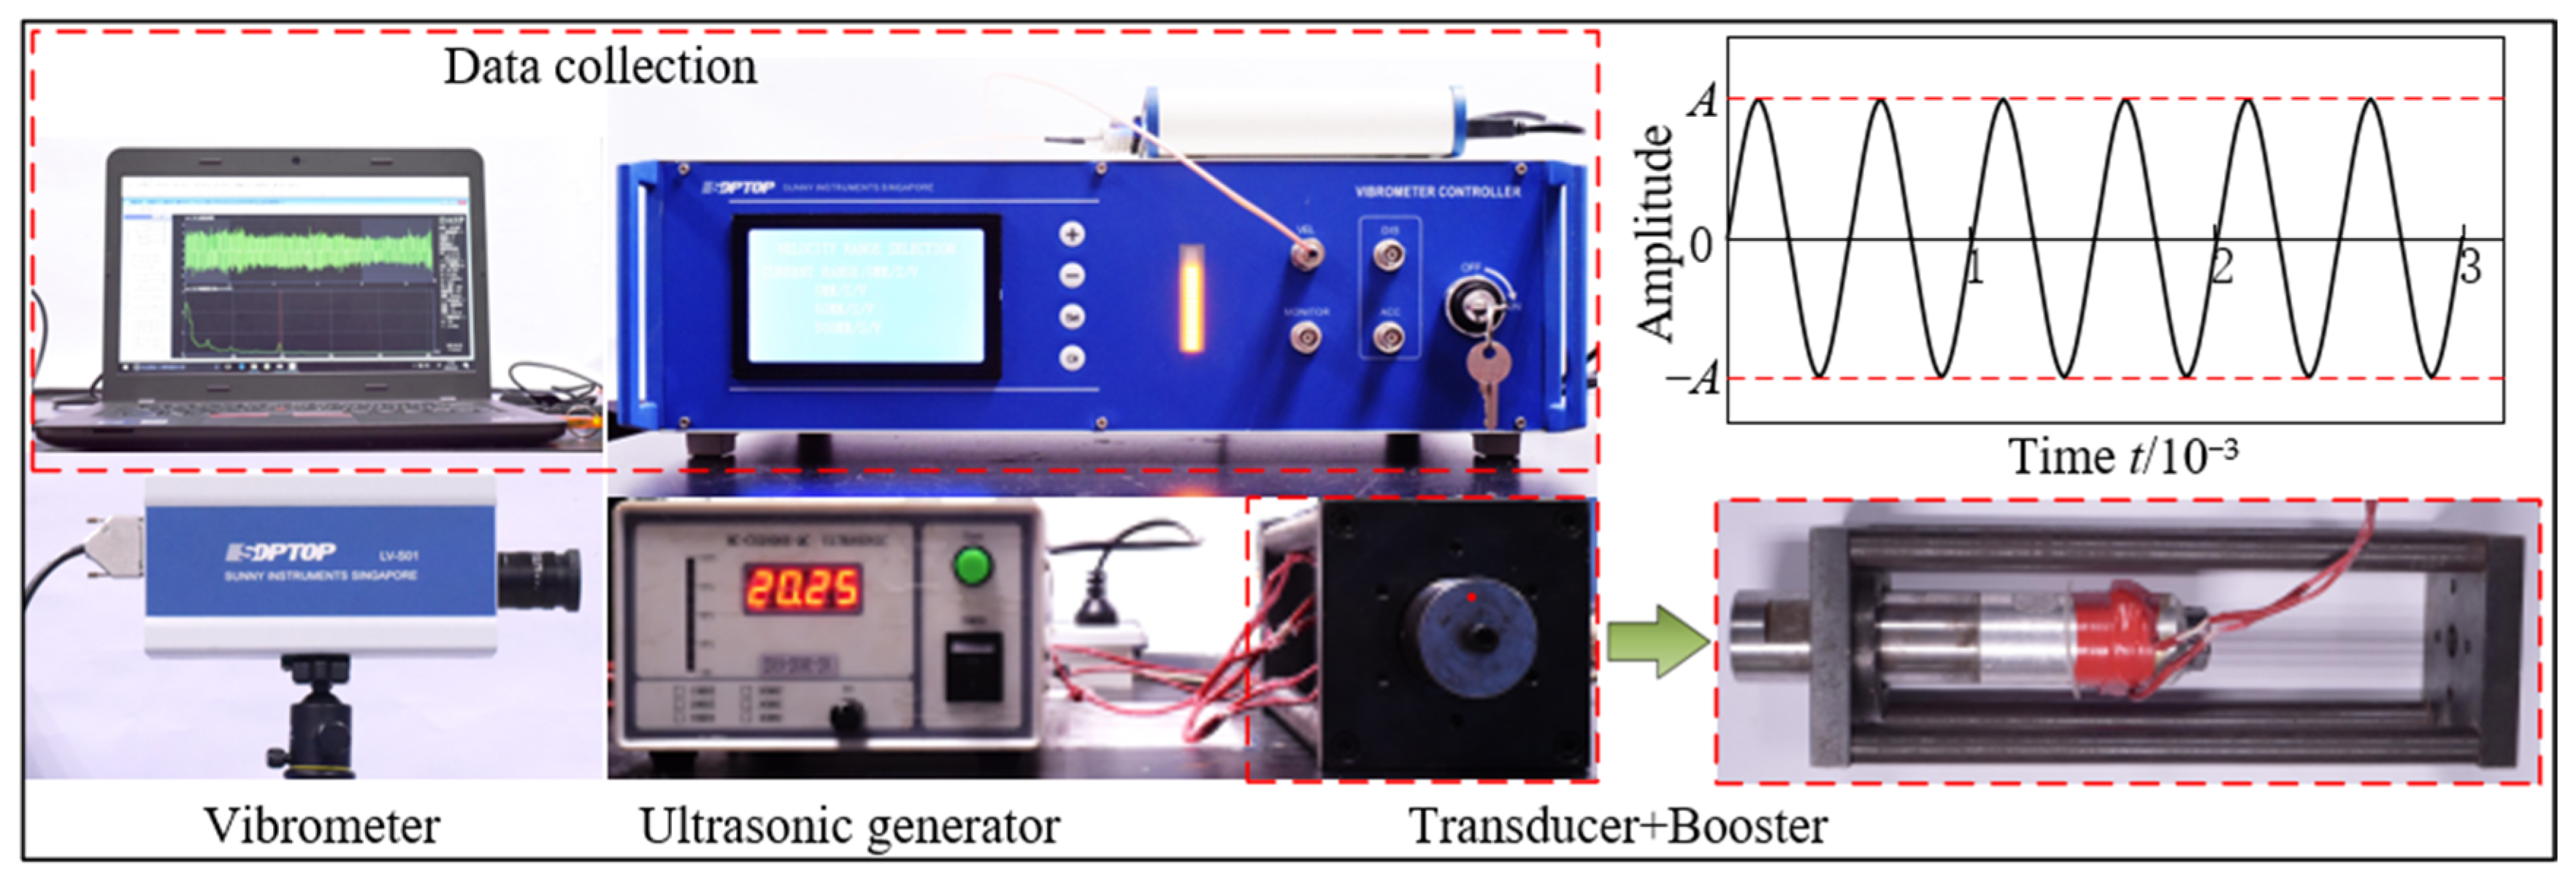
2.3. Measurement of UV Amplitudes
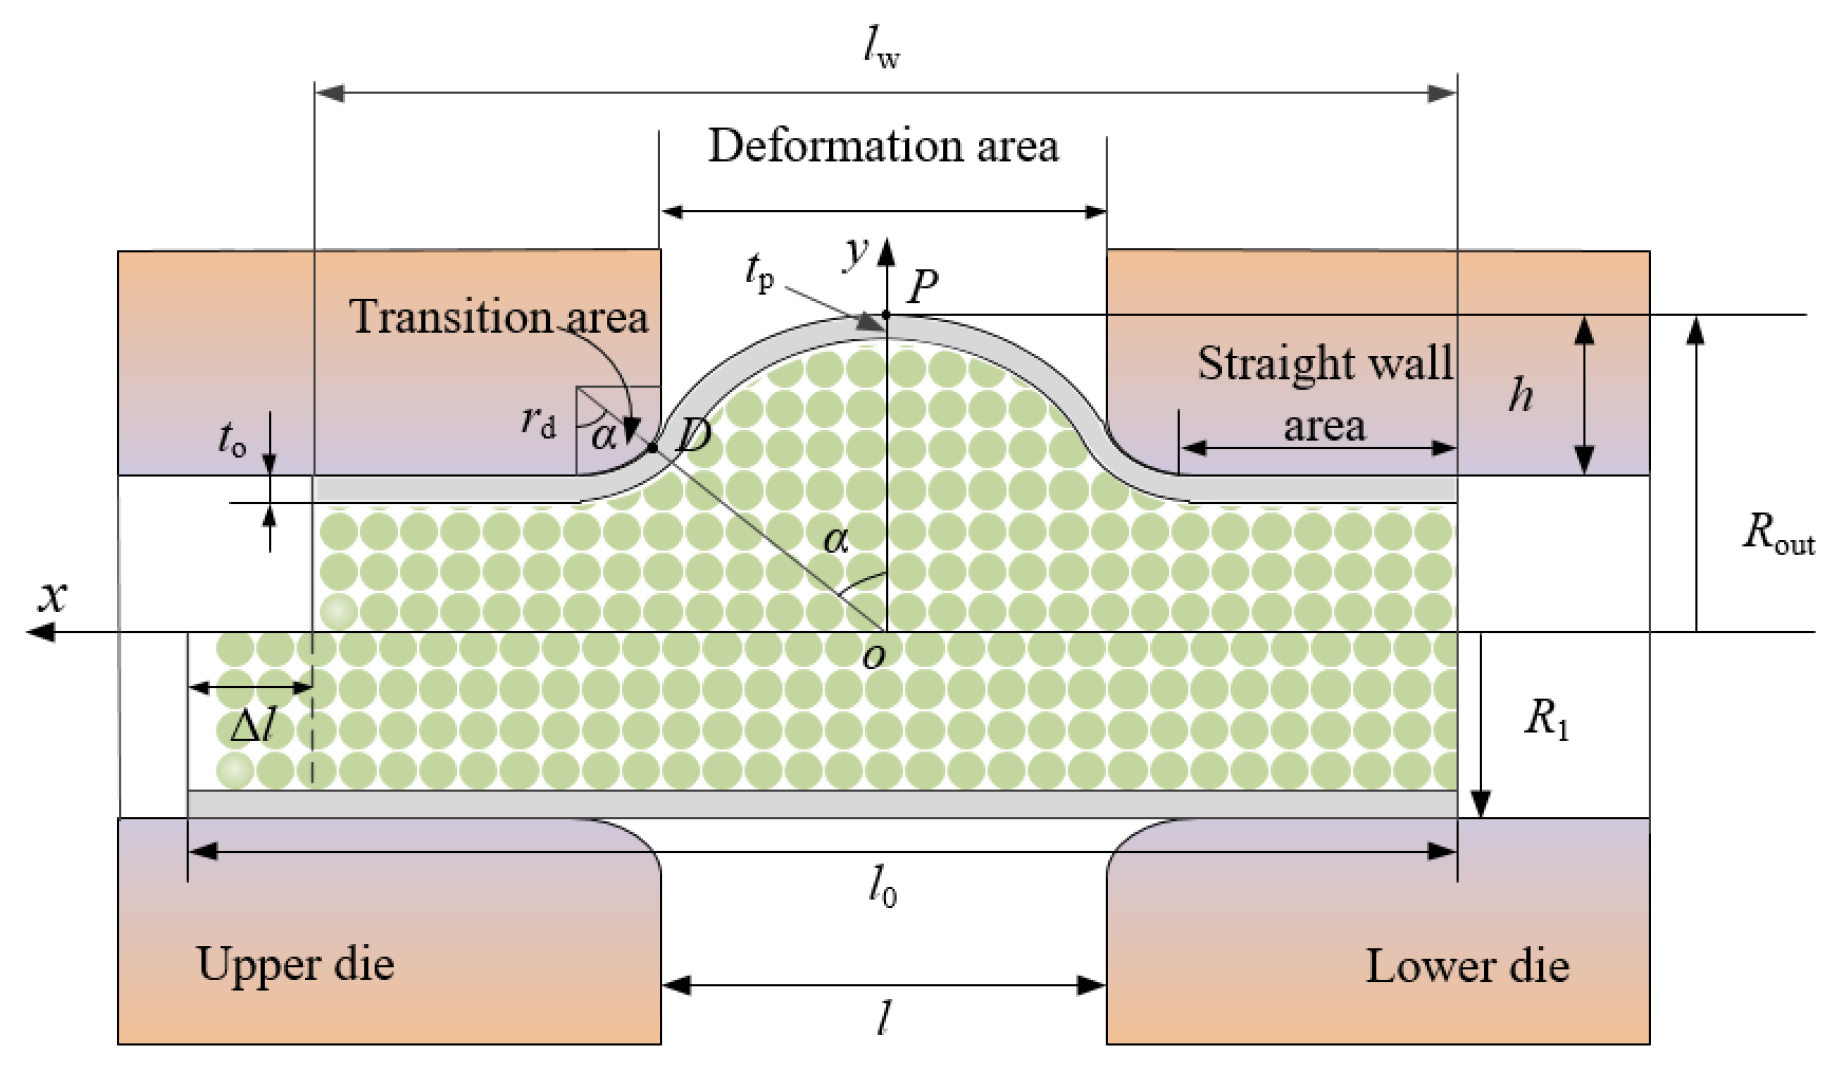
2.4. Geometrical Model
3. Simulation Analysis
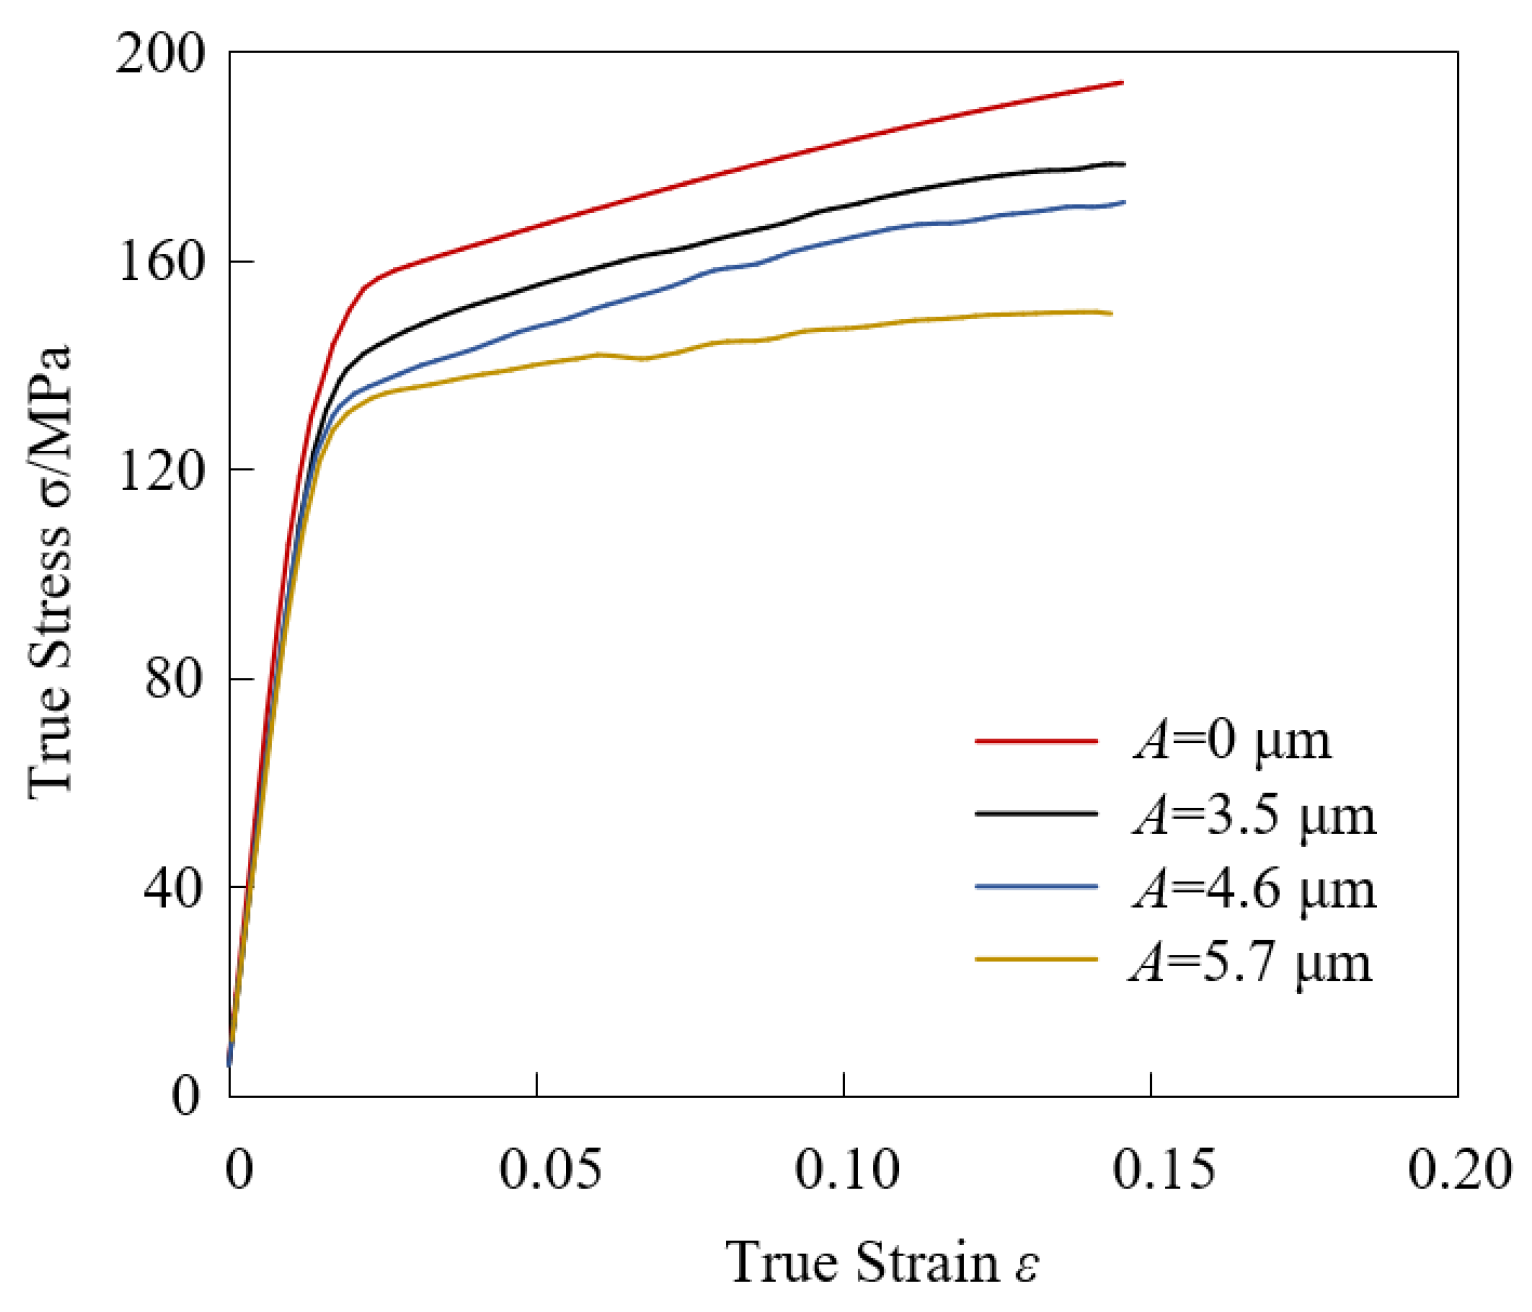
3.1. Unidirectional Tensile Test under Transverse UV
3.2. FE-DE Model
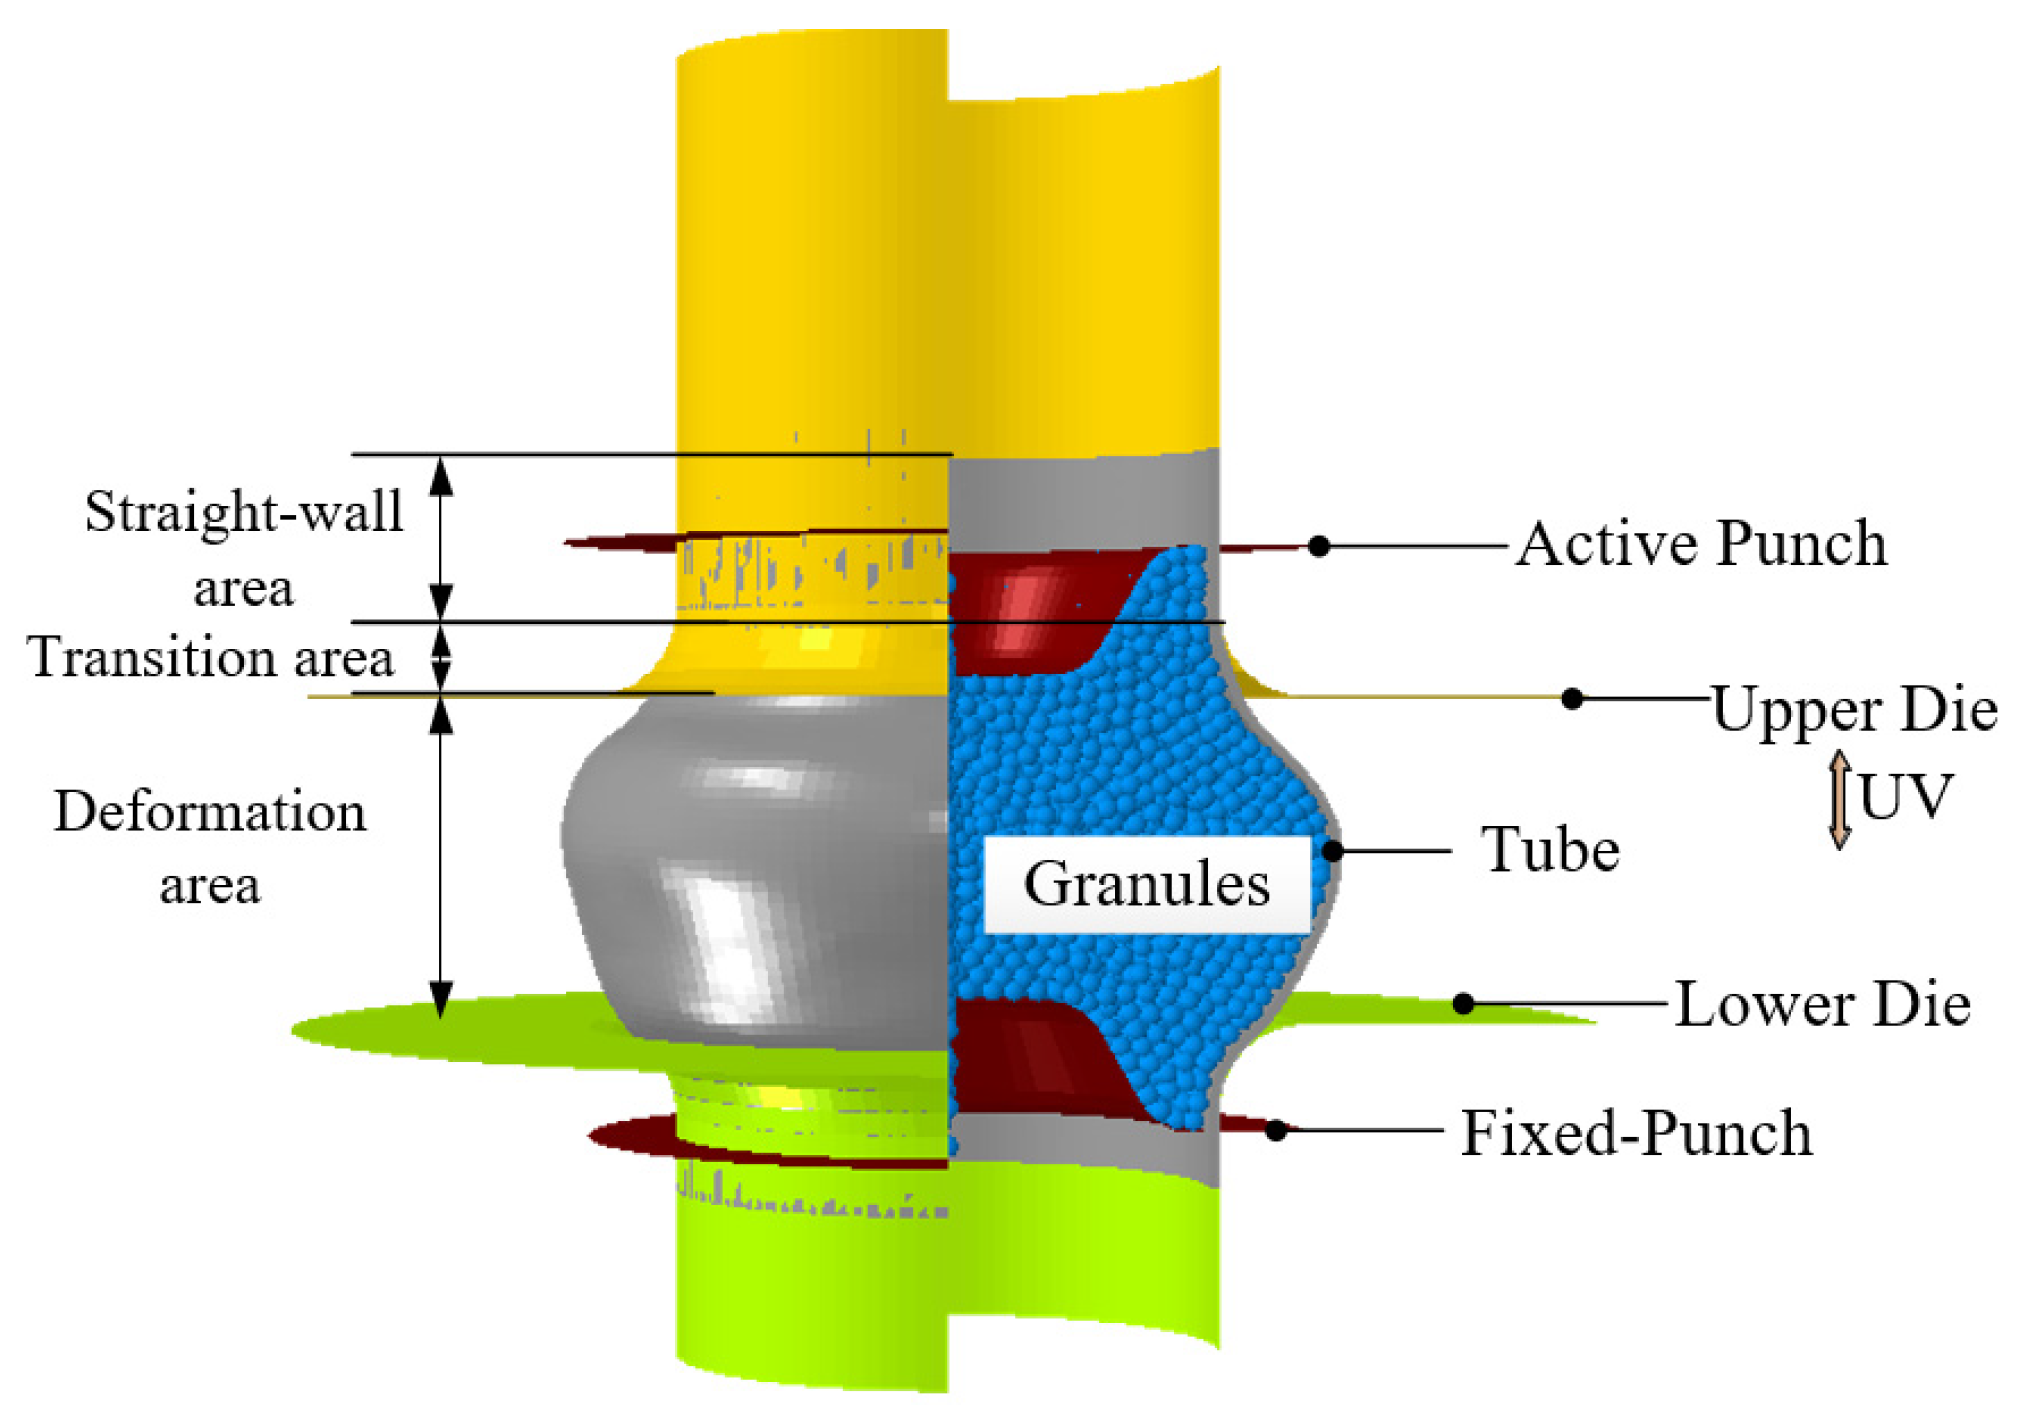
3.2.1. Modeling
3.2.2. Materials
3.2.3. Boundary Conditions and Loading
3.2.4. Interactions
4. Analysis of Result of Finite Element Simulation
5. Experimental Validation of the Process and Analysis
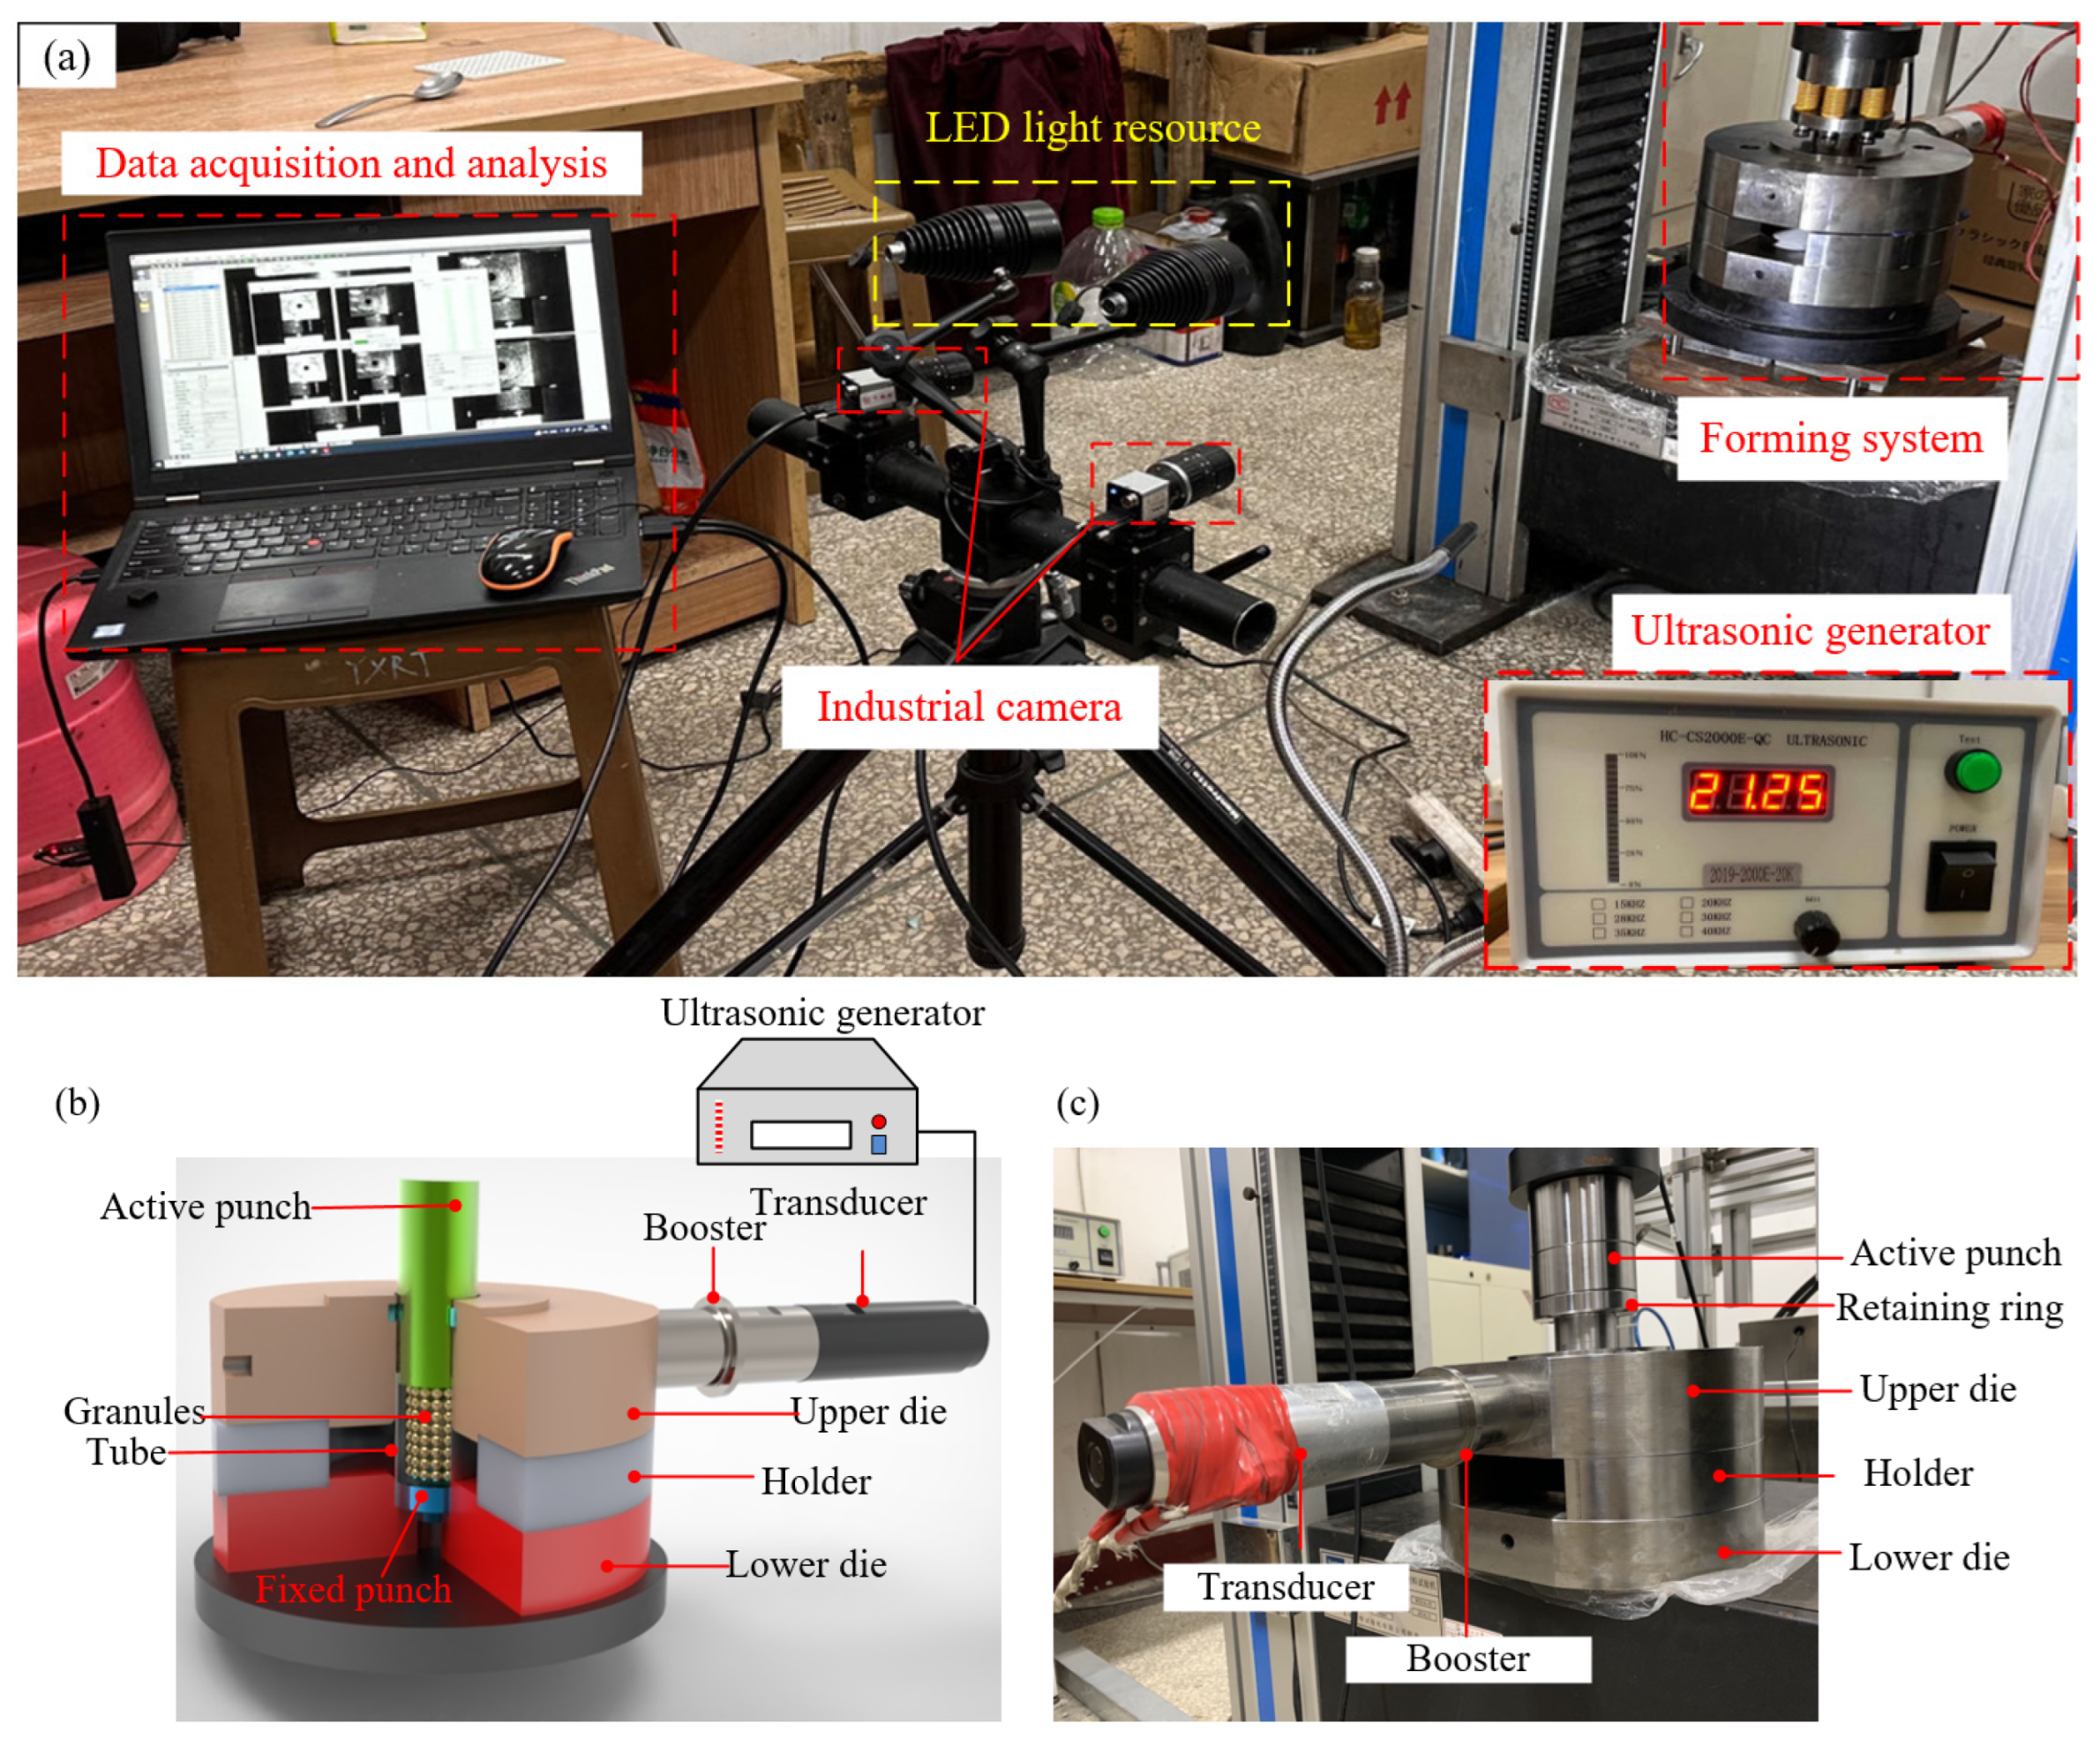
5.1. Experimental Equipment
5.2. Experimental Results and Discussion
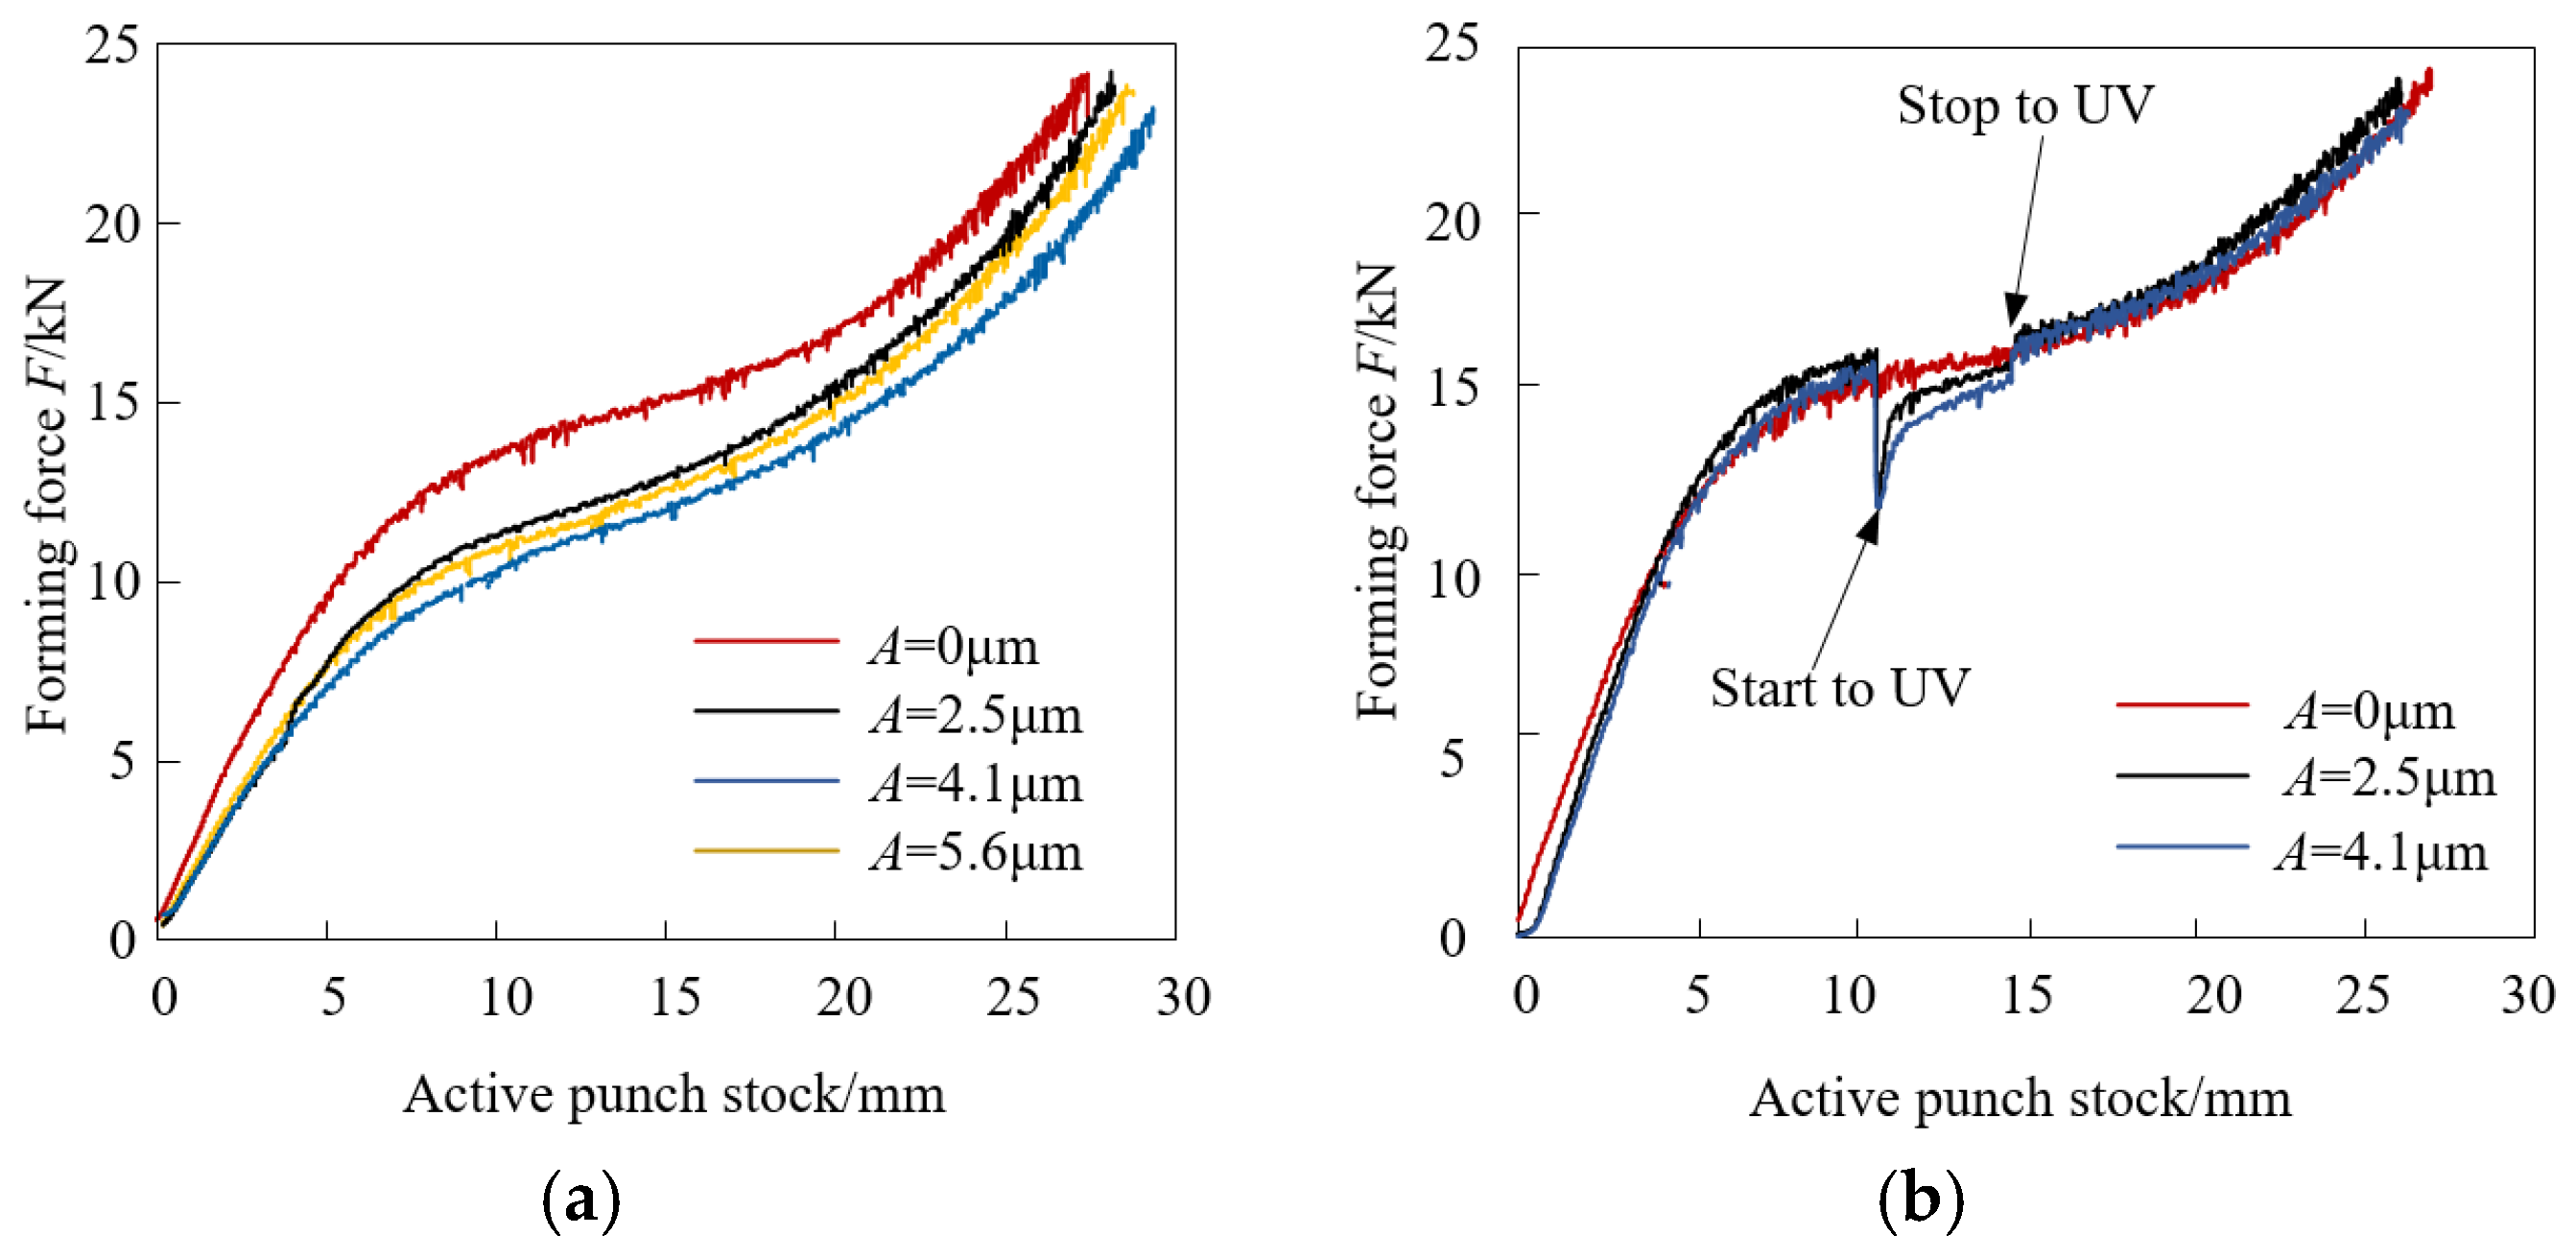
5.2.1. The Effect of UV on the Forming Force
5.2.2. The Effect of UV on the Forming Force
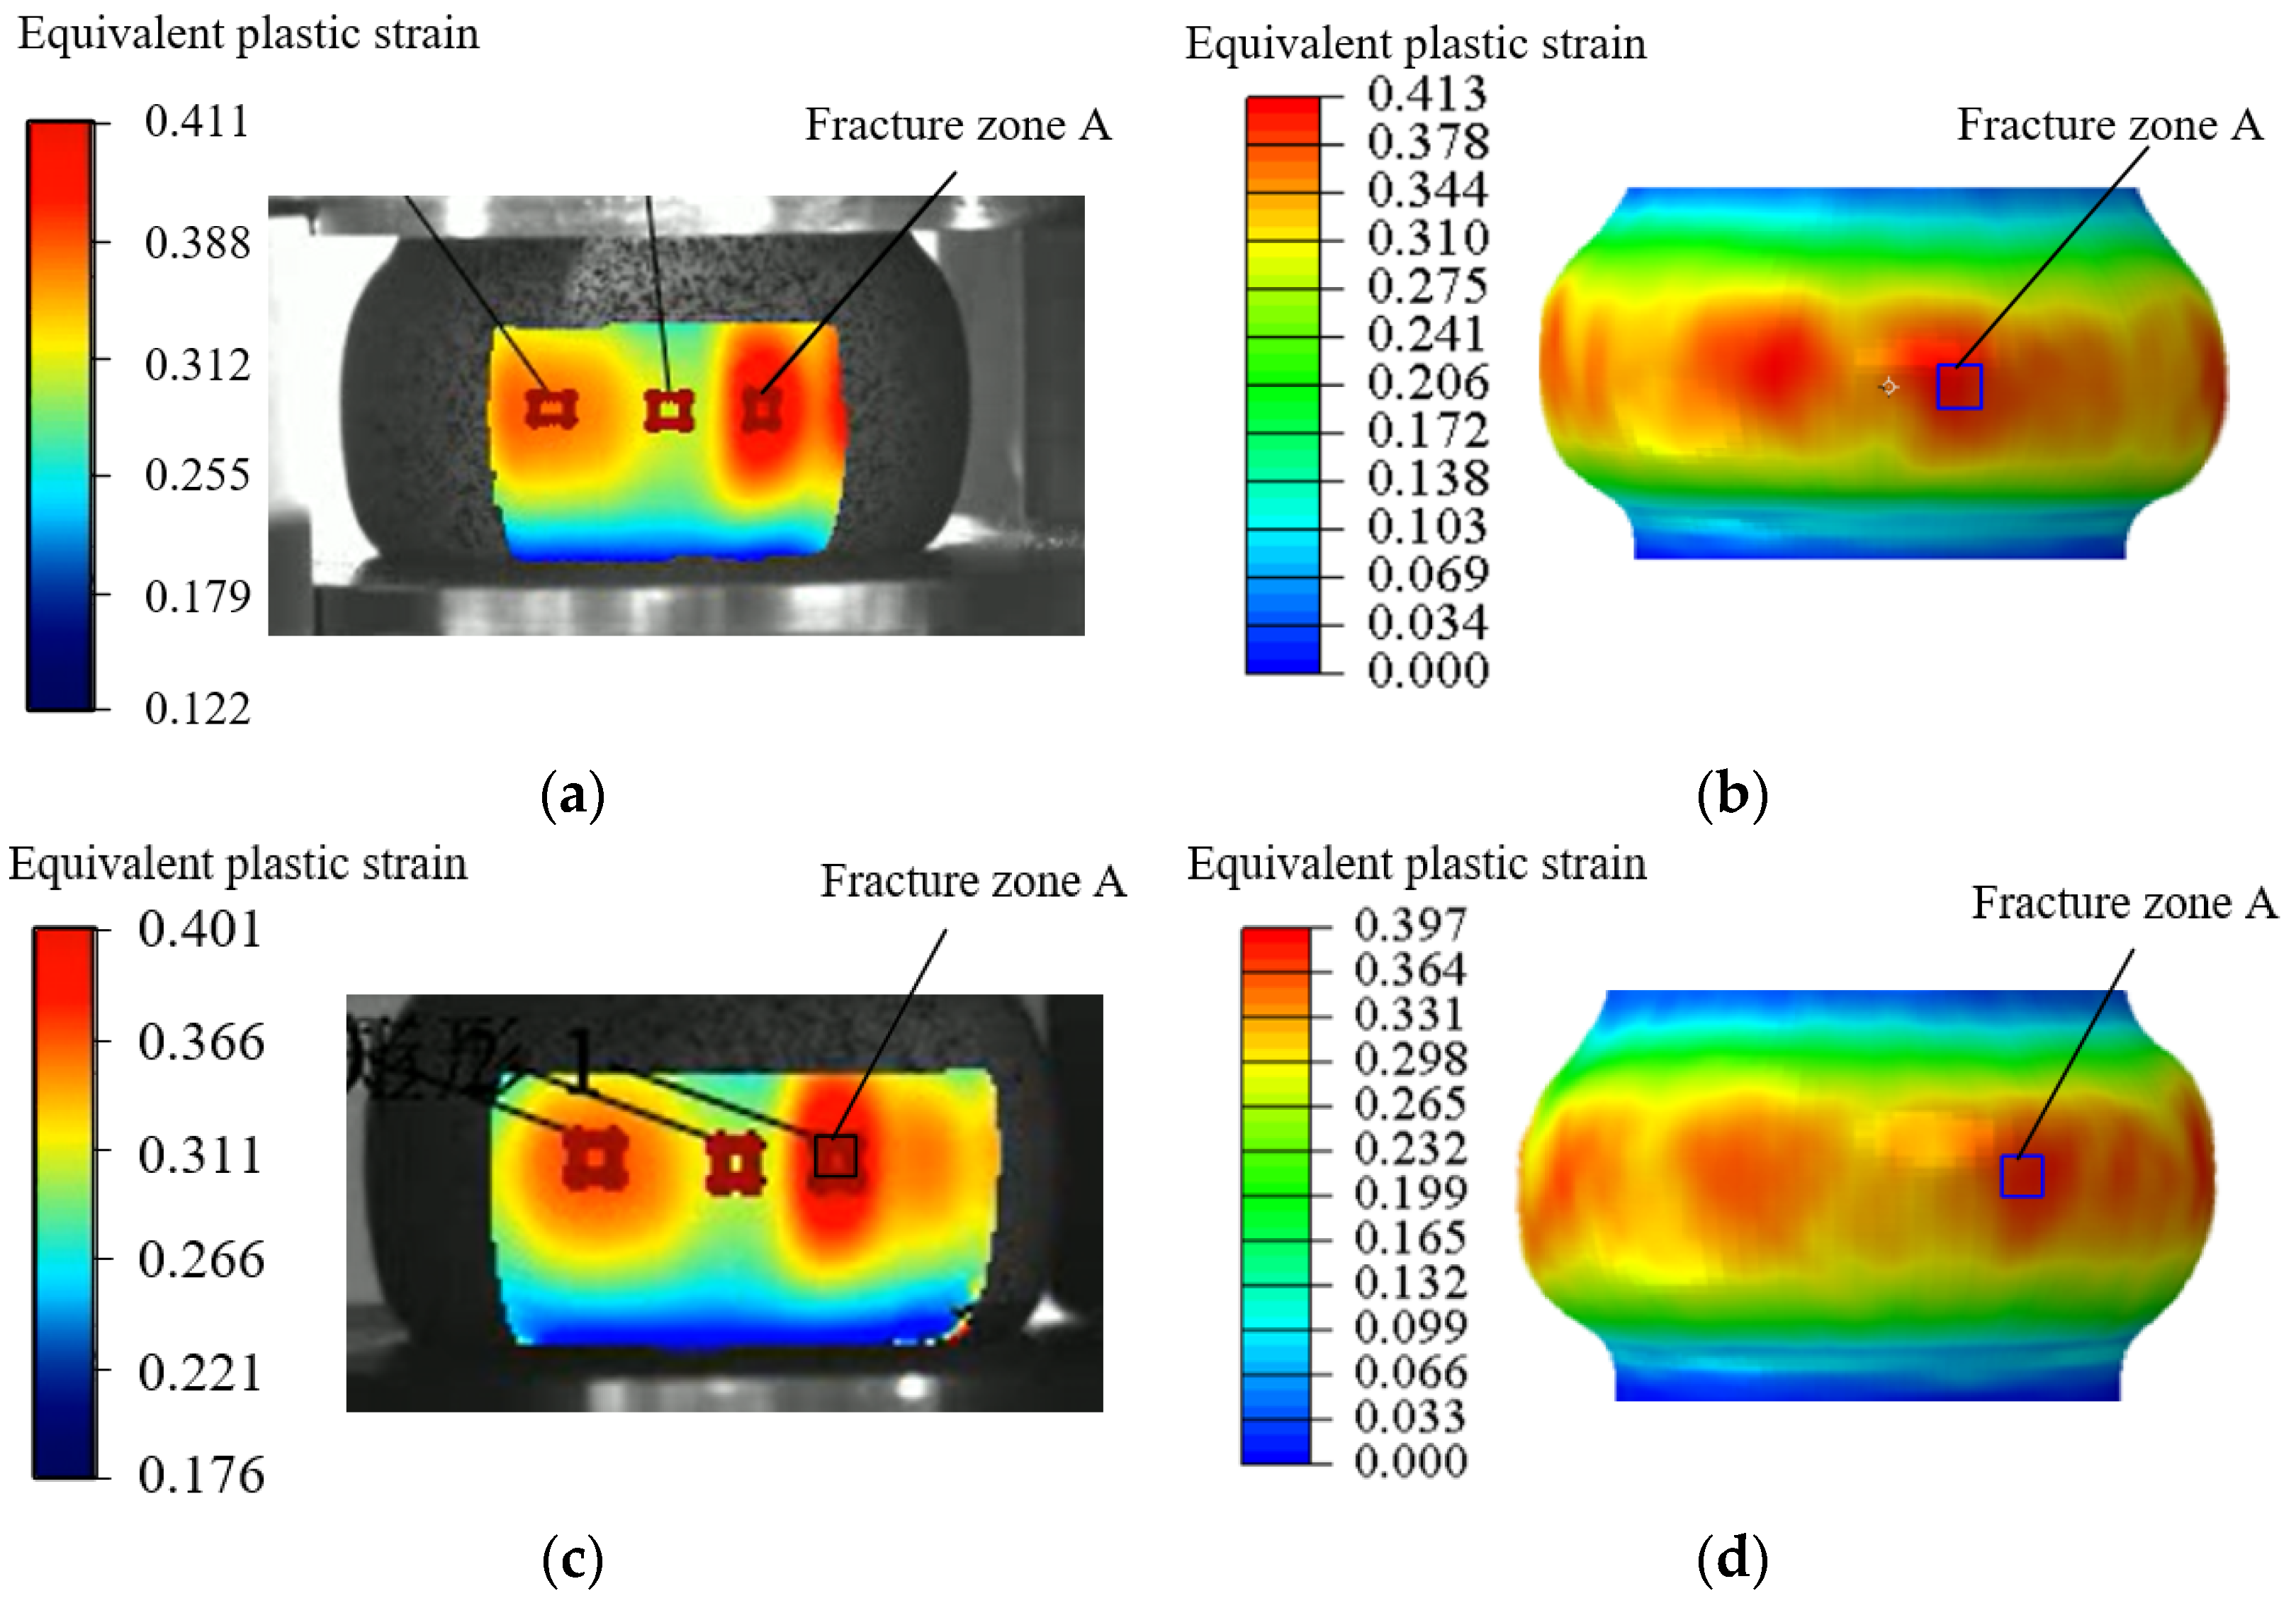
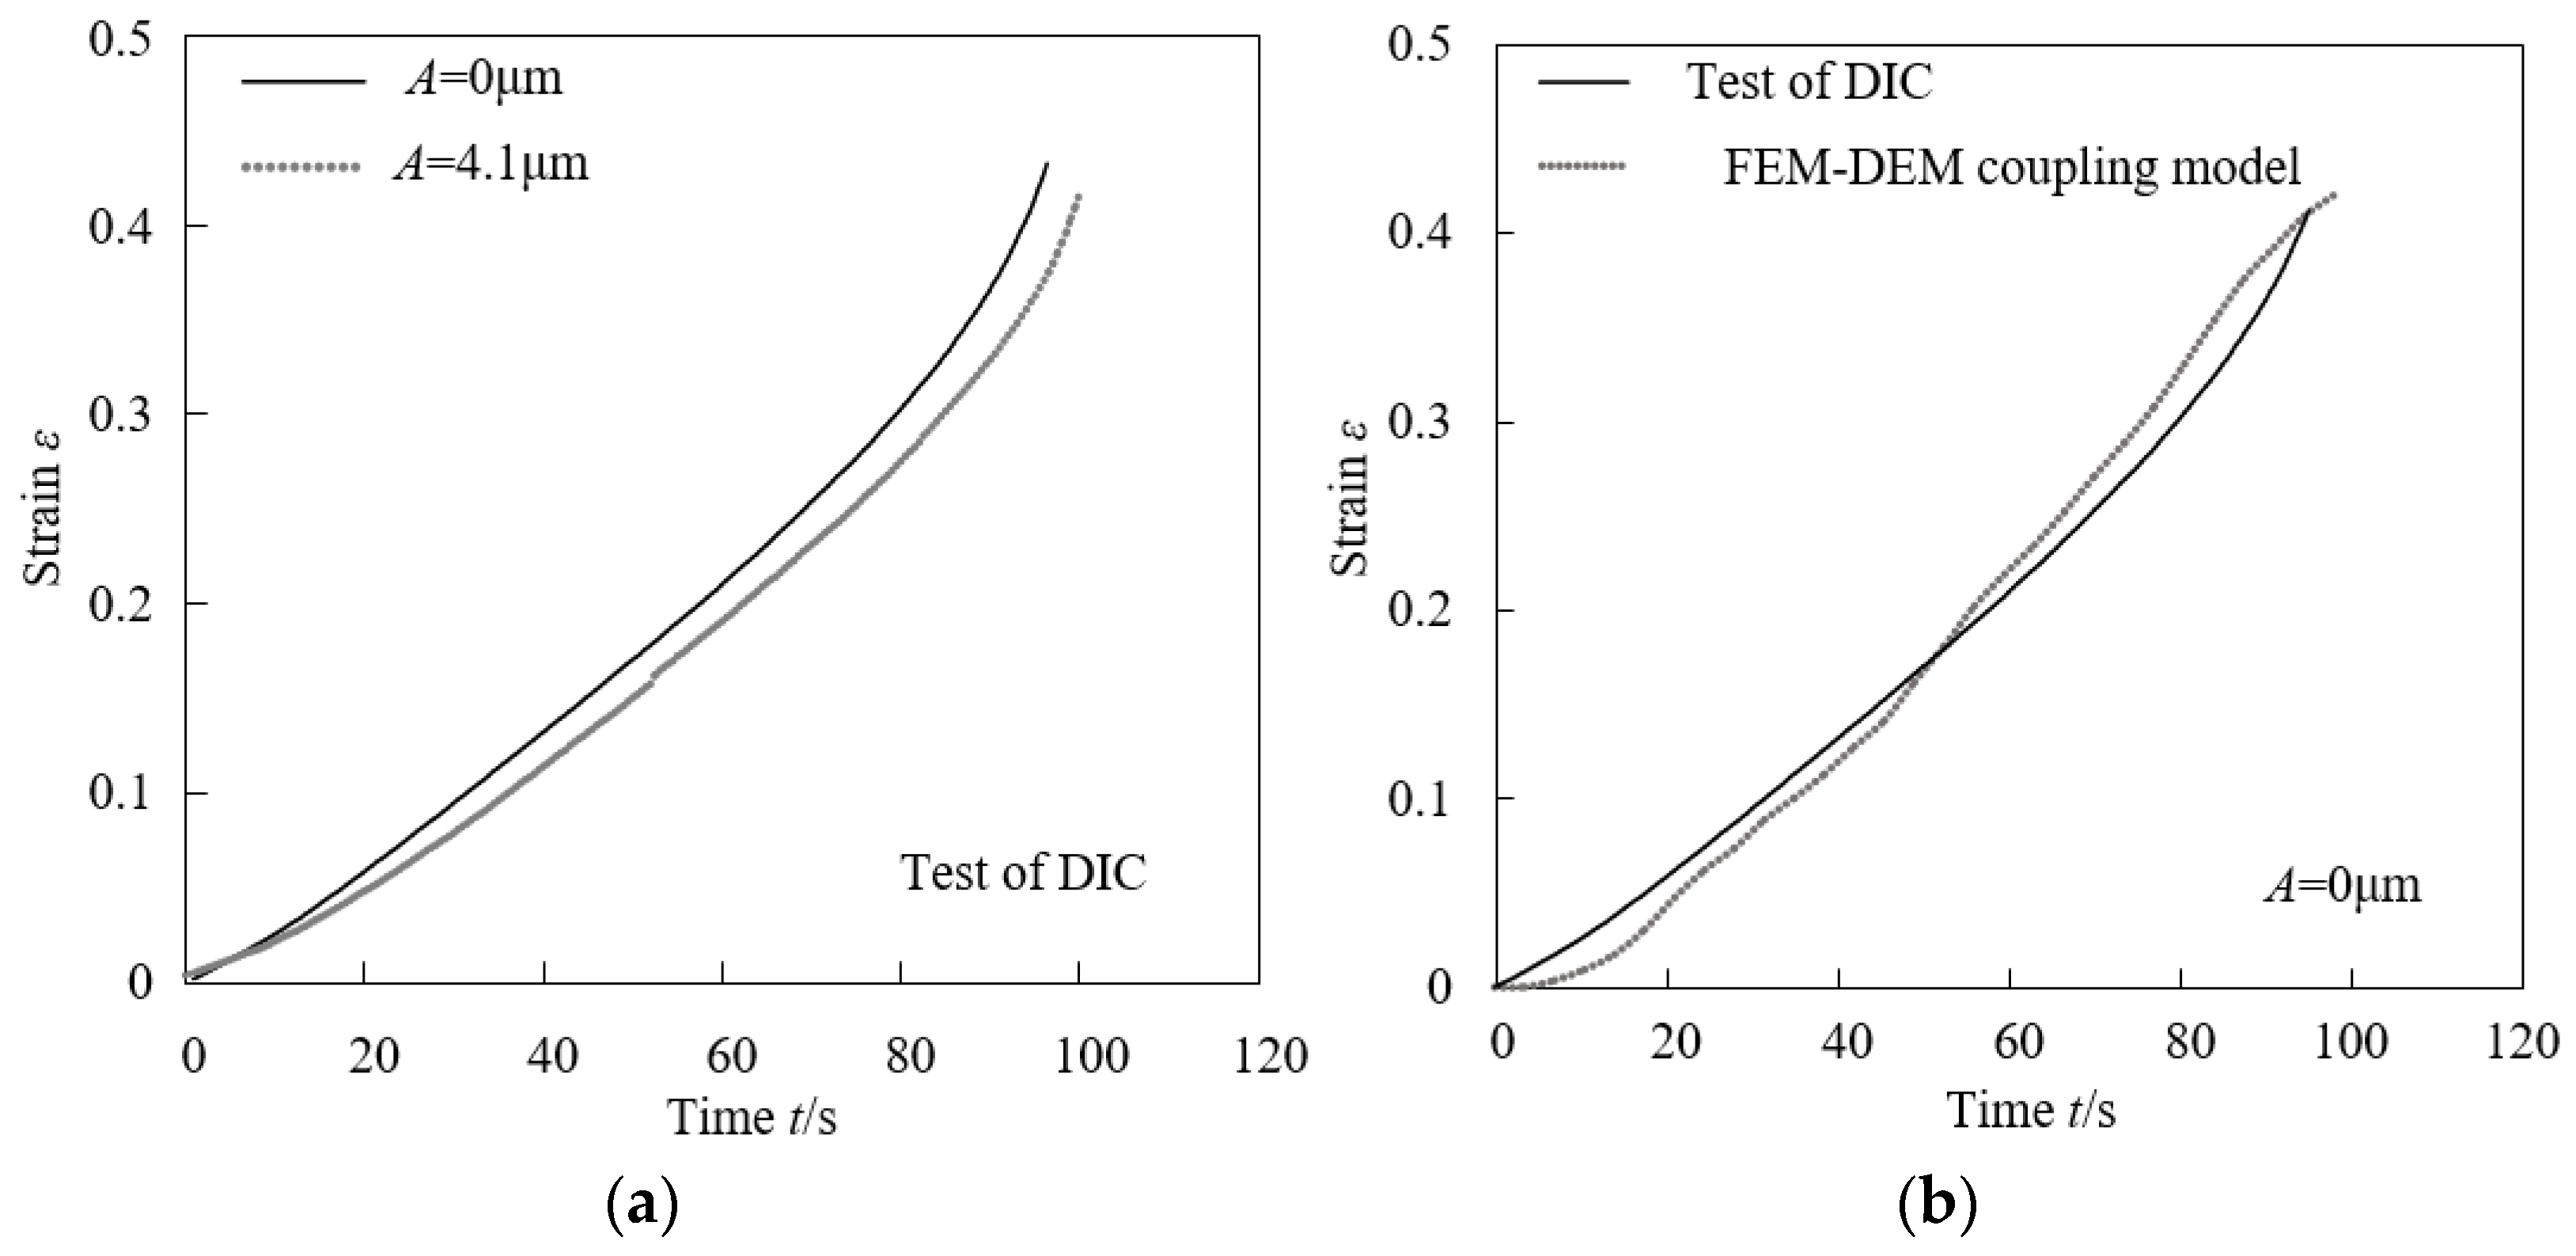
5.2.3. Effect of Vibration on Strain
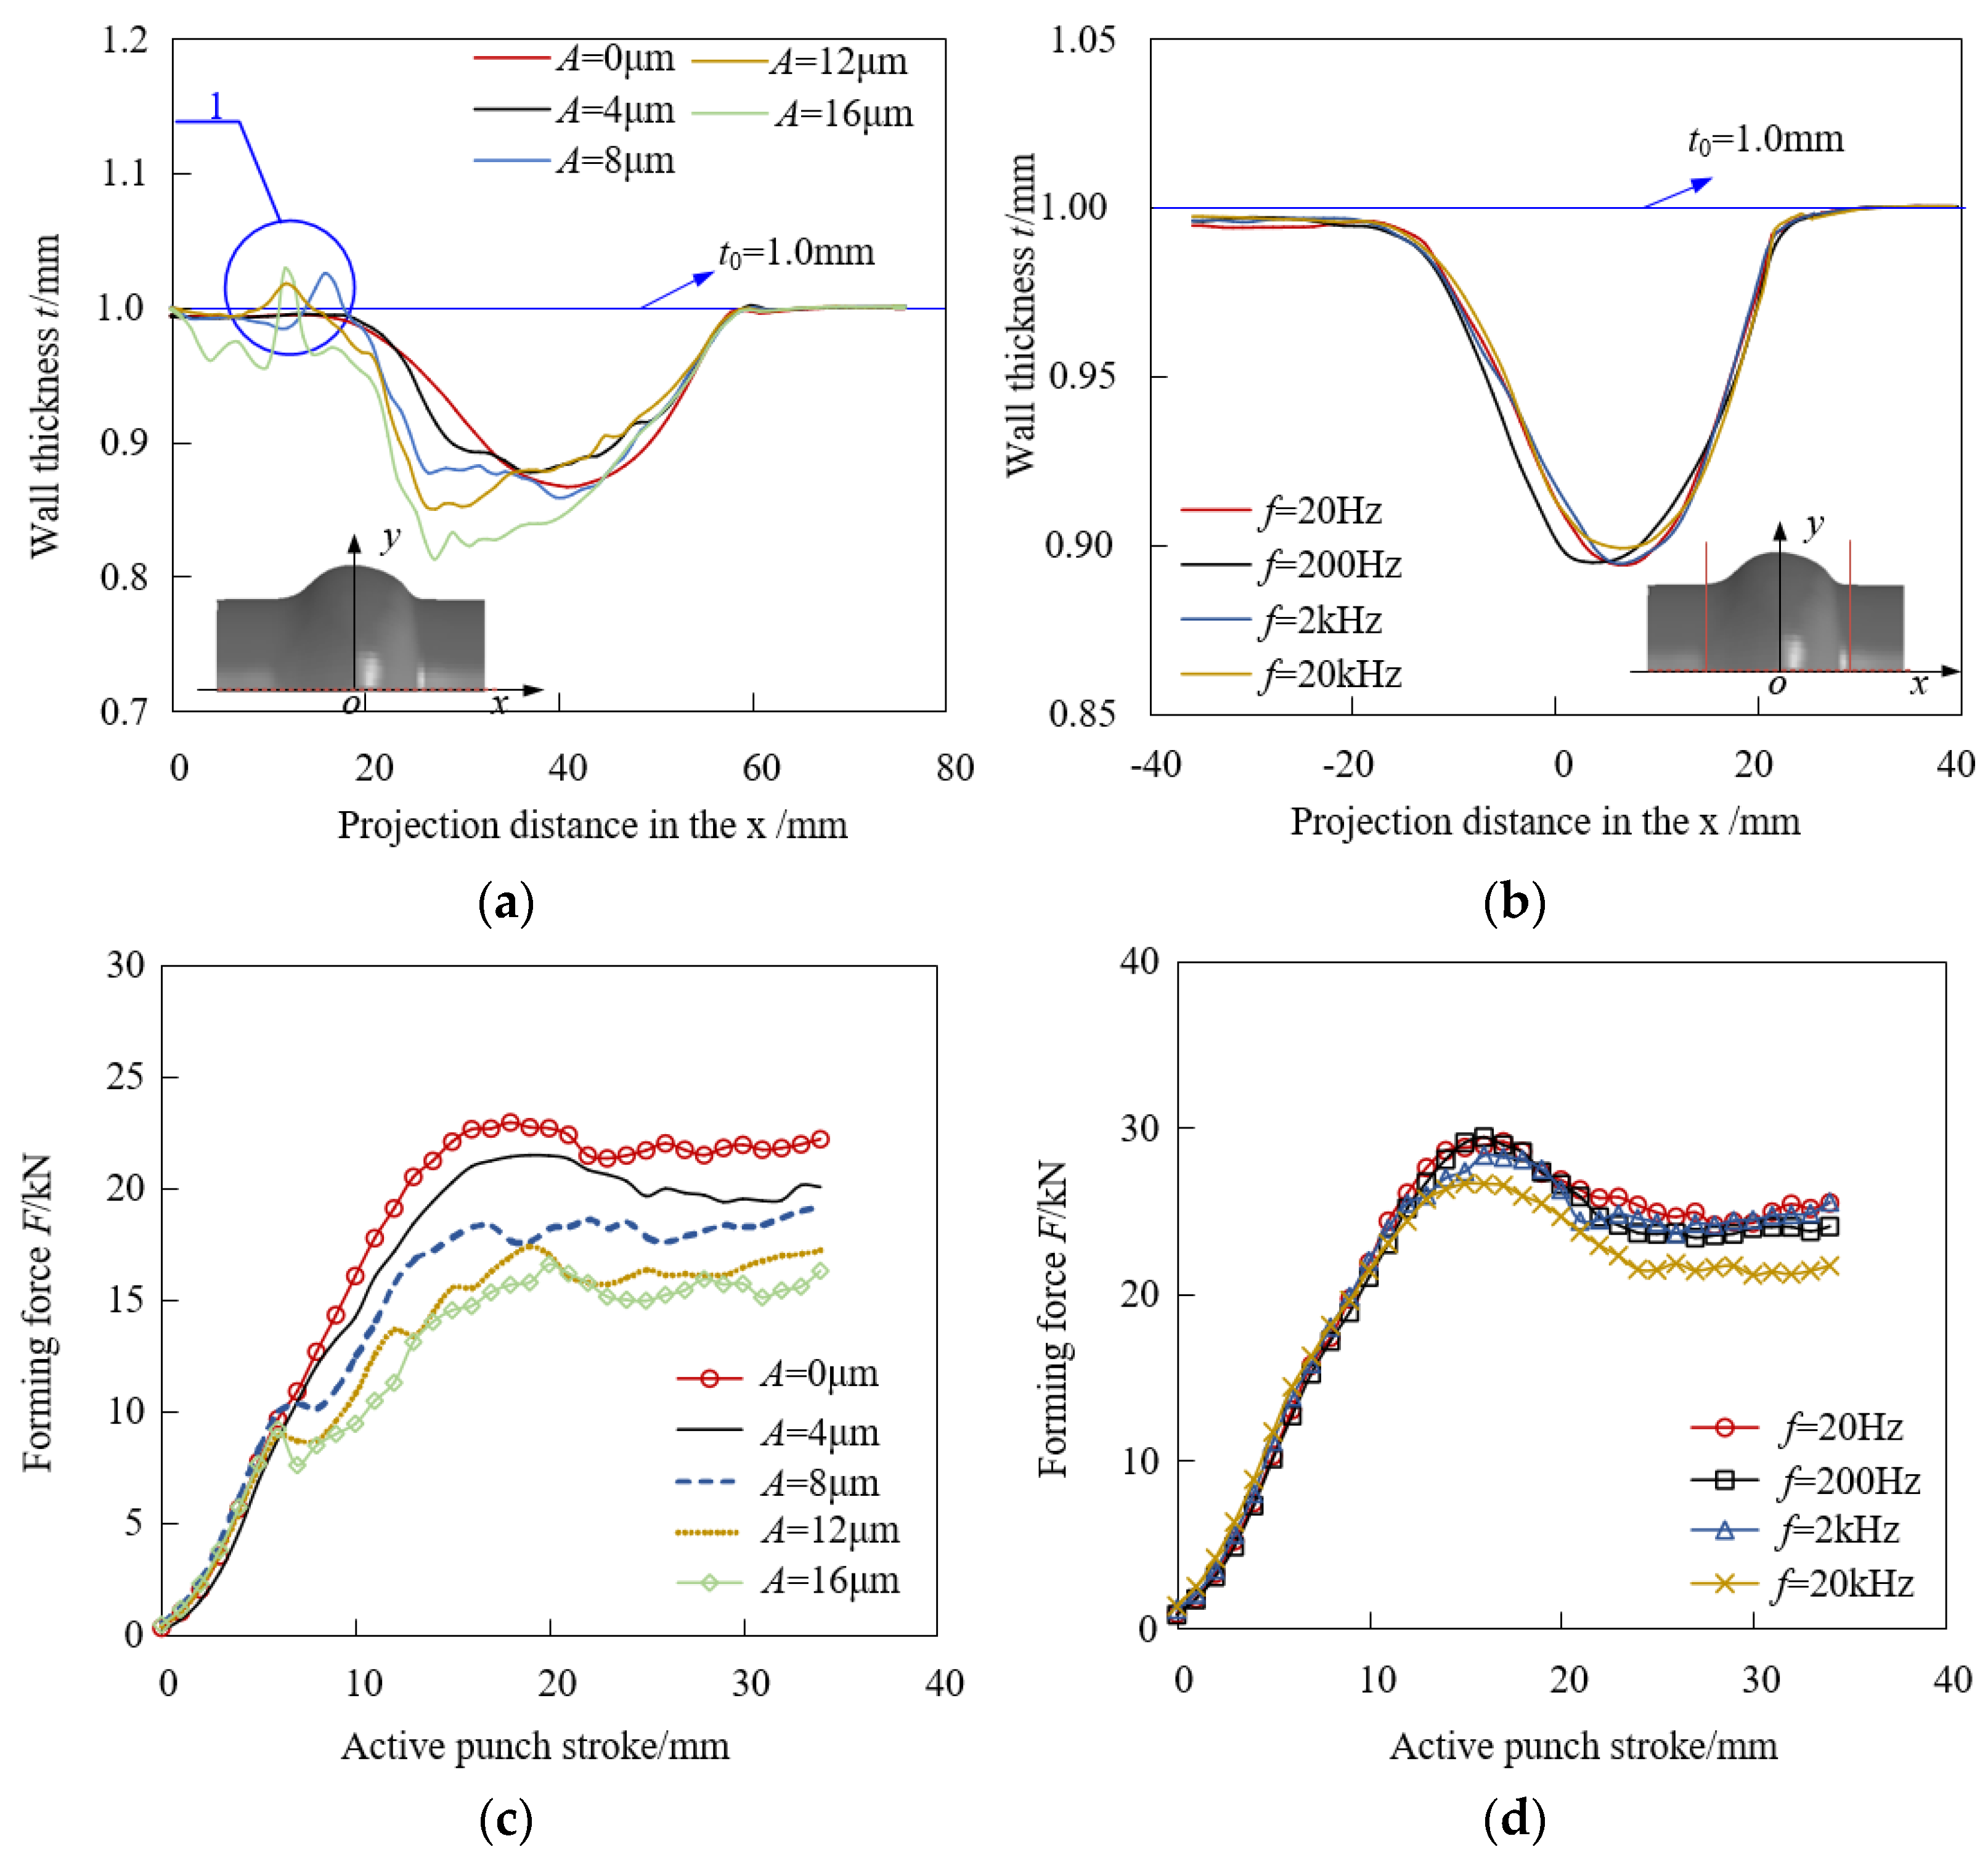
5.2.4. The Effect of UV on the Wall Thickness
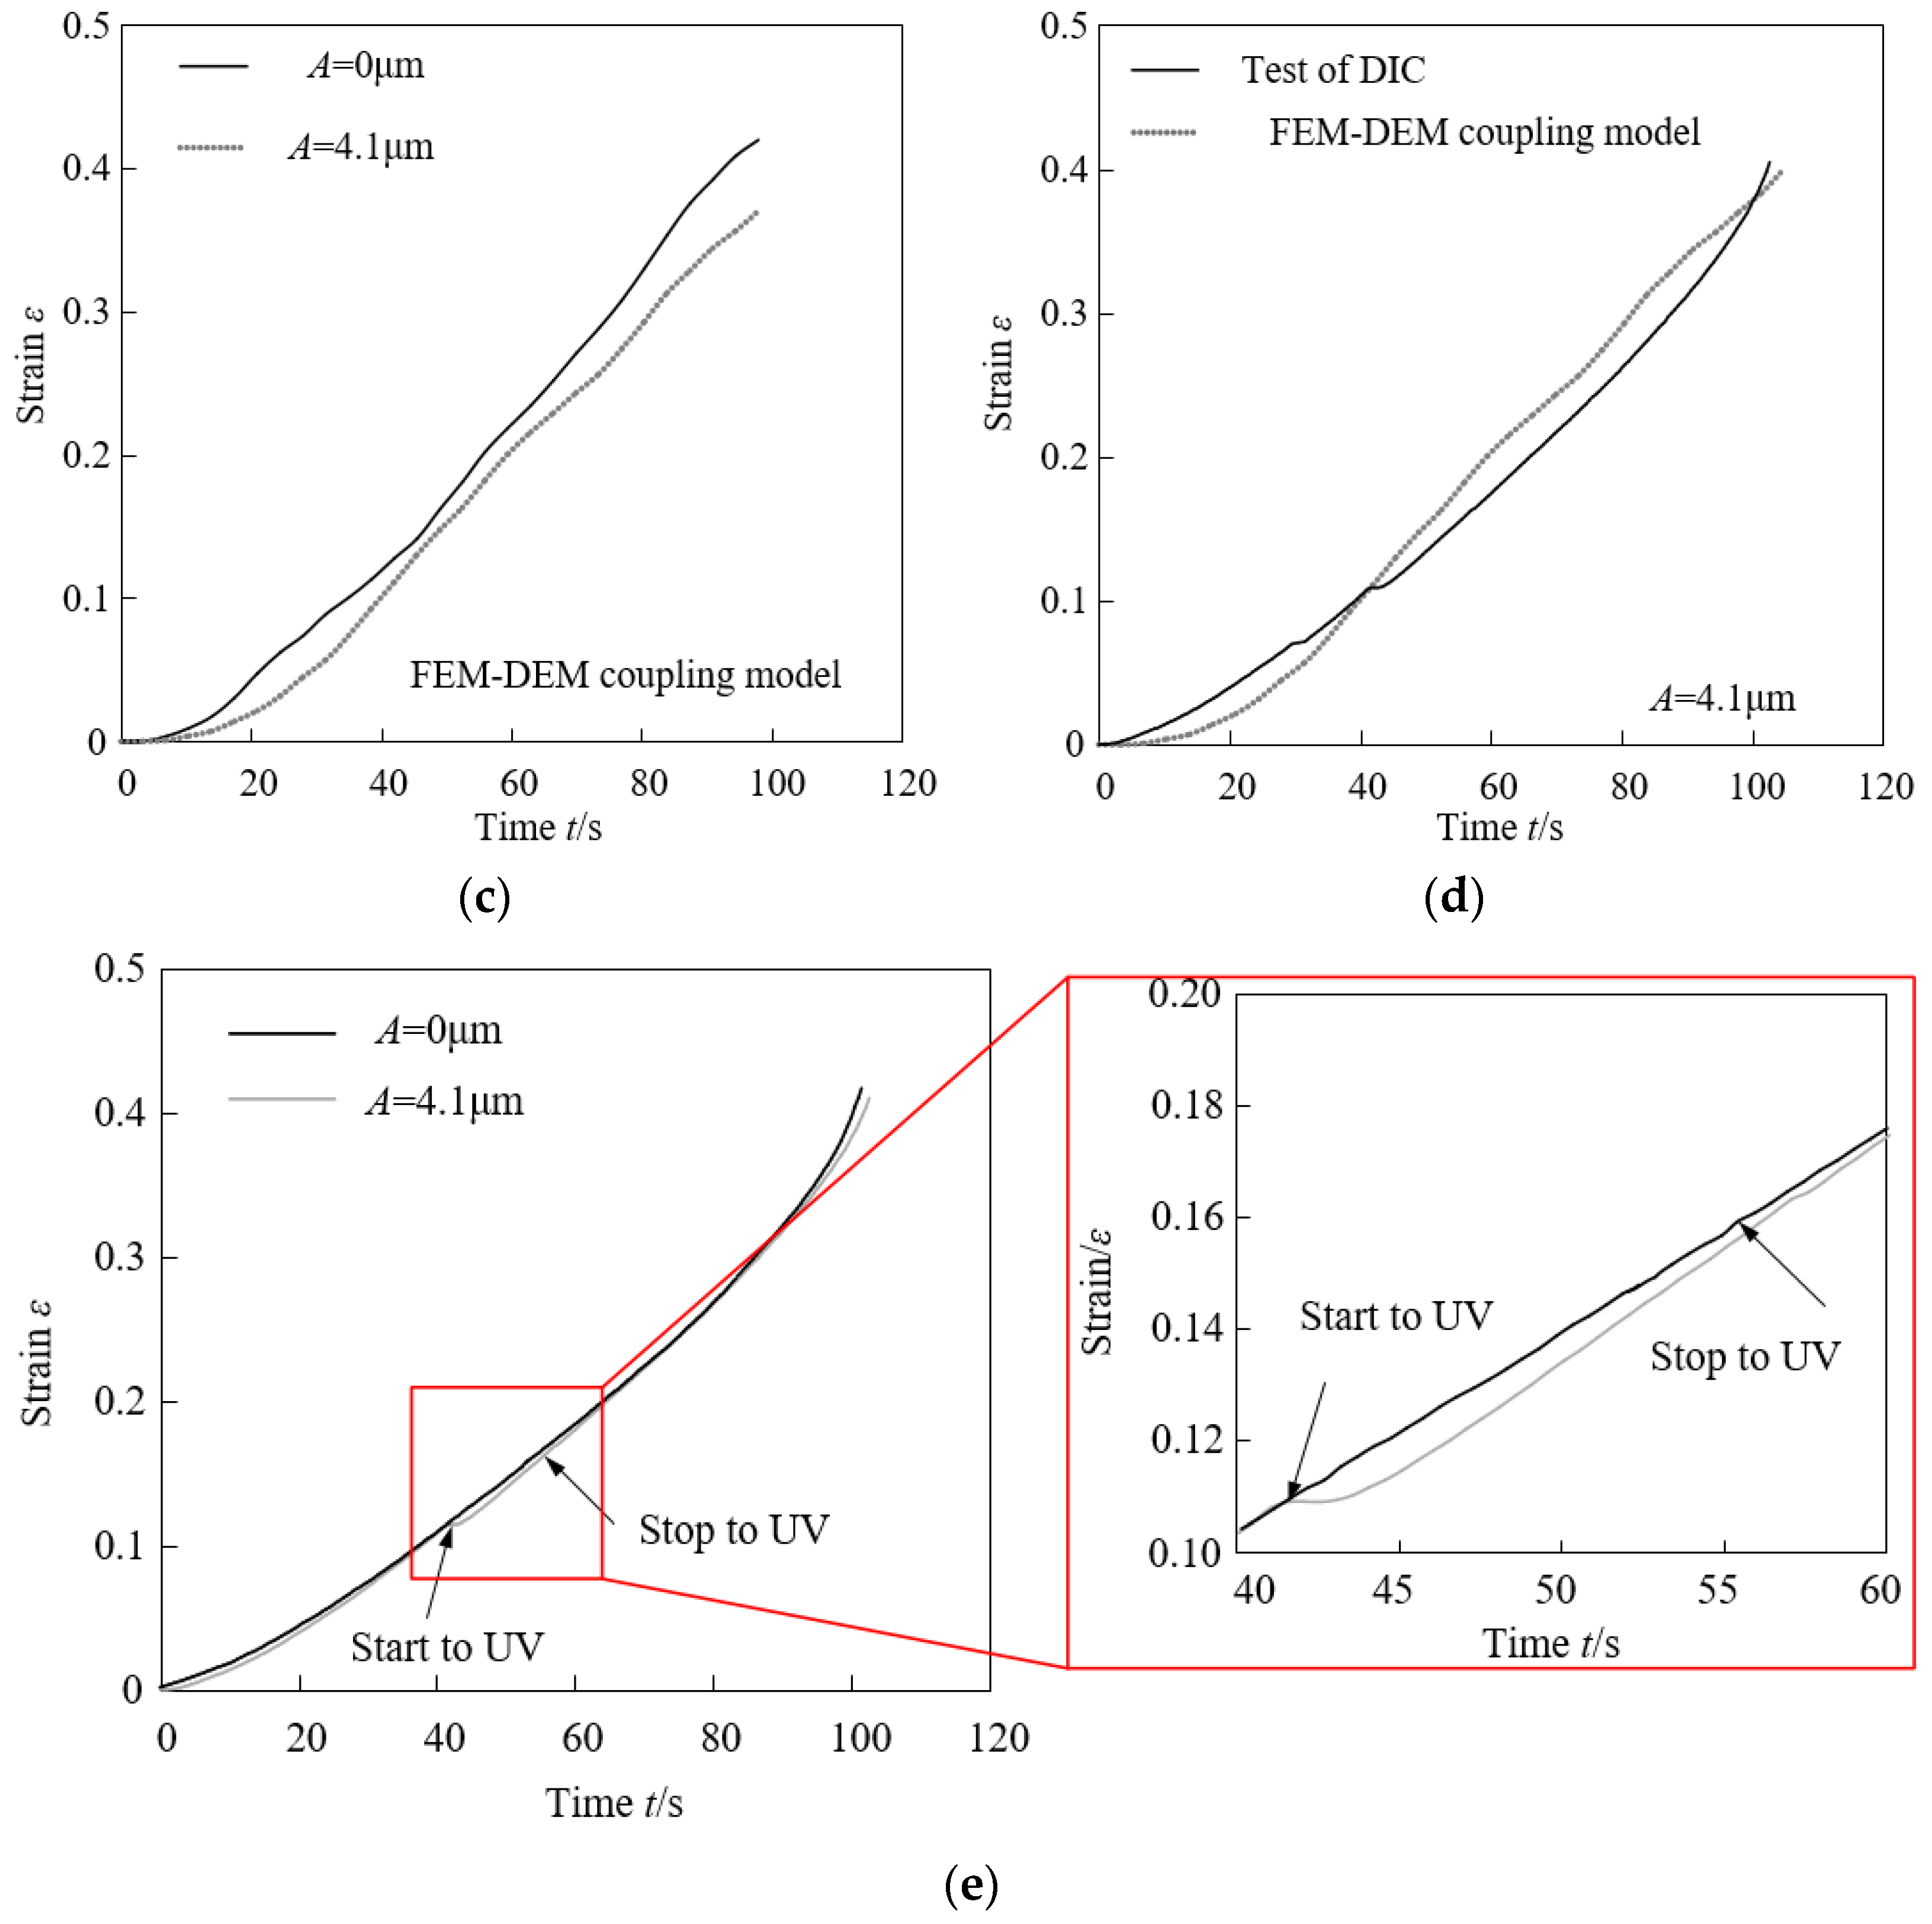
5.2.5. The Effect of UV on the Forming Shape
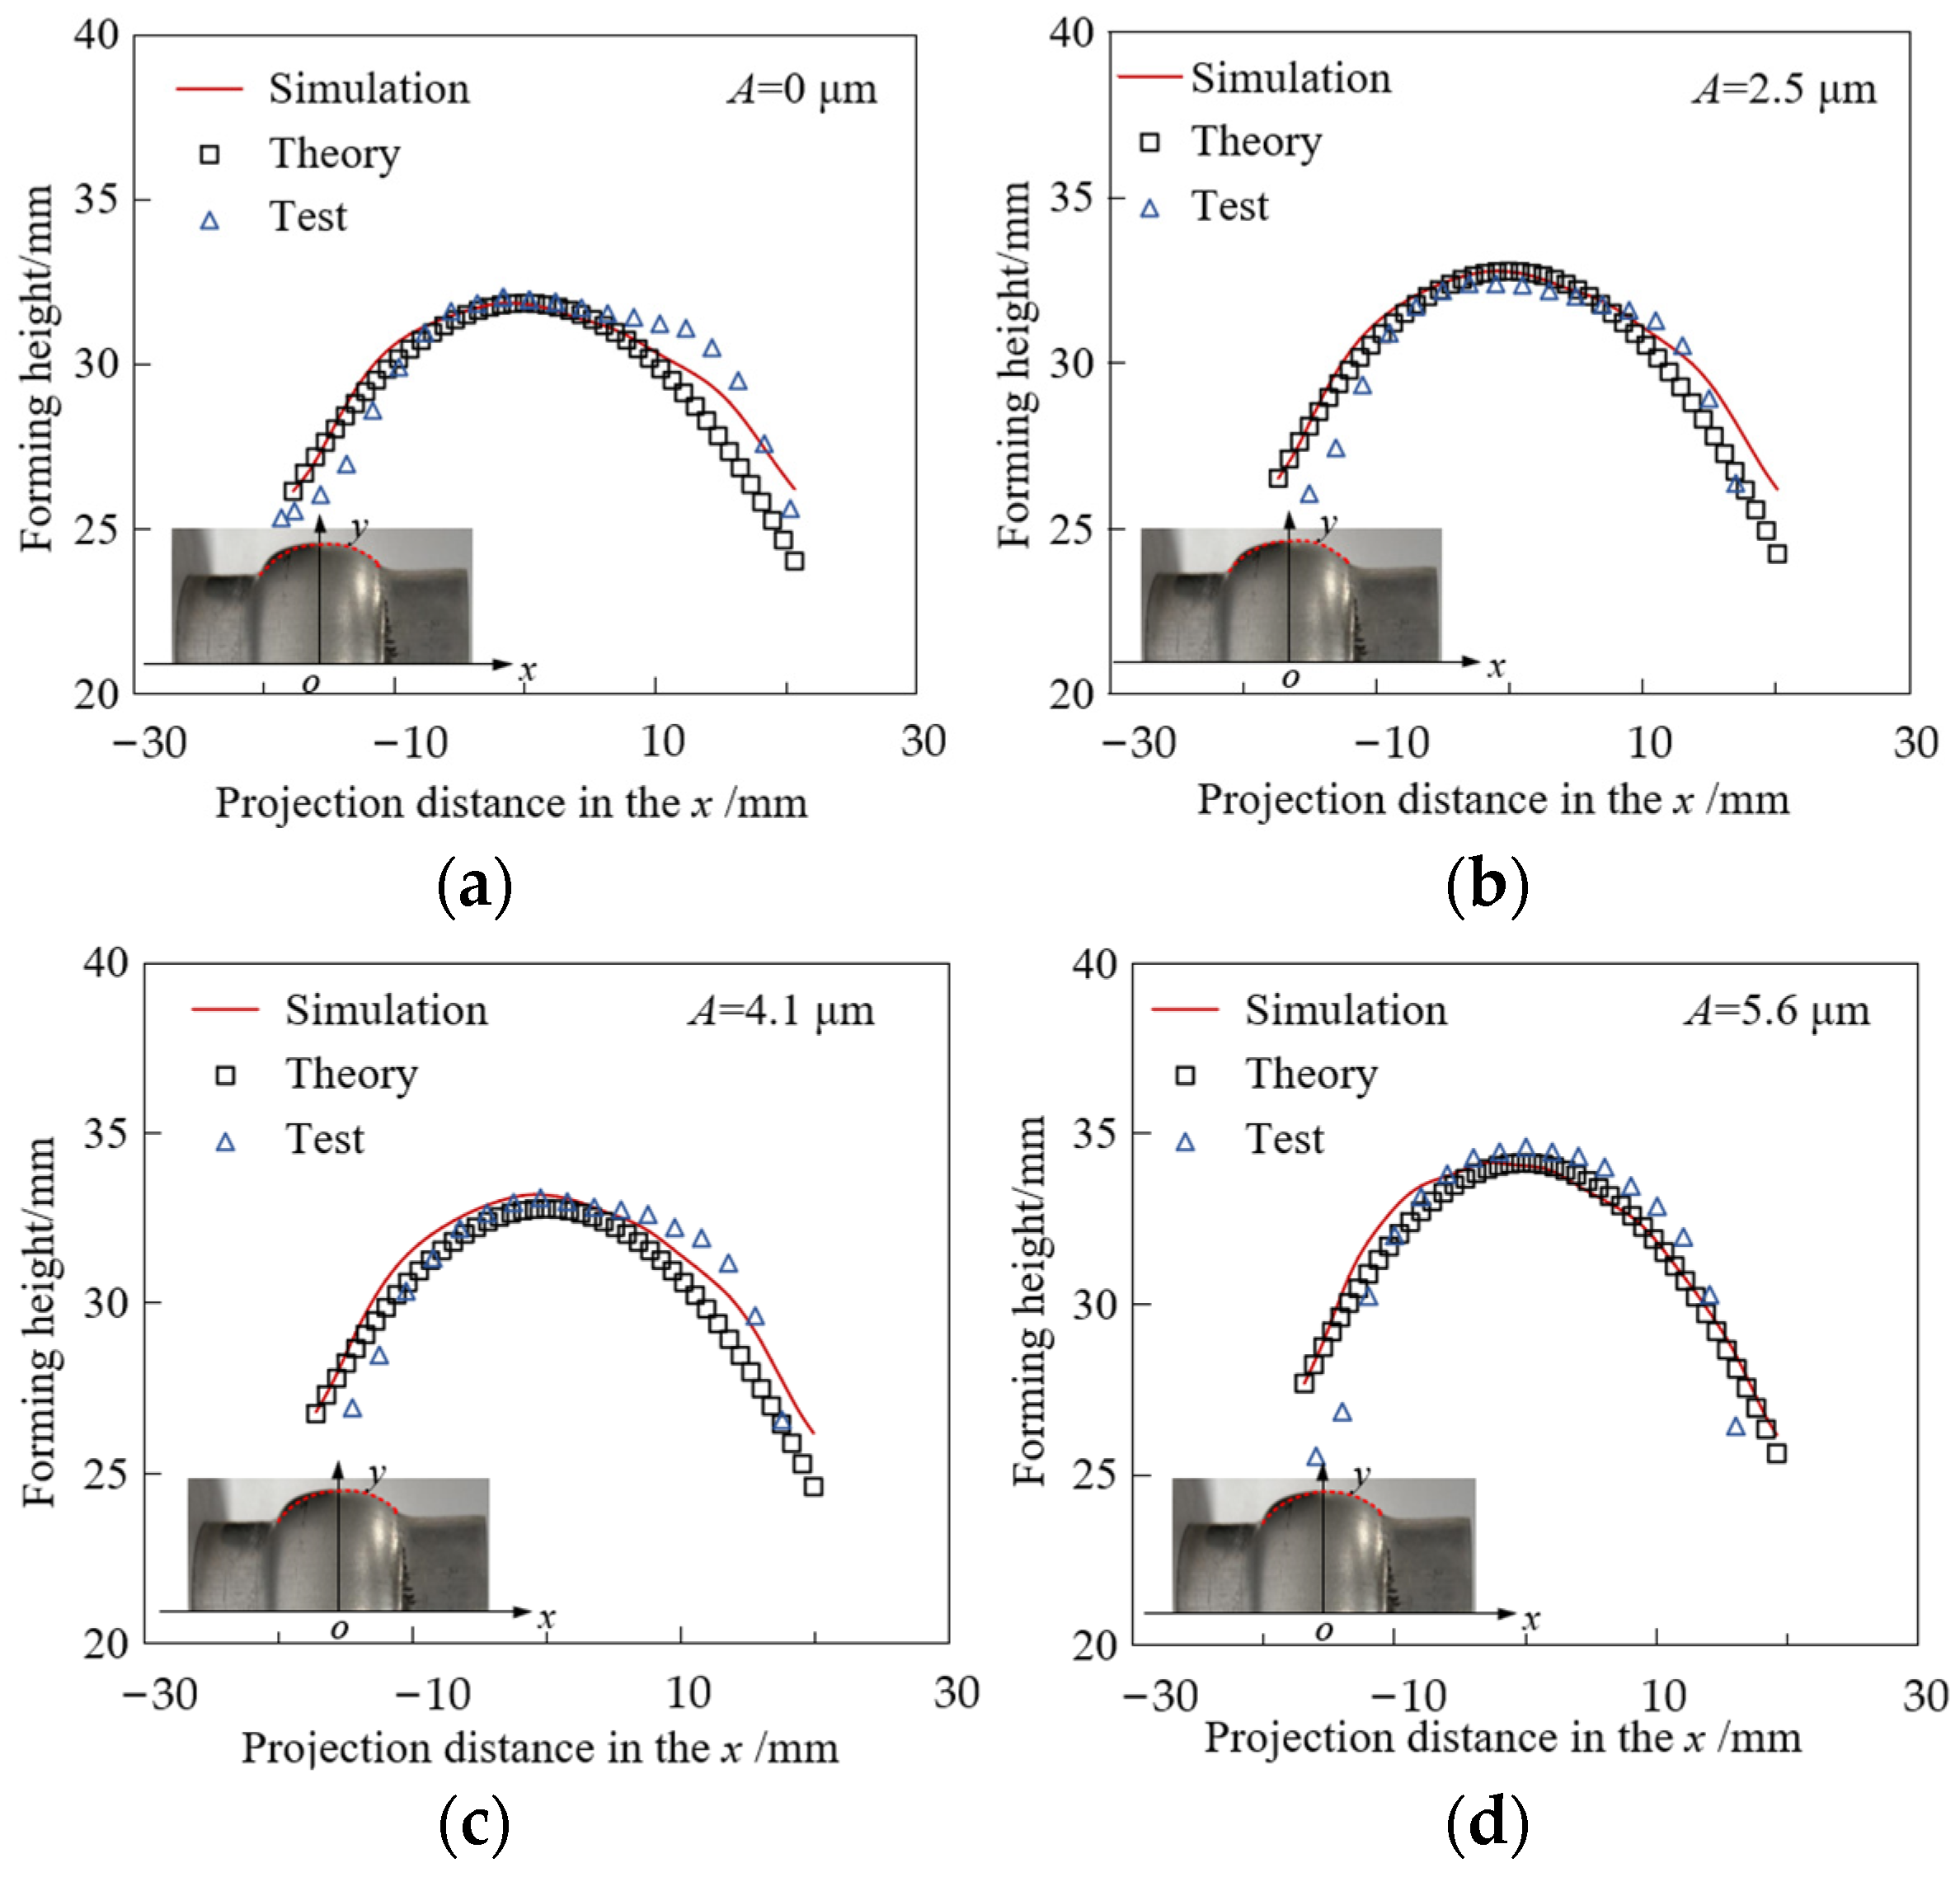
5.2.6. The Effect of UV on the Fracture Morphology
6. Conclusions
- (1)
- To obtain an accurate simulation calculation, the results of the FE-DE coupled method were compared with the results of simulations of the UGMF process performed using ABAQUS 2022 finite element software. In general, within a certain amplitude range, UV could inhibit the thinning of the forming wall and reduce the forming force of the active punch.
- (2)
- Following the simulation results, free bulging tests were carried out, and it was found that the forming force of the active punch decreased as the amplitude of its strokes increased, showing similar results. Therefore, the application of UV could slow down the granule breakage and reduce the thinning of wall thickness.
- (3)
- In the forming process, a parabolic geometric model could accurately describe the radius profile of the free bulging region of the tube. The absolute errors between the simulation and test results were small (within 9%). Therefore, the accuracy of the simulation was verified. At the same time, the accuracy of the FE-DE coupled model under UV was further verified by comparing the wall thickness distribution of the deformation region with that of the simulation.
- (4)
- For the tested 6063-T5 tube, the tearing edge disappeared on the fracture surface when tested at an amplitude of 5.6 μm, and increases in the amplitude caused the fracture size of the tube to gradually decrease. Therefore, the forming amplitude of these tubes benefits from UV, even though higher formability can be achieved at higher amplitudes.
Author Contributions
Funding
Data Availability Statement
Conflicts of Interest
References
- Yang, H.; Li, H.; Zhang, Z.; Zhan, M.; Liu, J.; Li, G. Advances and trends on tube bending forming technologies. Chin. J. Aeronaut. 2012, 25, 1–12. [Google Scholar] [CrossRef]
- Du, Z.H.; Yan, Z.Q.; Cui, X.H.; Chen, B.G.; Yu, H.L.; Qiu, D.Y.; Xia, W.Z.; Deng, Z.S. Springback control and large skin manufacturing by high-speed vibration using electromagnetic forming. J. Mater. Process. Technol. 2022, 299, 117340. [Google Scholar] [CrossRef]
- Reddy, P.V.; Reddy, B.V.; Ramulu, P.J. Evolution of hydroforming technologies and its applications—A Review. J. Adv. Manuf. Syst. 2020, 19, 737–780. [Google Scholar] [CrossRef]
- Bi, J.; Zhao, C.C.; Bi, M.M.; Du, B.; Chen, X.H.; Dong, G.J. Heat treatment and granule medium internal high pressure forming of AA6061 tube. J. Cent. South Univ. Technol. 2017, 24, 1040–1049. [Google Scholar] [CrossRef]
- Chen, H.; Güner, A.; Ben, K.N.; Tekkaya, A.E. Granular media-based press hardening. J. Mater. Process. Technol. 2016, 228, 145–159. [Google Scholar] [CrossRef]
- Ning, F.; Cong, W. Ultrasonic vibration-assisted (UV-A) manufacturing processes: State of the art and future perspectives. J. Manuf. Process. 2020, 51, 174–190. [Google Scholar] [CrossRef]
- Blaha, F.; Langenecker, B. Elongation of zinc monocrystals under ultrasonication. Die Naturwissenschaften 1955, 42, 556. [Google Scholar] [CrossRef]
- Shao, G.; Li, H.; Zhan, M. A review on ultrasonic-assisted forming: Mechanism, model, and process. Chin. J. Mech. Eng. 2021, 34, 99. [Google Scholar] [CrossRef]
- Gao, T.J.; Wang, X.; Liu, S.Q.; Wang, S. Effect of ultrasonic vibration on mechanical properties and bulging performance of TA2 titanium alloy sheet. Rare Met. Mater. Eng. 2020, 49, 4010–4015. [Google Scholar]
- Zhai, J.Q.; Guan, Y.J.; Li, Y.; Liu, Y.; Lin, J. The surface effect of ultrasonic vibration in double cup extrusion test. J. Mater. Process. Technol. 2022, 299, 117344. [Google Scholar] [CrossRef]
- Najafizadeh, N.; Rajabi, M.; Hashemi, R.; Amini, S. A method and apparatus for determination of the ultrasonic-assisted forming limit diagram. Proc. Inst. Mech. Eng. Part C J. Mech. Eng. Sci. 2021, 235, 7062–7073. [Google Scholar] [CrossRef]
- Shahri, S.; Boroughani, S.; Khalili, K.; Kang, B.S. Ultrasonic hydroforming, a new method to improve formability. Procedia Technol. 2015, 19, 90–97. [Google Scholar] [CrossRef]
- Liu, S.; Shan, X.B.; Guo, K.; Yang, Y.C.; Xie, T. Experimental study on titanium wire drawing with ultrasonic vibration. Ultrasonics 2018, 83, 60–67. [Google Scholar] [CrossRef] [PubMed]
- Lin, J.; Pruncu, C.; Zhu, L.H.; Li, J.; Zhai, Y.D.; Chen, L.; Guan, Y.J.; Zhao, G.Q. Deformation behavior and microstructure in the low-frequency vibration upsetting of titanium alloy. J. Mater. Process. Technol. 2022, 299, 117360. [Google Scholar] [CrossRef]
- Kandi, R.; Sahoo, S.K.; Sahoo, A.K. Ultrasonic vibration-assisted turning of Titanium alloy Ti–6Al–4V: Numerical and experimental investigations. J. Braz. Soc. Mech. Sci. Eng. 2020, 42, 399. [Google Scholar] [CrossRef]
- Li, Y.; Zhai, W.D.; Wang, Z.J.; Li, X.Q. Investigation on the material flow and deformation behavior during ultrasonic-assisted incremental forming of straight grooves. J. Mater. Res. Technol. 2020, 9, 433–454. [Google Scholar] [CrossRef]
- Rasoli, M.A.; Abdulla, A.H.; Farzin, M.; Fadaei, T.A.; Taherizadeh, A. Influence of ultrasonic vibrations on tube spinning process. J. Mater. Process. Technol. 2012, 212, 1443–1452. [Google Scholar] [CrossRef]
- Du, B.; Zhao, C.C.; Li, X.F.; He, X. Forming technology of high temperature alloy convex ring shaped by solid granule medium. Trans. Nonferrous Met. Soc. China 2014, 24, 1721–1729. (In Chinese) [Google Scholar]
- Zhang, Y.M.; Proust, G.; Retraint, D.; Retraint, D.; Wang, H.M.; Gan, Y.X. Discrete element simulation of surface mechanical attrition treatment with rough-surface sonotrode. Int. J. Mech. Sci. 2019, 161, 105060. [Google Scholar] [CrossRef]
- Chavoshi, S.Z.; Jiang, J.; Wang, Y.; Fang, S.; Wang, S.Y.; Shi, Z.S.; Lin, J.G. Density-based constitutive modelling of P/M FGH96 for powder forging. Int. J. Mech. Sci. 2018, 138, 110–121. [Google Scholar] [CrossRef]
- Singh, A.; Magnanimo, V.; Saitoh, K. Effect of cohesion on shear banding in quasistatic granular materials. Effect of cohesion on shear banding in quasistatic granular materials. Phys. Rev. E 2014, 90, 022202. [Google Scholar] [CrossRef] [PubMed]
- Barreto, D.; O’ Sullivan, C. The influence of inter-particle friction and the intermediate stress ratio on soil response under generalised stress conditions. Granul. Matter 2012, 14, 505–521. [Google Scholar] [CrossRef]
- Liu, H.; Zhang, S.H.; Song, H.W.; Shi, G.L.; Cheng, M. 3D FE-DE coupling analysis for granular-media-based thin-wall elbow push-bending process. Int. J. Mater. Form. 2019, 12, 985–994. [Google Scholar] [CrossRef]
- Marini, M.; Piona, F.; Fontanari, V.; Bandini, M.; Benedetti, M. A new challenge in the DEM/FEM simulation of the shot peening process: The residual stress field at a sharp edge. Int. J. Mech. Sci. 2020, 169, 105327. [Google Scholar] [CrossRef]
- Khasanov, O.L.; Dvilis, E.S. Net shaping nanopowders with powerful ultrasonic action and methods of density distribution control. Adv. Appl. Ceram. 2008, 107, 135–141. [Google Scholar] [CrossRef]
- Cao, M.Y.; Hu, H.; Jia, X.D.; Han, X.B.; Yao, P.L. FE-DE coupling analysis of AZ31B sheet solid granule medium forming based on GTN model. Int. J. Adv. Manuf. Technol. 2020, 111, 1617–1626. [Google Scholar] [CrossRef]
- Song, H.W.; Xie, W.L.; Zhang, S.H.; Jiang, W.H.; Lăzărescu, L.; Banabic, D. Granular media filler assisted push bending method of thin-walled tubes with small bending radius. Int. J. Mech. Sci. 2021, 198, 106365. [Google Scholar] [CrossRef]
- Redwood, M. Mechanical Waveguide; Pergamon Press: Oxford, UK, 1960. [Google Scholar]
- Lee, H.; Singh, R. Acoustic radiation from out-of-plane modes of an annular disk using thin and thick plate theories. J. Sound Vib. 2005, 282, 313–339. [Google Scholar] [CrossRef]
- Ludwikson, D.C. Modified stress-strain relation for FCC metals and alloys. Metall. Trans. 1971, 2, 2825–2828. [Google Scholar] [CrossRef]
- Simulia, D. Abaqus 6.14 Analysis User’s Manual; Dassault Systèmes Simulia Corp.: Providence, RI, USA, 2014. [Google Scholar]
- Cao, M.Y.; Li, J.C.; Liu, Y.Y.; Yuan, Y.N.; Zhao, C.C.; Dong, G.J. Frictional characteristics of sheet metals with superimposed ultrasonic vibrations. J. Cent. South Univ. 2018, 25, 1879–1887. [Google Scholar] [CrossRef]


| Level | 0 | I | II | III |
|---|---|---|---|---|
| Amplitude of booster (μm) | 0 | 2.2 | 3.6 | 4.9 |
| Amplitude of upper die (μm) | 0 | 2.5 | 4.1 | 5.6 |
| A/μm | K | n |
|---|---|---|
| 0 | 223.34 | 0.0706 |
| 3.5 | 201.72 | 0.0645 |
| 4.6 | 186.18 | 0.0567 |
| 5.7 | 160.32 | 0.0362 |
| Young’s Modulus/MPa | Density/kg·m−3 | Poisson’s Ratio | |
|---|---|---|---|
| 6063-T5 | 6.90 × 10⁴ | 2720 | 0.33 |
| Die | 2.08 × 10⁵ | 7850 | 0.27 |
| Granules | 7.20 × 10⁴ | 25 | 0.20 |
| Contact Pairs | Tube–Die | Granules–Granules | Tube–Granules |
|---|---|---|---|
| Coefficient of friction | 0.10 | 0.3 | 0.2 |
Disclaimer/Publisher’s Note: The statements, opinions and data contained in all publications are solely those of the individual author(s) and contributor(s) and not of MDPI and/or the editor(s). MDPI and/or the editor(s) disclaim responsibility for any injury to people or property resulting from any ideas, methods, instructions or products referred to in the content. |
© 2024 by the authors. Licensee MDPI, Basel, Switzerland. This article is an open access article distributed under the terms and conditions of the Creative Commons Attribution (CC BY) license (https://creativecommons.org/licenses/by/4.0/).
Share and Cite
Hu, H.; Yu, F.; Zhang, S.; Yin, J.; Zhang, H.; Zhang, J.; Zhang, X.; Cao, M.; Murtaza, S. Ultrasonic-Assisted Granular Medium Forming of Aluminum Alloy 6063-T5: Simulations and Experiments. Metals 2024, 14, 847. https://doi.org/10.3390/met14080847
Hu H, Yu F, Zhang S, Yin J, Zhang H, Zhang J, Zhang X, Cao M, Murtaza S. Ultrasonic-Assisted Granular Medium Forming of Aluminum Alloy 6063-T5: Simulations and Experiments. Metals. 2024; 14(8):847. https://doi.org/10.3390/met14080847
Chicago/Turabian StyleHu, Han, Feng Yu, Song Zhang, Jing Yin, Haiyan Zhang, Jiaru Zhang, Xiaonan Zhang, Miaoyan Cao, and Shahzad Murtaza. 2024. "Ultrasonic-Assisted Granular Medium Forming of Aluminum Alloy 6063-T5: Simulations and Experiments" Metals 14, no. 8: 847. https://doi.org/10.3390/met14080847