Article

Reduction in Porosity in GMAW-P Welds of CP780 Galvanized Steel with ER70S-3 Electrode Using the Taguchi Methodology

by
Maleni García-Gómez
1,
Francisco Fernando Curiel-López
1,*,
José Jaime Taha-Tijerina
2,*,
Víctor Hugo López-Morelos
1,
Julio César Verduzco-Juárez
1 and
Carlos Adrián García-Ochoa
1
1
Instituto de Investigación en Metalurgia y Materiales, Universidad Michoacana de San Nicolás de Hidalgo, Morelia 58000, Mexico
2
Department of Informatics and Engineering Systems, The University of Texas Rio Grande Valley, Brownsville, TX 78520, USA
*
Authors to whom correspondence should be addressed.
Metals 2024, 14(8), 857; https://doi.org/10.3390/met14080857
Submission received: 30 June 2024 / Revised: 16 July 2024 / Accepted: 21 July 2024 / Published: 26 July 2024

Abstract

:
In this study, the theoretical welding parameters influencing porosity formation were examined with the aim of reducing or minimizing porosity levels. An experimental design was implemented using the Taguchi methodology for data analysis, resulting in an L9 orthogonal array matrix of experiments. The welding variables considered in the orthogonal array were peak current, peak time, and frequency. Nine lap welds were performed on CP780 steel using the gas metal arc welding process with pulsed arc (GMAW-P), employing an ER70S-3 electrode as filler metal. The percentage of porosity was determined as a response variable, and the actual heat input was treated as a covariable, thereby identifying the welding parameters with the predicted values. Three repetitions were conducted with the optimal welding parameters to validate the Taguchi prediction. The quality of the welds was assessed through radiographic inspection, and metallographic preparation was performed, revealing the microstructure with 5% Nital for 12 s. The samples were analyzed using an optical microscope, and images were obtained with the collage technique. The results showed that the welding parameters predicted by the Taguchi statistics were favorable for all three predicted welded joints. The maximum percentage of porosity obtained was 19%, which was reduced to 1% using the Taguchi methodology, demonstrating the effectiveness of this statistical tool for process optimization. It was observed that for heat input values of 230 to 250 J/mm, the presence of porosities is dramatically reduced, finding a very small window that allows the gases generated by the burning of zinc to be expelled to the surface.

1. Introduction

In the 20th century, new priorities emerged in the automotive sector, passenger safety performance, reduction in pollutant emissions, costs and weight of units, formability, corrosion resistance, and weldability. Fulfillment of all these aspects relies on having competitive materials such as complex phase (CP) steels [1,2,3]. These materials are often referred to as multiphase steels because they might contain martensite, ferrite, bainite, and/or retained austenite, all of which offer unique mechanical properties [4,5]. CP steels have potential applications for weight reduction and better performance in body structure components, such as bumpers, door security bars, B columns, and automotive suspension parts, among others. A common requirement across these applications is the necessity for the material to provide sufficient integrity to ensure passenger safety during accidents or collisions [6]. In chassis applications, complex-phase (CP) steels are commonly employed and typically processed without coatings. However, there is a growing demand for galvanized sheet steel to meet the rising corrosion protection standards of automotive manufacturers [7]. Galvanizing is one of the most commonly used processes to protect steel components exposed to corrosive environments, which has led to the use of Zn-coated steels for automotive applications [8,9]. Several welding processes, such as friction welding, laser welding, resistance spot welding, etc., have been employed in the joining of advanced high-strength steels (AHSS), facing metallurgical challenges due to the complexity of the phases present in the steel [10,11,12].
The GMAW-P process is widely used due to the fine control of process parameters, high metal deposition rate, and easy automation. These characteristics lead to high-quality welding at an acceptable cost compared to other welding processes. However, welding-coated steels commonly present problems with conventional welding processes and welding consumables due to the low evaporation temperature of zinc (~906 °C) [13]. The vaporized zinc during welding is trapped during the solidification process in the weld pool, generating both internal and external porosity. These visual and internal defects significantly reduce the mechanical properties of the welded joints and could potentially cause premature failure of the components [9].
The basic waveform parameters for GMAW-P include peak current, background current (Ip, Ib), peak time, and background time (tp, tb), with additional parameters describing the waveform during transitions [14]. The alternative basic waveform parameters are (tp, Fp) and (Fp, tb), where Fp is the pulse frequency. In general, there is no pulse waveform that can be considered optimal for all GMAW-P applications under certain welding conditions, because there are many pulsed current waveforms that may provide stable metal transfer, and the waveform can be selected to better meet other specific requirements of the application. These criteria may include: (1) heat input, (2) fusion rate, (3) out-of-position weldability, (4) fume creation, (5) noise generation, and (6) weld bead shape. Given the large number of possible GMAW-P waveforms, potentially different welding results may be generated [15,16].
The Taguchi philosophy is an approach focused on experimental design as a tool to manufacture more robust products and, therefore, less sensitive to noise factors [17,18]. The Taguchi methodology separates the process factors into controllable factors and noise factors. Controllable factors are those variables that can be set to desired levels during the process [19]. Noise factors are those that influence the process but cannot be controlled because they are too costly or difficult, and produce variability [20]. First, it considers that the design in the initial phase of the product is fundamental to achieving quality in the results. On the other hand, it holds that the quality of products improves when variability around the nominal or target value is minimized [21]. Finally, it understands the costs of non-quality because of the actions of the entire organization as a whole and as a function of the variability in the processes [17]. Welding professionals use the Taguchi methodology to enhance the quality of welded joints. Hussein et al. employed a design of experiments to improve the mechanical properties of dissimilar resistance welds of AHSS steels and found that welding current is the most important factor influencing the mechanical strength of the weld nuggets [22]. Ghunage used a design of experiments (DOE) for the evaluation of mechanical strength and toughness in a dissimilar joint of DP590 and DP980 steels, finding that welding current mainly affects the weld nuggets. Garcia et al. used a DOE Taguchi L4 to find the optimum conditions in welding parameters to reduce the percentage of porosity in the weld pool of a dissimilar joint and found that heat input in the range of 250 to 400 J/mm is necessary for porosity reduction in GMAW welds [23].
In this study, DOE Taguchi L9 was used to optimize the welding of DP 780 steel to reduce the porosity in the weld pool to a minimum value. The results obtained in the analysis of variance (ANOVA) show that the response variable that most affects the process is the real heat input, which is closely related to the welding current and voltage. The repeatability of the optimum conditions shows that with the variables predicted by the analysis, it is possible to obtain pore-free welds. The reduction in porosity indicates a substantial improvement in weld integrity and reliability. The results are directly applicable to manufacturing processes, offering immediate benefits to practitioners.

2. Materials and Methods

2.1. Chemical Composition of the Base Materials

CP780 zinc-coated steel sheets with a thickness of 2 mm were used, and the filler material was an ER70S-3 solid electrode with a diameter of 1.2 mm. These materials were analyzed using spark optical emission spectroscopy in a Bruker Q4 Tasman (Billerica, MA, USA) unit, and the chemical compositions are shown in Table 1.

2.2. Design of Experiments (DOE) and L9 Array Experiments

For the design of experiments (DOE), the Taguchi method was used, which was selected based on the following three welding parameters: peak current ( I P ), peak time ( I t ), and pulse frequency (Fp), each with 3 levels, as shown in Table 2. The L9 orthogonal array was applied, as illustrated in Table 3.

2.3. Welding Procedure

The steel sheets were welded using an OTC-Daihen Welbee DP400 (Yodogawa-ku, Osaka, Japan) inverter with pulsed arc welding. The lap weldments were joined at 45° with respect to the normal position, with a torch angle of 20°, using the fixture shown in Figure 1. A shielding gas mixture of 75% Ar and 25% CO2 with a flow rate of 25 L/min was used. The ER70S-3 filler wire was fed into the lap joint at 139.7 mm/s with a travel speed of 21.16 mm/s and a voltage of 24 V. The torch was placed 12 mm from the lap sheets.

2.4. Quantification of the Percentage of Porosity

A radiographic inspection was conducted to determine the shape and amount of porosity present in each welded joint. Once the images were acquired, the pore size was measured using image analysis software to obtain the porosity percentage of the weldments, and the data were employed for the statistical analysis.

2.5. Microstructural Characterization

After welding, the welded joints were cut transversally to perform microstructural characterization. The specimens were ground with emery paper of grit sizes ranging from 600 to 2500, followed by polishing with alumina to achieve a mirror-like finish. To reveal the microstructure, chemical etching of the samples was carried out with 5% Nital solution for 10 to 15 s [24]. The samples were analyzed by optical microscopy (OM) in an Axio Vert-A1 Inverted Microscope (Carl Zeis, Oberkochen, Germany).

3. Results

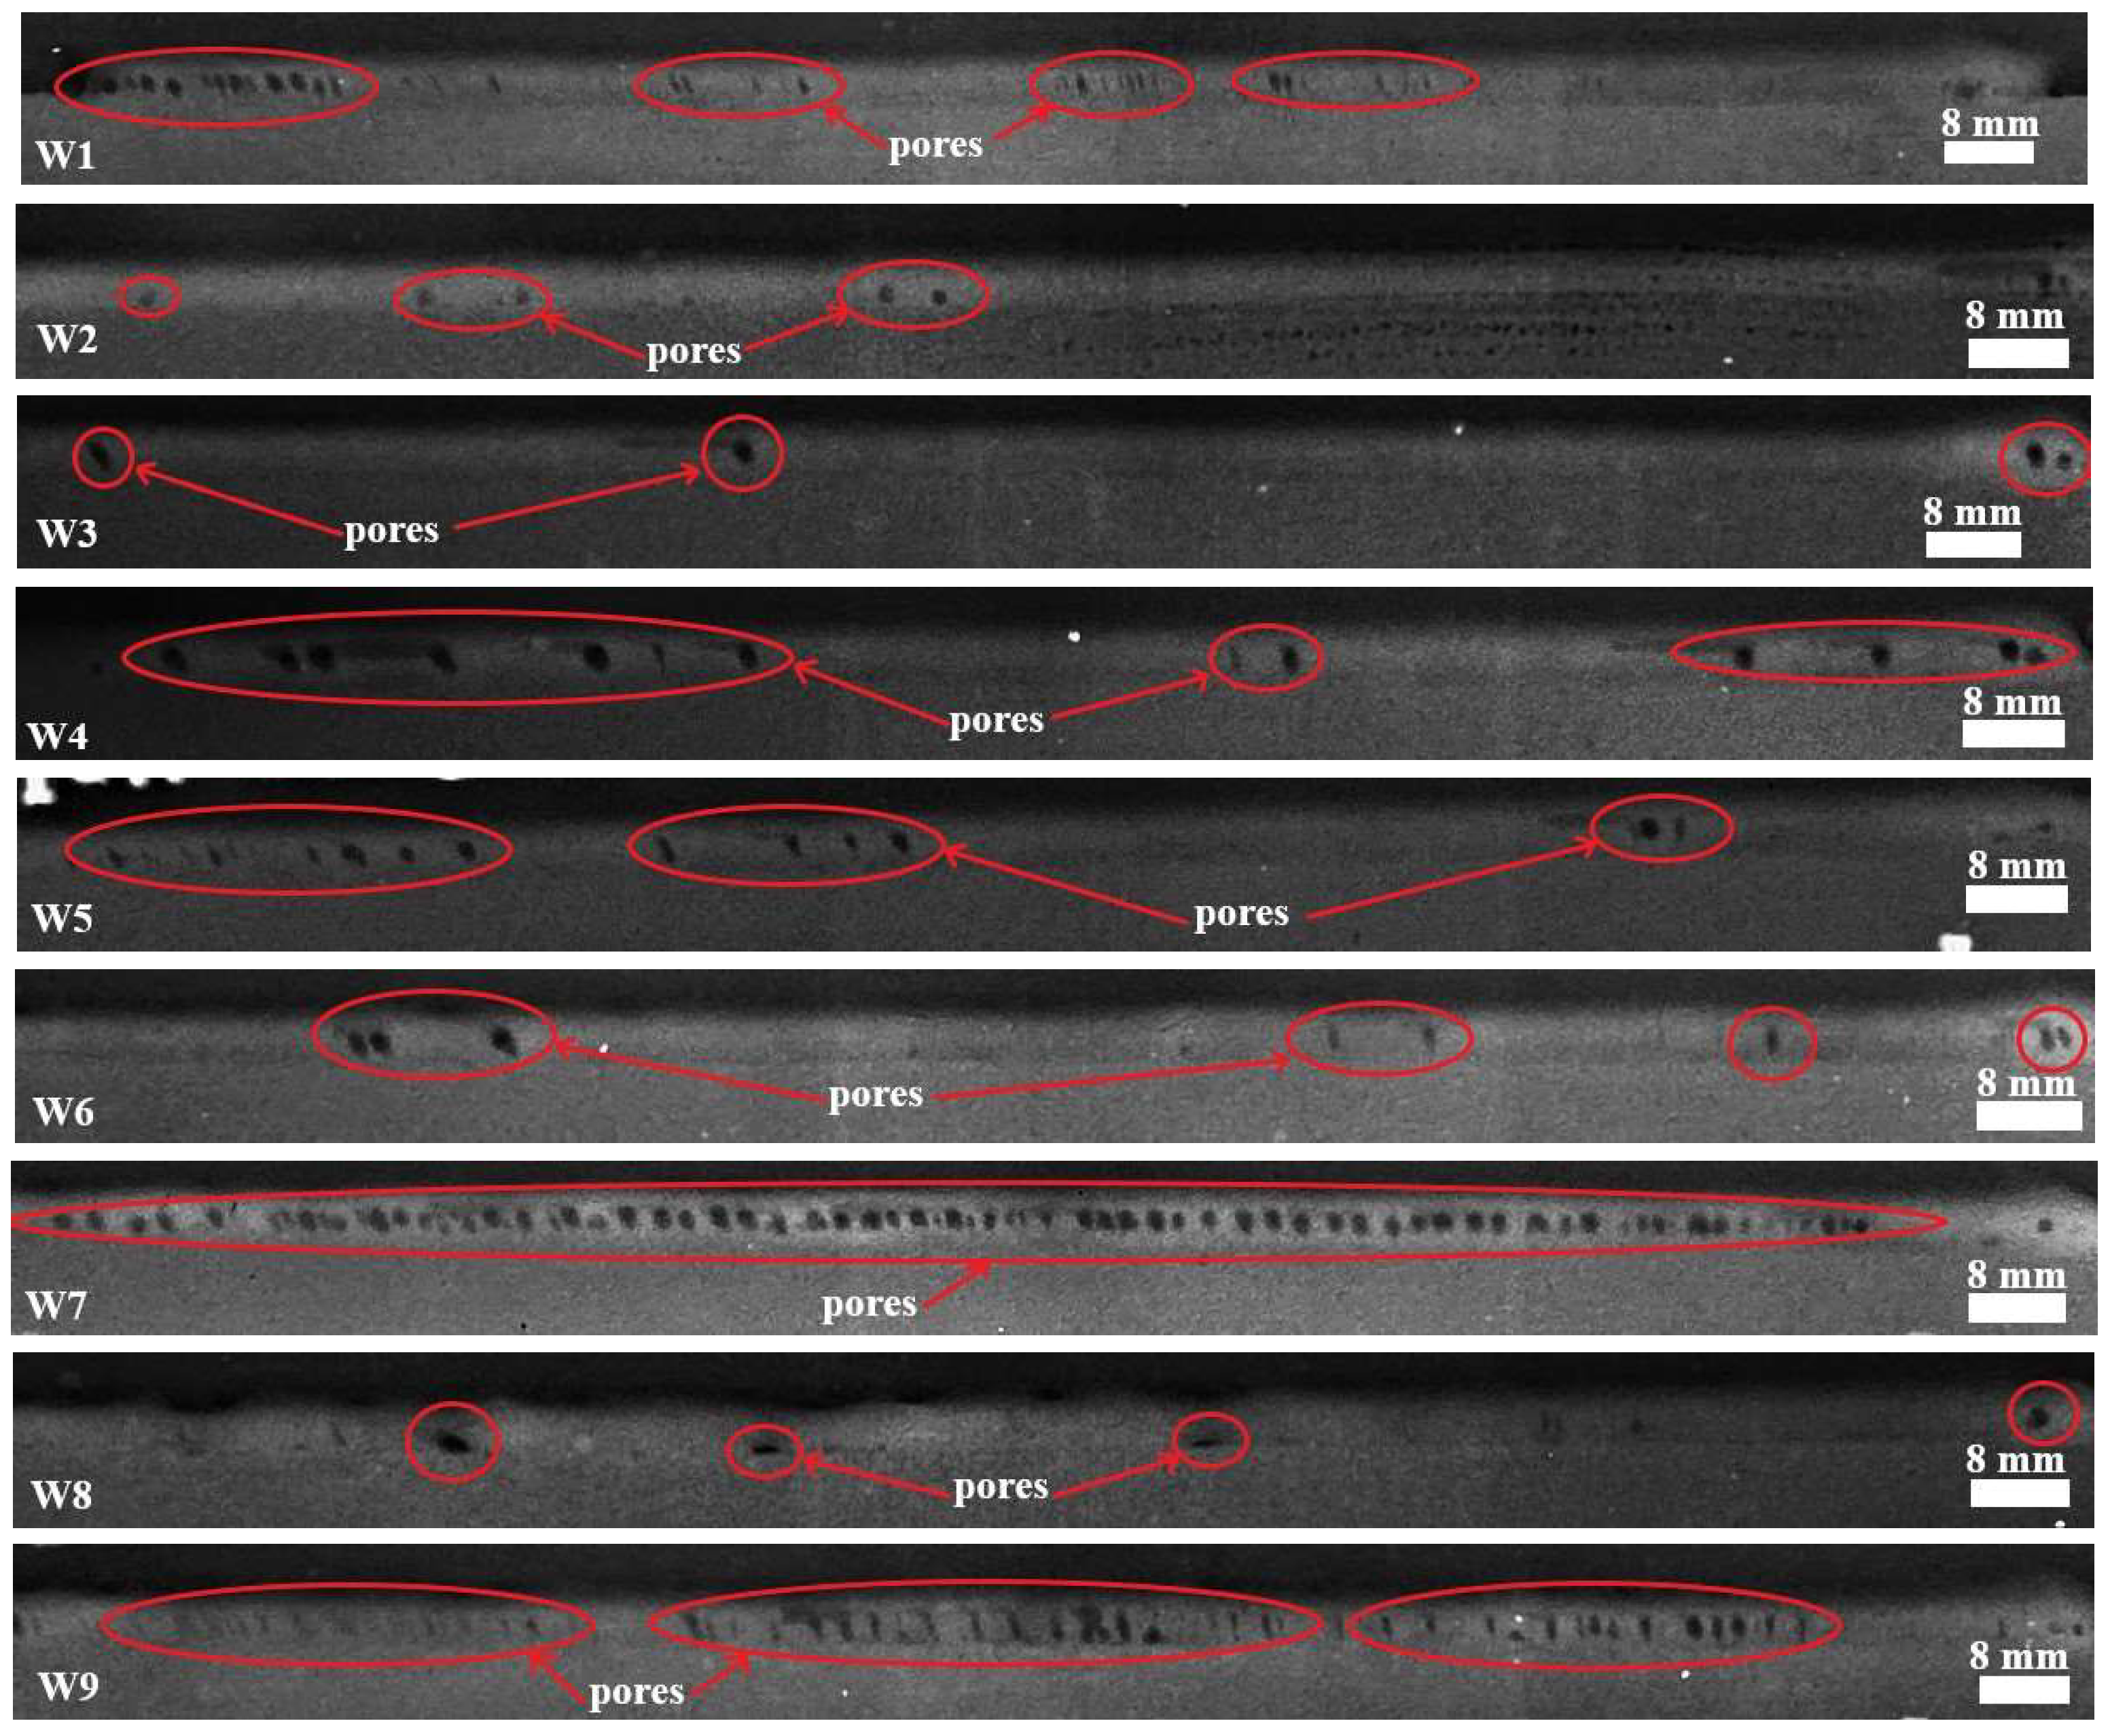
3.1. Evaluation of Porosity in the Weld Metal

The nine samples welded by the GMAW-P process were evaluated by industrial radiography to determine the porosity percentage in the welding beads of the overlapped welded joints. Figure 2 shows the radiographies along the length of the welds for the different welding conditions. The pores revealed in each weld are seen and indicated in the images. Visually, welds W7 and W9 exhibit a large number of black spots in the film, which is associated with the presence of pores. Conversely, welds W2, W3, W6, and W8 are characterized by the presence of separated pores along the weld bead, where apparently, there was better control in the welding process due to the management of the welding variables (Ip, tp, and Fp).
A critical factor influencing the growth and ascent of zinc vapor bubbles is the viscosity of the molten pool. This viscosity counteracts the vapor pressure and buoyancy forces, thereby affecting the dynamics of bubble formation and movement within the weld pool [25]. Jiyoung Yu et al. [26] have studied the effect of Mn and Si on the formation of porosities in zinc-coated steels. The interaction between Si and Mn has a substantial impact on minimizing weld porosity. As Mn and Si contents decrease, the viscosity of the welding pool also reduces. This reduction in viscosity facilitates the emission of Zn vapor from the weld pool. They report that an electrode with 0.30% Si and 0.51% Mn content effectively reduces porosity in welding, whereas the ER70S-3 electrode used in this study contains 0.37% and 0.82% of Si and Mn, respectively, which are above optimal values, suggesting less porosity release in the weld bead.
For the quantification of porosity, the ends of the welds were discarded, and the measurements were taken at a total length of 15 cm, where the stabilization of the arc during welding guarantees proper deposition of the molten electrode [27]. Table 4 summarizes the type of defect found in the different welding trials according to the radiographic films and the measurement of the percentage porosity for each sample. The defects found in the welding beads are associated with clustered porosity, spherical porosity, and, in some cases, the lack of fusion. The welds that exhibited the lowest percentages of porosity were welds W2, W3, and W8, with porosity contents of 1.7%, 0.4%, and 0.4%, respectively.
However, experiments W1, W4, W5, W6, W7, and W9 exhibit higher levels of porosity, reaching values between ~6 and 12% of porosity. Thus, efforts should be made to reduce the amount of porosity as much as possible by using the Taguchi methodology.
In order to have a better analysis of the effect of the welding variables on porosity, the heat input for every welding trial was determined The real heat input (Qr) was added as a covariable, highlighting its strong contribution to the analysis of variance results. This influence stems from the data extracted from the OTC Welbee Pulsed equipment at the time of welding, using the actual welding speed obtained by measuring the weld from end to end and dividing by the time elapsed while performing the welds. Thus, the equation to obtain this value is expressed by Equation (1) [16]. Table 5 shows the calculated heat input for each weld and the information used for the analysis.
Q r e a l = I i n s t . E i n s t . n v r e a l
where
Qreal = real heat input
Iinst. = instantaneous current
Einst. = instantaneous voltage
n = equipment efficiency
vreal = welding speed
Table 5. Real heat input values calculated for the different welding trials.
TrialQr
J/mm
W1229.57
W2244.15
W3241.89
W4246.01
W5239.93
W6233.06
W7220.48
W8231.05
W9232.89
Real heat input (Qr) is the parameter that quantifies the amount of heat introduced into the material and controls the cooling rate, directly influencing the microstructural evolution [28]. The results obtained from the calculation of Qr indicate that the best welding conditions are W2, W3, and W8 with 244 J/mm, 241 J/mm, and 231 J/mm, respectively. Meanwhile, the weld with the highest number of pores is W7, with 220 J/mm and a porosity value close to 20%.
These three welds (W2, W3, and W8) exhibited the lowest porosity values, which indicates that, preliminarily, it would be expected that with heat input of approximately 230–245 J/mm, welds of very good volumetric quality could be obtained. This range in the heat input agrees with the findings reported by Garcia et al. [23].
At this range of heat input, the energy is sufficient to melt the zinc layer on the base material, joining the sheets while allowing the Zn vapor to emerge to the surface of the weld pool, leading to the formation of porosity-free welded joints.

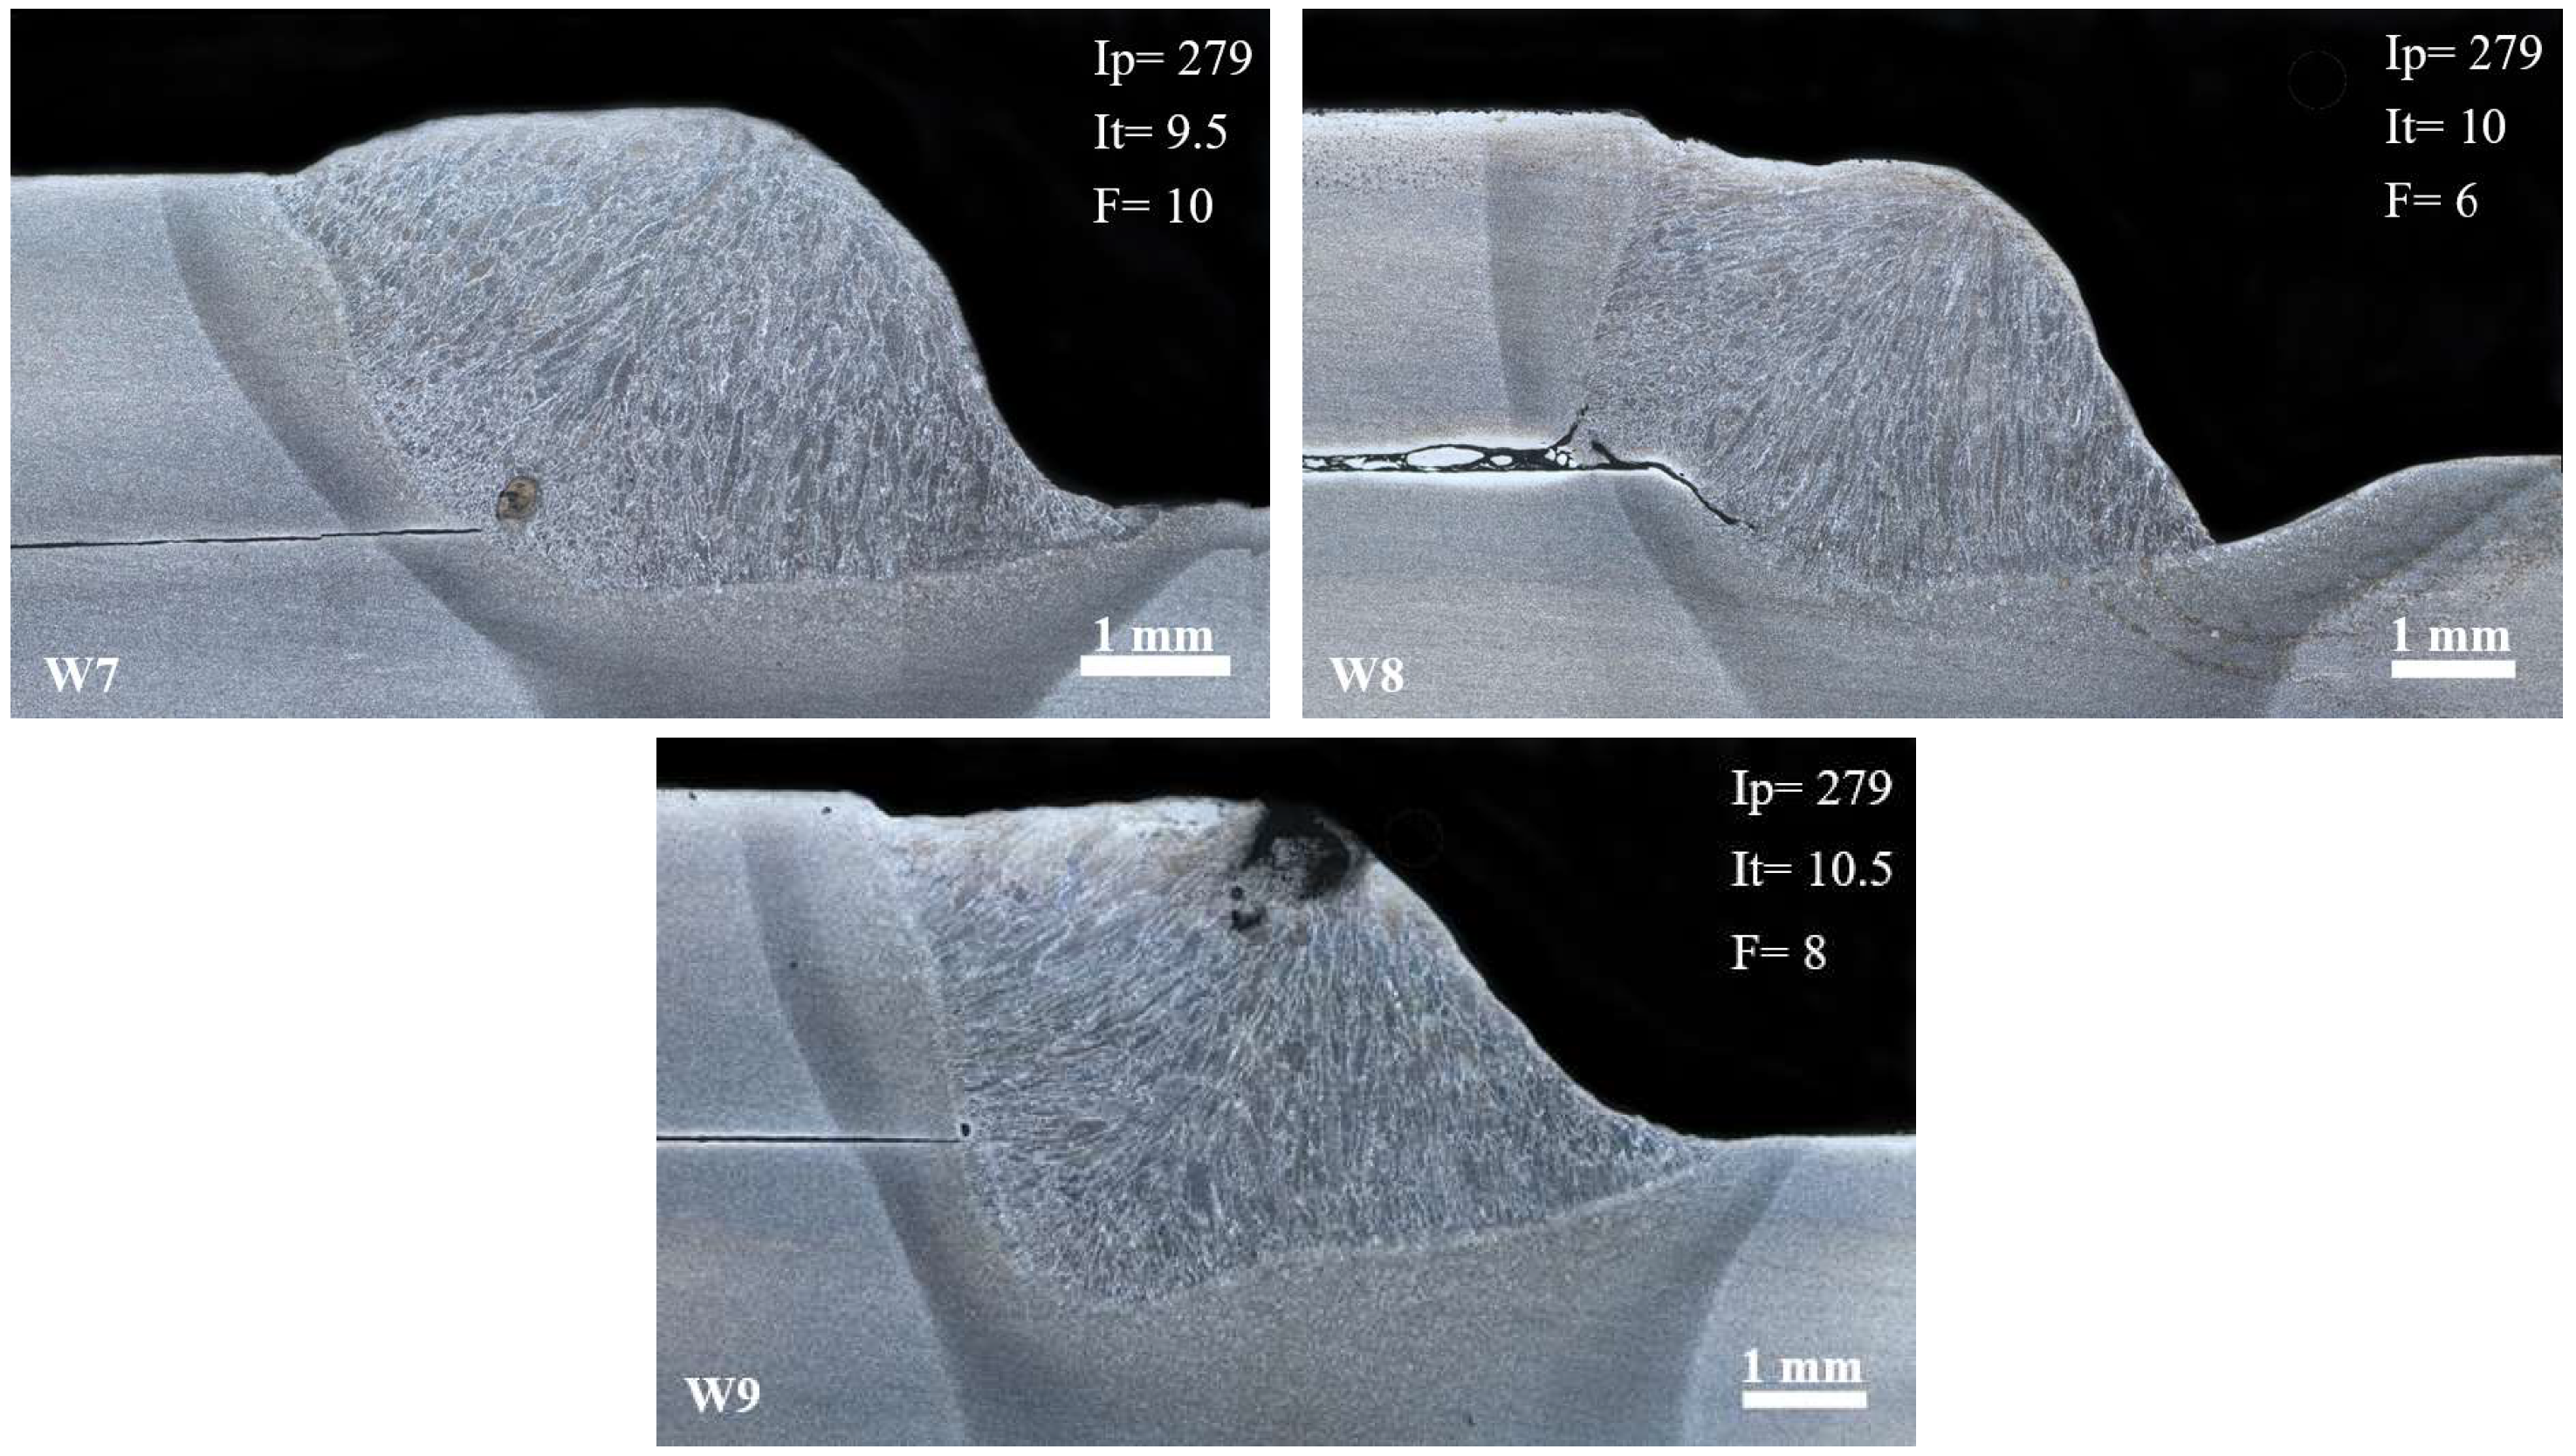
3.2. Macrostructural Observation of the Welds

The macrostructural characteristics of the cross-section of the welds were characterized with OM. Figure 3 shows the weld bead profiles from trials W1 to W9 as obtained using different parameters according to the orthogonal array L9. The weld that presents the best penetration, the best weld bead profile, the best macrostructural characteristics, and the lowest porosity percentage is weld W3. On the other hand, weld W7 exhibits the highest percentage of porosity, with nearly 20%, while sample W8 has the lowest penetration and the worst macrostructural characteristics, with a lack of filling and the beginning of a crack at the weld root, which decreases and impoverishes the mechanical properties of the weld. The presence of pipe-like pores was observed in welds W4 and W5, as the cutting process randomly coincided with the allocation of these defects.
The mechanisms of pore formation, growth [17], and release can also be observed. This process starts at the root of the weld, with zinc being released between the plates (Figure 3: sample W7). As it encounters more zinc vapor, it grows to form a large pore (Figure 3: samples W4 and W5) and emerges to the surface, moving towards the heat source (Figure 3: sample W9) and leaching on the surface of the welding face.
The effects of heat input are evident in the weld bead geometry and the HAZ size across different welds. Variations in peak current and pulse time significantly influence the heat distribution within the joint by altering the transfer dynamics of the molten droplets into the lap joint. These alterations lead to notable differences in the weld bead geometry and, consequently, in the microstructure of the various zones within the welded joints [29]. The magnitude of the welding current significantly impacts weld porosity and weld pool behavior, as the current determines the arc force, heat input, amount of zinc vaporization, and weld pool viscosity. The torch position parameters also play a crucial role in weld porosity as they dictate the concentration of the arc, arc force, and heat input [30]. Increasing welding current enhances the shear force, causing significant hardness variations across the cross-section of high-strength steels due to rapid heating and cooling during welding, which induces phase transformations. CP undergoes complex micro-structural changes during the welding process, so it is expected that failure modes are closely linked to the hardness and microstructure in the fusion zone (FZ) and heat-affected zone (HAZ) [31].

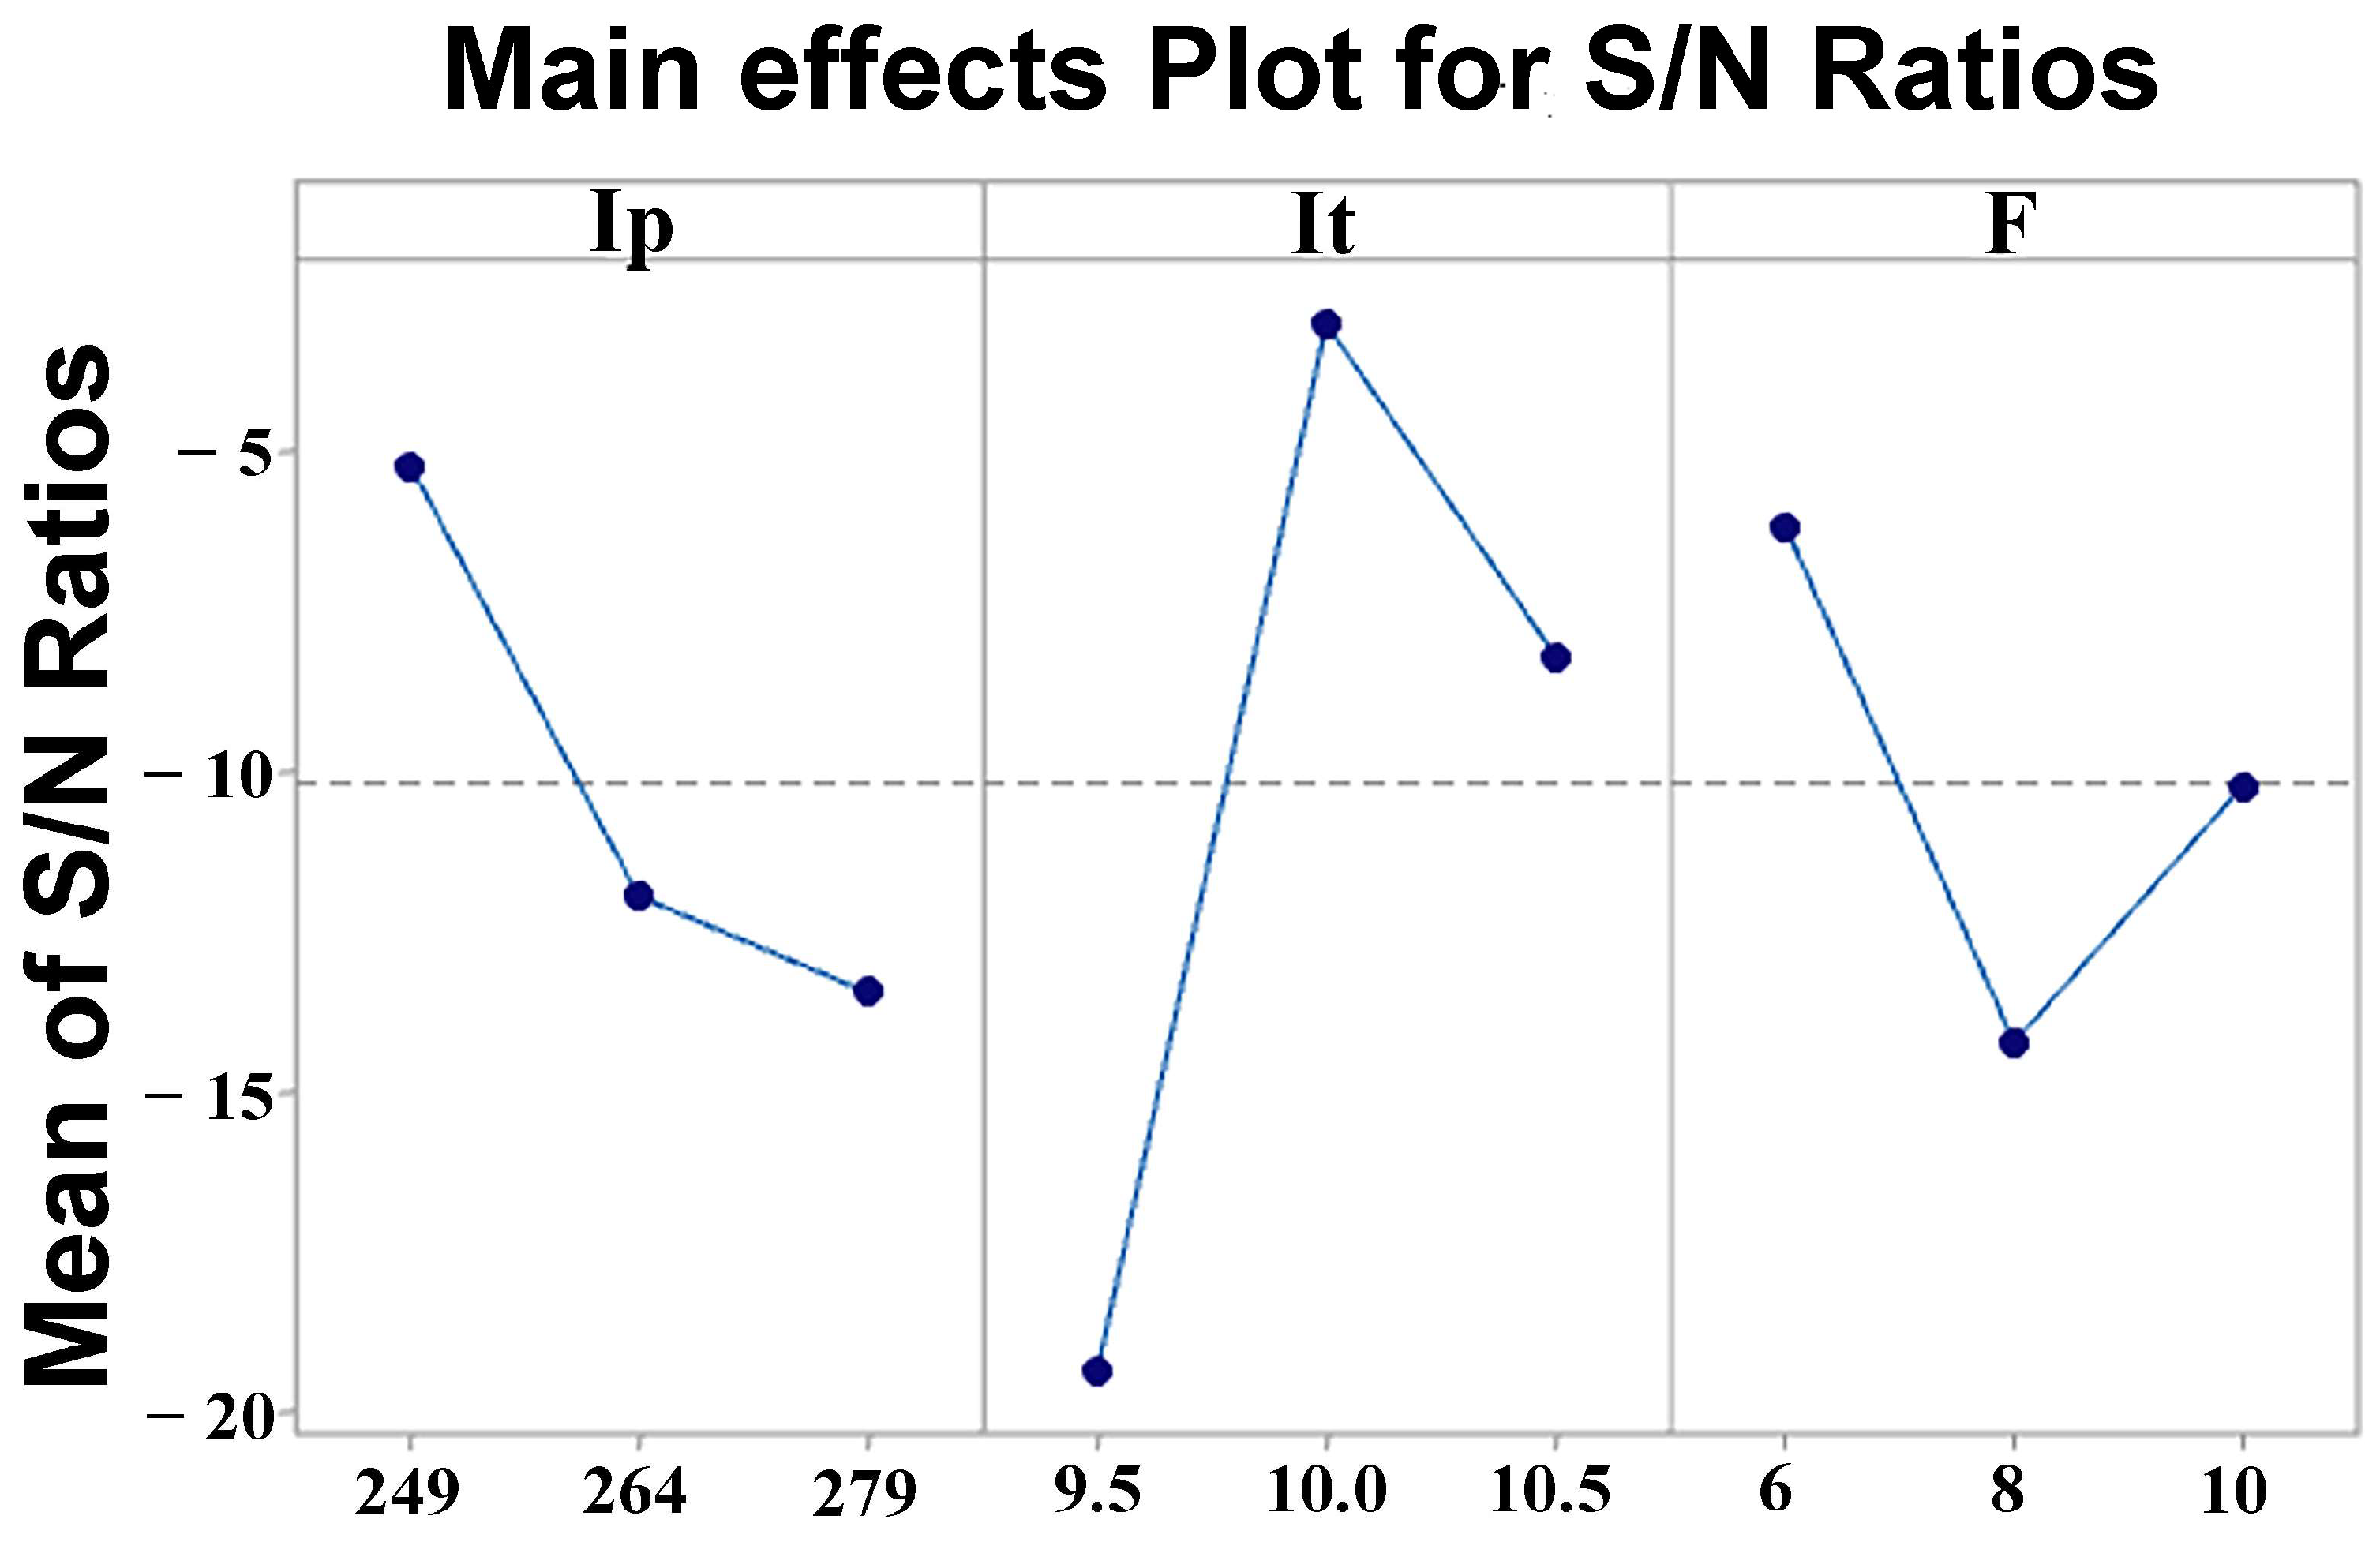
3.3. Taguchi Analysis

The calculation of the porosity percentage was included in the Taguchi model as a response variable under the criteria: smaller is better, meaning that the fewer pores in the weld, the better the condition. Also, the heat input was used as a covariable.
The aim is to evaluate the amount of porosity in the welded joints; therefore, porosity is the response variable in the Taguchi model and correlates with the porosity percentage in each weld. This allows us to determine which welding parameters influence the formation of pores during welding and to establish the welding conditions that reduce their occurrence.
In its simplest form, the S/N ratio is the proportion of the mean (signal) to the standard deviation (noise) [17]. The parameter design involves maximizing the S/N ratio to its highest value by changing the levels of control parameters associated with the reduction in the quantity of pores. Noise factors are selected to be considered, thus defining an appropriate orthogonal design for these factors [20]. Table 6 shows the responses for the signal-to-noise ratio (S/N). As stated above, smaller is better in the trials.
In Figure 4, the main effects plot for S/N ratios is illustrated. Using the “smaller is better” signal-to-noise ratio criterion (Equation (2)), considering that fewer porosities in the welded joint result in a more acceptable outcome, it was found that the values having the best effect on the signal-to-noise ratio are 249 A for peak current, 10 ms for peak time, and 6 Hz for frequency.
As shown in Equation (2), the signal-to-noise ratio criterion presents that “smaller is better” [19], where y is the response variable and n is the number of tests performed.
S / N = 10 log 10   y 2 n

3.3.1. Analysis of Variance (ANOVA)

Using analysis of variance (ANOVA), a comparison of variances among the means was performed, which allowed the determination of the optimal level of control factors. To determine the optimal level of these factors, the graphical analysis of the main effect was considered, and an analysis of the contribution rate of the factors was carried out [19], as shown in Table 7. According to these results, the variable that contributes the most to the results is Qr, followed by Fp, It, and finally Ip. Additionally, the higher the F value, the greater the effect it has on the results. Table 8 provides the details of the general linear model, which showed a model fit of 99.59%.

3.3.2. Predicted Values

The Taguchi design concludes a signal-to-noise ratio prediction with a value of 6.04 compared to the mean of 3.58967, as described in Table 9. Meanwhile, the configuration of optimal control factors, namely, peak current (Ip), peak time (It), and frequency (Fp), is concentrated in Table 10.

3.3.3. Evaluation of Welding Parameters with Optimal Values Predicted by the Taguchi Method

To ensure the repeatability of the experiment with the predicted values, three welds were performed using the welding parameters predicted in the analysis (Ip = 249 A, It = 10 ms, and Fp = 6 Hz), and the average porosity was characterized again for evaluation. The first step was to carry out a radiographic inspection of the welds. The X-ray images of the samples are shown in Figure 5. The radiographs reveal the absence of porosity in weld 2 (T2), whereas the presence of pores along the length of welds T1 y T3 exhibits a very low percentage of porosity, ~1%, indicating that the prediction of the Taguchi analysis results improves the quality of the overlapped welded joints in terms of porosity content by controlling the heat input during the joining process.
Table 11 shows a comparative analysis of the predicted porosity in the weld metal and the actual values of porosity with the replicas. The Qr value of the welds matches the predicted values from Taguchi analysis. It can be observed that with a value close to 250 J/mm, the best results were obtained, reducing the porosity percentage to less than 1%. This information aligns with what was reported by García-Guerrero et al. [23], who found that the minimum heat input to avoid porosities during the welding process is 250 J/mm.
Table 12 shows the comparison between the actual values used initially, the values predicted by ANOVA, and the experimental values obtained. It is observed that the porosity is considerably reduced when using the prediction methodology; however, when performing the experimental replicates, the porosity is reduced to 0.4%. This represents an improvement of 15.7% compared to the initial values.
Figure 6 shows the cross-sectional profiles of the fillet welds in the three replicas performed for the validation of the parameters in the ANOVA prediction. The macrostructural observation reveals good penetration and filling in weld T1, and the formation of a small pore trapped in the root is also observed. In weld T2, there is no evidence of pore formation, and the base material zone, heat-affected zone, and fusion zone can be distinguished by their apparent soundness in the weld. Finally, in weld T3, it exhibits the same characteristics of good penetration and filling, although the formation of a small pore in the root of the weld is also evident.
The results show that the Taguchi model optimized the weld quality by reducing the porosity in the weld bead to less than 1%. The parameters used in the three welds were replicated to verify their repeatability.

4. Conclusions

The modification of welding parameters peak current (Ip), peak time (tp), and pulse frequency (Fp) were evaluated on the reduction in porosity in welds of CP780 sheet steel using the Taguchi methodology, obtaining the following conclusions:
  • The optimum welding parameters obtained with the Taguchi model were as follows: Ip = 249 A, It = 10 ms, and F = 6 Hz. The most dominant variable in the analysis was the real heat input, Qr = 250 J/mm, which improved the porosity in the weld bead to values below 1%.
  • From the results obtained in the L9 experimental array, weld W3 shows better penetration, better fill in the weld bead, better macrostructural characteristics, and a lower percentage of porosity, with a Qr value of 241.89 J/mm. Weld W7 has the highest percentage of porosity, nearly 20%, with a Qr value of 220.48 J/mm.
  • Heat input values between 230 and 250 J/mm guarantee welds with low porosity percentages, but values outside this range dramatically increase the presence of porosity due to the entrapment of zinc vapor within the weld pool before solidification concludes.
  • The presence of Si and Mn at concentrations exceeding 0.30% and 0.51%, respectively, in the electrode increases the viscosity of the weld pool, hindering the escape of Zn vapor to the surface.

Author Contributions

Conceptualization, F.F.C.-L. and J.J.T.-T.; methodology, M.G.-G.; validation, V.H.L.-M. and J.C.V.-J.; formal analysis, M.G.-G. and C.A.G.-O.; investigation, M.G.-G. and C.A.G.-O.; resources, F.F.C.-L., V.H.L.-M. and J.J.T.-T.; writing—original draft preparation, M.G.-G. and F.F.C.-L.; writing—review and editing, V.H.L.-M., J.J.T.-T. and J.C.V.-J.; supervision, F.F.C.-L.; project administration, V.H.L.-M. and F.F.C.-L.; funding acquisition, F.F.C.-L. and J.J.T.-T. All authors have read and agreed to the published version of the manuscript.

Funding

This research received no external funding.

Data Availability Statement

The data presented in this study are available on request from the corresponding author due to privacy.

Acknowledgments

The authors thank Metalsa for providing materials, the support of the Universidad de Monterrey and Coordinación de la Investigación Científica (CIC) of the Universidad Michoacana de San Nicolas de Hidalgo, and CONAHCYT for providing a scholarship to M.G.-G. during his Ph.D.’s degree studies.

Conflicts of Interest

The authors declare no conflicts of interest.

References

  1. Kuziak, R.; Kawalla, R.; Waengler, S. Advanced high strength steels for automotive industry. Arch. Civ. Mech. Eng. 2008, 8, 103–117. [Google Scholar] [CrossRef]
  2. Bai, S.; Chen, Y.; Sheng, J.; Li, D.; Lu, H.; Bai, P.; Huang, Z.; Li, J.; Zhao, C. A comprehensive overview of high strength and toughness steels for automobile based on QP process. J. Mater. Res. Technol. 2023, 27, 2216–2236. [Google Scholar] [CrossRef]
  3. Wang, Y.; Mao, B.; Chu, S.; Chen, S.; Xing, H.; Zhao, H.; Wang, A.; Wang, Y.; Zhang, J.; Sun, B. Advanced manufacturing of high-speed steels: A critical review of the process design, microstructural evolution, and engineering performance. J. Mater. Res. Technol. 2023, 224, 8198–8240. [Google Scholar] [CrossRef]
  4. Koganti, R.; Orsette, C. Resistance Spot Welding Evaluation of Complex Phase 780 (CP780) Steel for Automotive Body Structural Applications. In Proceedings of the ASME International Mechanical Engineering Congress and Exposition, Lake Buena Vista, FL, USA, 13–19 November 2009; IMECE2009-13319. pp. 501–507. [Google Scholar]
  5. Fonstein, N. Advanced High Strength Sheet Steels; Springer: East Chicago, IN, USA, 2015; pp. 241–2586. [Google Scholar]
  6. Diniz, P.; de Morais, W.A. Impact of welding consumables strength level on metallurgical and mechanical properties homogeneity of welds obtained with a complex phase steel. Unisanta Sci. Technol. 2020, 8, 105–113. [Google Scholar]
  7. Sarpe, M.; Wesling, V.; Treutler, K. Influence of classified pore contents on the dynamic strength of the welded joint in gas metal arc welding with different process variants made of galvanized and uncoated complex-phase (CP) steel. Weld. World 2024, 68, 2023–2043. [Google Scholar] [CrossRef]
  8. Fernández-Carbajal, D.A. Soldadura de Aceros Complejos Termogalvanizados. Ph.D. Thesis, Universidad Autónoma de Nuevo León, San Nicolás de los Garza, Mexico, 9 February 2005. [Google Scholar]
  9. De Bruycker, E.; De Cooman, B.; De Meyer, M. Galvanizability of complex phase high strength steel. Steel Res. Int. 2004, 75, 147–152. [Google Scholar] [CrossRef]
  10. Salas Reyes, A.E.; Lara Rodriguez, G.Á.; González Parra, J.R.; Mercado Lemus, V.H.J.M. Microstructural characterization and corrosion behavior of similar and dissimilar welded advanced high-strength steels (AHSS) by rotary friction welding. Materials 2024, 17, 918. [Google Scholar] [CrossRef] [PubMed]
  11. Hopf, A.; Jüttner, S.; Goth, K.; Luttmer, M. Evaluation of hydrogen diffusion and trapping in AHSS and effects of laser-welding. J. Adv. Join. Process 2024, 9, 100195. [Google Scholar] [CrossRef]
  12. Midawi, A.; Sherepenko, O.; Ramachandran, D.; Akbarian, S.; Shojaee, M.; Zhang, T.; Ghassemi-Armaki, H.; Worswick, M.; Biro, E. Prediction of mechanical properties in the sub-critical heat affected zone of AHSS spot welds using Gleeble thermal simulator and Hollomon-Jaffe model. Metals 2023, 13, 1822. [Google Scholar] [CrossRef]
  13. Di Cocco, V.; Iacoviello, F.; Natali, S. Damaging micromechanisms in hot-dip galvanizing Zn based coatings. Theor. Appl. Fract. Mech. 2014, 70, 91–98. [Google Scholar] [CrossRef]
  14. Wu, C.; Chen, M.; Lu, Y. Effect of current waveforms on metal transfer in pulsed gas metal arc welding. Meas. Sci. Technol. 2005, 16, 2459. [Google Scholar] [CrossRef]
  15. Dos Santos, E.B.; Pistor, R.; Gerlich, A.P. High frequency pulsed gas metal arc welding (GMAW-P): The metal beam process. Manuf. Lett. 2017, 11, 1–4. [Google Scholar] [CrossRef]
  16. Palani, P.; Murugan, N. Selection of parameters of pulsed current gas metal arc welding. J. Mater. Process. Technol. 2006, 172, 1–10. [Google Scholar] [CrossRef]
  17. Hernández, A.B.; De la Paz Guillon, M.; García, L.A. La metodología de Taguchi en el control estadístico de la calidad. Investig. Oper. 2015, 23, 65–83. [Google Scholar]
  18. Xu, S.; Yeyao, T.; Shabaz, M. Multi-criteria decision making for determining best teaching method using fuzzy analytical hierarchy process. Soft Comput. 2023, 27, 2795–2807. [Google Scholar] [CrossRef] [PubMed]
  19. Anawa, E.; Olabi, A.-G. Using Taguchi method to optimize welding pool of dissimilar laser-welded components. Opt. Laser Technol. 2008, 40, 379–388. [Google Scholar] [CrossRef]
  20. Trejos, E.A.C.; Varela, P.D.M.; Diaz, C.A.S. Una revisión crítica de la razón señal ruido usada por Taguchi. Sci. Tech. 2012, 2, 52–56. [Google Scholar]
  21. Lázaro-Lobato, L.Á.; Curiel-Lopez, F.F.; Lopez-Morelos, V.H.; Garcia-Renteria, M.A. Taguchi methodology approach on microstructural and mechanical properties of bimetallic welded joints of API 5L X-52/AISI 316L-Si. MRS Adv. 2023, 8, 27–33. [Google Scholar] [CrossRef]
  22. Hussein, K.; Akbari, H.; Noorossana, R.; Yadegari, R. A multi-response optimization approach to mechanical properties improvement of dissimilar resistance spot welding joints. J. Eng. Des. Technol. 2023. [Google Scholar] [CrossRef]
  23. Garcia-Guerrero, J.; Curiel-López, F.; López-Morelos, V.; Taha-Tijerina, J.; Sánchez-Cruz, T.; Ramirez-Lopez, M.; Cortes-Carillo, E.; Quinones-Salinas, M. Impact of welding parameters in the porosity of a dissimilar welded lap joint of CP800-XPF1000 steel weldment by GMAW-P. Metals 2024, 14, 309. [Google Scholar] [CrossRef]
  24. ASTM E407-07; Standard Practice for Microetching Metals and Alloys. American Society for Testing and Materials: West Conshohocken, PA, USA, 2007.
  25. Ahsan, M.; Kim, Y.; Kim, C.; Kim, J.; Ashiri, R.; Park, Y. Porosity formation mechanisms in cold metal transfer (CMT) gas metal arc welding (GMAW) of zinc coated steels. Sci. Technol. Weld. Join. 2016, 21, 209–215. [Google Scholar] [CrossRef]
  26. Yu, J.; Cho, S. Metal-cored welding wire for minimizing weld porosity of zinc-coated steel. J. Mater. Process. Technol. 2017, 249, 350–357. [Google Scholar] [CrossRef]
  27. Molera Solá, P. Soldadura Industrial: Clases y Aplicaciones; Marcombo: Barcelona, Spain, 1992; p. 128. [Google Scholar]
  28. Marconi, C.; Consigli, C.; Castillo, M.; Svoboda, H. Efecto de los parámetros de proceso sobre las propiedades mecánicas de uniones GMAW-brazing de acero DP 1000. Soldag. Inspeção 2020, 25, e2534. [Google Scholar] [CrossRef]
  29. Sánchez-Cruz, N.; Curiel-López, F.; López-Morelos, V.; González–Sánchez, J.; Ruiz, A.; Carrillo, E. Optimization of macro and microstructural characteristics of 316l/2205 dissimilar welds obtained by the GMAW-pulsed process. Mater. Today Commun. 2023, 34, 105401. [Google Scholar] [CrossRef]
  30. Yu, J.; Kim, D. Effects of welding current and torch position parameters on minimizing the weld porosity of zinc-coated steel. Int. J. Adv. Manuf. Technol. 2018, 95, 551–567. [Google Scholar] [CrossRef]
  31. Morales-Sánchez, G.; Collazo, A.; Doval-Gandoy, J. Influence of the process parameters on the quality and efficiency of the resistance spot welding process of advanced high-strength complex-phase steels. Metals 2021, 11, 1545. [Google Scholar] [CrossRef]
Figure 1. Welding fixture for joining the overlapped sheets.
Metals 14 00857 g001
Figure 2. X-rays of the welds. The porosities are marked in red, and the best condition is weld W3, while the worst condition with more porosities formed is weld W7.
Metals 14 00857 g002
Figure 3. Transverse macrographies of the welded joints obtained according to the L9 array.
Metals 14 00857 g003aMetals 14 00857 g003b
Figure 4. Main effects plot for the S/N ratios.
Metals 14 00857 g004
Figure 5. X-rays for the welds performed with optimal values predicted by the Taguchi method.
Metals 14 00857 g005
Figure 6. Macrographs of the transverse profiles of the welds obtained with optimal values as predicted by Taguchi design.
Metals 14 00857 g006
Table 1. Chemical composition of the CP780 zinc-coated steel and ER70S-3 electrode (wt. %).
MaterialCSiMnPSCrMoNiCuAlFe
CP7800.2760.2210.4900.0780.0140.9100.1650.0180.0110.05497.76
ER70S-30.0780.3710.8230.0070.0180.0160.00980.0280.0110.00598.63
Table 2. Welding conditions for the different levels.
Welding ParametersSymbolLevel 1Level 2Level 3
Peak current I P (A)249264279
Peak time I t (ms)9.51010.5
Pulse frequencyFp (Hz)6810
Table 3. Experimental array L9 for the Taguchi methodology.
TrialPeak Current
I P
(A)
Peak Time
I t
(ms)
Pulse Frequency
Fp
(Hz)
W12499.56
W2249108
W324910.510
W42649.58
W52641010
W626410.56
W72799.510
W8279106
W927910.58
Table 4. Defect type and % porosity for the welds obtained with the experimental array L9.
TrialDefect Type% Porosity
W1Clustered porosity6.7
W2Clustered porosity1.7
W3Spherical porosity and the lack of fusion0.4
W4Spherical porosity and the lack of fusion6.1
W5Spherical porosity and the lack of fusion3.5
W6Spherical porosity2.7
W7Clustered porosity19.2
W8Clustered porosity0.4
W9Clustered porosity and the lack of fusion12.2
Table 6. Responses for signal-to-noise ratio (S/N): smaller is better.
LevelsIp (A)It (ms)F (Hz)
1−5.178−19.348−6.132
2−11.924−2.998−14.201
3−13.427−8.183−10.196
Delta8.24916.3518.070
Rank213
Table 7. ANOVA.
Table 7. ANOVA.
SourceDFSC sContributionSC Ajust.MC Ajust.F Valuep Value
Qr1132.84042.96%56.83556.83544.340.095
Ip212.9794.20%7.6633.8312.990.379
It276.97424.89%10.9365.4684.270.324
Fp285.15327.54%85.15342.57733.220.122
Error11.2820.41%1.2821.282
Total8307.228100%
Table 8. Summary of the model.
S R 2 A d j .   R 2 PRESS Pred .   R 2 BIC
1.1321499.59%96.68%441.3530.00%27.77
Table 9. Relation S/N.
Relation S/NMean
6.045523.58967
Table 10. Predicted values.
Welding ParametersFactor
IpItFp
Level249106
Table 11. Qr of the welds with the predicted values from Taguchi.
TrialQr
J/mm
T1250.87
T2247.81
T3249.95
Table 12. Results of the validation of the experiments.
Initial Welding
Parameters
Optimal Welding Parameters
PredictionExperimental
Ip (A)It (ms)Fp (Hz)Ip (A)It (ms)Fp (Hz)Ip (A)It (ms)Fp (Hz)
Level26410.510249106249106
Total porosities (%)5.223.580.4
S/N ratio (dB) −9.95 6.04 5.22
Enhancement 15.17
Disclaimer/Publisher’s Note: The statements, opinions and data contained in all publications are solely those of the individual author(s) and contributor(s) and not of MDPI and/or the editor(s). MDPI and/or the editor(s) disclaim responsibility for any injury to people or property resulting from any ideas, methods, instructions or products referred to in the content.

