
Optimization of Step Times for ASTM F1624 Methodology Applied to Small Punch Tests in Aggressive Environments

 , and
, and
Abstract
:1. Introduction
2. Materials and Methods
2.1. ASTM F1624 Method
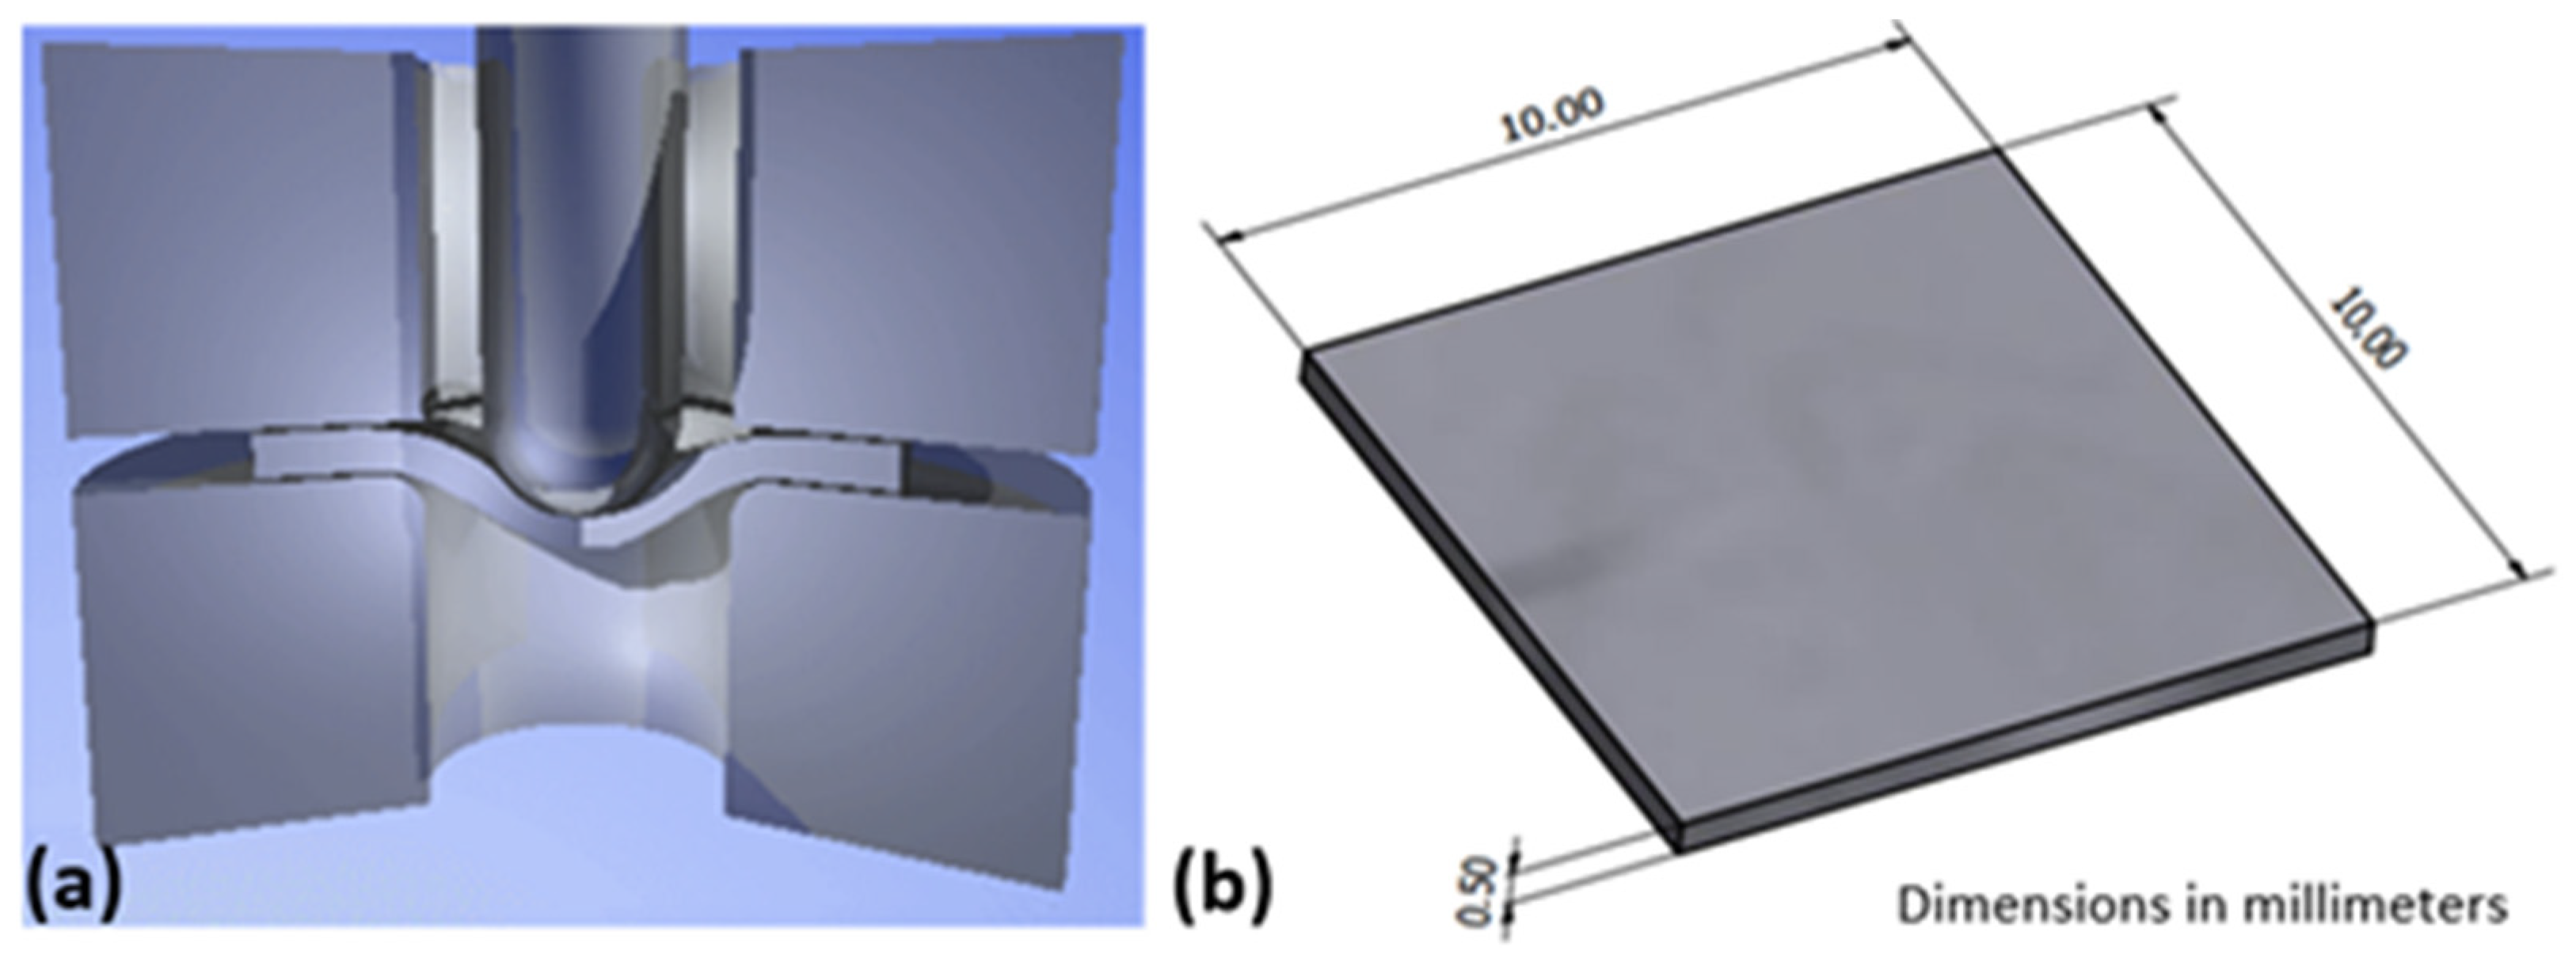
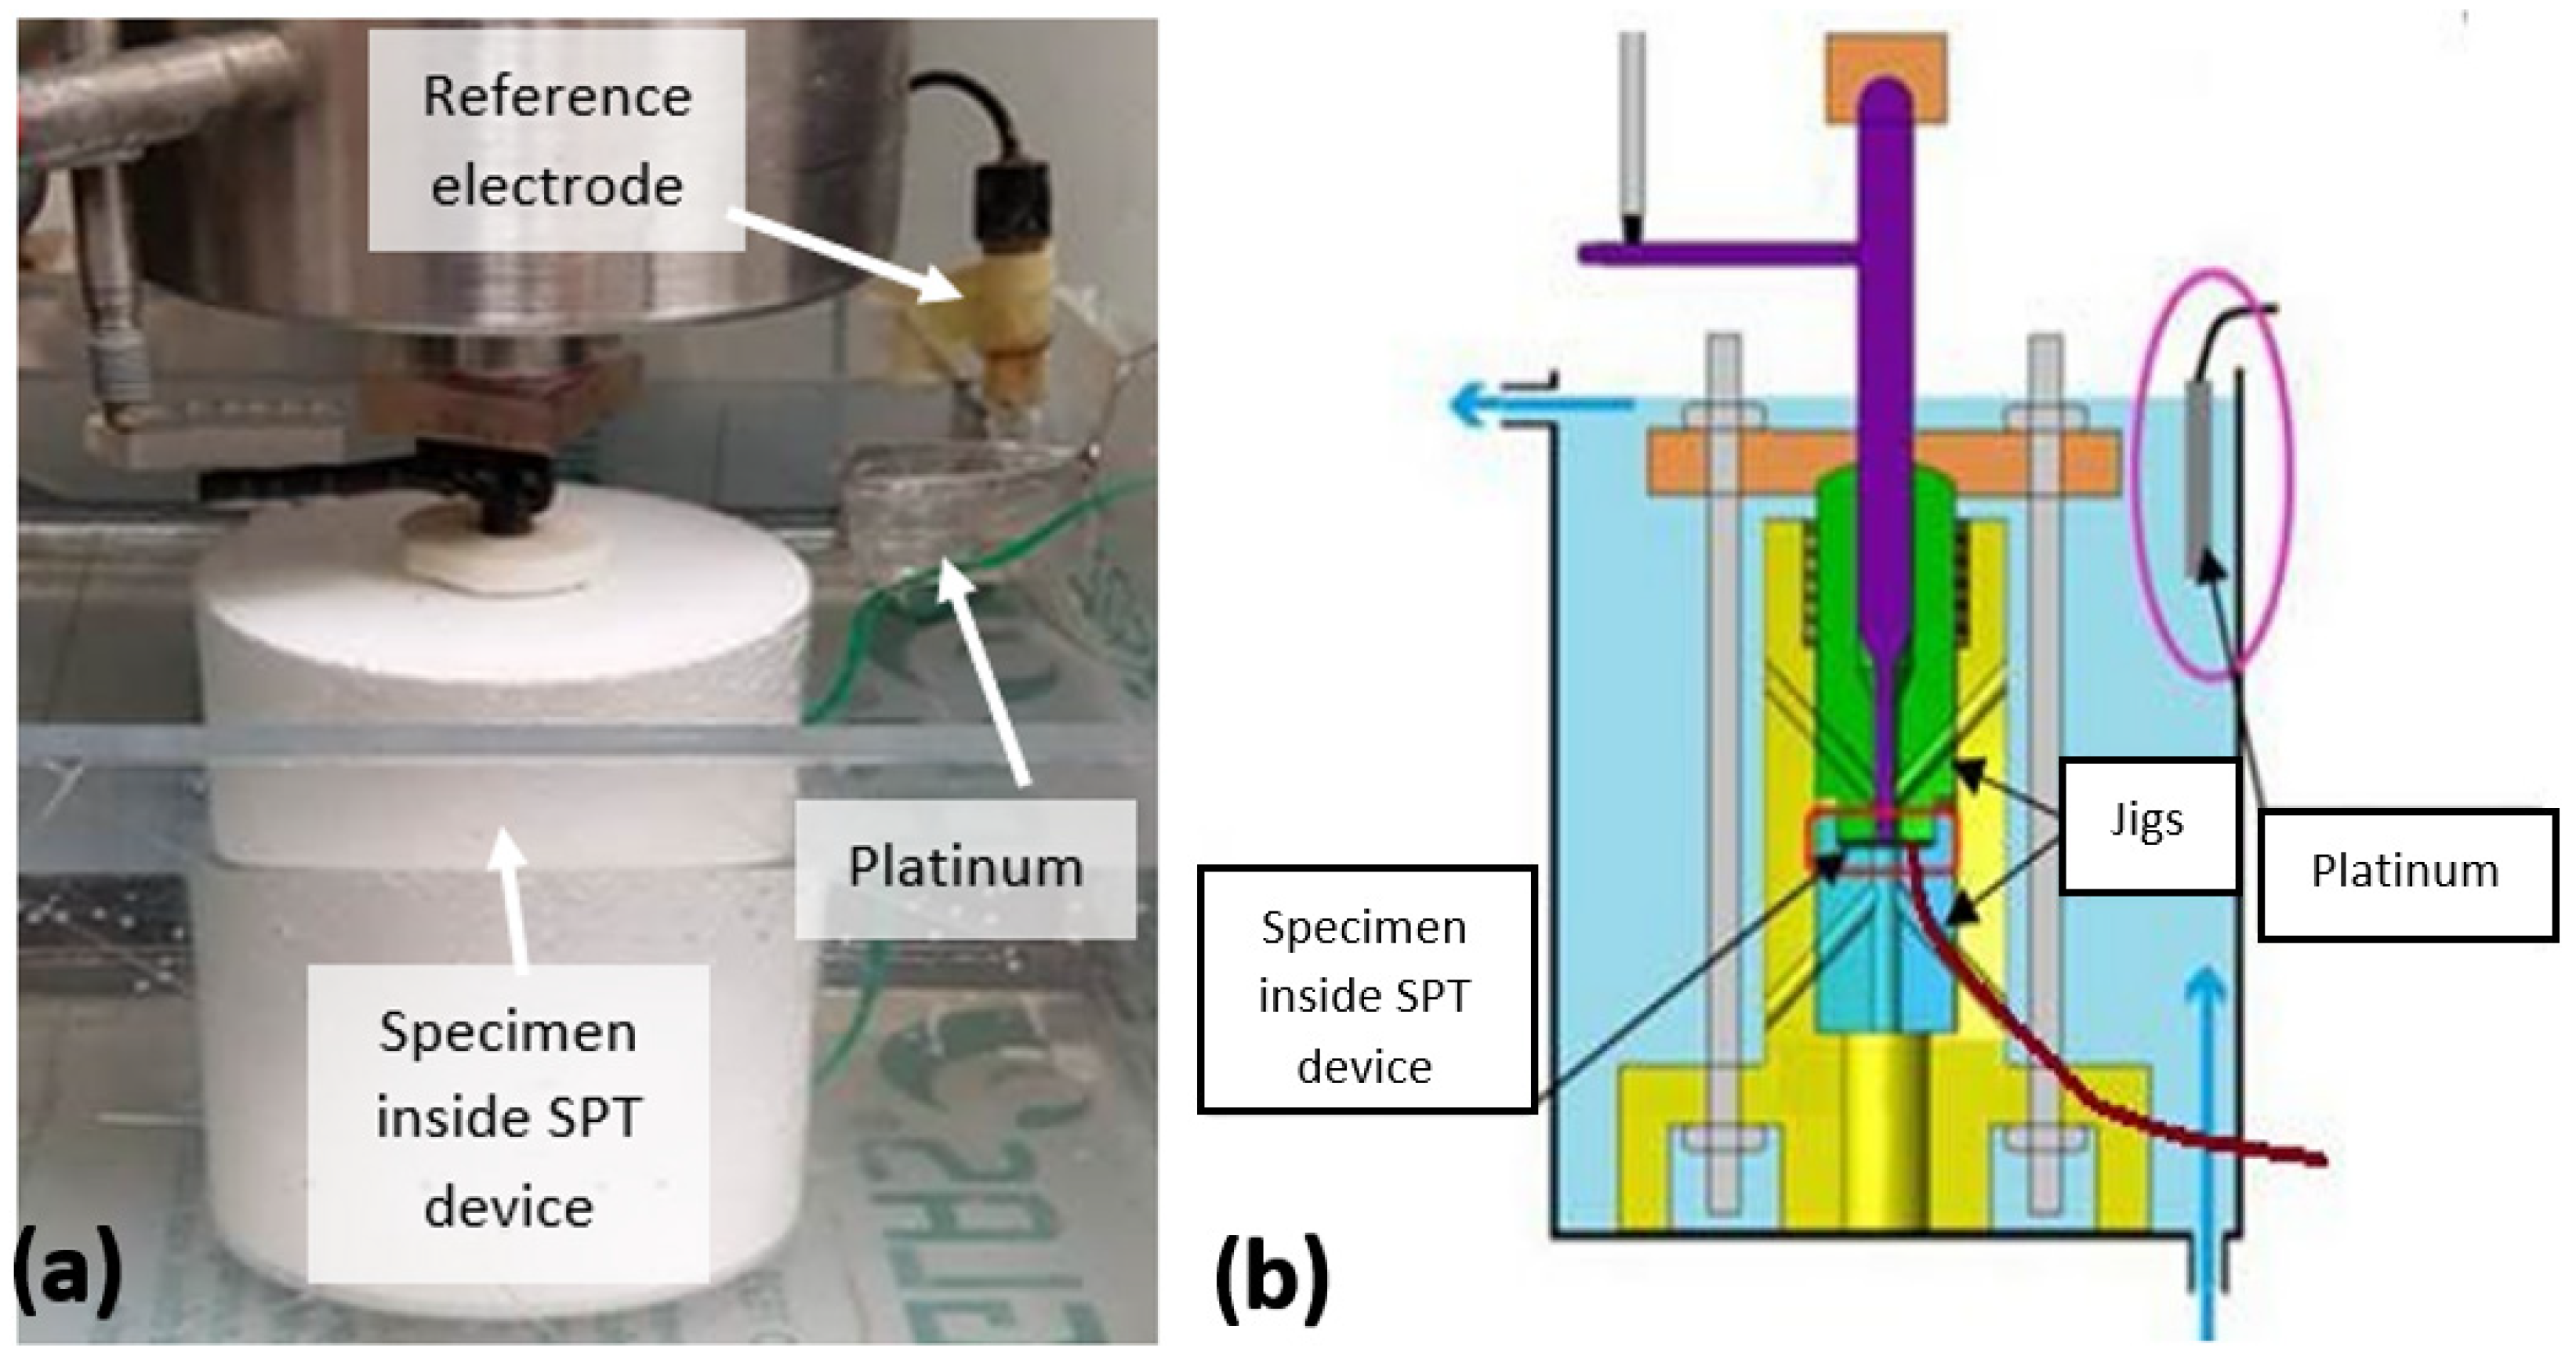
2.2. Application of Step Loading Technique from ASTM F1624 [18] to Small Punch Test
2.3. Materials and Environment Employed
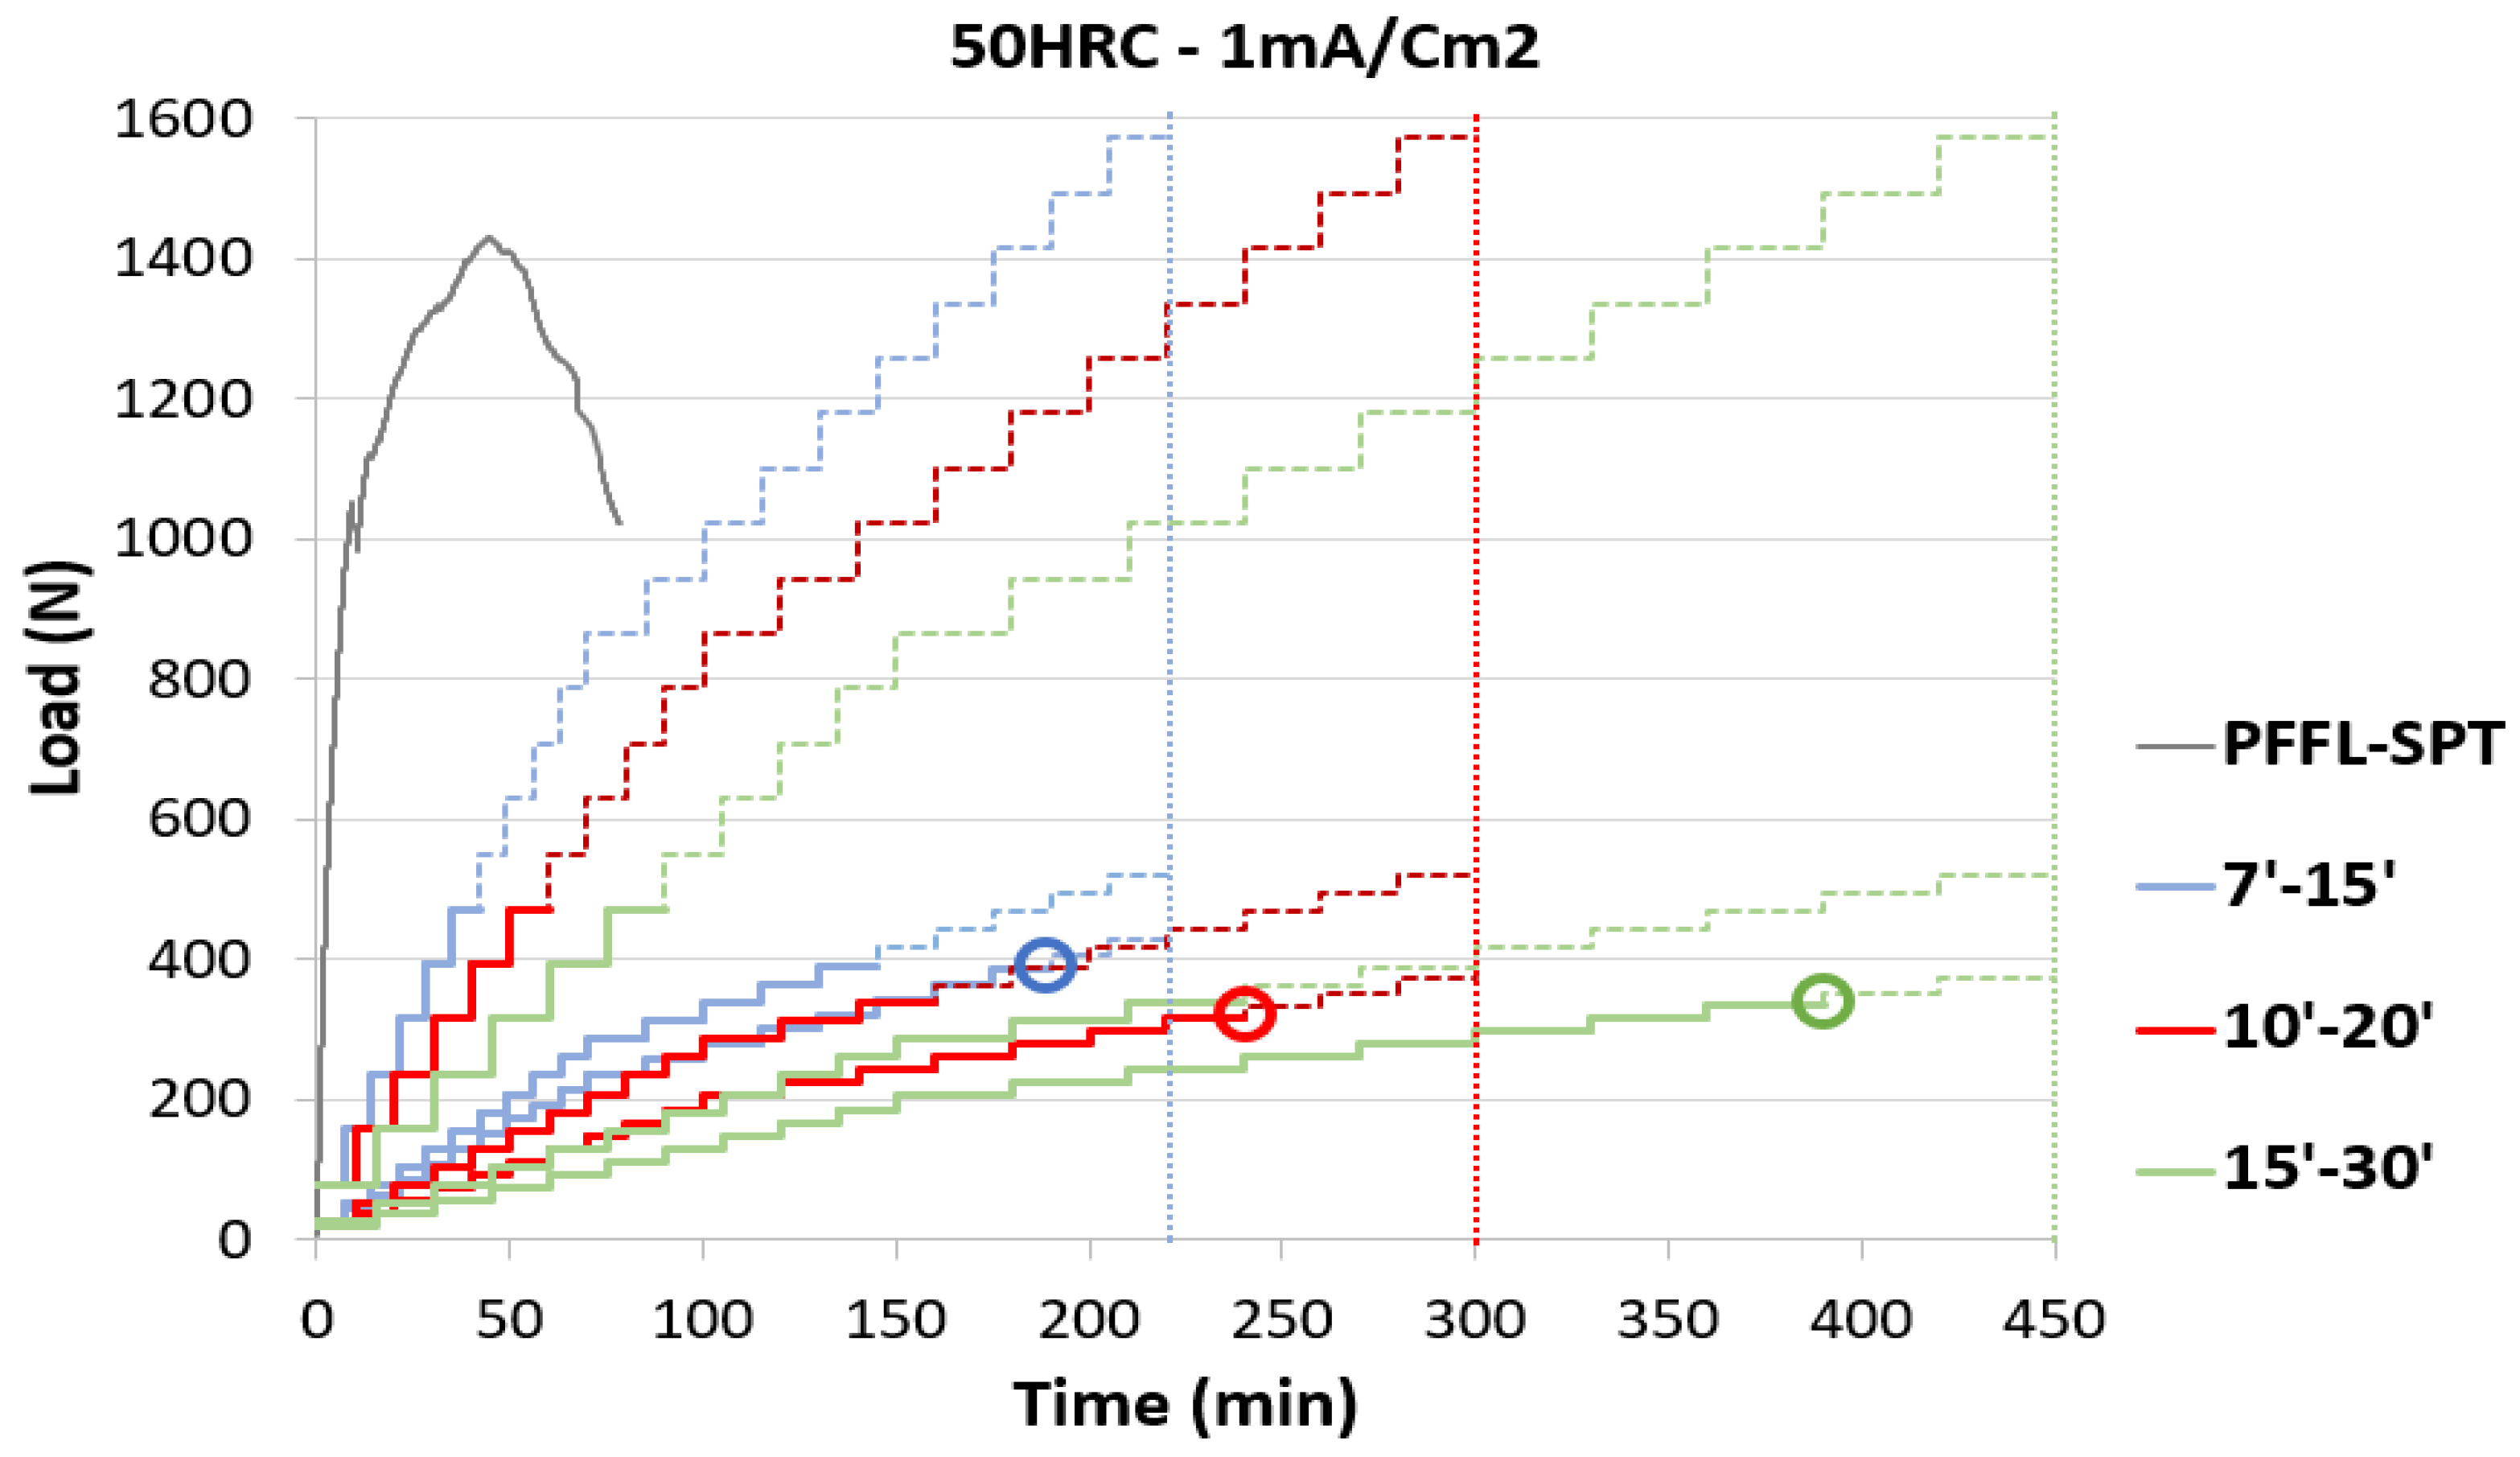
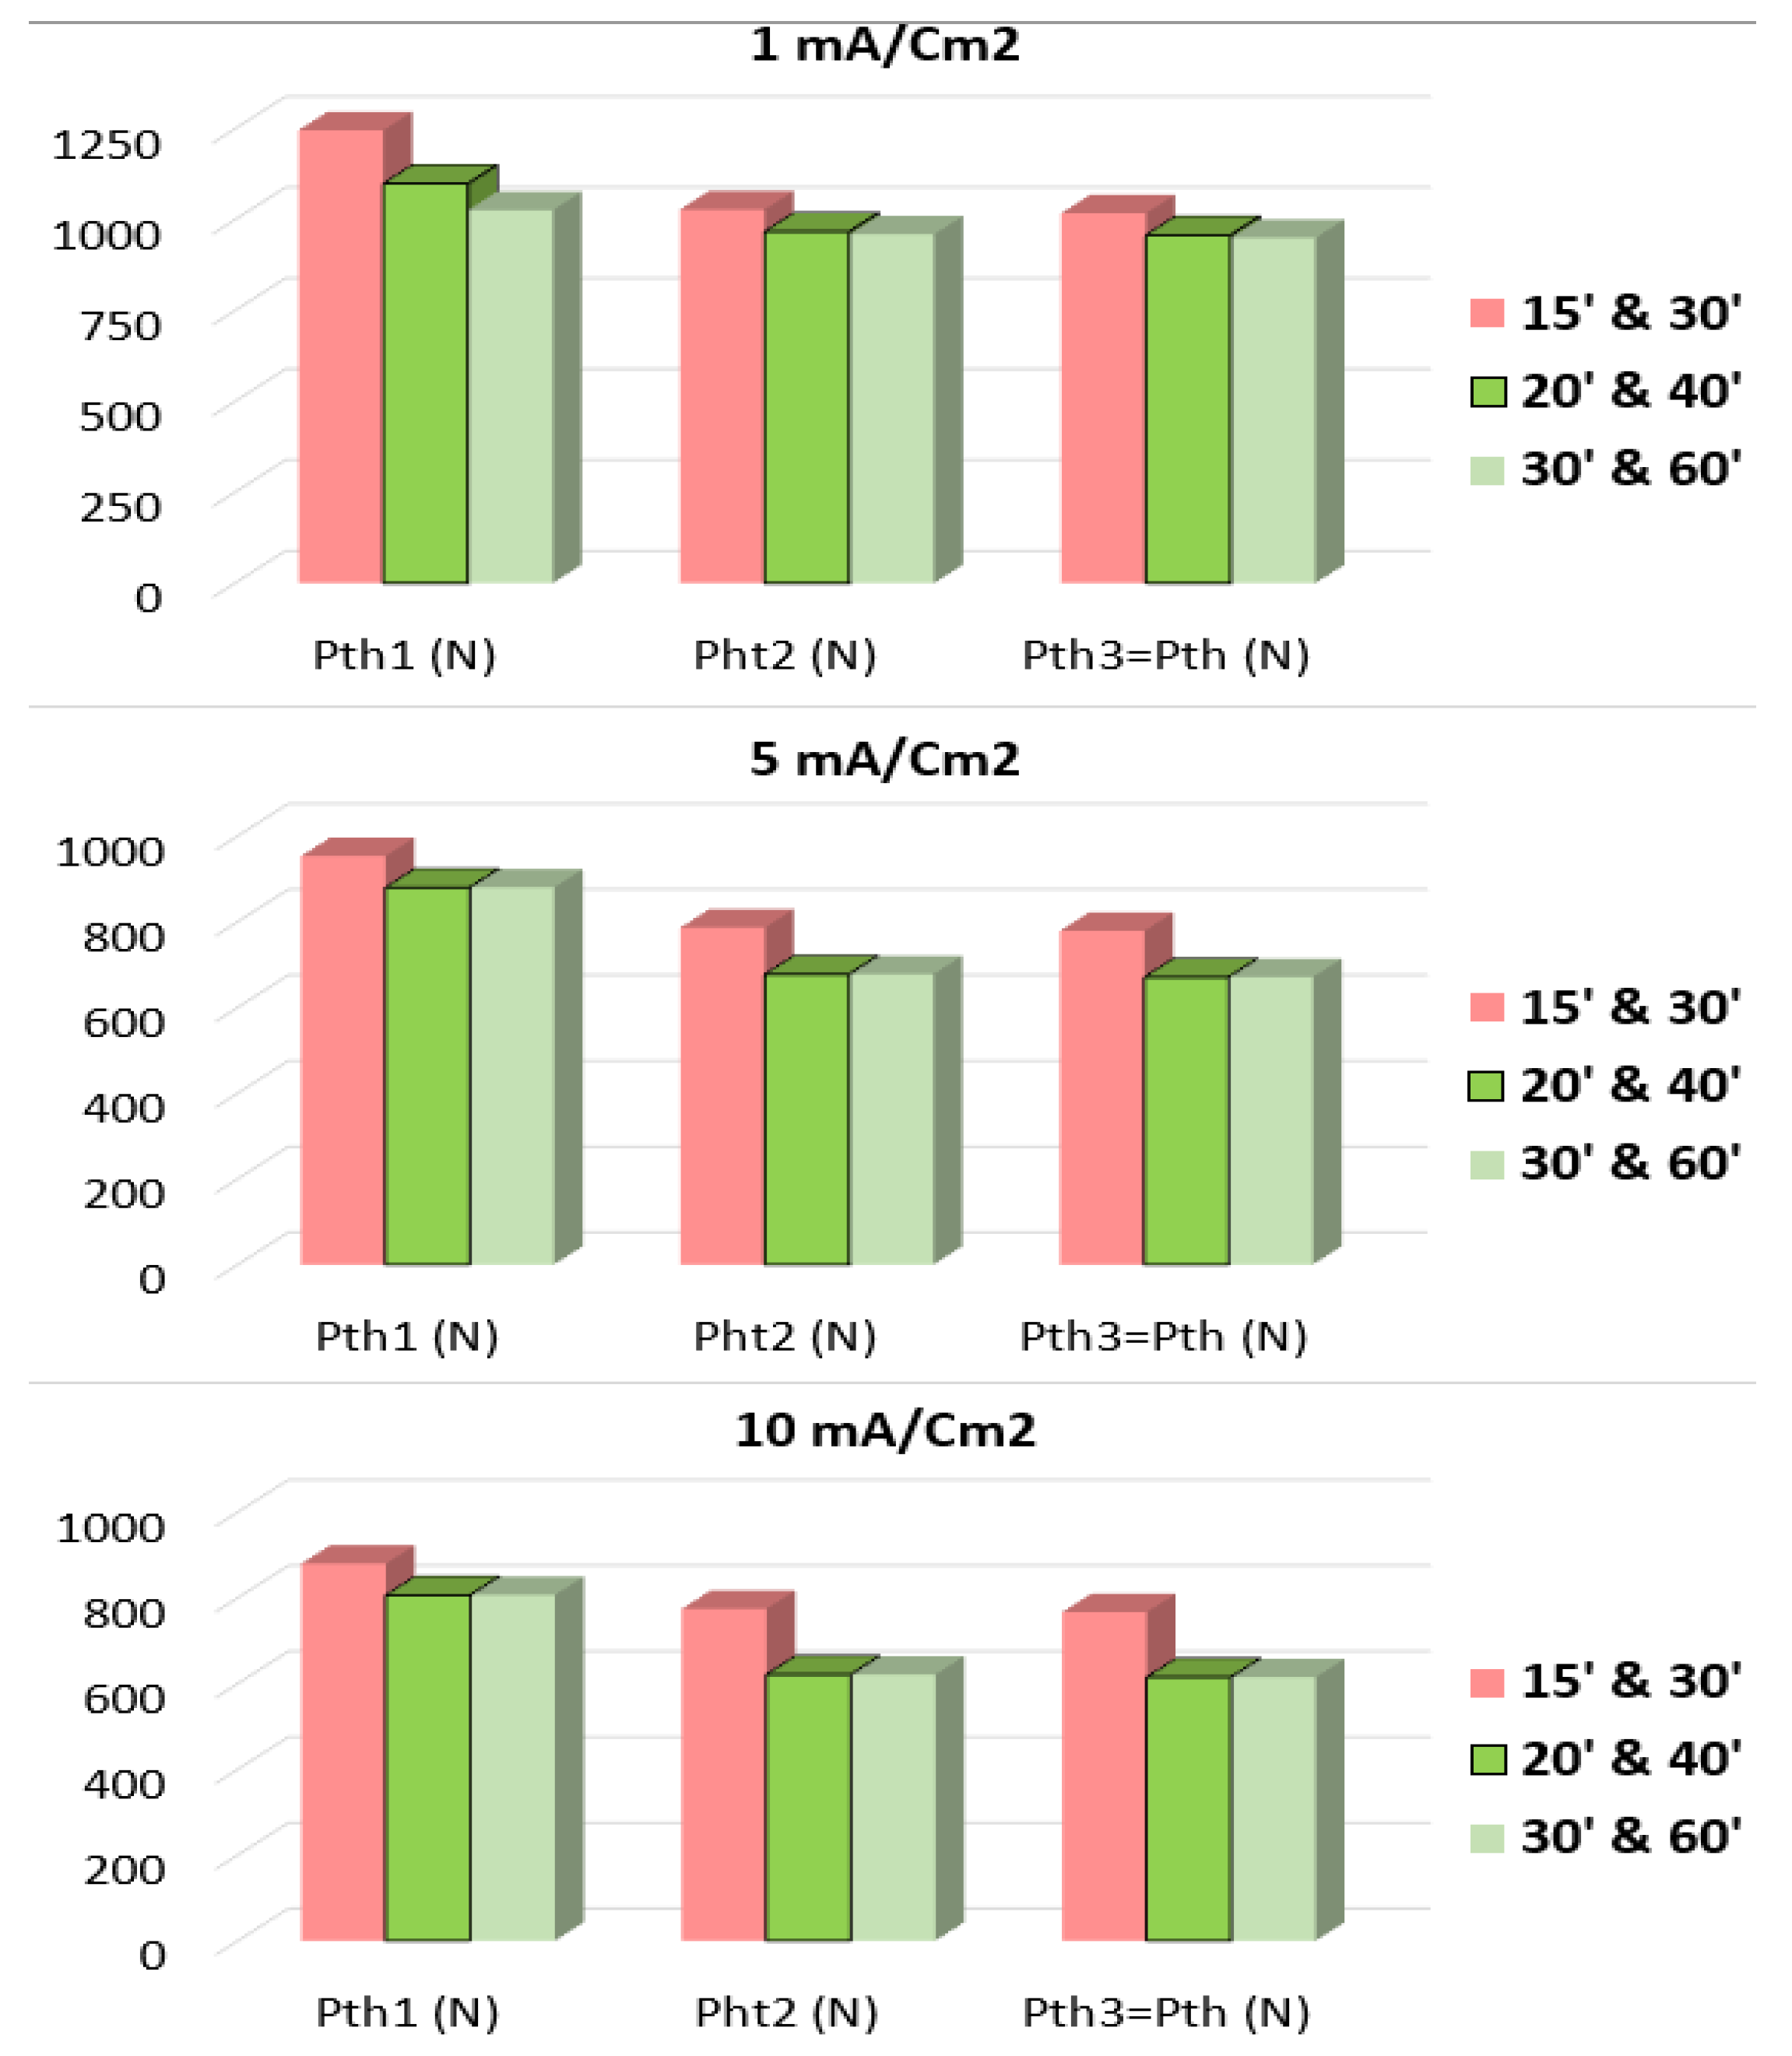
3. Results
4. Conclusions and Future Work
Author Contributions
Funding
Data Availability Statement
Conflicts of Interest
References
- Dyal, R.K.; Paravathavarthini, N. Hydrogen in power plant steels. Sadhana-Acad. Proc. Eng. Sci. 2003, 28, 431–451. [Google Scholar]
- Rehrl, J.; Mrackez, K.; Pichler, A.; Werner, E. Mechanical properties and fracture behavior of hydrogen charged AHSS/UHSS grades at high and low strain rate tests. Mater. Sci. Eng. A 2014, 590, 360–367. [Google Scholar] [CrossRef]
- Carpio, J.; Casado, J.A.; Álvarez, J.A.; Gutiérrez-Solana, F. Environmental factors in failure during structural steel hot-dip galvanizing. Eng. Fail. Anal. 2009, 16, 585–595. [Google Scholar] [CrossRef]
- Bueno, A.H.S.; Moreira, E.D.; Gomes, J.A.C.P. Evaluation of stress corrosion cracking and hydrogen embrittlement in an API steel grade. Eng. Fail. Anal. 2014, 36, 423–431. [Google Scholar] [CrossRef]
- Tiwari, G.P.; Bose, A.; Chakravarty, J.K.; Wadekar, S.L.; Totlani, M.K.; Arya, R.N.; Fotedar, R.K. A study of internal hydrogen embrittlement of steels. Mater. Sci. Eng. A 2000, 286, 269–281. [Google Scholar] [CrossRef]
- Siddiqui, R.A.; Abdullah, H.A. Hydrogen embrittlement in 0.3% carbon steel used for petrochemicall applications. J. Mater. Process. Technol. 2005, 170, 430–435. [Google Scholar] [CrossRef]
- Micheler, T.; Naumann, J. Microstructural aspects upon hydrogen environment embrittlment of various BCC steels. Int. J. Hydrogen Energy 2010, 35, 1485–1492. [Google Scholar]
- Moody, N.R.; Robinson, S.L.; Garrison, W.M., Jr. Hydrogen effects on the properties and fracture modes of iron-based alloys. Res. Mech. 1990, 30, 143–206. [Google Scholar]
- Sedriks, A.J. Stress Corrosion Cracking Test Methods; National Asociation of Corrosion Engineers: Houston, TX, USA, 1989. [Google Scholar]
- Xu, H.; Xia, X.; Hua, L.; Sun, Y.; Dai, Y. Evaluation of hydrogen embrittlement susceptibility of temper embrtittled 2.25Cr1Mo steel by SSRT method. Eng. Fail. Anal. 2012, 19, 43–50. [Google Scholar] [CrossRef]
- ISO 7539; Corrosion of Metals and Alloys. Parts 1 to 9; International Organization for Standarization: Geneva, Switzerland, 2011.
- ASTM E1681-03; Test Method for Determining Threshold Stress Intensity Factor for Environment Assisted Cracking of Metallic Materials. ASTM: West Conshohocken, PA, USA, 2013.
- Wang, Y.; Wang, X.; Gong, J.; Shen, L.; Dong, W. Hydrogen-precharged 304L austenitic stainless steel: Effect of plastic pr-strain. Int. J. Hydrogen Energy 2014, 39, 13909–13918. [Google Scholar] [CrossRef]
- Arroyo, B.; Andrea, L.; Gutiérrez-Solana, F.; Álvarez, J.A.; González, P. Threshold stress estimation in hydrogen induced cracking by Small Punch test based on the application of the incremental step loading technique. Theor. Appl. Fract. Mech. 2020, 110, 102839. [Google Scholar] [CrossRef]
- Arroyo, B.; Andrea, L.; Gutiérrez-Solana, F.; Álvarez, J.A. Time optimization of step loading technique in hydrogen embrittlement small punch tests. Theor. Appl. Fract. Mech. 2022, 117, 103206. [Google Scholar] [CrossRef]
- Álvarez, J.A.; Gutiérrez-Solana, F. An elastic-plastic fracture mechanics based methodology to characterize cracking behaviour and its applications to environmental assisted processes. Nucl. Eng. Des. 1998, 188, 185–202. [Google Scholar] [CrossRef]
- Gutiérrez-Solana, F.; Valiente, A.; González, J.J.; Varona, J.M. A strain-based fracture model for stress corrosion cracking of low-alloy steels. Metall. Mater. Trans. A 1996, 27, 291–304. [Google Scholar] [CrossRef]
- ASTM F1624-18; Standard Test Method for Measurement of Hydrogen Embrittlement Threshold in Steel by the Incremental Step Loading Technique. ASTM International: West Conshohocken, PA, USA, 2018.
- Stevens, M.F. Effect of Microstructure and Trapping on the Hydrogen Embrittlement Susceptibility of a Titanium Bearing HSLA Steel. Ph.D. Thesis, Carnegie-Mellon University, Pittsburgh, PA, USA, 1984. [Google Scholar]
- Arroyo, B.; Álvarez, J.A.; Gutiérrez-Solana, F.; Lacalle, R.; González, P. Rate effects on the estimation of fracture toughness by small punch tests in hydrogen embrittlement. J. Strain Anal. 2019, 54, 390–400. [Google Scholar] [CrossRef]
- ASTM E8/E8M 16a; Standard Test Methods for Tension Testing of Metallic Materials. ASTM International: West Conshohocken, PA, USA, 2016.
- González, J.J.; Gutiérrez-Solana, F.; Varona, J.M. The effects of microstructure, strength level, and crack propagation mode on stress corrosion cracking behavior of 4135 steel. Metall. Mater. Trans. A 1996, 27, 281–290. [Google Scholar] [CrossRef]
- EN 10371; Metallic materials–Small Punch Test Method. European Standard: Brussels, Belgium, 2021.


| Hardness | Step | Step Load | Step Time (h) | Profile Code [18] |
|---|---|---|---|---|
| 33 ≤ HRC < 45 | 1–10 | 5% of PFFS | 2 | (10/5/2.4) |
| 11–20 | 4 | |||
| 45 ≤ HRC < 55 | 1–10 | 5% of PFFS | 1 | (10/5/1.2) |
| 11–20 | 2 | |||
| HRC ≥ 55 | 1–20 | 5% of PFFS | 1 | (10/5/1) |
| Hardness | Step | Proposal #1 (min) | Proposal #2 (min) | Proposal #3 (min) |
|---|---|---|---|---|
| 33 ≤ HRC < 45 | 1–10 | 30′ | 20′ | 15′ |
| 11–20 | 60′ | 40′ | 30′ | |
| 45 ≤ HRC < 55 | 1–10 | 15′ | 10′ | 7′ |
| 11–20 | 30′ | 20′ | 15′ | |
| HRC ≥ 55 | 1–20 | 15′ | 10′ | 7′ |
| Material and Environment | Steps Duration | PFFL-SPT (N) | Pth-1 (N) | Pth-2 (N) | Pth-3 (N) | Difference |
|---|---|---|---|---|---|---|
| 35 HRC 1 mA/cm2 | 15′–30′ | 1466 | 1246 | 1028 | 1018 | +6% |
| 20′–40’ | 1466 | 1099 | 968 | 958 | - | |
| 30′–60′ | 1466 | 1026 | 959 | 950 | −1% | |
| 35 HRC 5 mA/cm2 | 15′–30′ | 1466 | 953 | 786 | 778 | +16% |
| 20′–40′ | 1466 | 880 | 677 | 671 | - | |
| 30′–60′ | 1466 | 880 | 677 | 671 | 0% | |
| 35 HRC 10 mA/cm2 | 15′–30′ | 1466 | 880 | 774 | 766 | +25% |
| 20′–40′ | 1466 | 806 | 621 | 615 | - | |
| 30′–60′ | 1466 | 806 | 621 | 615 | 0% |
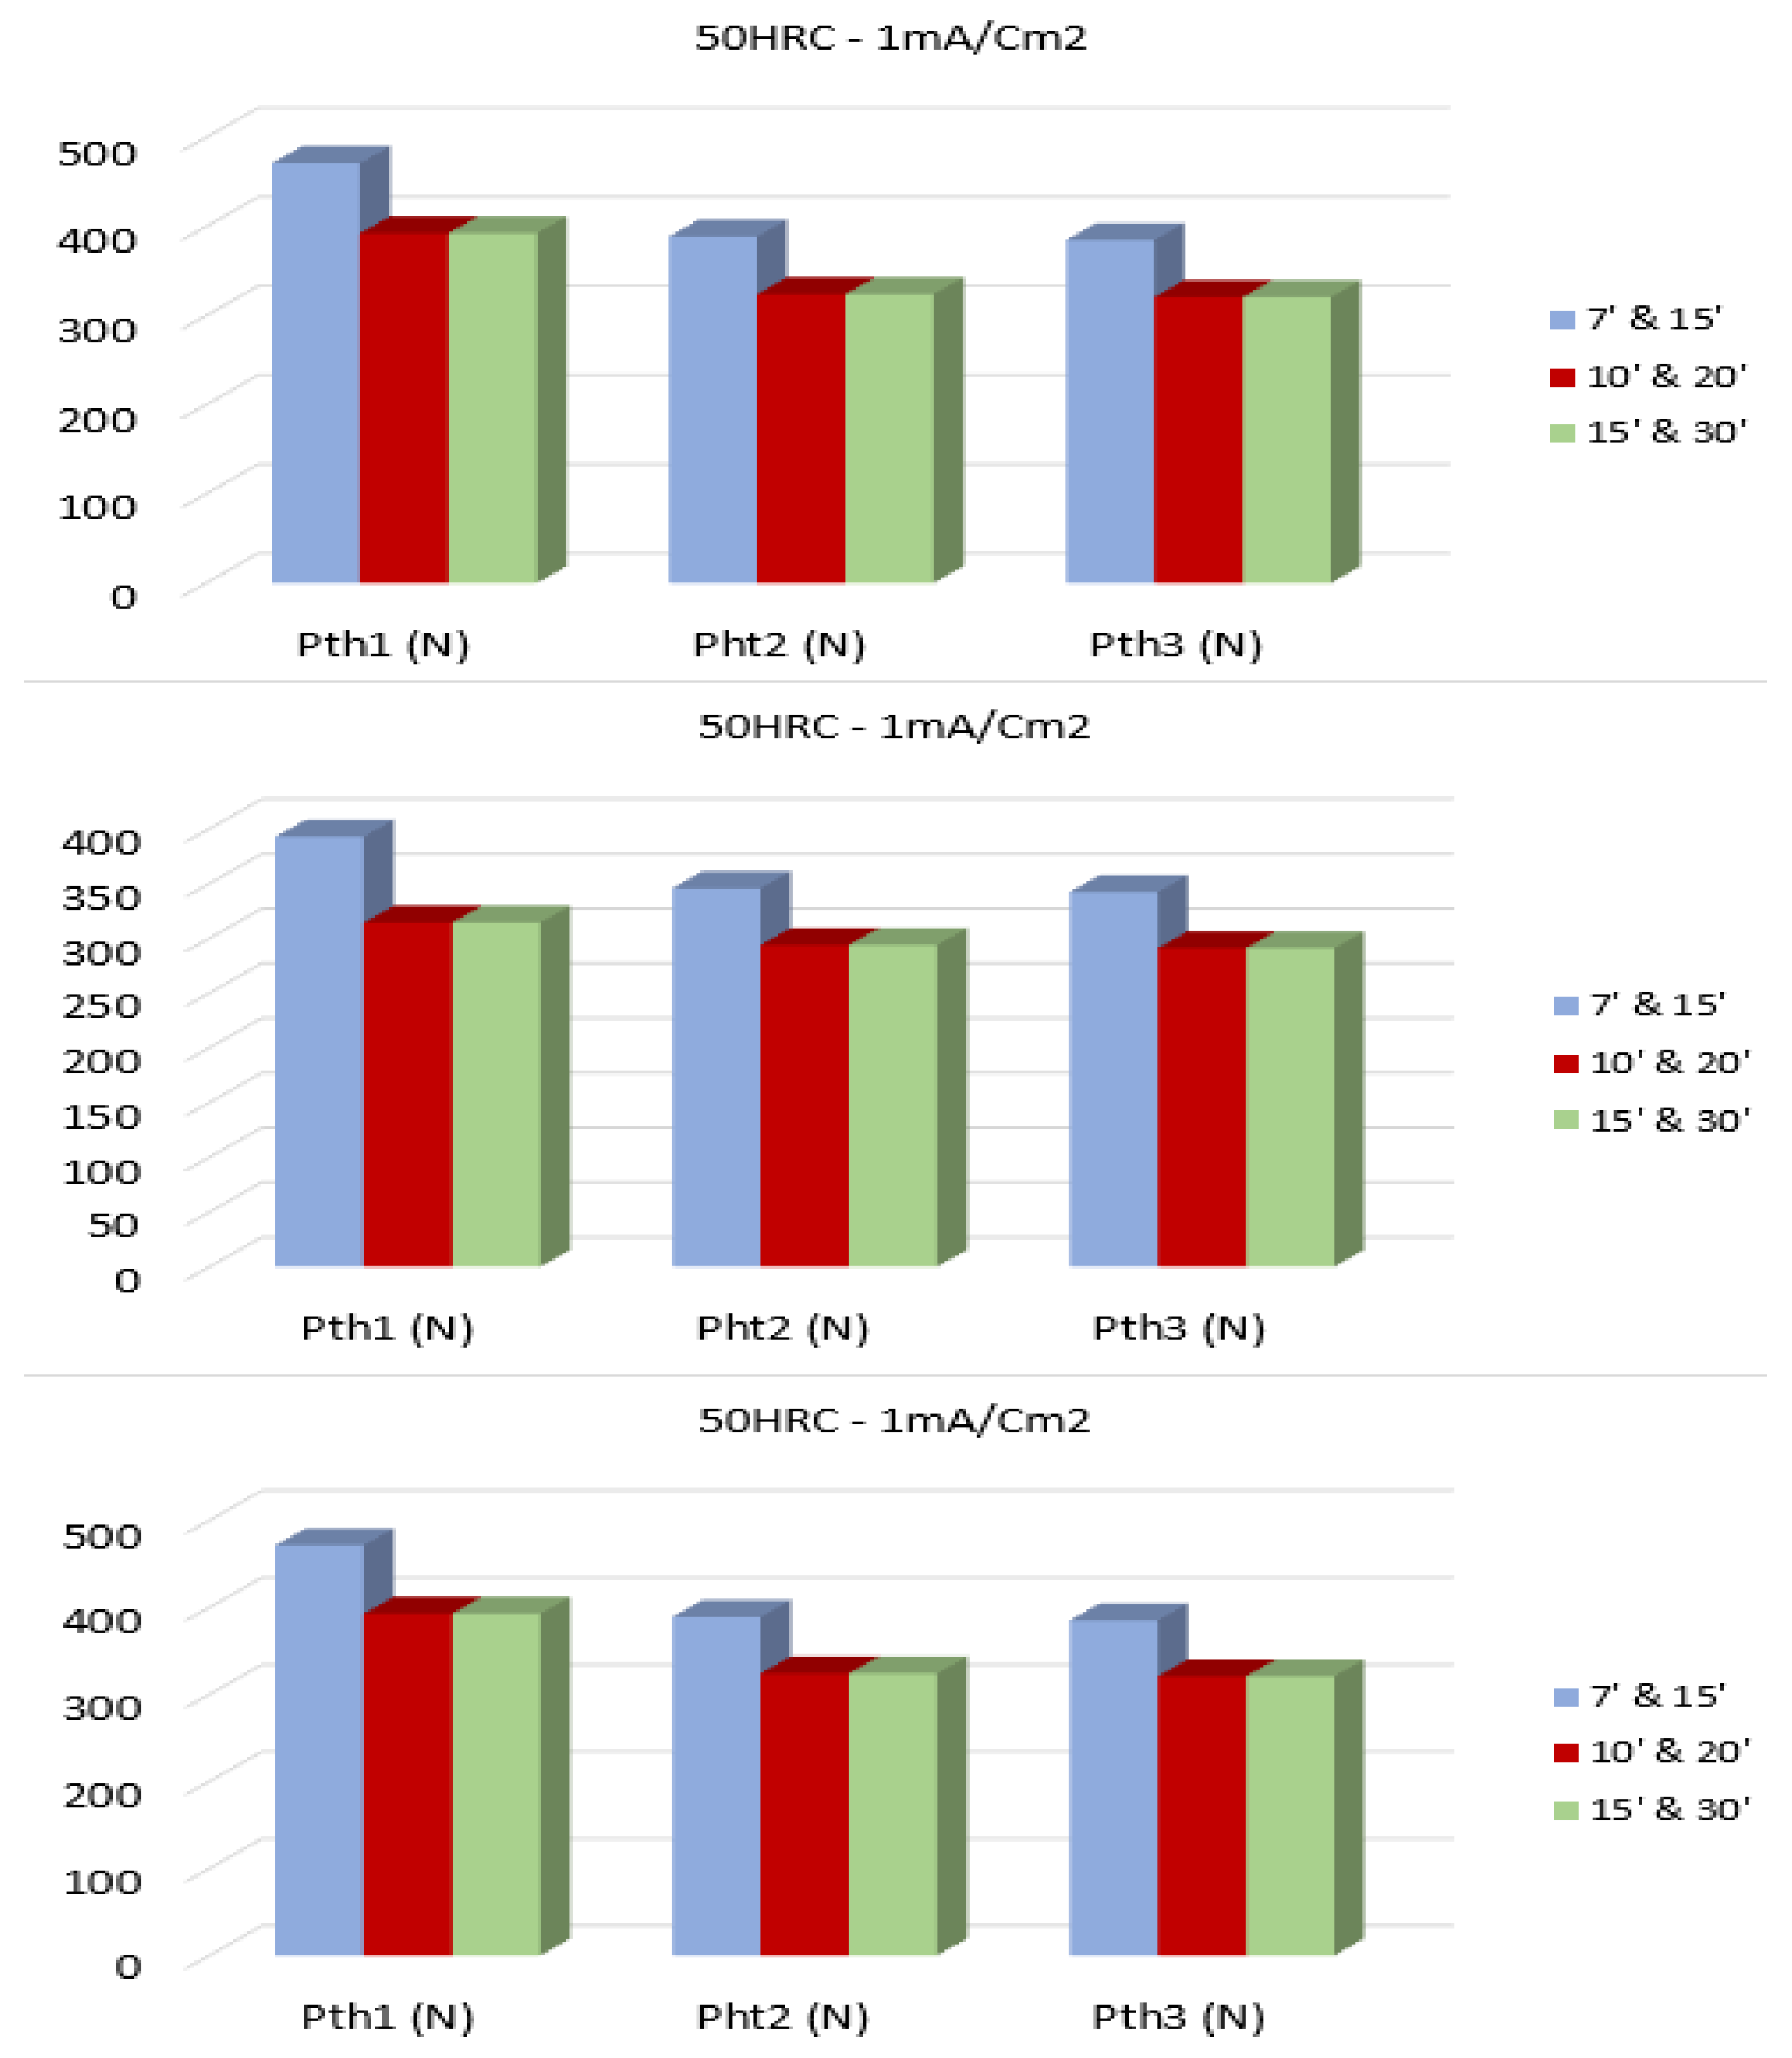
| Material and Environment | Steps Duration | PFFL-SPT (N) | Pth-1 (N) | Pth-2 (N) | Pth-3 (N) | Difference |
|---|---|---|---|---|---|---|
| 50 HRC 1 mA/cm2 | 7′–15′ | 1428 | 471 | 389 | 385 | +22% |
| 10′–20′ | 1428 | 471 | 324 | 321 | - | |
| 15′–30′ | 1428 | 471 | 324 | 321 | 0% | |
| 50 HRC 5 mA/cm2 | 7′–15′ | 1428 | 393 | 346 | 342 | +18% |
| 10′–20′ | 1428 | 314 | 294 | 291 | - | |
| 15′–30′ | 1428 | 314 | 294 | 291 | 0% | |
| 50 HRC 10 mA/cm2 | 7′–15′ | 1428 | 393 | 302 | 299 | +18% |
| 10′–20′ | 1428 | 314 | 259 | 257 | - | |
| 15′–30′ | 1428 | 314 | 259 | 257 | 0% |
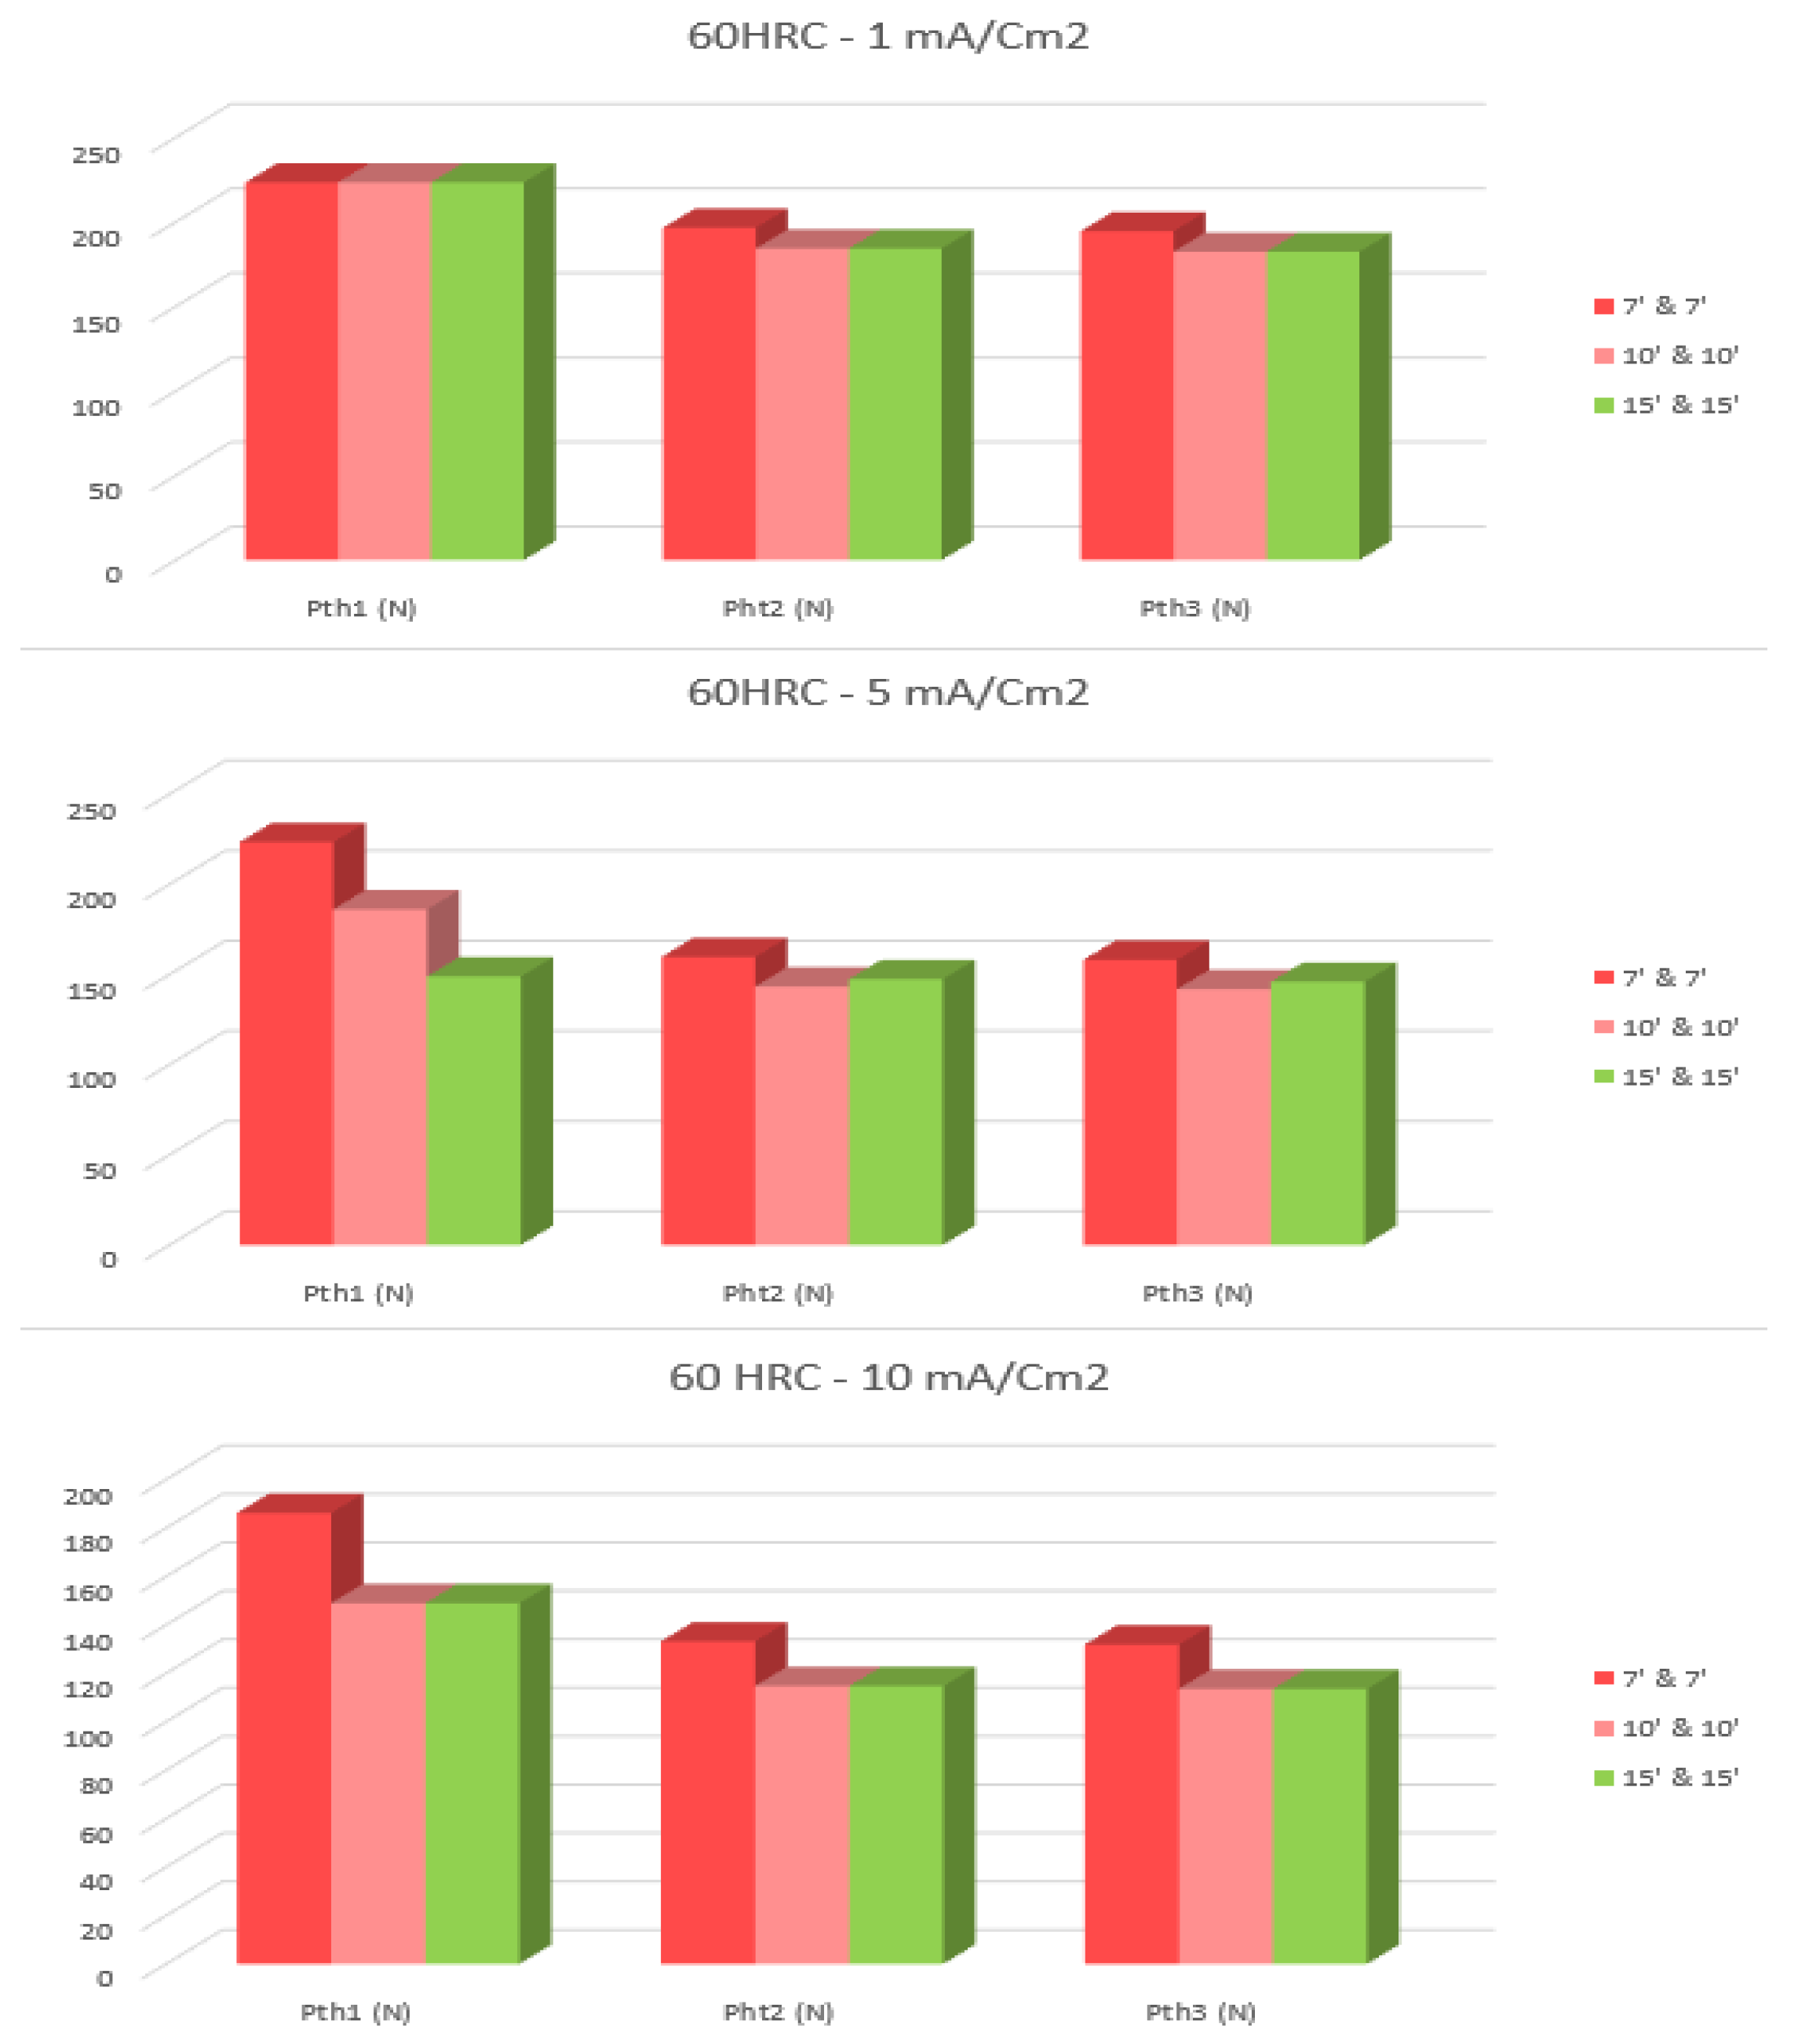
| Material and Environment | Steps Duration | PFFL-SPT (N) | Pth-1 (N) | Pth-2 (N) | Pth-3 (N) | Difference |
|---|---|---|---|---|---|---|
| 60 HRC 1 mA/cm2 | 7′ | 677 | 223 | 197 | 195 | +7% |
| 10′ | 677 | 223 | 184 | 182 | - | |
| 15′ | 677 | 223 | 184 | 182 | 0% | |
| 60 HRC 5 mA/cm2 | 7′ | 677 | 223 | 160 | 158 | +8% |
| 10′ | 677 | 186 | 143 | 142 | - | |
| 15′ | 677 | 149 | 147 | 146 | +3% | |
| 60 HRC 10 mA/cm2 | 7′ | 677 | 186 | 133 | 132 | +16% |
| 10′ | 677 | 149 | 115 | 114 | - | |
| 15′ | 677 | 149 | 115 | 114 | 0% |
| Hardness | Step | Step Load | Step Time (min) |
|---|---|---|---|
| 33 ≤ HRC < 45 | 1–10 | 5% of PFFS-SPT | 20 |
| 11–20 | 40 | ||
| 45 ≤ HRC < 55 | 1–10 | 5% of PFFS-SPT | 10 |
| 11–20 | 20 | ||
| HRC ≥ 55 | 1–20 | 5% of PFFS-SPT | 10 |
Disclaimer/Publisher’s Note: The statements, opinions and data contained in all publications are solely those of the individual author(s) and contributor(s) and not of MDPI and/or the editor(s). MDPI and/or the editor(s) disclaim responsibility for any injury to people or property resulting from any ideas, methods, instructions or products referred to in the content. |
© 2024 by the authors. Licensee MDPI, Basel, Switzerland. This article is an open access article distributed under the terms and conditions of the Creative Commons Attribution (CC BY) license (https://creativecommons.org/licenses/by/4.0/).
Share and Cite
Andrea, L.; Arroyo, B.; Álvarez, J.A.; Gutiérrez-Solana, F.; Cicero, S.; Guilbert, E. Optimization of Step Times for ASTM F1624 Methodology Applied to Small Punch Tests in Aggressive Environments. Metals 2024, 14, 863. https://doi.org/10.3390/met14080863
Andrea L, Arroyo B, Álvarez JA, Gutiérrez-Solana F, Cicero S, Guilbert E. Optimization of Step Times for ASTM F1624 Methodology Applied to Small Punch Tests in Aggressive Environments. Metals. 2024; 14(8):863. https://doi.org/10.3390/met14080863
Chicago/Turabian StyleAndrea, Laura, Borja Arroyo, Jose Alberto Álvarez, Federico Gutiérrez-Solana, Sergio Cicero, and Elise Guilbert. 2024. "Optimization of Step Times for ASTM F1624 Methodology Applied to Small Punch Tests in Aggressive Environments" Metals 14, no. 8: 863. https://doi.org/10.3390/met14080863