Article

Ultrafine Grain 316L Stainless Steel Manufactured by Ball Milling and Spark Plasma Sintering: Consequences on the Corrosion Resistance in Chloride Media

1
Laboratoire de Cristallographie et Sciences des Matériaux, University of Caen Normandie, Normandie Université, CNRS, 6 Bd Maréchal Juin, 14000 Caen, France
2
Laboratoire Génie de Production, Université de Technologie de Tarbes Occitanie Pyrénées, Université de Toulouse, avenue d’Azereix, 65000 Tarbes, France
3
CRMC, Industeel, 56 rue Clémenceau, 71202 Le Creusot, France
4
ENSICAEN, 6 Bd Maréchal Juin, 14050 Caen, France
*
Author to whom correspondence should be addressed.
Metals 2024, 14(8), 864; https://doi.org/10.3390/met14080864 (registering DOI)
Submission received: 24 June 2024 / Revised: 23 July 2024 / Accepted: 25 July 2024 / Published: 27 July 2024

Abstract

:
This paper reports experimental results concerning the corrosion of 316L austenitic stainless steels produced by ball milling and spark plasma sintering in NaCl electrolyte. Specimens with grain sizes ranging from 0.3 µm to 3 µm, without crystallographic texture, were obtained and compared with a cast that is 110 µm in grain size and an annealed reference. The potentiodynamic experiments showed that the reduction in grain size leads to a degradation of the electrochemical passivation behavior. This detrimental effect can be overcome by appropriate passivation in a HNO3 concentrated solution before consolidation. The Mott–Schottky measurements showed that the semiconducting properties of the passive layer do not vary significantly on the grain size, especially the donor density, which is responsible for the chemical passivation breakdown by chloride anions. The total electrical resistance of the layer, measured by impedance spectroscopy is always lower than the one of a cast and annealed 316L, but it slightly increases with a reduction in grain size in the ultrafine grain range. This is followed by a slight increase in the thickness of the oxide layer. The effect of chloride ions is very pronounced in terms of passivation breakdown if the powder is not passivated prior to sintering. This leads to the nucleation and growth of subsurface main pits and the formation of secondary satellite pits, especially for the smallest grain sizes. Passivation of the 316L powder before sintering has been found to be an effective way to prevent this phenomenon.

1. Introduction

Stainless steels are very well-known alloys in which a certain amount of chromium (more than 11% in weight) is added to ordinary steels to improve corrosion resistance. Adding chromium to traditional steels also improves other properties, such as mechanical properties or surface characteristics, making them suitable for a wide range of applications. Within the family of stainless steels, AISI 316L exhibits attractive mechanical properties, as well as good formability and weldability, making it a good candidate for industrial applications in aggressive environments (nuclear [1], biomedical [2], marine [3], and petrochemical [4]). An austenitic structure generally ensures good corrosion resistance and helps us avoid microscopic galvanic corrosion products between residual martensite and austenite [5]. However, this austenitic microstructure, without strengthening components such as residual martensite, leads to suboptimal mechanical properties, which can be detrimental for some applications [6].
Reducing the grain size of fully austenitic 316L is one strategy for increasing the yield stress, but this is often accompanied by a decrease in ductility [7,8] due to the use of severe plastic deformation processes [9]. An alternative is to produce these alloys by powder metallurgy [10]. In this case, the materials are consolidated by solid-state sintering at a low temperature and pressure. However, mechanical and corrosion properties can be limited by the inherent porosity when compared to their wrought and cast counterparts. By using higher sintering temperatures [11] and controlling the sintering atmosphere [12], it has been found that the density of the material can be increased, resulting in improved properties. Manipulating the powder morphology and using flash-sintering techniques such as Spark Plasma Sintering (SPS) [13] are also efficient ways to control the porosity and to adjust the final properties of structural parts. This can be achieved by mechanical milling of the powder prior to consolidation [14]. The elaboration of Ultra-Fine Grain (UFG) specimens [15] with an average grain size from 0.1 µm to 1 µm, typically, can also be obtained in this way. The relative densities of alloys obtained by ball milling and SPS are typically between 90% and 99% [16,17], higher than those of conventional sintered parts. The difference in density is mainly due to the presence of porosity but also oxides resulting from the oxygen contamination during powder milling [18].
In previous works [19,20], it was shown by the authors that the mechanical properties of 316L stainless steel can be tuned in terms of strength and ductility by powder metallurgy, using ball milling and SPS. High-density fully austenitic and UFG samples can be produced by this method, with densities in the range of 93–99.6%. A higher yield stress was obtained compared to a traditional cast and annealed alloy, combined with a remarkable ductility, especially when bimodal powders were used [21,22]. In addition, SPS samples with a micrometric grain size exhibit an equivalent corrosion resistance in NaCl electrolyte compared to the traditional alloy [20]. The low density of porosity prevented the development of pitting mechanisms, as reported for conventionally sintered stainless steels [23].
Moreover, in a recent work [24], an improvement in the electrochemical passivity for the smallest grain sizes in neutral nonaggressive Na2SO4 electrolyte was characterized. In particular, the effect of pre-passivation of the ball-milled powder prior to sintering was clearly demonstrated. In order to provide a clear overview of the corrosion resistance of the promising UFG 316L manufactured by SPS, this paper is dedicated to the influence of a chloride environment, which is known to deeply affect the integrity of this material. Potentiodynamic experiments in NaCl electrolytes were carried out to analyze the overall corrosion behavior. The physical characteristics of the passive layer were studied using an impedance spectroscopy analysis. The effect of grain size and grain-boundary nature on the stability of the passive layer in chloride media is discussed in this paper, supported by microstructural observations of the pitted surfaces after the potentiodynamic experiments.

2. Experimental Details

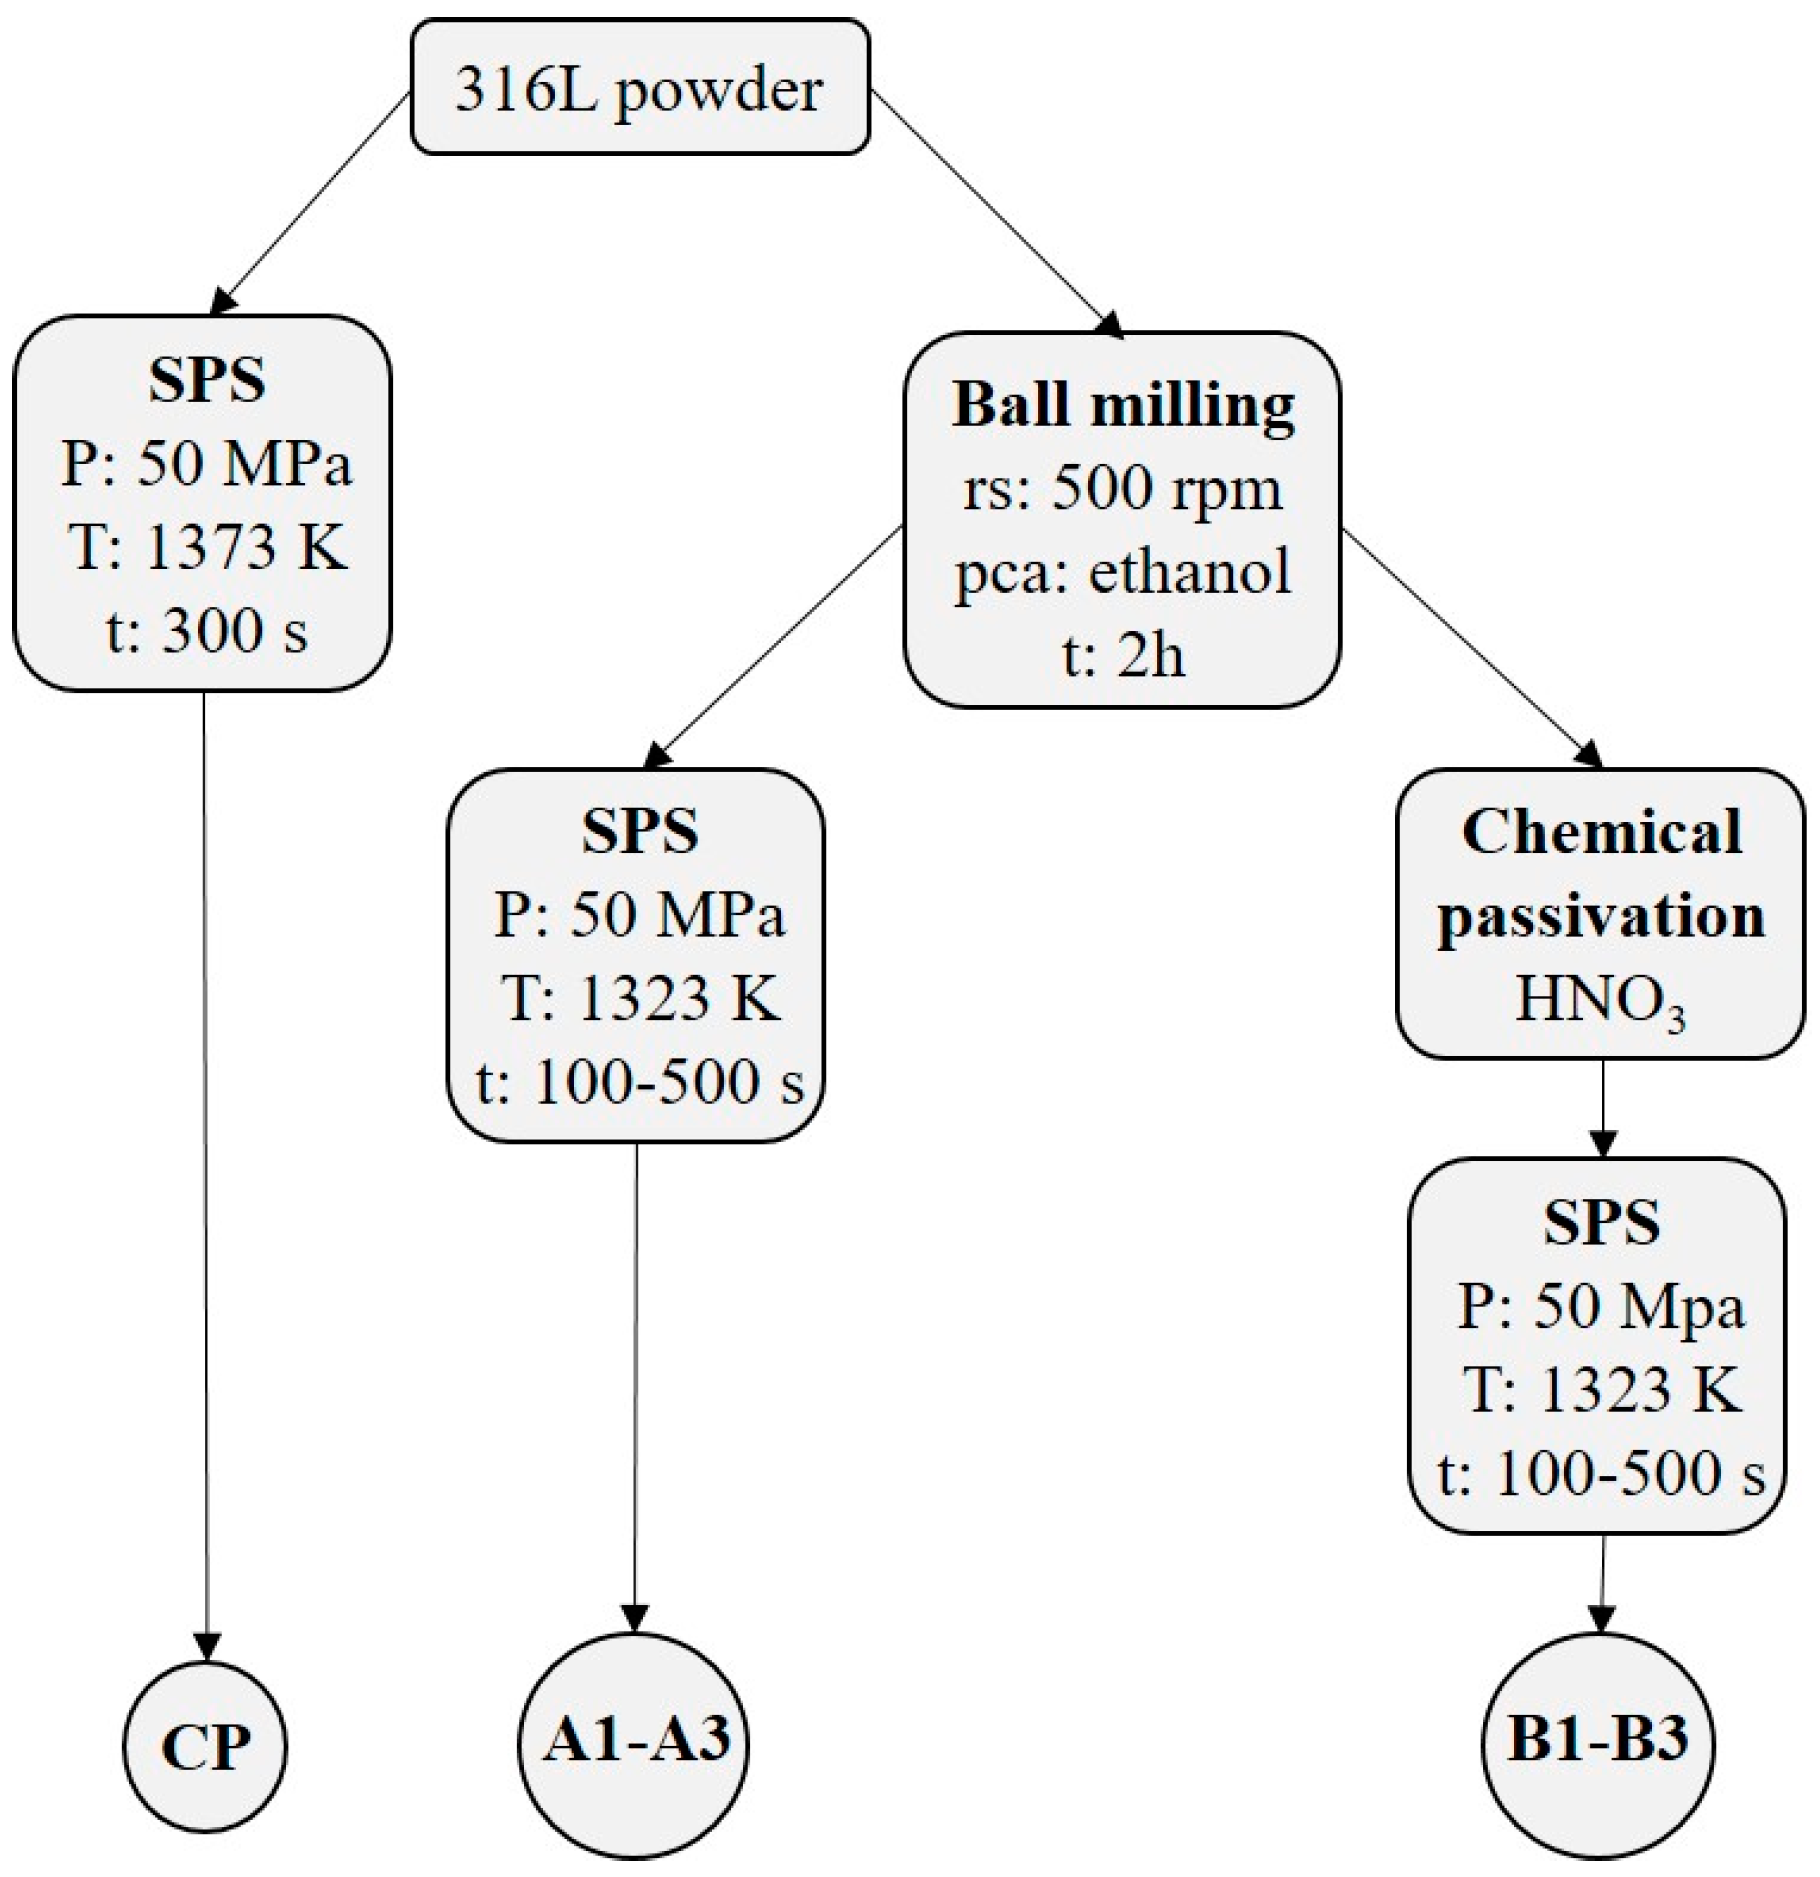
2.1. Sintering Elaboration and Microstructure Observations

316L stainless steel samples were elaborated by spark plasma sintering using a precursor commercial atomized powder. The methodology and main experimental parameters are displayed in Figure 1. The first series was sintered by SPS (FCT System GmbH, HD25 SPS apparatus, Effelder-Rauenstein, Germany), using the as-received commercial powder (CP samples). Based on our previous investigations, optimal sintering conditions (pressure, temperature, and dwell time) were employed [20], leading to relative densities higher than 99%, and an average grain size of 2–3 µm.
Ball milling (Fritsh planetary pulverisette 7, Idar-Oberstein, Germany) of the as-received powder was carried out before sintering to decrease the final grain size, following a methodology previously optimized [19]. Using this previous work, a second series were built (A1, A2, and A3), with grain size ranging from 0.4 µm to 1 µm and a relative density of about 95%.
A third series of samples, called B1, B2, and B3, were considered in this work, consisting of immerging and then ball-milled powder in a HNO3 acid solution before SPS consolidation [25]. Finally, a cast and annealed (CA) alloy, 110 µm in grain size, was also used for comparison.
Densities were obtained by a traditional Archimedes method, and the microstructure was studied by Electron Back-Scattered Diffraction (EBSD) and Scanning Electron Microscopy (SEM). The EBSD acquisition system used was a QUANTAX EBSD (Bruker, Berlin, Germany) mounted on a Zeiss Supra 55 (Jena, Germany). Observations of the corroded surfaces after electrochemical experiments were performed by light microscopy and laser confocal microscopy. Pitting observations were performed after potentiodynamic polarization experiments, which were stopped at a current density of 10−1 mA/cm2 in the anodic region.

2.2. Electrochemical Experiments

Potentiodynamic polarization, J(E), curves (J, current density; and E, potential) were obtained using a three-electrode electrochemical cell and a potentiostat workstation (SP-300 Biologic, Grenoble, France). The potential reference electrode was a Ag/AgCl one, saturated with AgCl-KCl electrolyte. A platinum grid was employed as a counter electrode. Five experiments were performed for each condition to confirm the good repeatability of the results. The tests were carried out in aerated NaCl 0.85 M (3 wt.%) at room temperature. Prior to all experiments, the working electrode surface was mechanically polished, and then a cathodic reduction was applied to reduce surface oxides. Samples were immerged in NaCl in open-circuit conditions for 1 h, and then a potentiodynamic test was performed with a voltage rate of 0.22 mV/s.
Electrochemical Impedance Spectroscopy (EIS) and Mott–Schottky (MS) were performed in open-circuit conditions to obtain information on the electrical and semiconducting properties of the passive layer. For EIS, 10 mV in potential amplitude was imposed, with the frequency decreasing from 10 kHz up to 1 mHz. Capacitance experiments were conducted to obtain MS graphs. They were carried out at 1 kHz and 10 mV in potential amplitude, from open-circuit potential to −1 V/Ag-AgCl. As for the potentiodynamic tests, five experiments were carried out for each configuration.

3. Results and Discussion

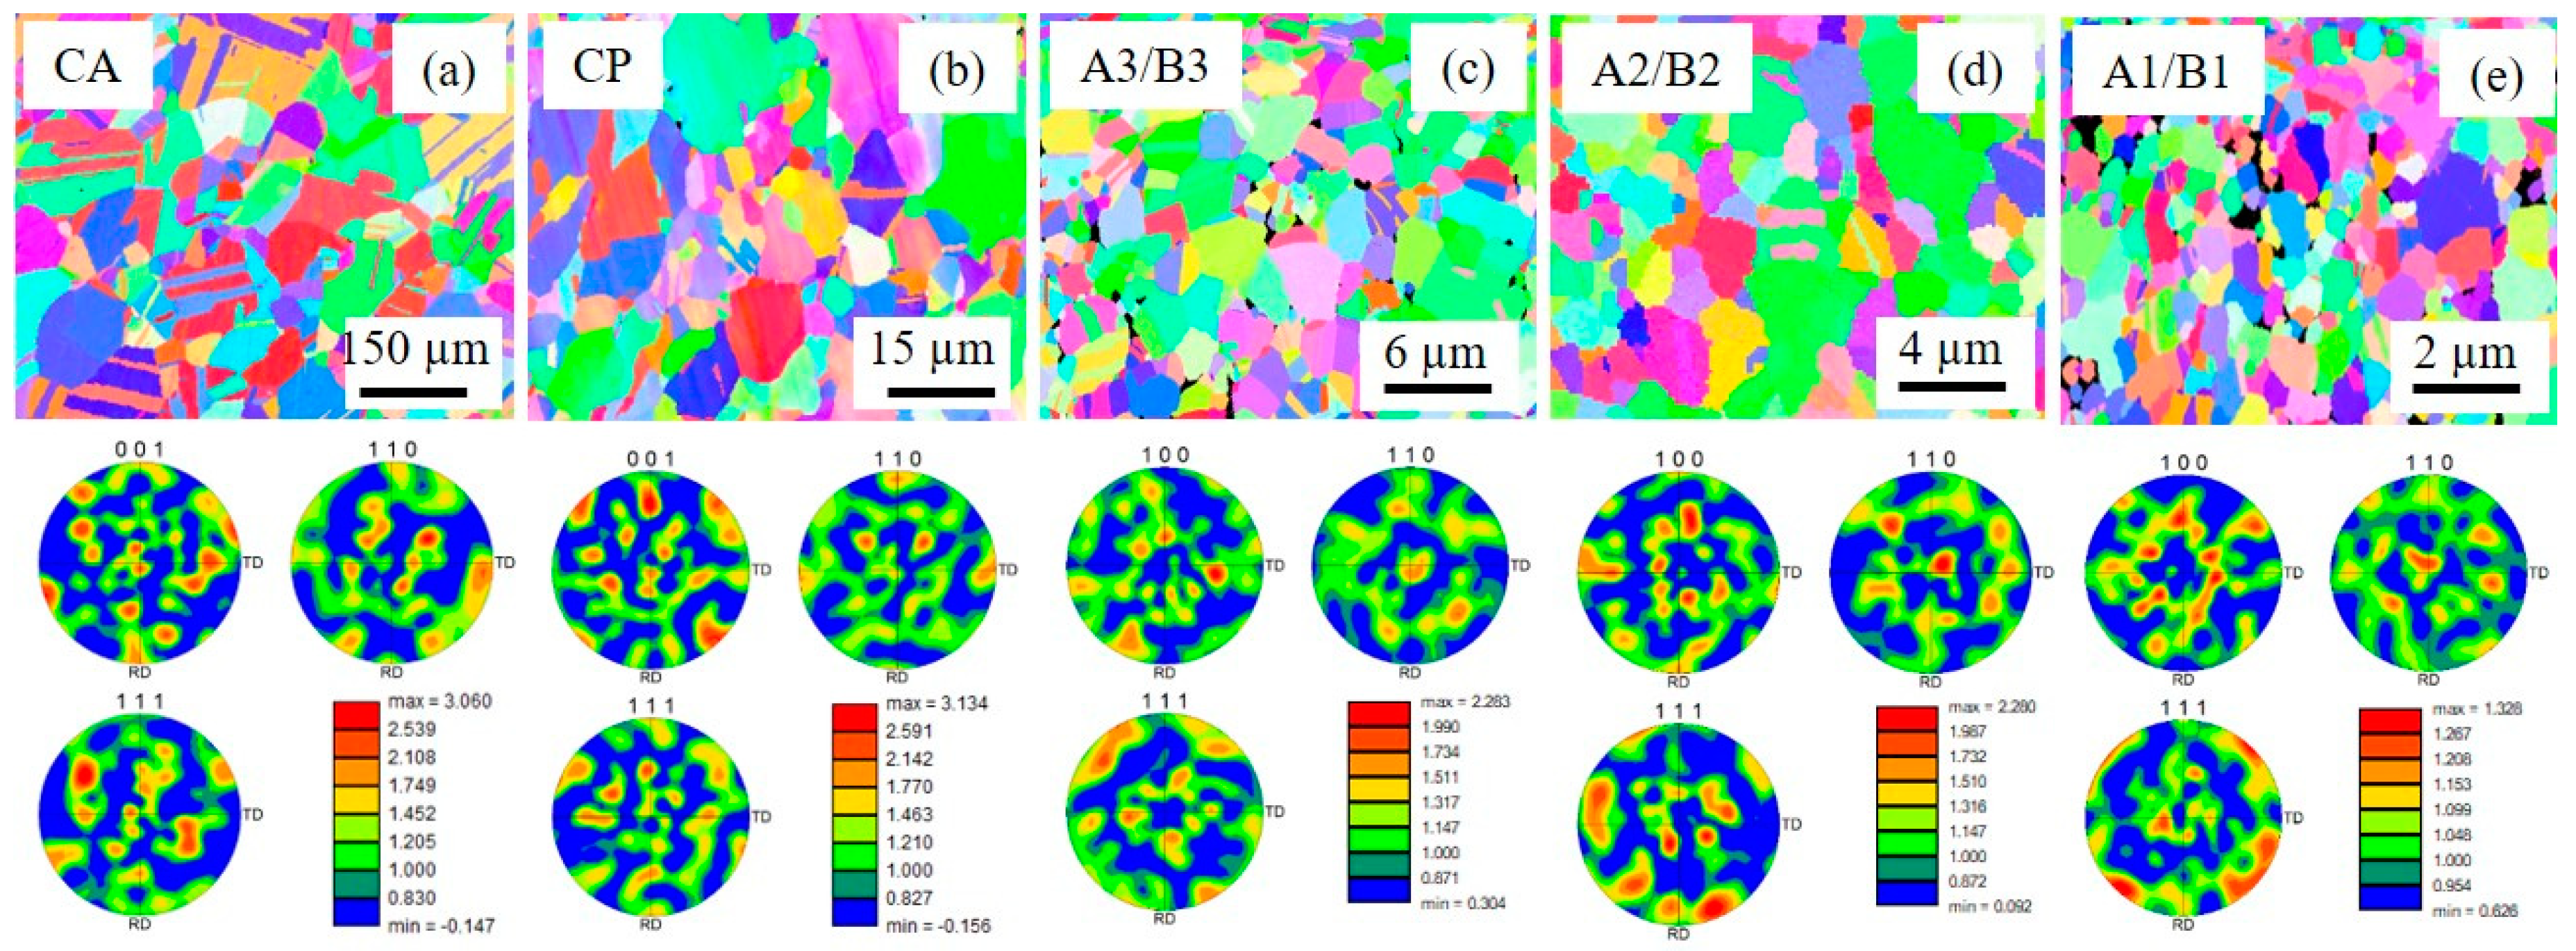
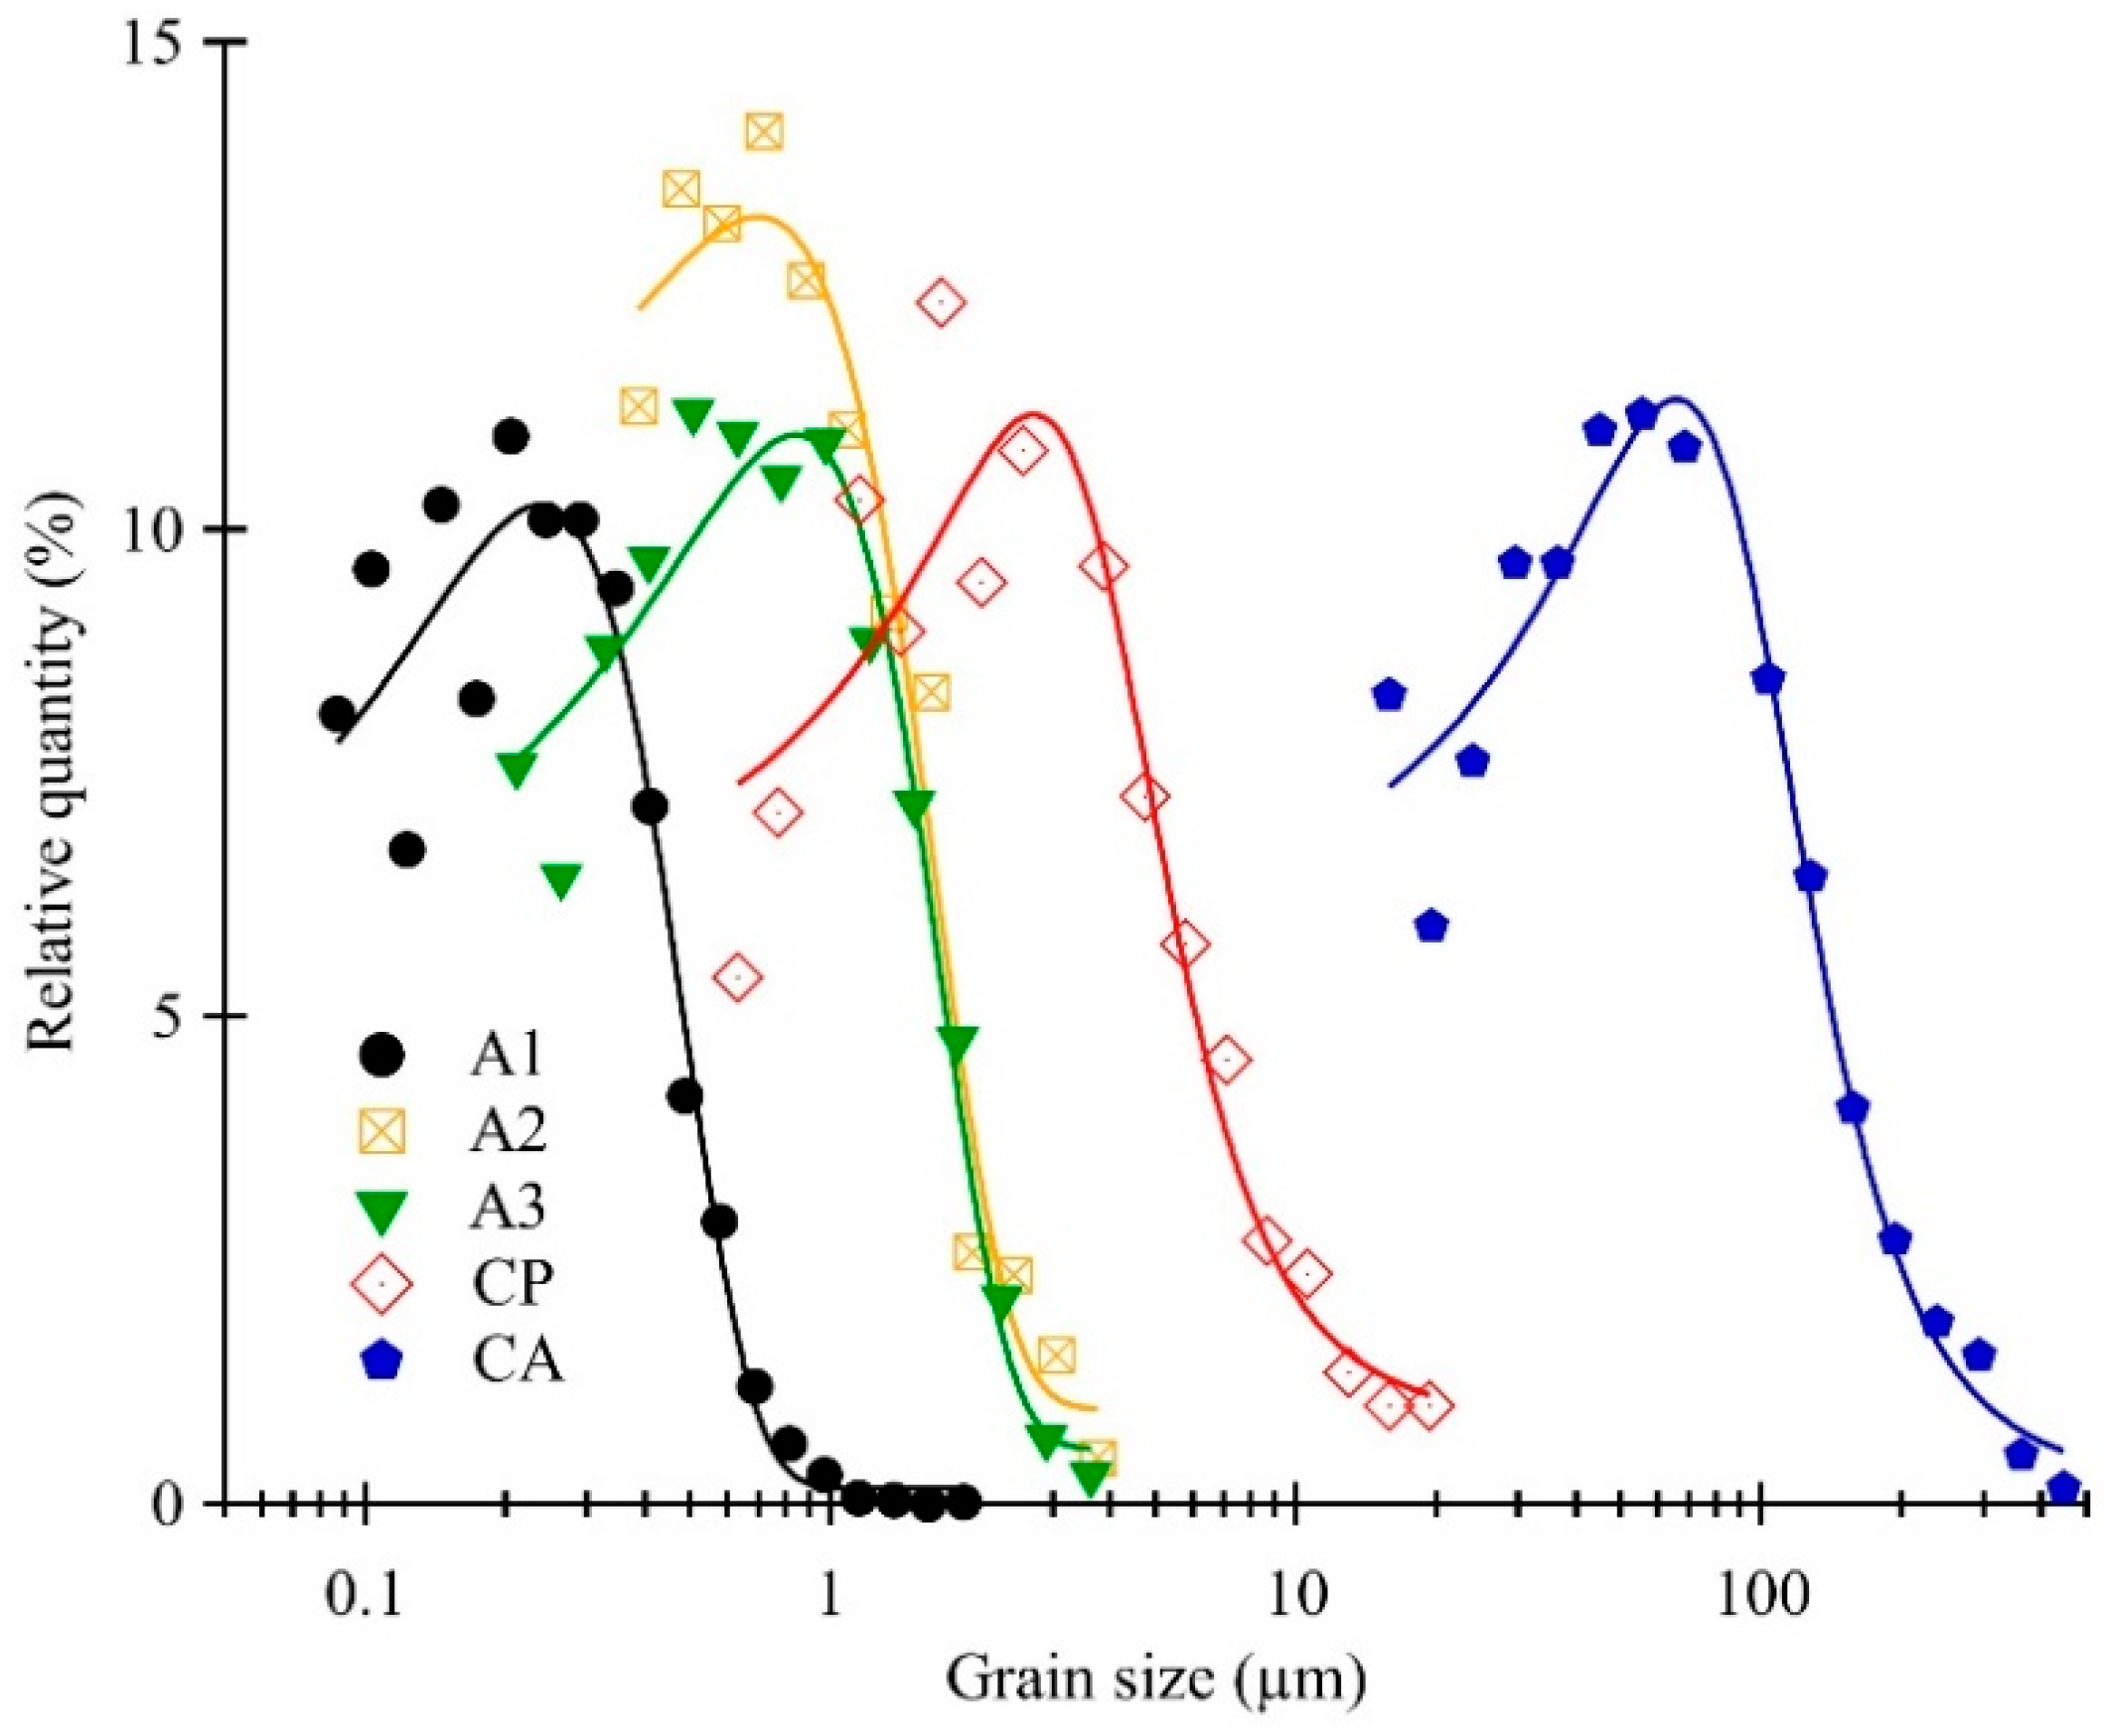
3.1. Brief Microstructural Overview of the Samples

Details concerning microstructural features of the samples manufactured by ball milling and SPS are given in previous publications [19,20,22,24], and are only briefly reviewed here. Typical microstructures analyzed by EBSD are displayed in Figure 2, whereas Table 1 summarizes a few microstructural characteristics of the alloys.
The combination of ball milling and SPS is an efficient way to reduce the grain size of 316L without residual stresses [20]. The main difference between the samples is the final grain size, which is distributed over three orders of magnitude, in the range [100 nm–100 µm] (Figure 3). B specimens exhibit the same density and the same grain sizes and LAGB/HAGB ratio as A samples.
The average density is higher than 95%, and no crystallographic texture is depicted, independently on the manufacturing conditions (maximum pole density always less than 5 MRD and no preferential orientations emerging on the pole figures). The slightly reduced density of specimens manufactured by ball milling is mainly due to the oxides and porosities present in a few of the sintered samples. The maximum oxide fraction is found to be around 10% [19]. The quantities of the low-angle grain boundary (LAGB) and Σ3 twin boundary fluctuate around 20%, without specific tendency. Finally, a fully austenitic phase is always present, without any presence of martensite (confirmed by XRD analysis, but not given in this publication for the sake of brevity).

3.2. Corrosion Behavior

Figure 4 shows examples of J(E) curves obtained for samples with different grain sizes. The impact of the passivation of the ball-milled powder before consolidation is clearly evidenced. Corrosion parameters extracted from J(E) curves are compiled in Table 2.
The impact of the powder preparation before SPS consolidation on the overall electrochemical behavior is very pronounced. A large passivity domain is depicted in CA samples, in a potential range of L = EpitEcor = 750 mV (Figure 4a), with Epit representing the pitting potential. CP samples exhibit a shorter and very instable passive potential plateau with the existence of numerous vertical peaks revealing metastable pit nucleation, followed by repassivation of the pits (Figure 4a). The passivation current density, Jpas, is also higher for CP than for the traditional CA specimen, suggesting the degradation of the corrosion resistance in the passive region of SPS samples directly consolidated with the commercial powder.
Pitting mechanisms due to chloride anions tend to strongly shorten the length of the passive layer for A-type UFG specimens, leading to a premature breakdown of the passivity. Epit decreases when the grain size decreases, and the passive plateau even vanishes for A samples (Figure 4b–d). The current density increases in the pseudo passive plateau, attributed to crevice corrosion mechanisms starting from open porosities [25]. A well-defined passive plateau is, however, again depicted for B samples in the figures, revealing the effect of pre-passivation of the ball-milled powder before SPS. Jpas is smaller for B samples than for CA cast ones, suggesting the presence of a more efficient oxide layer, even if Jpas slightly increases with a decrease in grain size. The pre-passivation of the powder also increases the stability of the passive layer for the smallest grain diameters (Figure 4d). Indeed, the length of the passivation plateau, L, is about 438 mV for B1 specimen (d = 400 nm), which is the best value obtained for SPS samples, and grossly half the one measured on cast and annealed samples (L = 750 mV in average). Hence, taken into account the large scattering of the values of Lp (see values in Table 2), due to the stochastic character of the pitting nucleation in stainless steels [26,27], the combination of ball milling and passivation of the powder is an efficient way to obtain 316L samples with improved corrosion resistance in a chloride environment, close and even slightly better than the one of cast and annealed material.

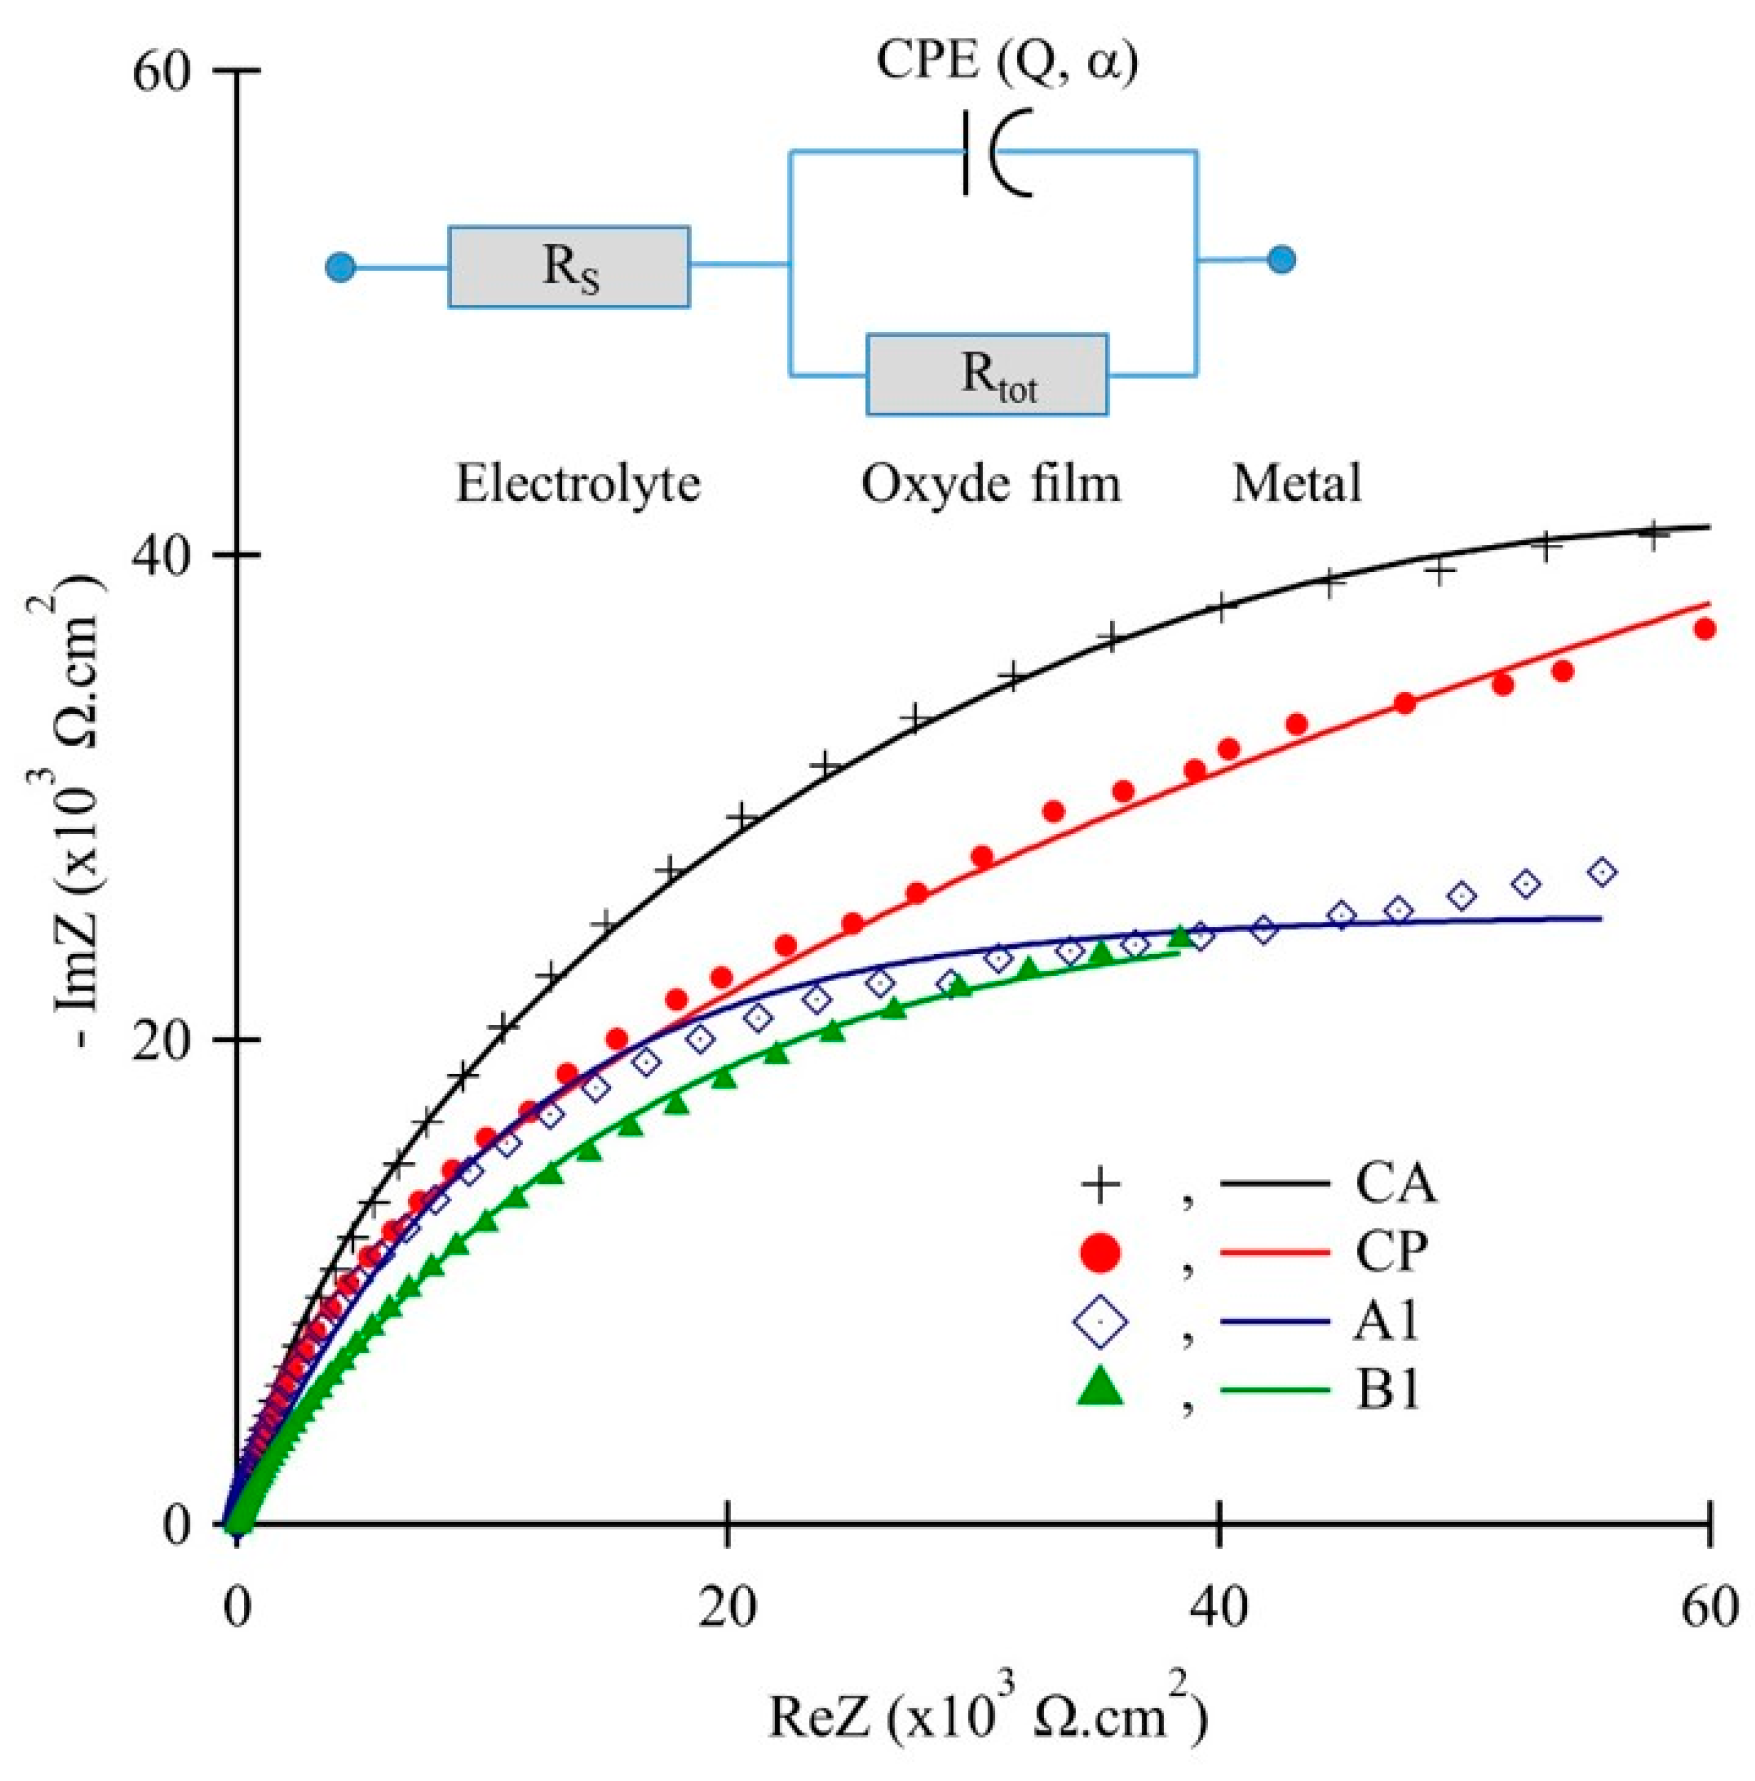
3.3. Electrical and Semiconducting Characteristics of the Surface Oxide

Typical Nyquist plots are displayed in Figure 5 for some representative samples. An open depressed capacitive loop is always evidenced independently on the elaboration conditions, with a higher radius of the loop representing a better corrosion resistance [28].
Samples obtained by powder metallurgy exhibit a capacitive loop with a diameter smaller than the one obtained for the cast and annealed stainless steel. Unlike the results obtained for Na2SO4 [24], the presence of chloride ions seems then to degrade the electrical properties of the oxide layer, and this effect is more pronounced for specimens sintered from ball-milled powders. No significant difference is, moreover, depicted between the A and B samples, independent of the final grain size.
Despite the double-layer character of the passive film on 316L surface [29,30,31], a simpler and sufficient model was adopted in this paper by considering the total resistive and capacitive answer of the oxide layer, as frequently used by other researchers [32,33,34]. The equivalent electrical circuit (inset in Figure 5) consists in the electrolyte resistance, Rs, and an (Rtot, CPE) element. The Rtot is the total polarization resistance of the interface. A Constant Phase Element (CPE) was chosen to represent the impedance of the oxide layer. The impedance of the CPE element is as follows:
Z C P E = 1 Q 2 π f j α
where f is the frequency, Q is the CPE, α is the capacitor coefficient, and j is the imaginary number.
The experimental results are well represented by this simple electrical model, as shown in Figure 5 by the solid lines, especially for frequencies higher than a few hundred Hertz, representative to the internal oxide layer. The model parameters, given the best fit for all the samples, are resumed in Table 3. α is almost constant for all samples, with an average value α = 0.89 ± 0.02; a value close to α = 1 is representative of a pure capacitive behavior. No clear tendency is observed concerning Q, which takes values between 15 µF·sα−1/cm2 and 30 µF·sα−1/cm2.
When using the single CPE model adopted in this work, an effective capacity, Ceff, of the surface layer can be estimated by using the following relation [32]:
C e f f = Q 1 α · R S R t o t R S + R t o t 1 α α Q 1 α · R S 1 α α
The approximation in the right part of Equation (2) is supported by the fact that Rtot >> Rs (see Table 3). Then, considering the oxide surface layer as an ideal plane capacitor, its thickness, δ, can be computed by using the following well-known formulae:
δ = 0 r C e f f
εr = 15.6 [35] is the relative dielectric constant of oxide film in 316L. ε0 = 8.85 × 10⁻¹⁴ F/cm is the vacuum permittivity. The values of Ceff and δ are reported in Table 3. δ is around a few nanometers, in accordance with previous results [32], and it does not vary with the grain size. However, the larger values (higher than 2 nm) are found for the cast and annealed sample, as well as for the smallest grain sizes. The CP, A3, and B3 specimens present the smallest oxide thickness, explaining, in part, that these samples are weakly resistant in corrosive NaCl electrolyte (Figure 3). Nanostructuration increases the oxide thickness when the smallest grain sizes are reached (A1 and B1 samples), given similar values to cast and annealed ones, independently of the chemical passivation step of the powder.
The polarization resistance, Rtot, sensitively depends on the grain size, d (Figure 6), following a linear relation with 1/d. The same evolution was reported in a Na2SO4 electrolyte [24]. However, it can be noted that B samples do not exhibit the same behavior as A samples. Rtot values are higher for B samples but tend toward the same values as those depicted in A samples for the smallest grain diameters.
The evolution of 1/C2 with E in the cathodic potential region is displayed in Figure 7 (Mott–Schottky (MS) plots). These diagrams display two linear stages delimited above by the flat band potential, EFB = −0.55 V/Ag-AgCl, not dependent on the elaboration conditions. The negative slope corresponds to a p-type semiconductor and the positive slope is related to a n-type oxide. A duplex oxide layer is therefore evidenced, with an inner Cr2O3 p-type layer and an outer Fe2O3 n-type oxide [33]. The two linear relationships between 1/C2 and E can be written as follows [29]:
1 C 2 = 2 0 r e N D E E F B k T e
1 C 2 = 2 0 r e N A E + E F B k T e
where ND is the charge carrier donor density, and NA is the charge carrier acceptor density. e = 1.6 × 10⁻¹⁹ C is the elementary electrical charge, k = 1.38 × 10⁻²³ J/K is the Boltzmann constant, and T = 293 K is the room temperature. kT/e ≈ 0.025 V and is negligible in the potential range of interest of Figure 7.
Table 4 sums up the representative values NA, ND, and EFB for each 316L specimen. A good agreement is found with the previous literature [30,35,36]. NA and ND are in the order of 1021 cm−3, representing highly doped semiconductors.
The total carrier density, N = NA + ND, strongly increases with the grain refinement, as displayed in the inset of Figure 7. The electron transfer through the oxide surface is then enhanced because the film is more defective. The stability of the oxide layer is less effective for the smallest grain sizes [37]. Indeed, Cl anions can be more easily transferred through the thickness of the oxide layer, filling the O2− vacancies, and this can ultimately cause the oxide layer to fracture.
Prepassivation of the powder has, however, a beneficial effect on this deleterious mechanism by increasing Rtot (Figure 6), and it slightly increases the oxide thickness, δ, when the grain size is reduced (Table 3). The overall passivation current density is then smaller for the B samples, than for the CA, CP, or A specimens (Figure 4). However, the pitting potential is always smaller for SPS samples, suggesting a greater instability of the passive layer. Prepassivation combined with nanostructuration enhances, however, the pitting resistance of SPS specimens. More detailed observations of pits are given in the next part of the paper in order to better understand the underlying pitting mechanisms.

3.4. Role of the Prepassivation of the Ball-Milled Powder to Prevent Pitting Mechanisms

In the presence of Cl anions, the passive film grown on surface samples becomes sensitive to chemically induced breakdown, leading to pitting mechanisms. Typical corroded surfaces and pitting behavior after potentiodynamic tests in NaCl electrolyte (Jmax = 10−1 mA/cm2) are displayed in Figure 8 for the A and B specimens.
Figure 8 shows that pitting is strongly correlated to the average grain diameter for A samples. A1 samples (d = 0.4 µm) exhibit a very important pit density, leading to a generalized corrosion of the exposed area (Figure 8a). A2 samples (d = 0.75 µm) are subjected to localized corrosion phenomena, with numerous pits on the exposed surface (Figure 8b), but a large part of the sample remains free of pits at this observation scale. Concerning the B1 and B2 samples (Figure 8c,d), obtained with the passivated powder, no pitting is depicted on the exposed area at this observation level. For these samples, the breakdown of passivity observed in potentiodynamic curves in Figure 4d is, therefore, mainly produced by the smallest pits, which are mainly nucleated on grain boundaries and porosities [38].
From a material-health point of view, the localized corrosion observed on A2 is more harmful than the almost-generalized corrosion observed on A1. Indeed, in the first case, where the attacked surface being smaller than the surface exposed to the electrolyte, the local current density is much greater than Jmax = 10−1 mA/cm2. Since the corrosion rate is directly proportional to J, due to Faraday’s law, A2 will crumble much faster than A1.
Looking in more detail at the geometric features of the pit in A2 specimens, we see that the ratio between the depth, Pmax, and the equivalent diameter, Deq, of some representative pits, in function of Deq, is displayed in Figure 9. Figure 10 also illustrates some examples of pits depicted in A2 surfaces after potentiodynamic tests. Large flat-bottomed main pits can be observed, with a Pmax/Deq ratio lower than one, corresponding to filled square points in Figure 9. Around these large pits, smaller satellite pits are also observed, distributed around the main pit mouth. The Pmax/Deq ratio for these satellites can be higher (empty red square, Figure 9) or lower than one (empty blue square, Figure 9), depending on their distribution around the principal pit.
Under specific electrochemical conditions, pits tend to grow under the free surface of stainless steels. This leads to a so-called lacy cover on the pits [39]. This cover hinders the diffusion of corrosive and aggressive species, trapped in the bottom of the pit. Repassivation of such a pit is therefore prevented, and the corrosion propagates below the outer free surface [40]. The holes are produced by metal dissolution inside the pit, beneath its rim, undermining the metal surface and finally emerging outside, through the free surface [41]. When such satellite emergence occurs, this feature leads to the local uplift of the free surface, as observed by confocal imaging (Figure 11).
This mechanism is also supported by statistical measurements on all pits on the A2 surface, performed after successive polishings P1, P2, …, P8, in order to access to a pseudo 3D cartography of the main pit and associated satellites (Figure 12). The average diameter of pits after polishing tends to increase up to a depth of about 40 µm, and then the diameter reaches a plateau and finally decreases for higher depths (Figure 12a). This is also illustrated in Figure 12b, which displays the successive height profiles of a given pit, and in Figure 12c, representing the iso-contour of a pit after successive polishings. Corrosion under the surface of the steel is evidenced both through these two examples and statistically for all the pits on the sample surface (Figure 12a), and it can be schematically drawn, as shown in Figure 12d.
Using HNO3 acid solution to passivate the ball-milled powder before SPS prevents this pitting growth mechanism, leaving the exposed surface to the NaCl electrolyte free from large pits (B samples, Figure 8c,d) and, therefore, making the material more resistant.

4. Conclusions

In this work, the corrosion resistance in the NaCl environment of UFG 316L steels produced by ball milling and SPS was studied. The main conclusions of this work are as follows:
-
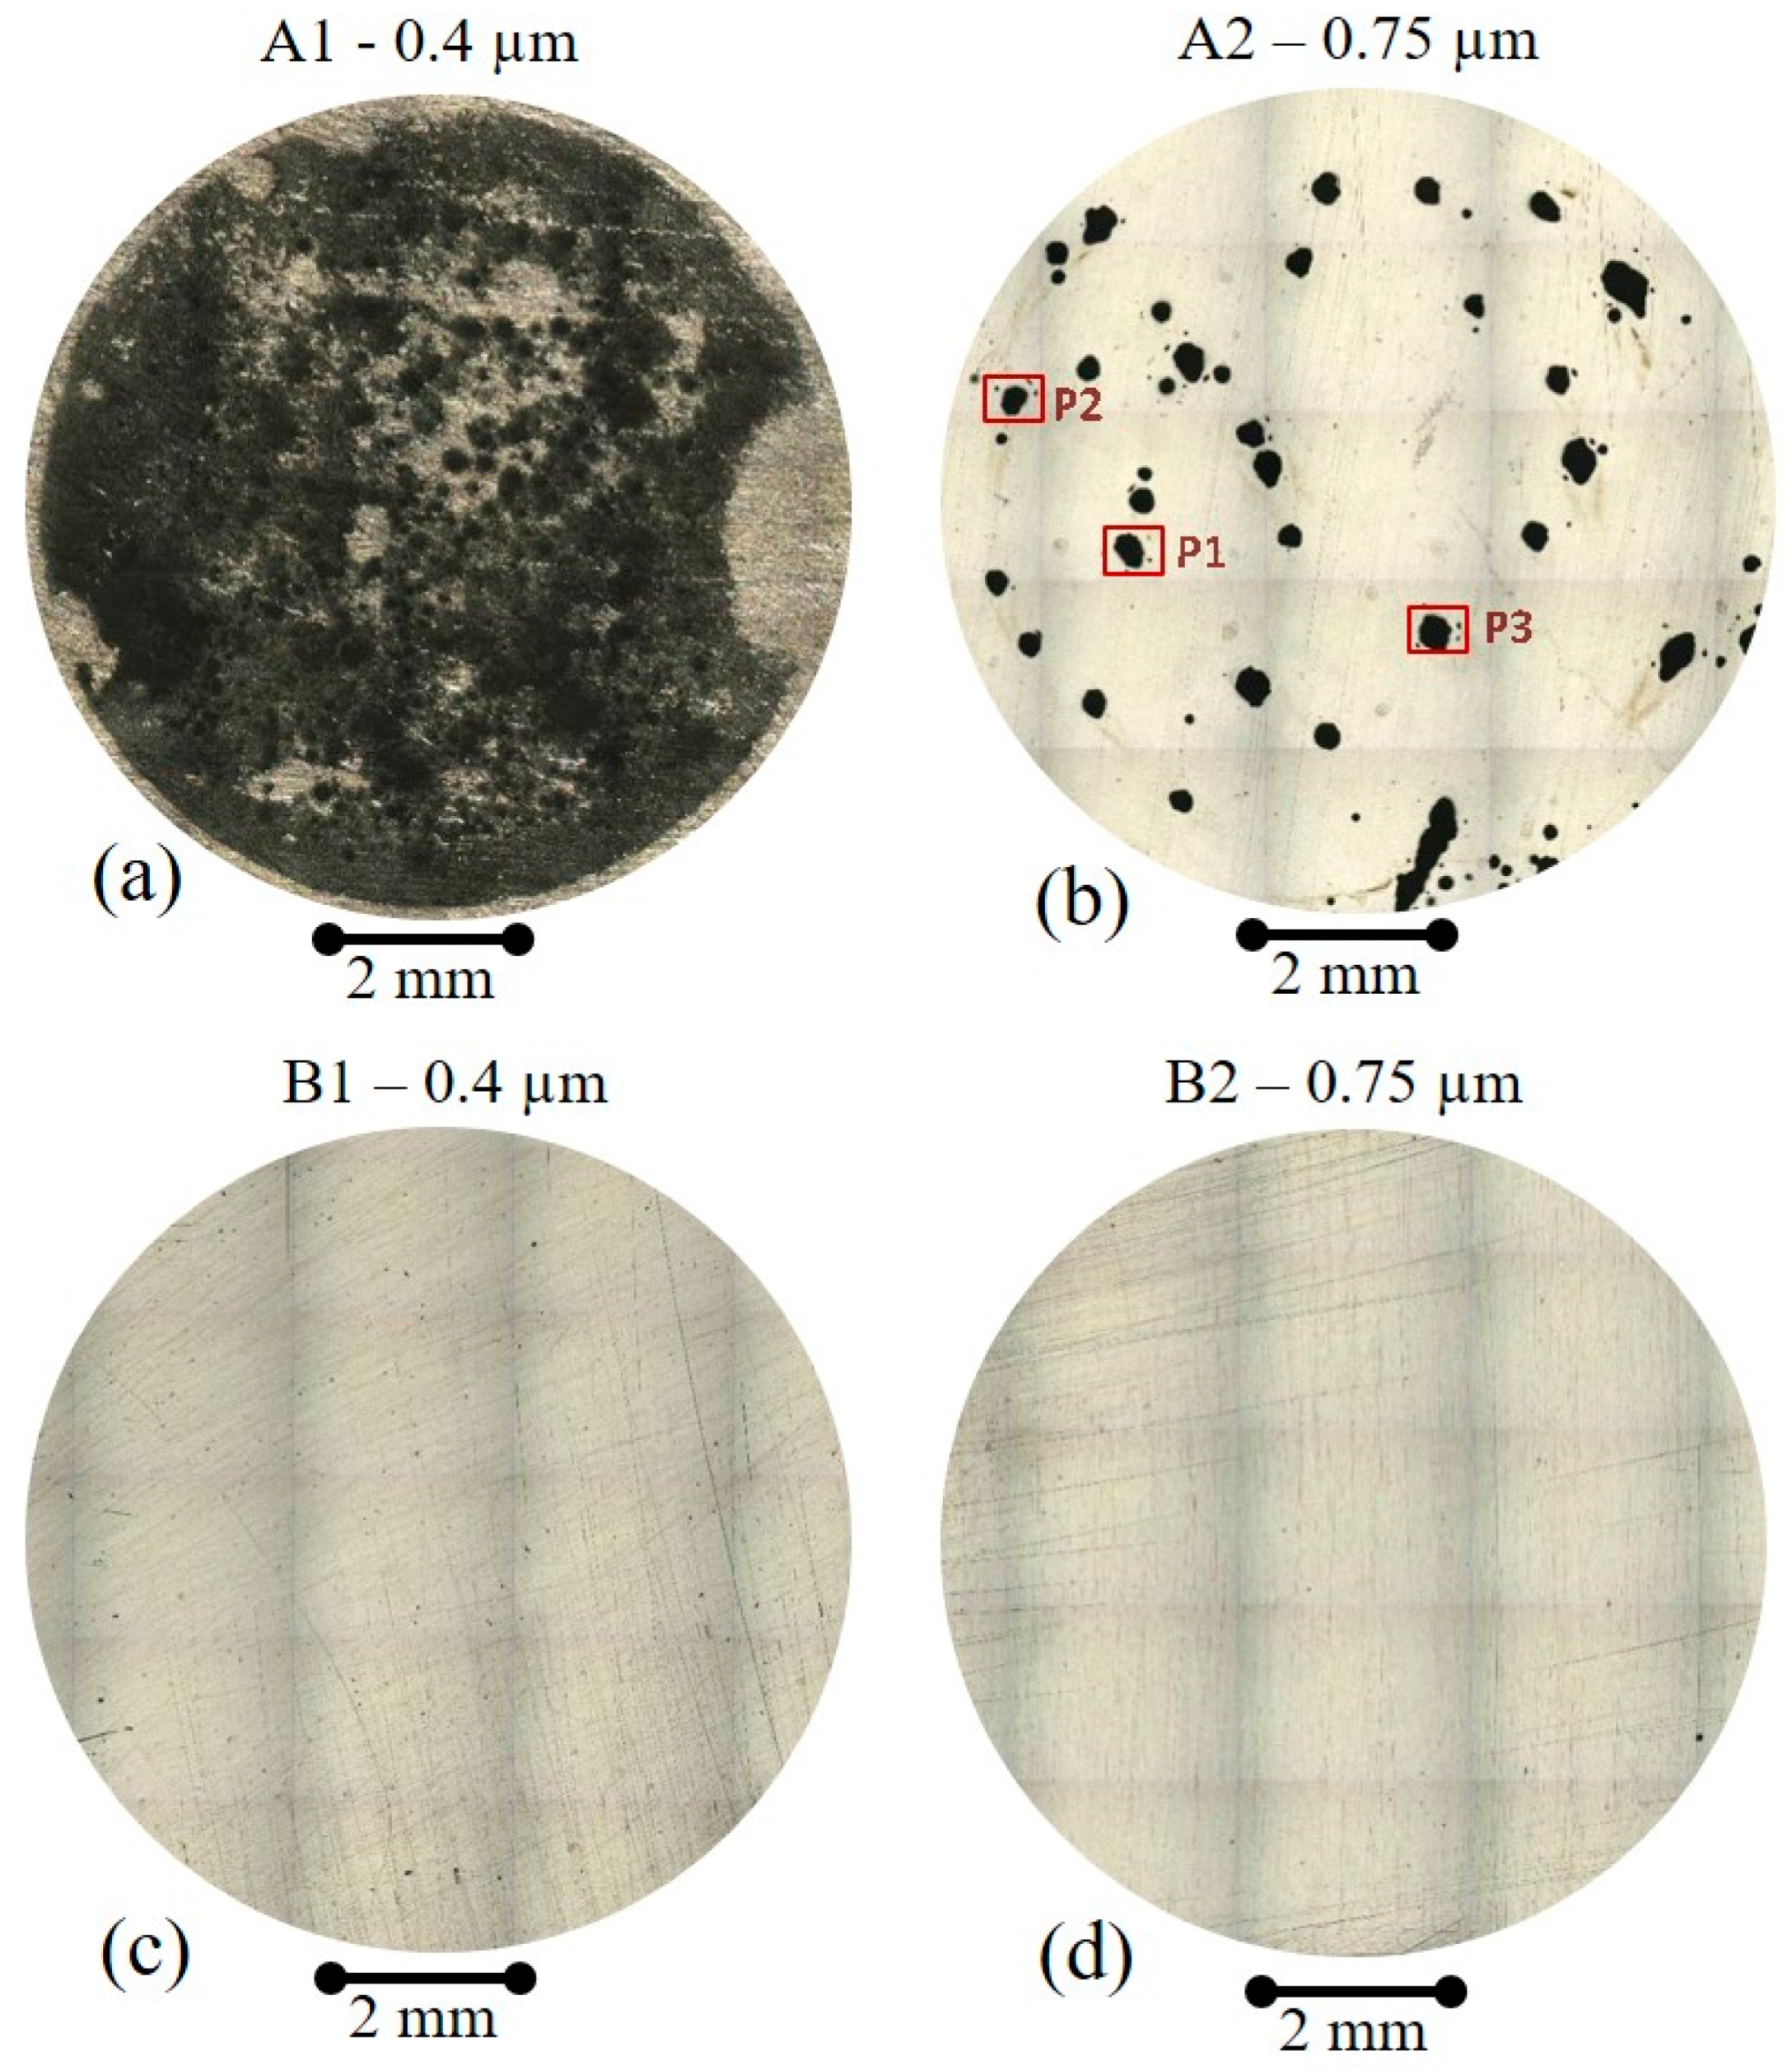
The passivity is improved when the powder is passivated in HNO3 prior to sintering, especially for the smallest grain sizes.
-
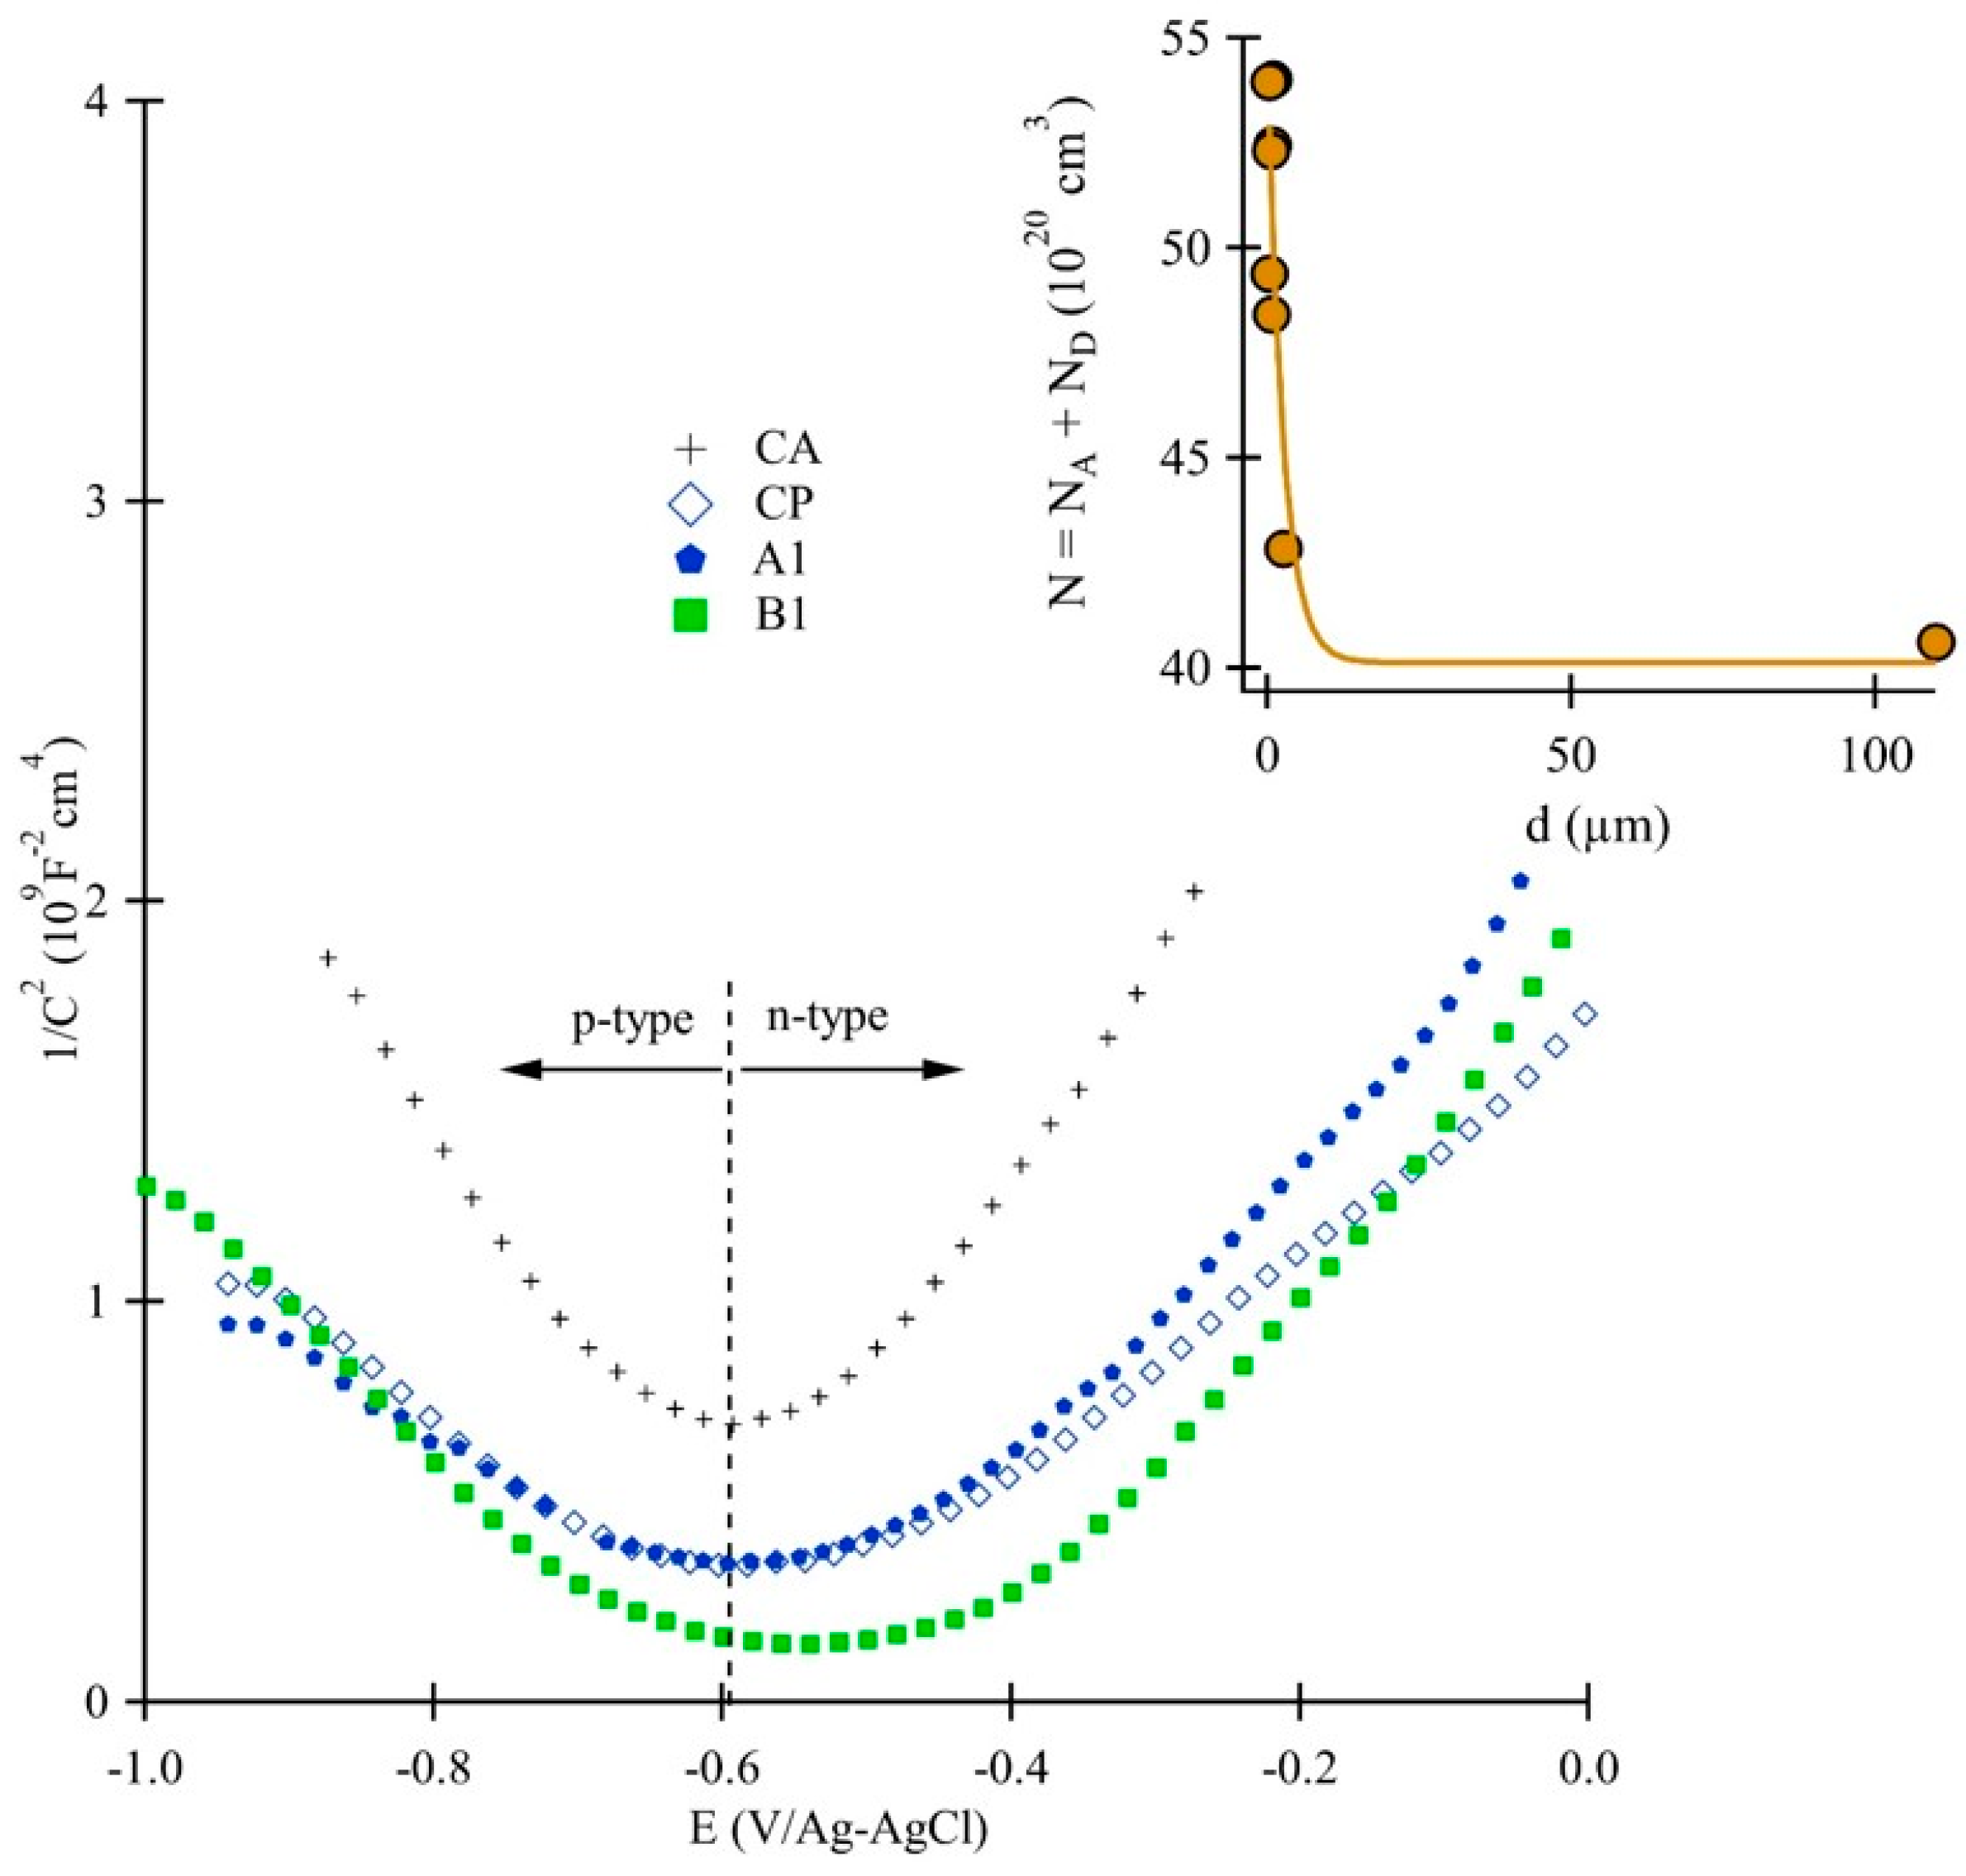
Reducing the grain diameter in the UFG range increases the electrical resistance of the oxide film.
-
The total charge carrier density of the oxide layer decreases as the grain size increases. Cl anions are then less able to transfer through the thickness of the outer layer, and then the chemical breakdown of the passive layer is more difficult to achieve.
-
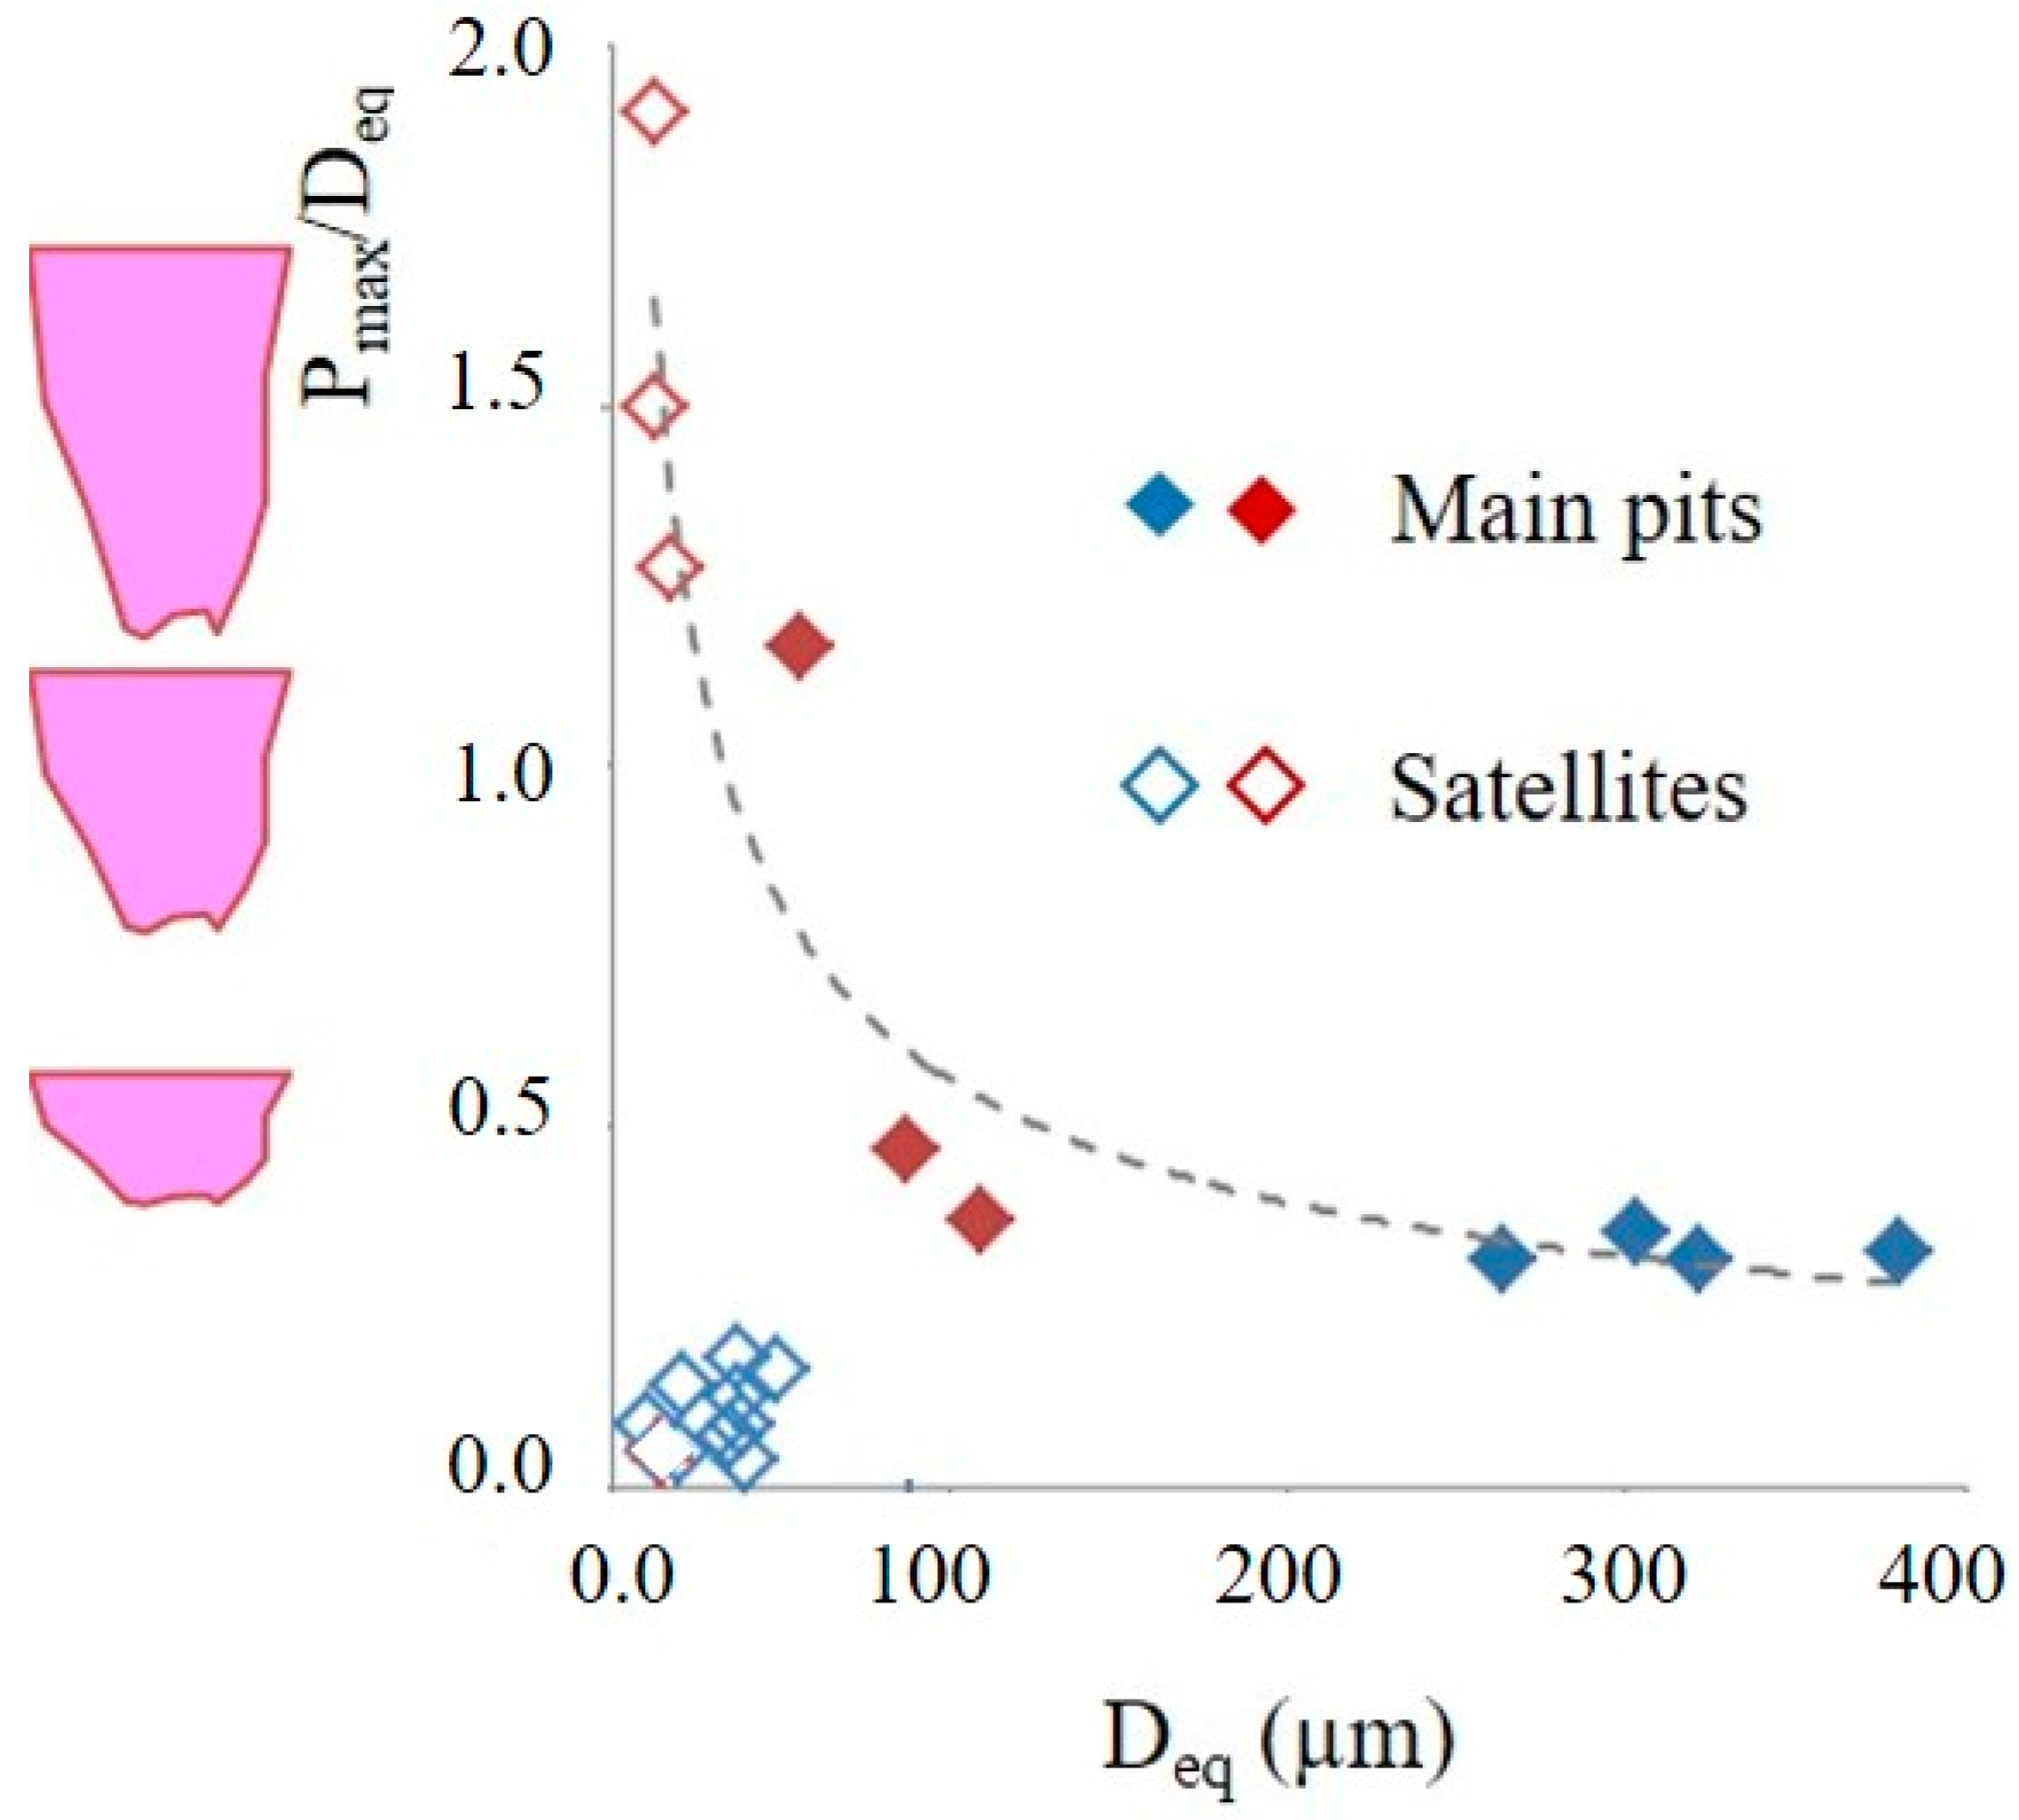
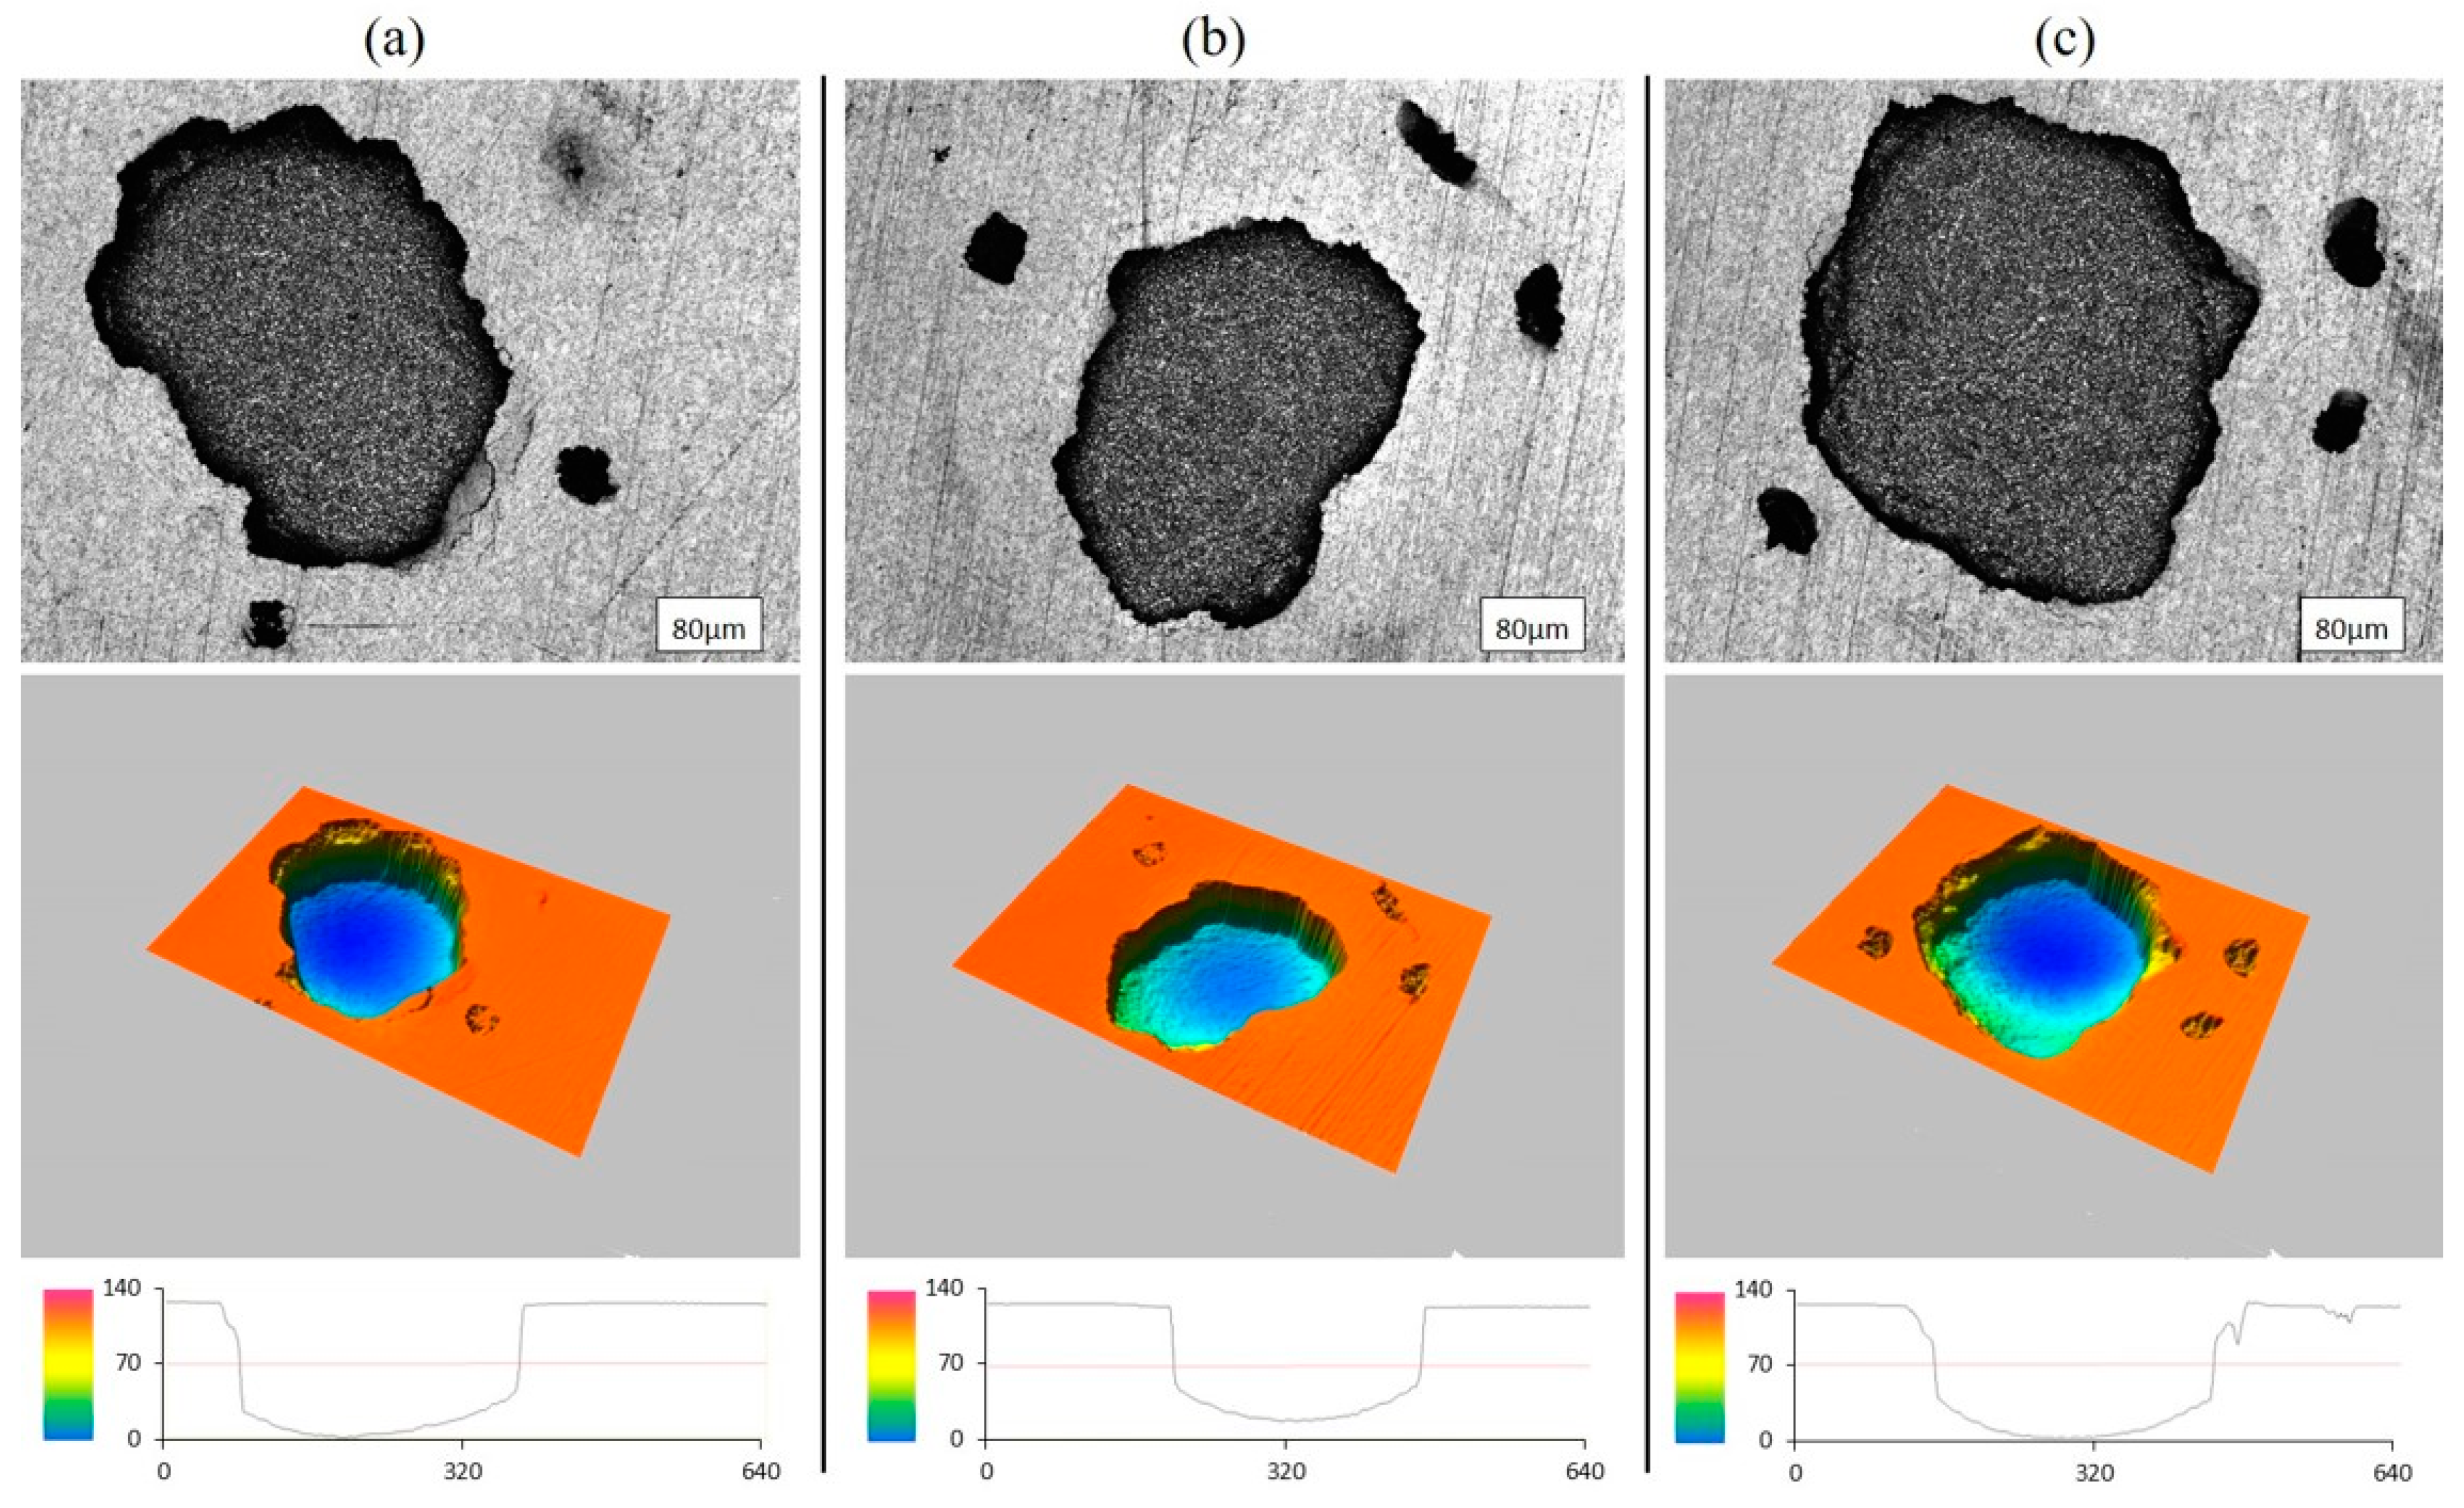
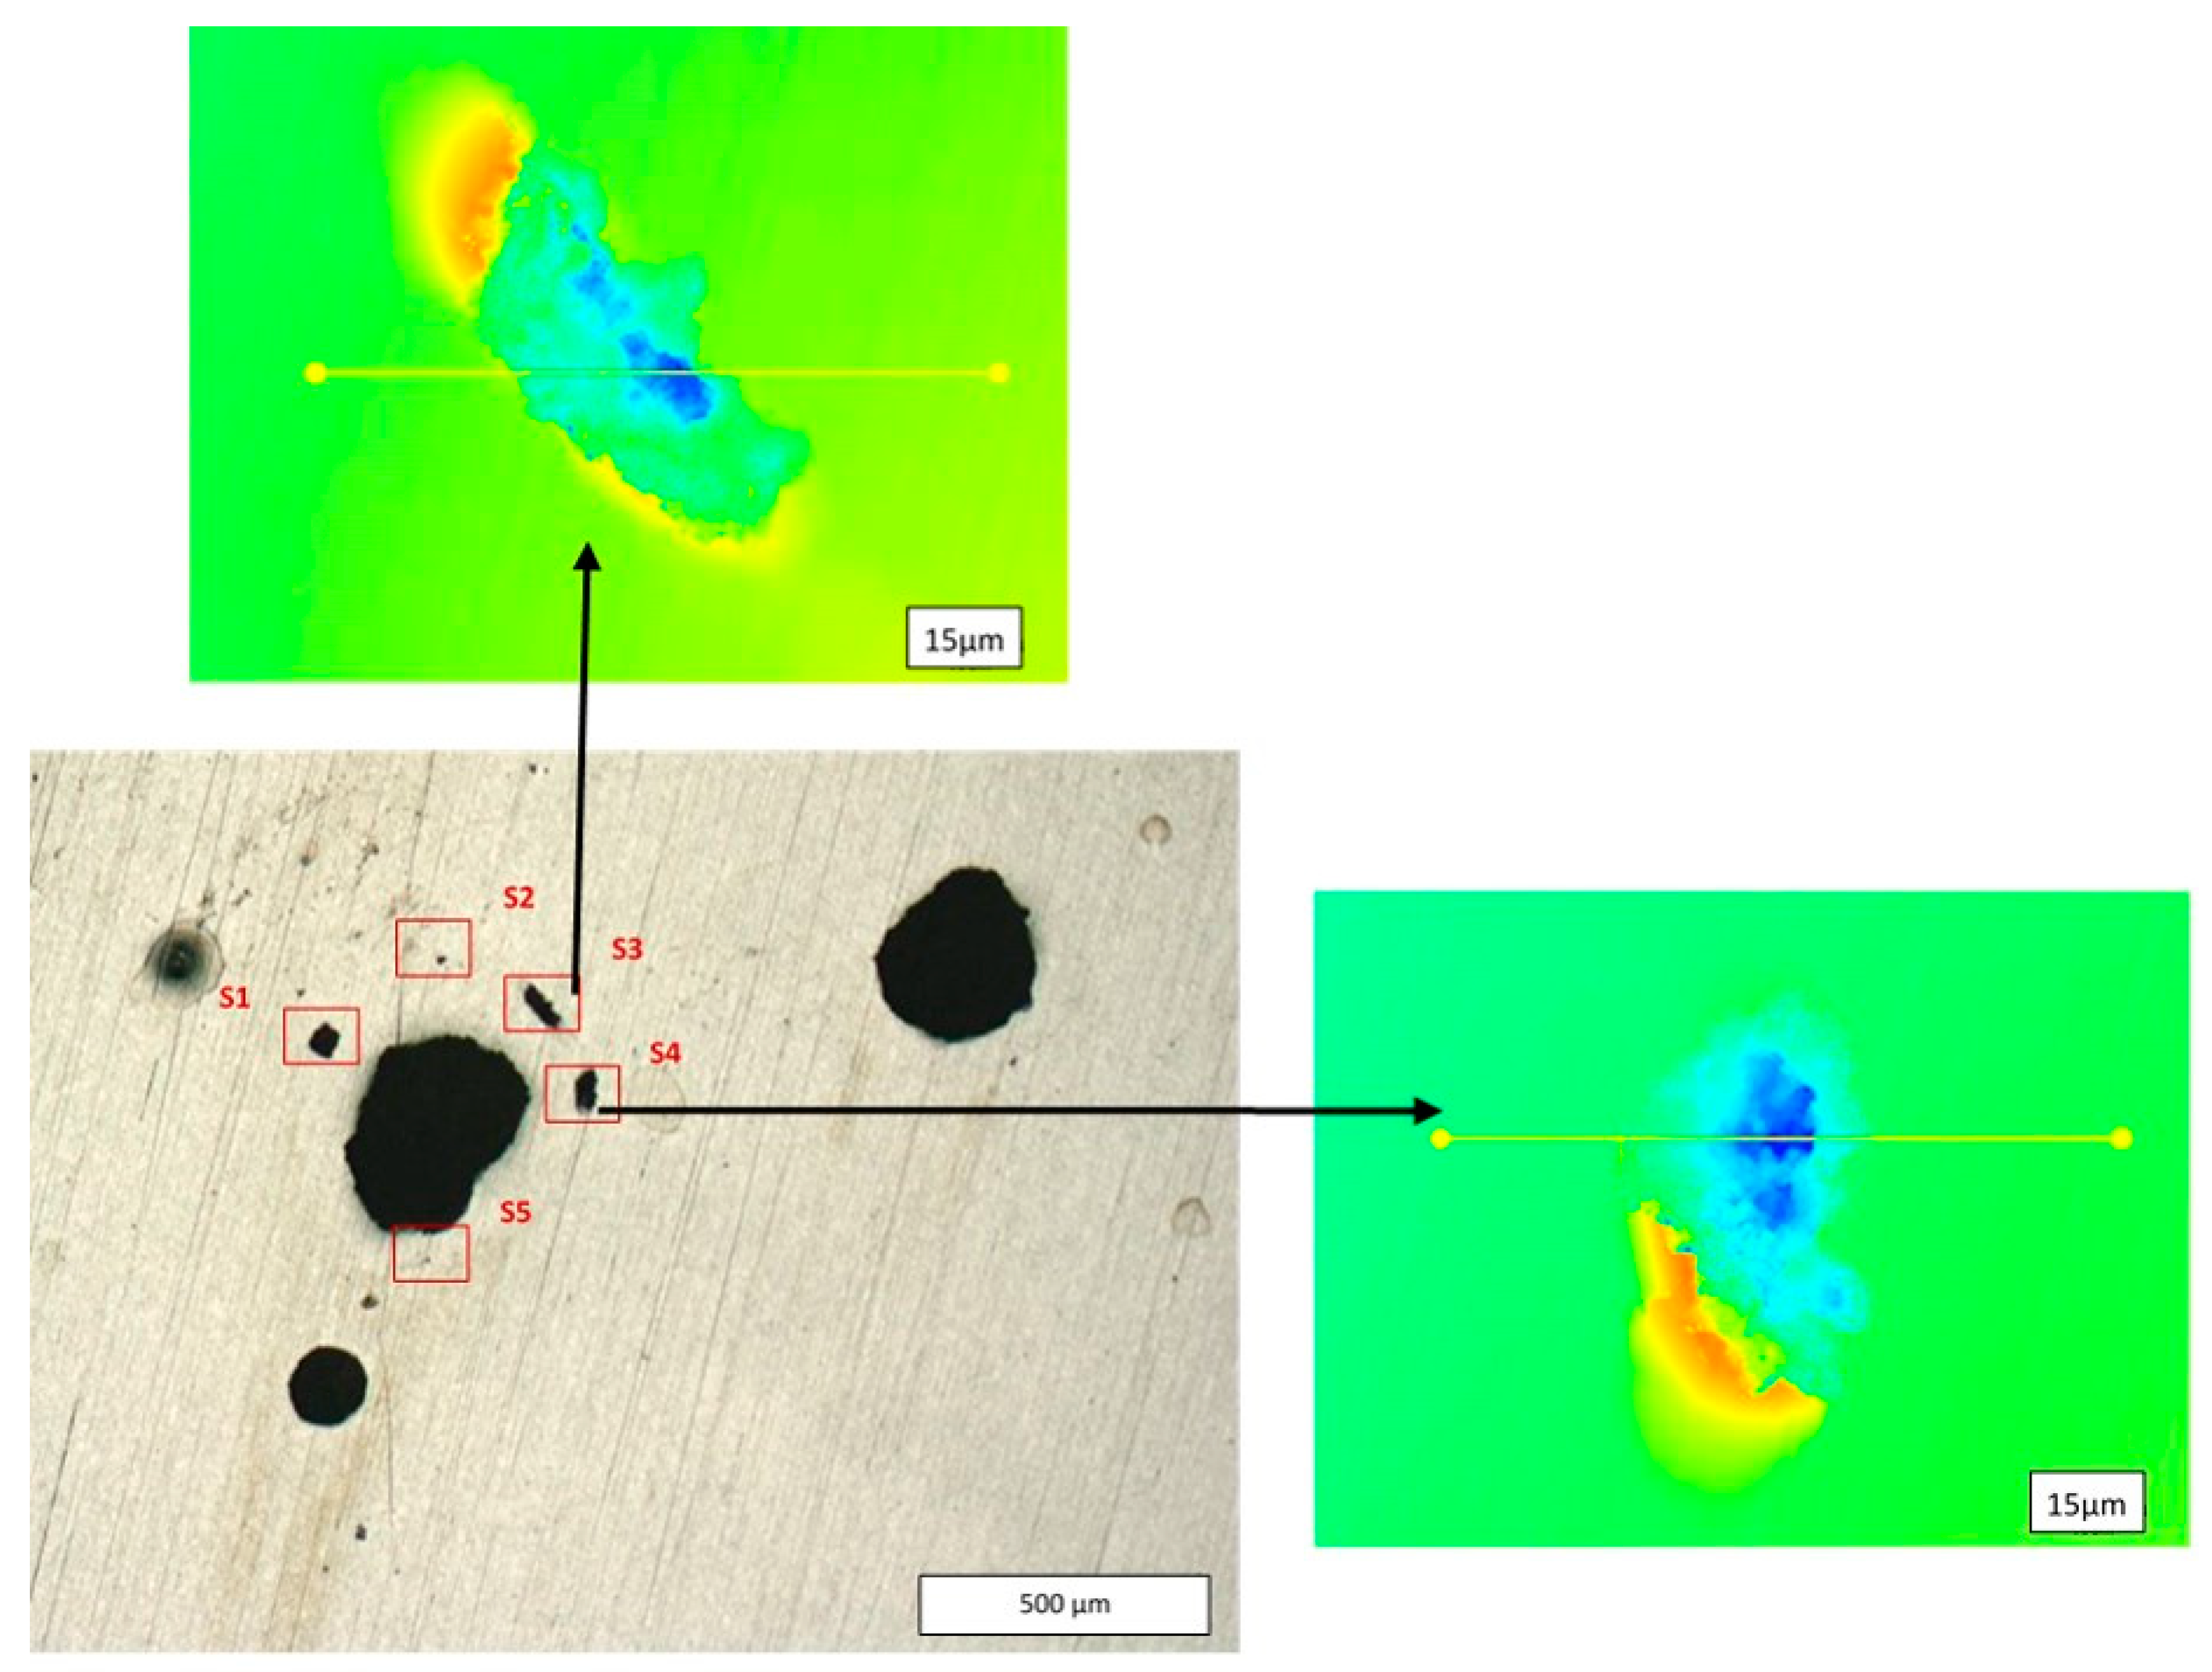
The mechanism of pitting consists of nucleation and subsurface growth of the main pits, followed by the formation of satellite pits distributed around the main pits.
-
The pre-passivation of the powder prevents this pitting nucleation and growth mechanism. As a result, the samples with the smallest grain diameters made with the pre-passivated powder develop a better resistance to pitting than those made with the commercial powder, as well as improved corrosion properties in chloride environments.

Author Contributions

Conceptualization, E.H.; methodology, C.K. and K.T.; validation, C.K., C.F. and G.M.; formal analysis, E.H. and C.F.; investigation, C.F., J.P., K.T. and G.M.; data curation, J.P.; writing—original draft, E.H.; writing—review and editing, E.H., C.K., C.F. and J.P.; supervision, E.H.; project administration, C.K. All authors have read and agreed to the published version of the manuscript.

Funding

This research was funded by the financial support of the French Agence Nationale de la Recherche (ANR), through the program “Investissements d’Avenir” (CMAIN Project, ANR-10-LABX-09-01), LabExEMC3.

Data Availability Statement

The data are not publicly available due to industrial confidential restrictions.

Conflicts of Interest

Author Kostiantyn Tabalaiev was employed by the CRMC, Industeel. Author Gaël Marnier was employed by the ENSICAEN. The remaining authors declare that the research was conducted in the absence of any commercial or financial relationships that could be construed as a potential conflict of interest.

References

  1. He, Q.; Pan, F.; Wang, D.; Liu, H.; Guo, F.; Wang, Z.; Ma, Y. Microstructure and properties of 316L stainless steel foils for pressure sensor of pressurized water reactor. Nucl. Eng. Technol. 2021, 53, 172–177. [Google Scholar] [CrossRef]
  2. Zhang, E.; Zhao, X.; Hu, J.; Wang, R.; Fu, S.; Qin, G. Antibacterial metals and alloys for potential biomedical implants. Bioact. Mater. 2021, 6, 2569–2612. [Google Scholar] [CrossRef] [PubMed]
  3. Jena, G.; Anandkumar, B.; Sofia, S.; George, R.P.; Philip, J. Fabrication of silanized GO hybrid coating on 316L SS with enhanced corrosion resistance and antibacterial properties for marine applications. Surf. Coat. Technol. 2020, 402, 126295. [Google Scholar] [CrossRef]
  4. D’Andrea, D. Additive Manufacturing of AISI 316L Stainless Steel: A Review. Metals 2023, 13, 1370. [Google Scholar] [CrossRef]
  5. Liu, E.; Zhang, Y.; Zhu, L.; Zeng, Z.; Gao, R. Effect of strain-induced martensite on the tribocorrosion of AISI 316L austenitic stainless steel in seawater. RSC Adv. 2017, 7, 44923–44932. [Google Scholar] [CrossRef]
  6. Song, R.-B.; Xiang, J.-Y.; Hou, D.-P. Characteristics of Mechanical Properties and Microstructure for 316L Austenitic Stainless Steel. J. Iron Steel Res. Int. 2011, 18, 53–59. [Google Scholar] [CrossRef]
  7. Krasilnikov, N.; Lojkowski, W.; Pakiela, Z.; Valiev, R. Tensile strength and ductility of ultra-fine-grained nickel processed by severe plastic deformation. Mater. Sci. Eng. A 2005, 397, 330–337. [Google Scholar] [CrossRef]
  8. Sun, L.G.; Wu, G.; Wang, Q.; Lu, J. Nanostructural metallic materials: Structures and mechanical properties. Mater. Today 2020, 38, 114–135. [Google Scholar] [CrossRef]
  9. Valiev, R.Z.; Estrin, Y.; Horita, Z.; Langdon, T.G.; Zehetbauer, M.J.; Zhu, Y.T. Fundamentals of Superior Properties in Bulk NanoSPD Materials. Mater. Res. Lett. 2016, 4, 1–21. [Google Scholar] [CrossRef]
  10. Choi, J.-P.; Lee, G.-Y.; Song, J.-I.; Lee, W.-S.; Lee, J.-S. Sintering behavior of 316L stainless steel micro–nanopowder compact fabricated by powder injection molding. Powder Technol. 2015, 279, 196–202. [Google Scholar] [CrossRef]
  11. Pandya, S.; Ramakrishna, K.S.; Annamalai, A.R.; Upadhyaya, A. Effect of sintering temperature on the mechanical and electrochemical properties of austenitic stainless steel. Mater. Sci. Eng. A 2012, 556, 271–277. [Google Scholar] [CrossRef]
  12. Kurgan, N. Effects of sintering atmosphere on microstructure and mechanical property of sintered powder metallurgy 316L stainless steel. Mater. Des. 2013, 52, 995–998. [Google Scholar] [CrossRef]
  13. Preston, A.D.; Ma, K. Insight into the effects of pore size and distribution on mechanical properties of austenite stainless steels. J. Mater. Sci. 2021, 56, 17278–17295. [Google Scholar] [CrossRef]
  14. Oleszak, D.; Grabias, A.; Pekala, M.; Swiderska-Sroda, A.; Kulik, T. Evolution of structure in austenitic steel powders during ball milling and subsequent sintering. J. Alloy Compd. 2007, 434–435, 340–343. [Google Scholar] [CrossRef]
  15. Trzaska, Z.; Cours, R.; Monchoux, J.-P. Densification of Ni and TiAl by SPS: Kinetics and Microscopic Mechanisms. Metall. Mater. Trans. A 2018, 49, 4849–4859. [Google Scholar] [CrossRef]
  16. Hu, Z.-Y.; Zhang, Z.-H.; Cheng, X.-W.; Wang, F.-C.; Zhang, Y.-F.; Li, S.-L. A review of multi-physical fields induced phenomena and effects in spark plasma sintering: Fundamentals and applications. Mater. Des. 2020, 191, 108662. [Google Scholar] [CrossRef]
  17. Orrù, R.; Licheri, R.; Locci, A.M.; Cincotti, A.; Cao, G. Consolidation/synthesis of materials by electric current activated/assisted sintering. Mater. Sci. Eng. R Rep. 2009, 63, 127–287. [Google Scholar] [CrossRef]
  18. Cipolloni, G.; Pellizzari, M.; Molinari, A.; Hebda, M.; Zadra, M. Contamination during the high-energy milling of atomized copper powder and its effects on spark plasma sintering. Powder Technol. 2015, 275, 51–59. [Google Scholar] [CrossRef]
  19. Keller, C.; Tabalaiev, K.; Marnier, G.; Noudem, J.; Sauvage, X.; Hug, E. Influence of spark plasma sintering conditions on the sintering and functional properties of an ultra-fine grained 316L stainless steel obtained from ball-milled powder. Mater. Sci. Eng. A 2016, 665, 125–134. [Google Scholar] [CrossRef]
  20. Marnier, G.; Keller, C.; Noudem, J.; Hug, E. Functional properties of a spark plasma sintered ultrafine-grained 316L steel. Mater. Des. 2014, 63, 633–640. [Google Scholar] [CrossRef]
  21. Flipon, B.; de la Cruz, L.G.; Hug, E.; Keller, C.; Barbe, F. Elaboration of austenitic stainless steel samples with bimodal grain size distributions and investigation of their mechanical behavior. AIP Conf. Proc. 2017, 1896, 200007. [Google Scholar]
  22. Flipon, B.; Keller, C.; Cruz, L.G.D.L.; Hug, E.; Barbe, F. Tensile properties of spark plasma sintered AISI 316L stainless steel with unimodal and bimodal grain size distributions. Mater. Sci. Eng. A 2018, 729, 249–256. [Google Scholar] [CrossRef]
  23. García, C.; Martín, F.; de Tiedra, P.; Cambronero, L.G. Pitting corrosion behaviour of PM austenitic stainless steels sintered in nitrogen–hydrogen atmosphere. Corros. Sci. 2007, 49, 1718–1736. [Google Scholar] [CrossRef]
  24. Hug, E.; Keller, C. Passivation properties of ultrafine grain 316L stainless steels manufactured by ball milling and spark plasma sintering. Mater. Chem. Phys. 2023, 309, 128398. [Google Scholar] [CrossRef]
  25. Kargar, B.S.; Moayed, M.H.; Babakhani, A.; Davoodi, A. Improving the corrosion behaviour of powder metallurgical 316L alloy by prepassivation in 20% nitric acid. Corros. Sci. 2011, 53, 135–146. [Google Scholar] [CrossRef]
  26. Liu, L.; Li, Y.; Wang, F. Pitting mechanism on an austenite stainless steel nanocrystalline coating investigated by electrochemical noise and in-situ AFM analysis. Electroch. Acta 2008, 54, 768–780. [Google Scholar] [CrossRef]
  27. Racot, A.; Aubert, I.; Touzet, M.; Thiebaut, S.; Demesy, M. Statistical analysis of the pitting corrosion induced by potentiostatic pulse tests of wrought and SLM 316L stainless steels. Corros. Sci. 2022, 197, 110036. [Google Scholar] [CrossRef]
  28. Orazem, M.E.; Tribollet, B. Electrochemical Impedance Spectroscopy; Wiley: Hoboken, NJ, USA, 2008. [Google Scholar]
  29. Gomes, W.P.; Vanmaekelbergh, D. Impedance spectroscopy at semiconductor electrodes: Review and recent developments. Electroch. Acta 1996, 41, 967–973. [Google Scholar] [CrossRef]
  30. Trisnanto, S.R.; Wang, X.; Brochu, M.; Omanovic, S. Effects of crystallographic orientation on the corrosion behavior of stainless steel 316L manufactured by laser powder bed fusion. Corros. Sci. 2022, 196, 110009. [Google Scholar] [CrossRef]
  31. Wang, Z.; Paschalidou, E.-M.; Seyeux, A.; Zanna, S.; Maurice, V.; Marcus, P. Mechanisms of Cr and Mo Enrichments in the Passive Oxide Film on 316L Austenitic Stainless Steel. Front. Mater. 2019, 6, 232. [Google Scholar] [CrossRef]
  32. Yue, X.; Yang, Z.; Huang, L.; Zhang, L.; Li, J.; Xue, Z.; Pan, J. Passivation characteristics of ultra-thin 316L foil in NaCl solutions. J. Mater. Sci. Technol. 2022, 127, 192–205. [Google Scholar] [CrossRef]
  33. Lv, J.; Luo, H.; Liang, T.; Guo, W. The effects of grain refinement and deformation on corrosion resistance of passive film formed on the surface of 304 stainless steels. Mater. Res. Bull. 2015, 70, 896–907. [Google Scholar]
  34. Ebrahimzadeh, P.; Peral, L.B.; González-Martínez, R.; Mardaras, E.; Fernández-Pariente, I. Influence of Severe Surface Plastic Deformation Induced by Shot Peening on Microstructure and Corrosion Resistance of fine grained 316 L stainless steel. Corros. Sci. 2024, 231, 111988. [Google Scholar] [CrossRef]
  35. LTaveira, V.; Montemor, M.F.; Da Cunha Belo, M.; Ferreira, M.G.; Dick, L.F.P. Influence of incorporated Mo and Nb on the Mott–Schottky behaviour of anodic films formed on AISI 304L. Corros. Sci. 2010, 52, 2813–2818. [Google Scholar] [CrossRef]
  36. Dean, M.H.; Stimming, U. The electronic properties of disordered passive films. Corros. Sci. 1989, 29, 199–211. [Google Scholar] [CrossRef]
  37. Zhao, M.; Wu, H.; Lu, J.; Sun, G.; Du, L. Effect of grain size on mechanical property and corrosion behavior of a metastable austenitic stainless steel. Mater. Charact. 2022, 194, 112360. [Google Scholar] [CrossRef]
  38. Kale, A.B.; Kim, B.-K.; Kim, D.-I.; Castle, E.G.; Reece, M.; Choi, S.-H. An investigation of the corrosion behavior of 316L stainless steel fabricated by SLM and SPS techniques. Mater. Charact. 2020, 163, 110204. [Google Scholar] [CrossRef]
  39. Jafarzadeh, S.; Chen, Z.; Zhao, J.; Bobaru, F. Pitting, lacy covers, and pit merger in stainless steel: 3D peridynamic models. Corros. Sci. 2019, 150, 17–31. [Google Scholar] [CrossRef]
  40. Sun, D.; Jiang, Y.; Tang, Y.; Xiang, Q.; Zhong, C.; Liao, J.; Li, J. Pitting corrosion behavior of stainless steel in ultrasonic cell. Electroch. Acta 2009, 54, 1558–1563. [Google Scholar] [CrossRef]
  41. Ernst, P.; Newman, R.C. Pit growth studies in stainless steel foils. I. Introduction and pit growth kinetics. Corros. Sci. 2002, 44, 927–941. [Google Scholar] [CrossRef]
Figure 1. Flow diagram of the elaboration methodology, experimental details concerning ball milling (rs, rotation speed; pca, process control agent; and t, milling time) and SPS (P, pressure; T, temperature; and t, dwell time), and corresponding 316L samples.
Metals 14 00864 g001
Figure 2. Grain orientation maps and associated pole figures for the 316L samples: (a) CA, (b) CP, (c) A3/B3, (d) A2/B2, and (e) A1/B1. Pre-passivated (B) and not passivated (A) samples exhibit the same microstructural features.
Metals 14 00864 g002
Figure 3. Grain size distributions corresponding to 316L samples shown in Figure 2.
Metals 14 00864 g003
Figure 4. (a) Potentiodynamic curves of CA and CP 316L. Impact of ball milling and passivation of the powder for three final grain sizes: (b) d = 1 µm (A3 and B3 samples), (c) d = 0.8 µm (A2 and B2 samples), and (d) d = 0.4 µm (A1 and B1 samples).
Metals 14 00864 g004
Figure 5. Examples of Nyquist diagrams for 316L specimens with various grain sizes. An equivalent electrical circuit is given in the inset.
Metals 14 00864 g005
Figure 6. Evolution of the polarization resistance, Rtot, with 1/d for all the 316L samples.
Metals 14 00864 g006
Figure 7. Mott–Schottky plots around the flat band potential for passive films formed on some 316L specimens. The variation of N = NA + ND, along with the grain diameter, d, is represented in inset.
Metals 14 00864 g007
Figure 8. Corrosion landscape of SPS 316L with ball-milled (A samples) powder and ball-milled and passivated powder (B samples): (a) A1, (b) A2, (c) B1, and (d) B2. Average grain sizes are given for each sample.
Metals 14 00864 g008
Figure 9. Evolution of the ratio between the maximal depth, Pmax, and the equivalent diameter, Deq, of several representative pits depicted in A2 samples. Schematic morphology of the pits in pink, depending on the ratio Pmax/Deq.
Metals 14 00864 g009
Figure 10. Typical pits observed on A2 surfaces after exposition to NaCl environment during potentiodynamic experiment (Jmax = 10−1 mA/cm2). (ac) Pits P1, P2, and P3, highlighted by red squares in Figure 8b. For each pit (vertical images) are given, from up to bottom, the image by light microscopy, the 3D profile by laser confocal microscopy, and a depth profile (values are in µm).
Metals 14 00864 g010
Figure 11. P2 pit (cf. Figure 8b) depicted on A2 surfaces, with five smaller satellite pits around. Uplift of the surface matter around the satellites is evidenced as red areas depicted by confocal 2D images.
Metals 14 00864 g011
Figure 12. Evolution of the pit morphology with several successive polishings, P1, P2, …, P8. (a) Variation of the average equivalent diameter with average depth. Statistical measurements performed on all the pits present in A2 surface. (b) Evolution of the profile along the yellow line of a pit shown in inset. (c) Iso-contour of the diameter of a pit and its satellites (black) after several polishing levels. (d) Schema of the development of subsurface corrosion for a main pit.
Metals 14 00864 g012
Table 1. Some microstructural and mechanical characteristics of 316L specimens (following data coming from [19,20,22,24]). d is the average grain diameter, ρ the relative density, LAGB is the low-angle grain boundary amount, HAGB is the high-angle grain boundary amount, Σ3 is the twin amount, and MPD is the Maximal Pole Density of the crystallographic textures.
Sample Codeρ
(%)
d
(µm)
Σ3
(%)
LAGB
(%)
HAGB (%)MPD (MRD)
CA100110 ± 2034.628.971.13.35
CP99.62.7 ± 1.828.723.276.83.13
A1, B195.30.33 ± 0.0919.113.286.81.33
A2, B295.10.67 ± 0.0728.418.881.22.28
A3, B394.70.88 ± 0.0829.710.289.82.28
Table 2. Mean values of corrosion parameters from J(E) experiments performed on 316L samples. Potentials are given versus Ag-AgCl electrode.
Sample CodeEcor
(mV)
Jcor *
(µA/cm2)
Jpas
(µA/cm2)
Epit
(mV)
L
(mV)
CA−122 0.93628750 ± 175
CP−136 1.71267416 ± 154
A1−520.85-------------------
A2−250.95-------------------
A3−590.77-------------------
B1−82 0.65296438 ± 137
B2−97 0.57137234 ± 51
B3−91 0.61105196 ± 38
* Jcor obtained from Tafel plots, only for A samples, when no passivity is depicted.
Table 3. Impedance-model parameters corresponding to the electrical equivalent circuit represented in Figure 5 for 316L samples in NaCl electrolyte.
Sample CodeRs
(Ω·cm2)
Rtot
(kΩ·cm2)
Q
(µF·sα−1/cm2)
α
Ceff
(µF/cm2)
δ
(nm)
CA22.9201.2816.10.9031.02.6
CP15.1134.2628.40.8960.11.3
A117.3225.6914.60.8928.92.8
A221.7199.2318.70.9133.92.3
A318.6175.6826.00.8765.51.2
B116.5256.2618.30.9034.52.3
B222.4218.9814.70.8749.12.4
B319.2204.0121.20.8848.11.7
Table 4. Values of NA, ND, and EFB for all the 316L specimens. (Potential is given versus Ag-AgCl electrode).
Sample CodeNA
(1020 cm3)
ND
(1020 cm3)
EFB
(mV)
CA15.2225.39−590
CP20.1422.70−556
A131.4522.50−557
A229.7022.62−556
A332.7721.25−568
B127.4621.92−543
B228.5019.91−571
B329.5722.88−566
Disclaimer/Publisher’s Note: The statements, opinions and data contained in all publications are solely those of the individual author(s) and contributor(s) and not of MDPI and/or the editor(s). MDPI and/or the editor(s) disclaim responsibility for any injury to people or property resulting from any ideas, methods, instructions or products referred to in the content.

