Article

Effect of Swing Amplitude on Microstructure and Properties of TC4 Titanium Alloy in Laser Welding

School of Materials Science and Engineering, Liaoning University of Technology, Jinzhou 121001, China
*
Author to whom correspondence should be addressed.
Metals 2024, 14(8), 893; https://doi.org/10.3390/met14080893
Submission received: 6 July 2024 / Revised: 31 July 2024 / Accepted: 2 August 2024 / Published: 5 August 2024

Abstract

:
The welding of TC4 titanium alloy sheets with a thickness of 1 mm was successfully accomplished by a swinging laser. The microstructure and mechanical properties of the welding seam under different swing amplitudes were studied. In this paper, the microstructure, phase composition, mechanical properties, and fracture morphology of the weld with swing frequency of 50 Hz and different swing amplitudes (0.2 mm, 1 mm, 2 mm, and 3 mm) were tested and analyzed. The results show that basket-weave microstructures are present in the fusion zone of welds under different oscillation amplitudes, but the morphology of martensite within the basket-weave differs. The weld microstructure is mainly composed of acicular α′ martensite, initial α phase, secondary α phase, and residual β phase. The hardness of the weld is higher than that of the base metal, and the overall hardness decreases from the weld center to the base metal. When the oscillation amplitude A = 1 mm, the weld microstructure has the smallest average grain size, the highest microhardness (388.86 HV), the largest tensile strength (1115.4 MPa), and quasi-cleavage fracture occurs. At an oscillation amplitude of A = 2 mm, the tensile specimen achieves the maximum elongation of 14%, with ductile fracture as the dominant mechanism.

1. Introduction

With the increasing demand for simplified structure and reduced weight, TC4 titanium alloy, possessing the advantages of low density, excellent corrosion resistance, high strength, and biocompatibility, has replaced some alloys and become one of the commonly used engineering materials in the fields of aerospace, medical care, biomedical science, biomaterials, petrochemical engineering, and others. However, TC4 titanium alloy is characterized by its difficulty in cutting, high melting temperature, high strength, low thermal conductivity, and high reactivity to oxygen, which pose stringent requirements on welding conditions [1,2,3]. In recent years, with the development of welding technology aimed at improving welding quality, efficiency, cost-effectiveness, and safety, numerous welding techniques for TC4 titanium alloy have been developed. Among various welding techniques, laser welding stands out as a commonly used method for welding titanium alloys. Laser welding is a special fusion welding method that utilizes high energy density focused laser beams as a heat source to heat and melt workpieces, forming fusion welding based on the photothermal effect of the interaction between laser and material. Compared with other traditional welding processes, laser welding has characteristics such as minimal welding deformation, strong penetration, a small heat-affected zone of the weld, and beautiful weld formation, thus having broad application prospects in the welding of TC4 titanium alloy sheets and precision parts [4,5,6].
At present, domestic and international scholars have made comprehensive studies on the laser welding process of TC4 titanium alloy. Their main research methods are to change the welding speed, laser power, defocus amount, and other parameters to adjust the welding heat input, optimize the welding joint structure, and ultimately improve the mechanical properties of the welding joint. Some researchers have found that appropriate laser input power, scanning speed, and defocus distance can significantly inhibit the formation of micropores in the weld seam, and at the same time, the existing porosity can be reduced by remelting. A few scholars have also studied the effects of changing the laser incidence angle, scanning path, laser frequency, etc., on the structure and mechanical properties of the welding joint [7,8,9]. Some scholars believe that pulsed laser welding also has certain advantages in welding titanium alloys. The formation of micropores in titanium alloy welds depends on the modulation of heat input waveform, frequency, and amplitude. Compared with continuous waves, high-frequency square waves can effectively reduce the formation of micropores. In addition, the change in welding heat input will also affect the microstructure and mechanical properties of welds. Under appropriate processing conditions, the strength of laser-welded titanium alloy can be close to that of the original material. However, there are some processing problems and welding defects in titanium alloy laser welding [10,11], such as low elongation, poor fatigue performance, surface oxidation, pores, and coarse structure. Therefore, it is necessary to scientifically observe and explore new methods to better understand and solve these problems.
At present, some scholars have discovered the advantages of laser oscillating welding. Wang et al. [12] used laser oscillating welding technology to weld TC31 high-temperature titanium alloy and found that laser oscillating welding showed good formability, and the weld strength was close to the base metal strength. Moreover, laser oscillating welding is beneficial to the suppression of gas pores during the welding process of high-temperature titanium alloy. Christian Hagenlocher et al. [13] used laser oscillating welding to overlap aluminum alloy sheets and compared it with conventional straight-line welding. They found that oscillating welding is more conducive to the formation of equiaxed crystal structures and reduces the susceptibility of hot crack formation. Zhou et al. [14] used laser oscillating welding to weld TC4 titanium alloy and 7075 aluminum alloy, and studied the influence of oscillating laser beam on the interface and mechanical properties of Ti/Al fusion welded joints. They found that laser oscillating welding can avoid the defects such as pores and cracks in welded joints, and significantly improve the performance of Ti/Al joints.
In recent years, many researchers have studied the effect of laser welding technology on the structure and mechanical properties of thin TC4 titanium alloy. However, there is a lack of systematic research on the influence of oscillating laser welding on the properties of thin TC4 titanium alloy. In this paper, the effects of different swing amplitudes on the microstructure and mechanical properties of thin plate TC4 titanium alloy were studied by using linear swing laser butt welding. In this paper, the study of laser swing welding of 1 mm TC4 titanium alloy plate provides a new idea for manufacturing lightweight structural parts so as to reduce the weight of aircraft or spacecraft.

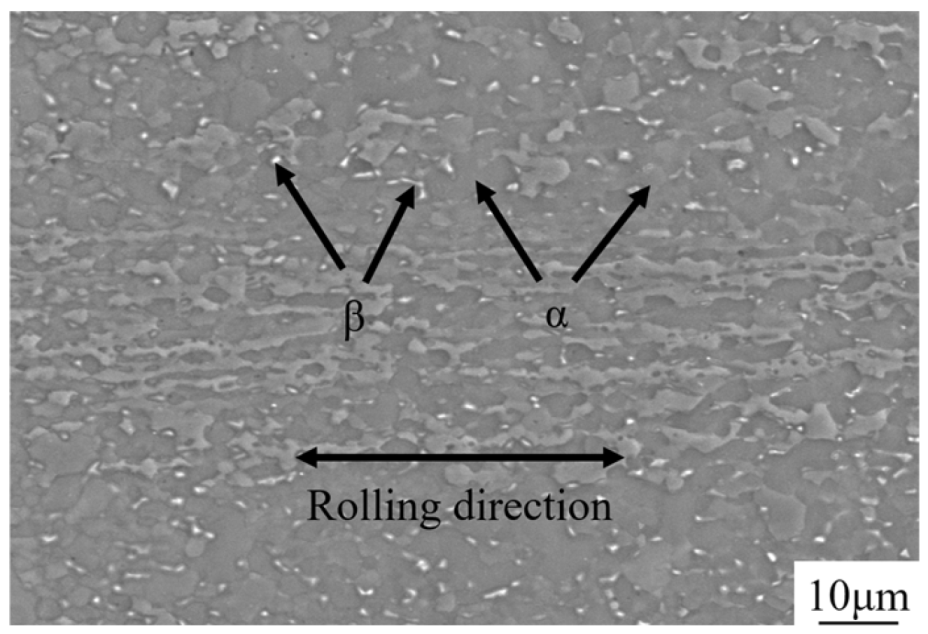
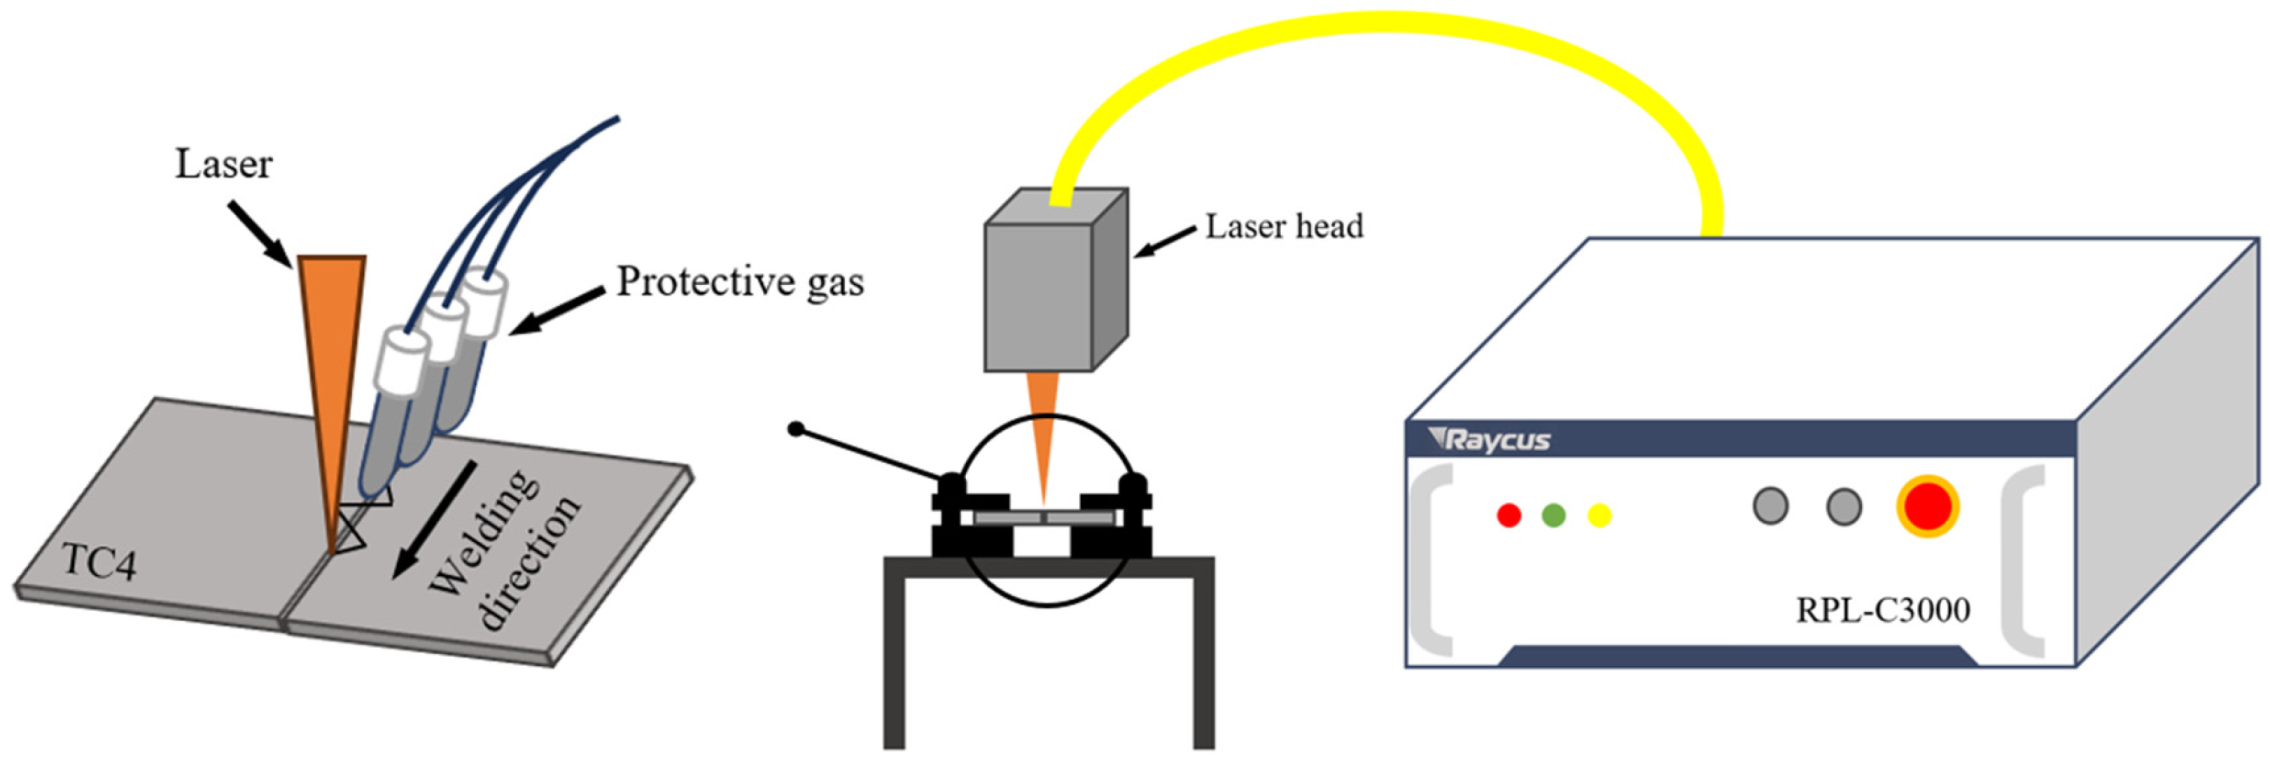
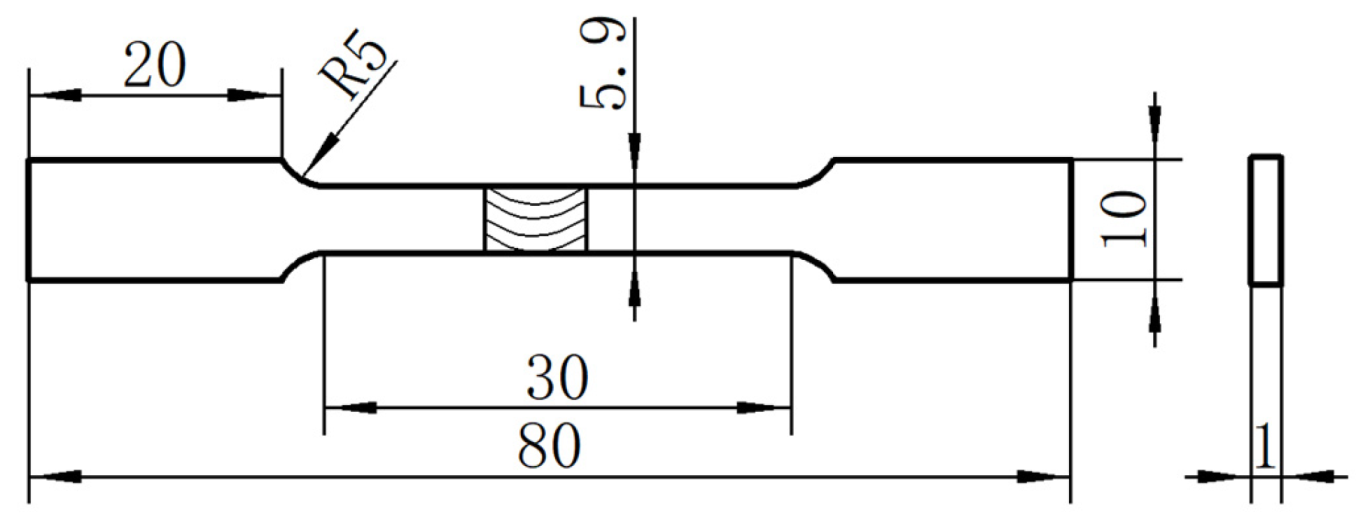
2. Experimental Material and Methods

The experimental material is 50 mm × 50 mm × 1 mm rolled TC4 titanium alloy sheet; its chemical composition is shown in Table 1, and its microstructure is shown in Figure 1. It can be seen from the figure that the α phase is the matrix phase, and the β phase is distributed at the grain boundary of the α phase.
In this experiment, a laser device with the model RFL-C3000 produced by Wuxi Raycus Fiber Laser Technology Co., Ltd. (Wuxi, China) was used with a swinging laser head to weld the TC4 titanium alloy sheet, as shown in Figure 2. To avoid the influence of the surface oxide layer and oil stain on the weld quality of the TC4 titanium alloy sheet, the sheet was ground with a grinding machine to remove the surface oxide film and defects. Before the experiment, the TC4 titanium alloy sheet was placed in the ultrasonic cleaning machine for two minutes and then dried to clean and remove oil and other impurities. The cleaning liquid was anhydrous ethanol. When welding, ensure that the two plates are aligned, ensure that the spacing between the two plates is almost zero, and use the fixture to clamp the plate. In the welding process, in order to prevent the oxidation of the weld from cracking, Ar gas, with a purity of 99.99%, is used as a protective gas. First of all, the two plates are spot-welded to ensure that they are easy to locate during later welding while improving welding quality and efficiency. Then the continuous linear swing laser is used to achieve the butt welding of the two plates.
After the welding is completed, wire cutting is used to cut and prepare the samples for standby using metallography, XRD, hardness, and other specimens. The following steps are required for preparing XRD specimens: grind the cut specimens successively with water abrasive paper of different particle sizes (600#, 800#, 1000#, 1200#, 1500#, and 2000#), mechanically polish the specimens to a mirror finish using nano-silicon dioxide polishing solution (50 nm) (Nanos Precision Machinery Technology Co., Ltd., Shenzhen, China), then place them in an ultrasonic cleaner and use anhydrous ethanol to clean and dry the specimens for standby, without any etching treatment. A D/max-2500/PC X-ray diffraction analyzer (XRD, Rigaku Corporation, Tokyo, Japan) is employed to investigate the phase composition of the weld (scanning speed of 8°/min; scanning range of 20–90°). The equilibrium phase diagram of TC4 titanium alloy is calculated using Jmat-pro software (Public Release Version 7.0.0, Sente Software Ltd., Surrey, UK). When preparing the metallographic specimen, the sample was inlaid with inlaying material, and the specimen was ground and polished after inlaying. The grinding and polishing process was consistent with the above process, and then the chemical etching was carried out with Kroll reagent (the volume ratio of HF, HNO3, and H2O was 2:3:10), and the etching time was 5–7 s. A Zeiss Axio Vert.A1 inverted metallographic microscope (Carl Zeiss AG, Oberkochen, Germany) is used to observe the metallographic structure of the weld. A Zeiss Sigma500 field emission scanning electron microscope (SEM, Carl Zeiss AG, Oberkochen, Germany) is adopted to observe and analyze the microstructure of the samples. The grain size distribution was calculated using ImageJ software (ImageJ 1.53q, National Institutes of Health, Bethesda, MD, USA). After the above test is completed, the corroded layer of the specimen is thrown off with a polishing machine to a scratch-free state, cleaned with alcohol solution, and dried for use. An MHVD-1000IS image analysis multi-functional digital microhardness tester (Shanghai Jujing Precision Instrument Manufacturing Co., Ltd., Shanghai, China) is used to measure the microhardness of the specimen (loading force of 200 N, duration of 10 s). The hardness of the weld (base metal → weld → base metal) is tested every 0.15 mm along the horizontal direction, and a hardness distribution diagram is plotted. Room temperature tensile specimens are cut from the samples using wire cutting and ground to 2000# with water abrasive paper to remove surface wire cutting marks and impurities. A CMT5305 computer-controlled electronic universal testing machine (MTS Systems (China) Co., Ltd., Shanghai, China) is used to test the room temperature tensile properties of the tensile specimens, and the tensile test data is plotted into a stress–strain curve. The maximum tensile strength (σb) and the elongation (δ) after fracture can be obtained from this curve. A Zeiss Sigma500 field emission scanning electron microscope (SEM) is employed to analyze the fracture morphology of the specimens after the tensile test. The welding process parameters are listed in Table 2, and the dimensions of the tensile specimens are shown in Figure 3.

3. Results and Discussion

3.1. Morphology of the Weld Seam
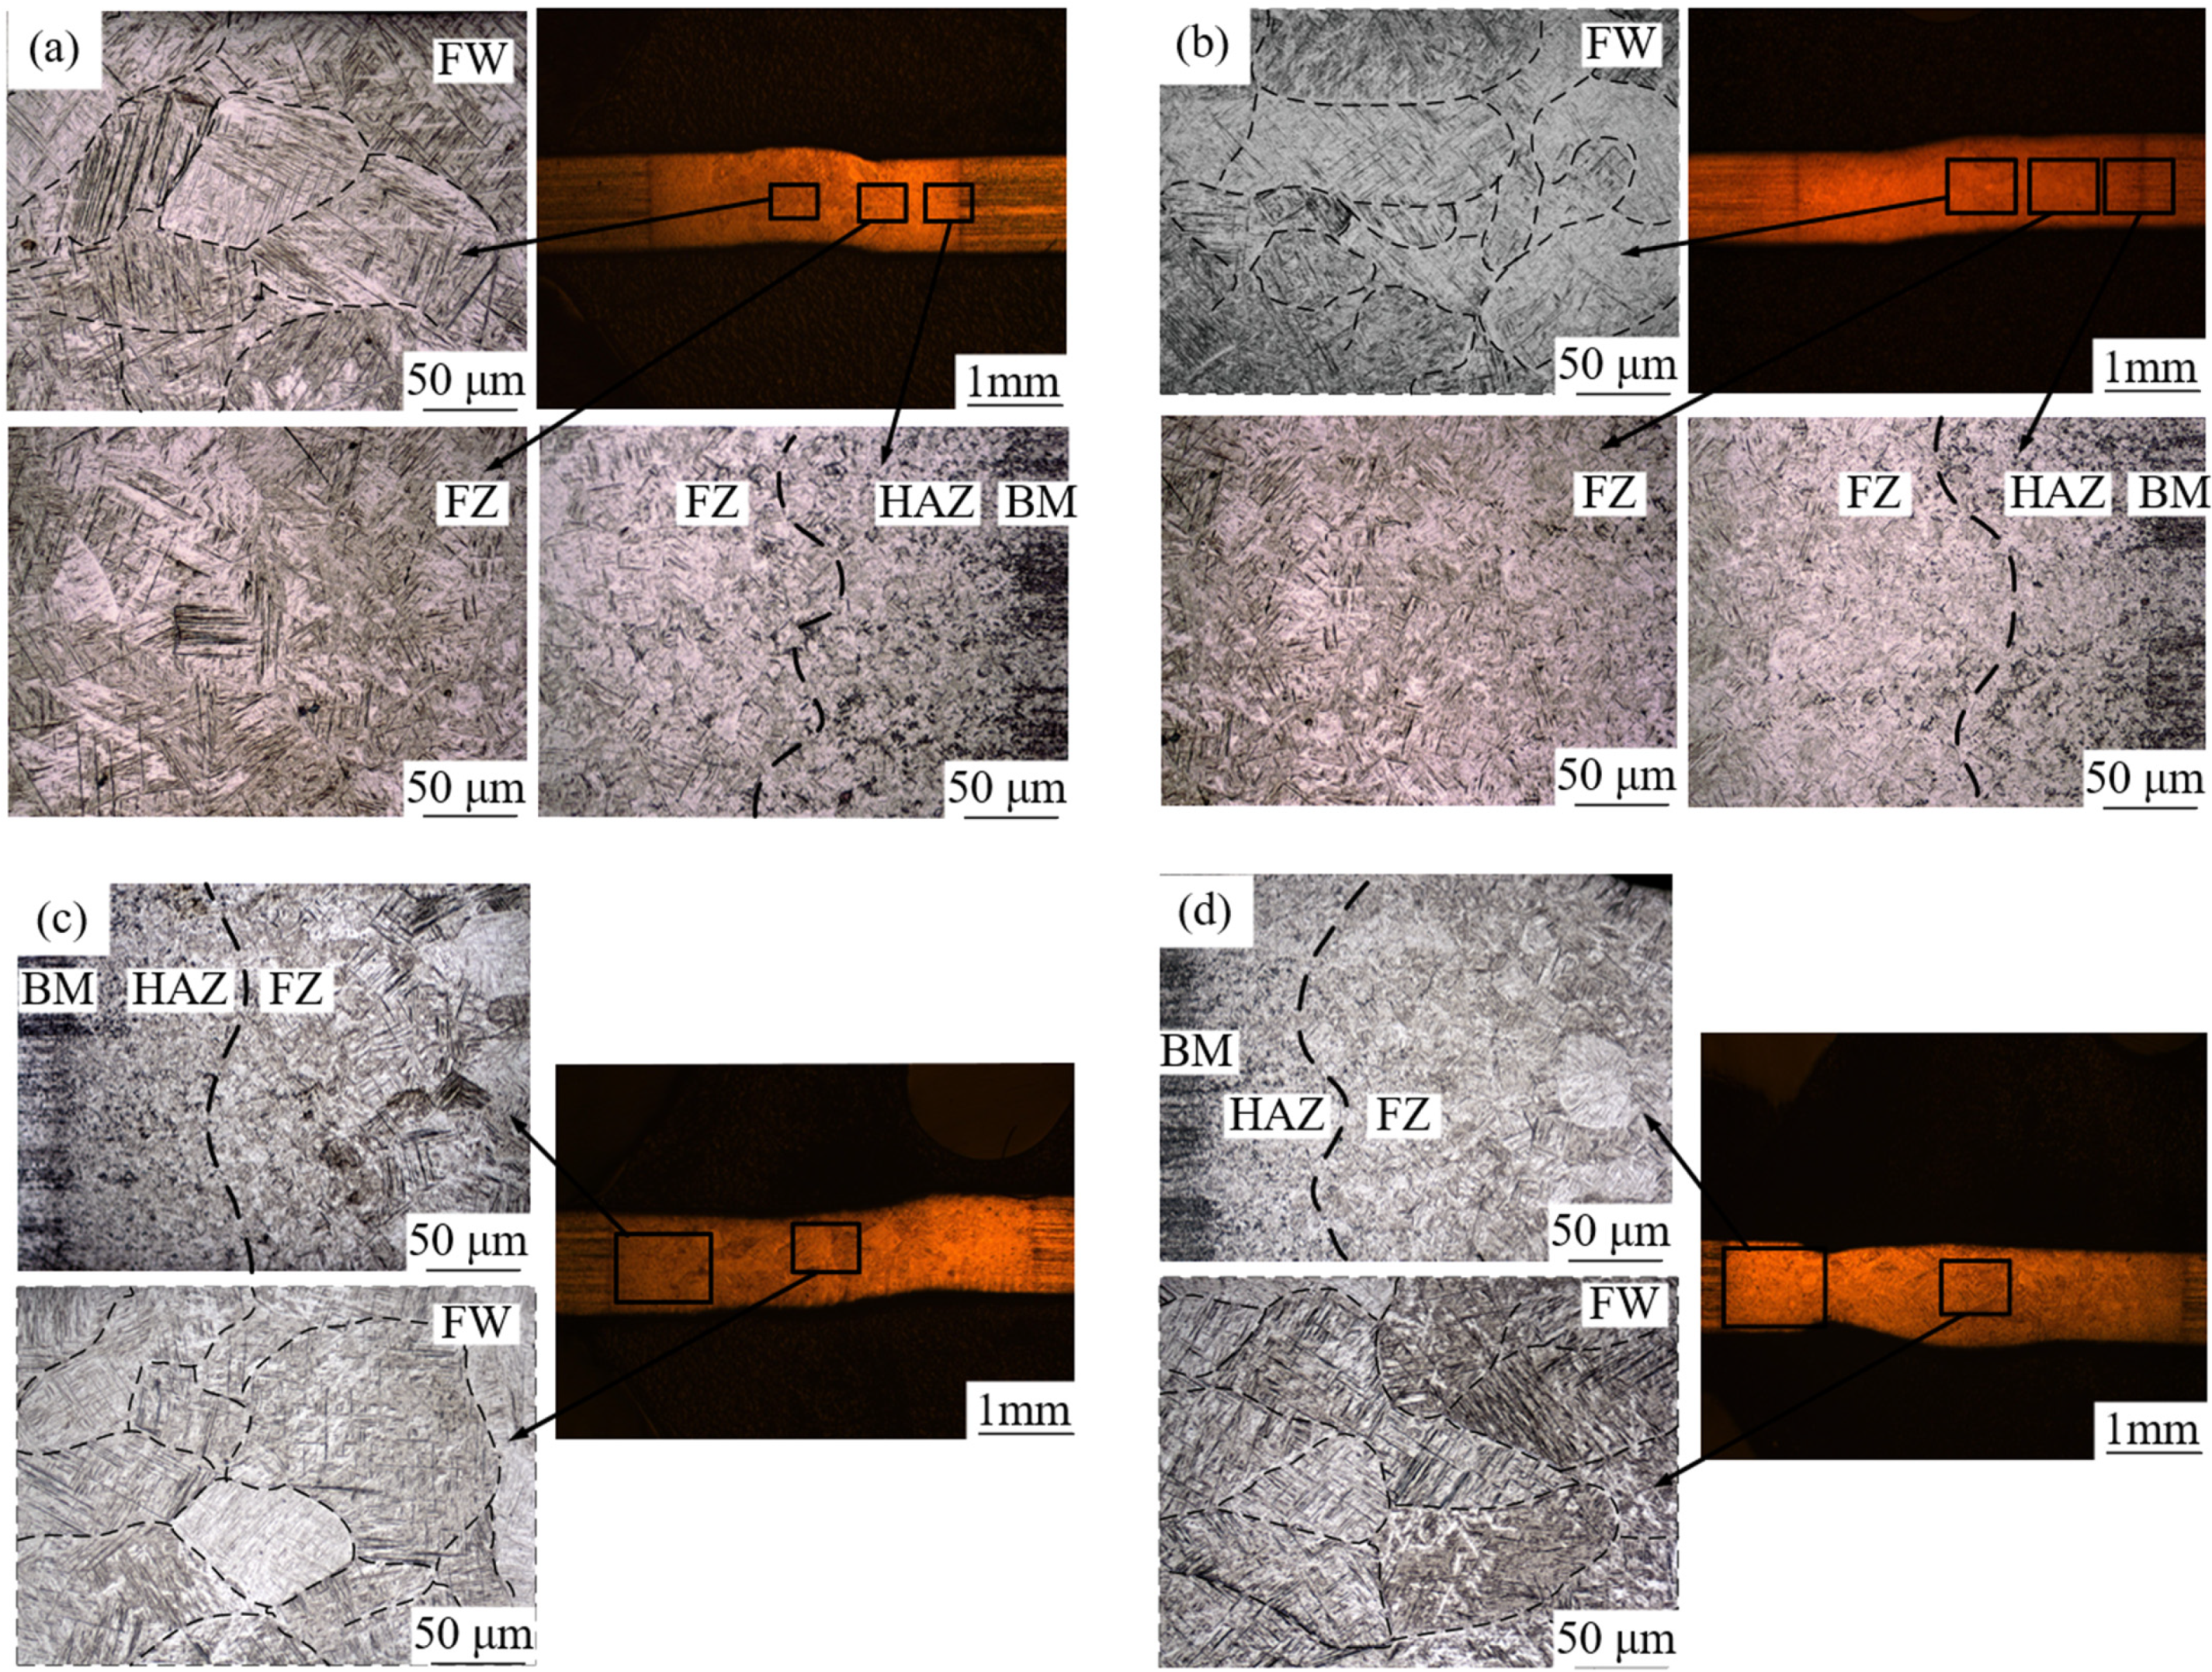
Figure 4 depicts the surface morphology of TC4 joints under different oscillation amplitudes. Through observation, we can find that during the oscillating laser welding process, the weld seam of TC4 titanium alloy exhibits good penetration. The weld surface presents a fine and uniformly distributed fish-scale texture with no cracks. As the oscillation amplitude gradually increased, the width of the weld seam also increased, directly reflecting the positive correlation between the oscillation amplitude and the width of the molten pool: with constant oscillation frequency and welding speed, the larger the amplitude, the relatively fewer scans the laser beam makes per unit length, leading to more relaxed heat dissipation conditions of the molten pool in the direction perpendicular to the scanning direction [15,16]. This results in more time for grain growth to expand to wider areas, thereby manifesting as an increase in the overall width of the weld seam. As can be seen in Figure 4g,h, when the oscillation amplitude exceeded a certain suitable range, obvious oxidation occurred on the weld surface. This is due to the excessive local temperature caused by the larger amplitude, leading to the oxidation of the weld surface, which degrades the joint performance. Additionally, due to the difference in thermal expansion coefficients between the oxide film and the matrix material, it can cause an increase in welding residual stress, further affecting its mechanical properties. Therefore, selecting an appropriate oscillation amplitude is crucial to ensure the quality of laser welding of TC4 titanium alloy.

3.2. Microstructure

Figure 5 shows the microstructure of the weld seams under different oscillating amplitudes. Through Figure 5, we can gain a deep understanding of the mechanism of how the oscillating amplitude affects the morphology of the weld seam, the fusion zone, and the heat-affected zone. As the oscillating amplitude increased, the overall width of the weld seam tended to increase, as the oscillating welding increased the duration of laser interaction with the material surface, thereby enhancing local heat input. As the oscillating amplitude rose, the high-temperature residence time extended, and the high-temperature zone broadeneds, resulting in a wider fusion zone of the weld seam. Meanwhile, oscillating welding significantly impacted the boundary between the heat-affected zone and the fusion zone of the weld seam. Compared to linear laser welding, the adoption of oscillating welding transformed the boundary between the two zones from a curve with a wider upper part and a narrower lower part into an irregular curve with little difference in the upper and lower positions. This change is mainly attributed to the alterations in fluid dynamics inside the weld pool caused by the laser oscillation, which further affects the morphology of the heat-affected zone and the fusion zone [16,17,18]. In the microstructure of the fusion zone of the weld seam, the morphology and distribution of acicular martensite also changed with the increase in oscillating amplitude. As can be seen from the figure, the collapse of the weld when A = 3 was mainly due to excessive welding heat input. When the oscillating amplitude was 1 mm, there was a relatively large distribution of columnar crystals in the fusion zone of the weld seam, and the acicular martensite was relatively fine. This is because, under such parameters, the laser beam oscillates to stir the weld pool, promoting rapid cooling and thus contributing to grain refinement. However, when the oscillating amplitude is excessively large, such as in the case of A = 3 mm shown in Figure 5d, overburning occurs in the weld seam, leading to dendrite-like white structures inside the grains and coarsened acicular martensite. This indicates that excessive heat input results in grain growth and coarsening, thereby affecting the mechanical properties of the weld seam. Figure 5 reveals the significant impact of oscillating amplitude on the microstructure of the weld seam. By reasonably adjusting the oscillating amplitude, fine control over the morphology of the weld seam, the heat-affected zone, and the microstructure of the fusion zone can be achieved, resulting in weld joints with excellent performance.
Figure 6 shows the grain size distribution in the fusion zone of welds under different oscillation amplitudes, as well as how the maximum and average grain sizes vary with the oscillation amplitudes. Carefully observing Figure 6 and combining it with the content of Figure 5, we can see that the change in oscillation amplitude had a significant impact on the grain size and its distribution in the microstructure of the fusion zone. The average grain sizes in the fusion zone were 138.7 μm, 124.5.5 μm, 136.1 μm, and 153.2 μm when A = 0.2 mm, A = 1 mm, A = 2 mm, and A = 3 mm, respectively. When the oscillation amplitude A was 1 mm, the grain size in the fusion zone was mainly distributed within the range of 80–200 μm, and the average grain size was relatively small. This is because, under this oscillation parameter, the molten pool undergoes repeated heating and cooling cycles during the oscillation process, forming a complex thermal cycle that promotes the recrystallization and recrystallization of grains, effectively refining the grains and maintaining the grain size at a relatively small level. As the oscillation amplitude increased, the distribution range of grain sizes widened, and the average grain size also increased [15,19,20]. This is because a larger oscillation amplitude may cause the molten pool to undergo greater mechanical disturbance and heat input during the oscillation process. Although this helps to homogenize the fusion zone, it may also hinder the grain refinement mechanism to a certain extent, resulting in a larger number of large-sized grains and a more dispersed distribution.
Figure 7 shows the microstructure of the weld when A = 1 mm. Figure 7a–c shows the microstructures from the base metal to the weld center. From the figure, we can see the morphology and distribution of the acicular martensite from the base metal to the weld center. Combined with Figure 8 and Figure 9, the composition of the weld microstructure can be analyzed. In the heat-affected zone of the weld, due to the effect of the welding heat cycle, some α and β phases underwent a transformation, but the transformation was incomplete, and there were still original α phases and residual β phases. The microstructure at the weld center was composed entirely of acicular martensite, indicating that the region has been subjected to sufficiently high heat input, and the base metal microstructure has been completely transformed into acicular α′ martensite. The surface analysis of different areas of the weld was carried out, as shown in Figure 8. As can be seen from the figure, the element distribution of the weld was very uniform, and the uniform element distribution could ensure that the mechanical properties of the weld area (such as strength, toughness, hardness, etc.) were more consistent with the base material, avoiding the weakness caused by local performance differences.

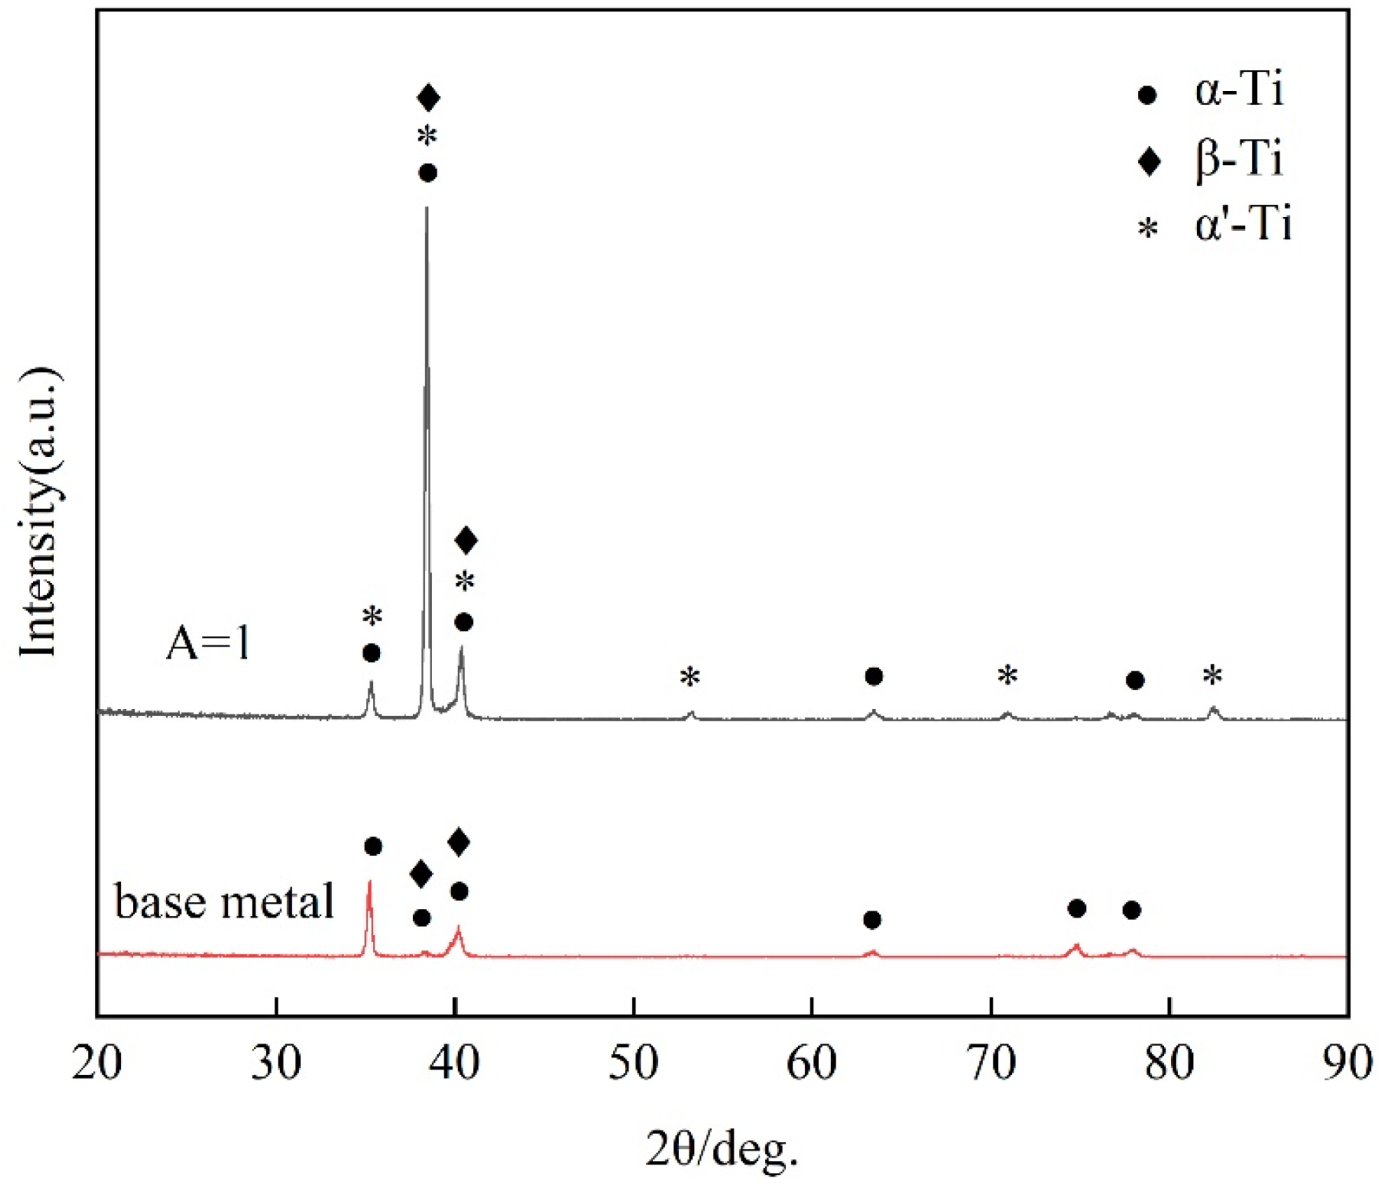
3.3. Phase Transition and XRD Analysis

Figure 8 shows the equilibrium phase diagram of TC4 titanium alloy calculated using Jmat-pro, which can predict the phases in the weld seam of TC4 titanium alloy and provide strong evidence for further determining the phases in the weld seam. In Figure 9a, we observe that during the heating process, the α phase gradually transforms into the β phase, and when the temperature rises to 984 °C, the α phase completely transforms into the β phase. This process can be expressed as initial β phase + initial α phase → high-temperature β phase. During the cooling process of the molten pool in Figure 9b, the β phase transforms into α phase and martensite. After the temperature drops to 480 °C, the β phase transformation ends, but the content of the β phase is not zero at this time, which is called the residual β phase. This process can be expressed as high-temperature β phase → secondary α phase + martensite + residual β phase. Based on the above phase transition process, the phase transition process in the fusion zone of the weld seam can be calculated as follows: under the action of the laser, the contact position of the TC4 titanium alloy sheet melts to form a molten pool. During this process, the solid phase originally based on the initial α phase disappears, forming a liquid molten pool composed of the high-temperature β phase. Then, the molten pool cools rapidly and enters the solidification process, during which the liquid molten pool (high-temperature β phase) disappears, forming a weld seam composed of martensite, secondary α phase, and a small amount of residual β phase.
Figure 10 is a comparative XRD diagram of the cross-section of the weld seam and the base metal of TC4 titanium alloy with a laser swing amplitude of A = 1 mm. Through comparative analysis, we can clearly observe that after the application of swinging laser welding, the initial α phase in the weld seam was significantly reduced, and some peaks of the α phase disappeared while a new α′ phase emerged. This change indicates that during the laser welding process, due to the heat input of the high-energy beam and the influence of rapid cooling conditions, the microstructure of TC4 titanium alloy had undergone significant transformation [21,22,23]. Combining Figure 5 and Figure 7, we can further determine the microstructure composition of different regions of the weld seam. The fusion zone of the weld seam was mainly composed of acicular α′ martensite, a secondary α phase, and a residual β phase. In the heat-affected zone of the weld seam, the phase composition was more complex, consisting primarily of acicular α′ martensite, an initial α phase, a secondary α phase, and a residual β phase. The presence of these phases was caused by the phase transformation and microstructure evolution mechanisms during the laser welding process.

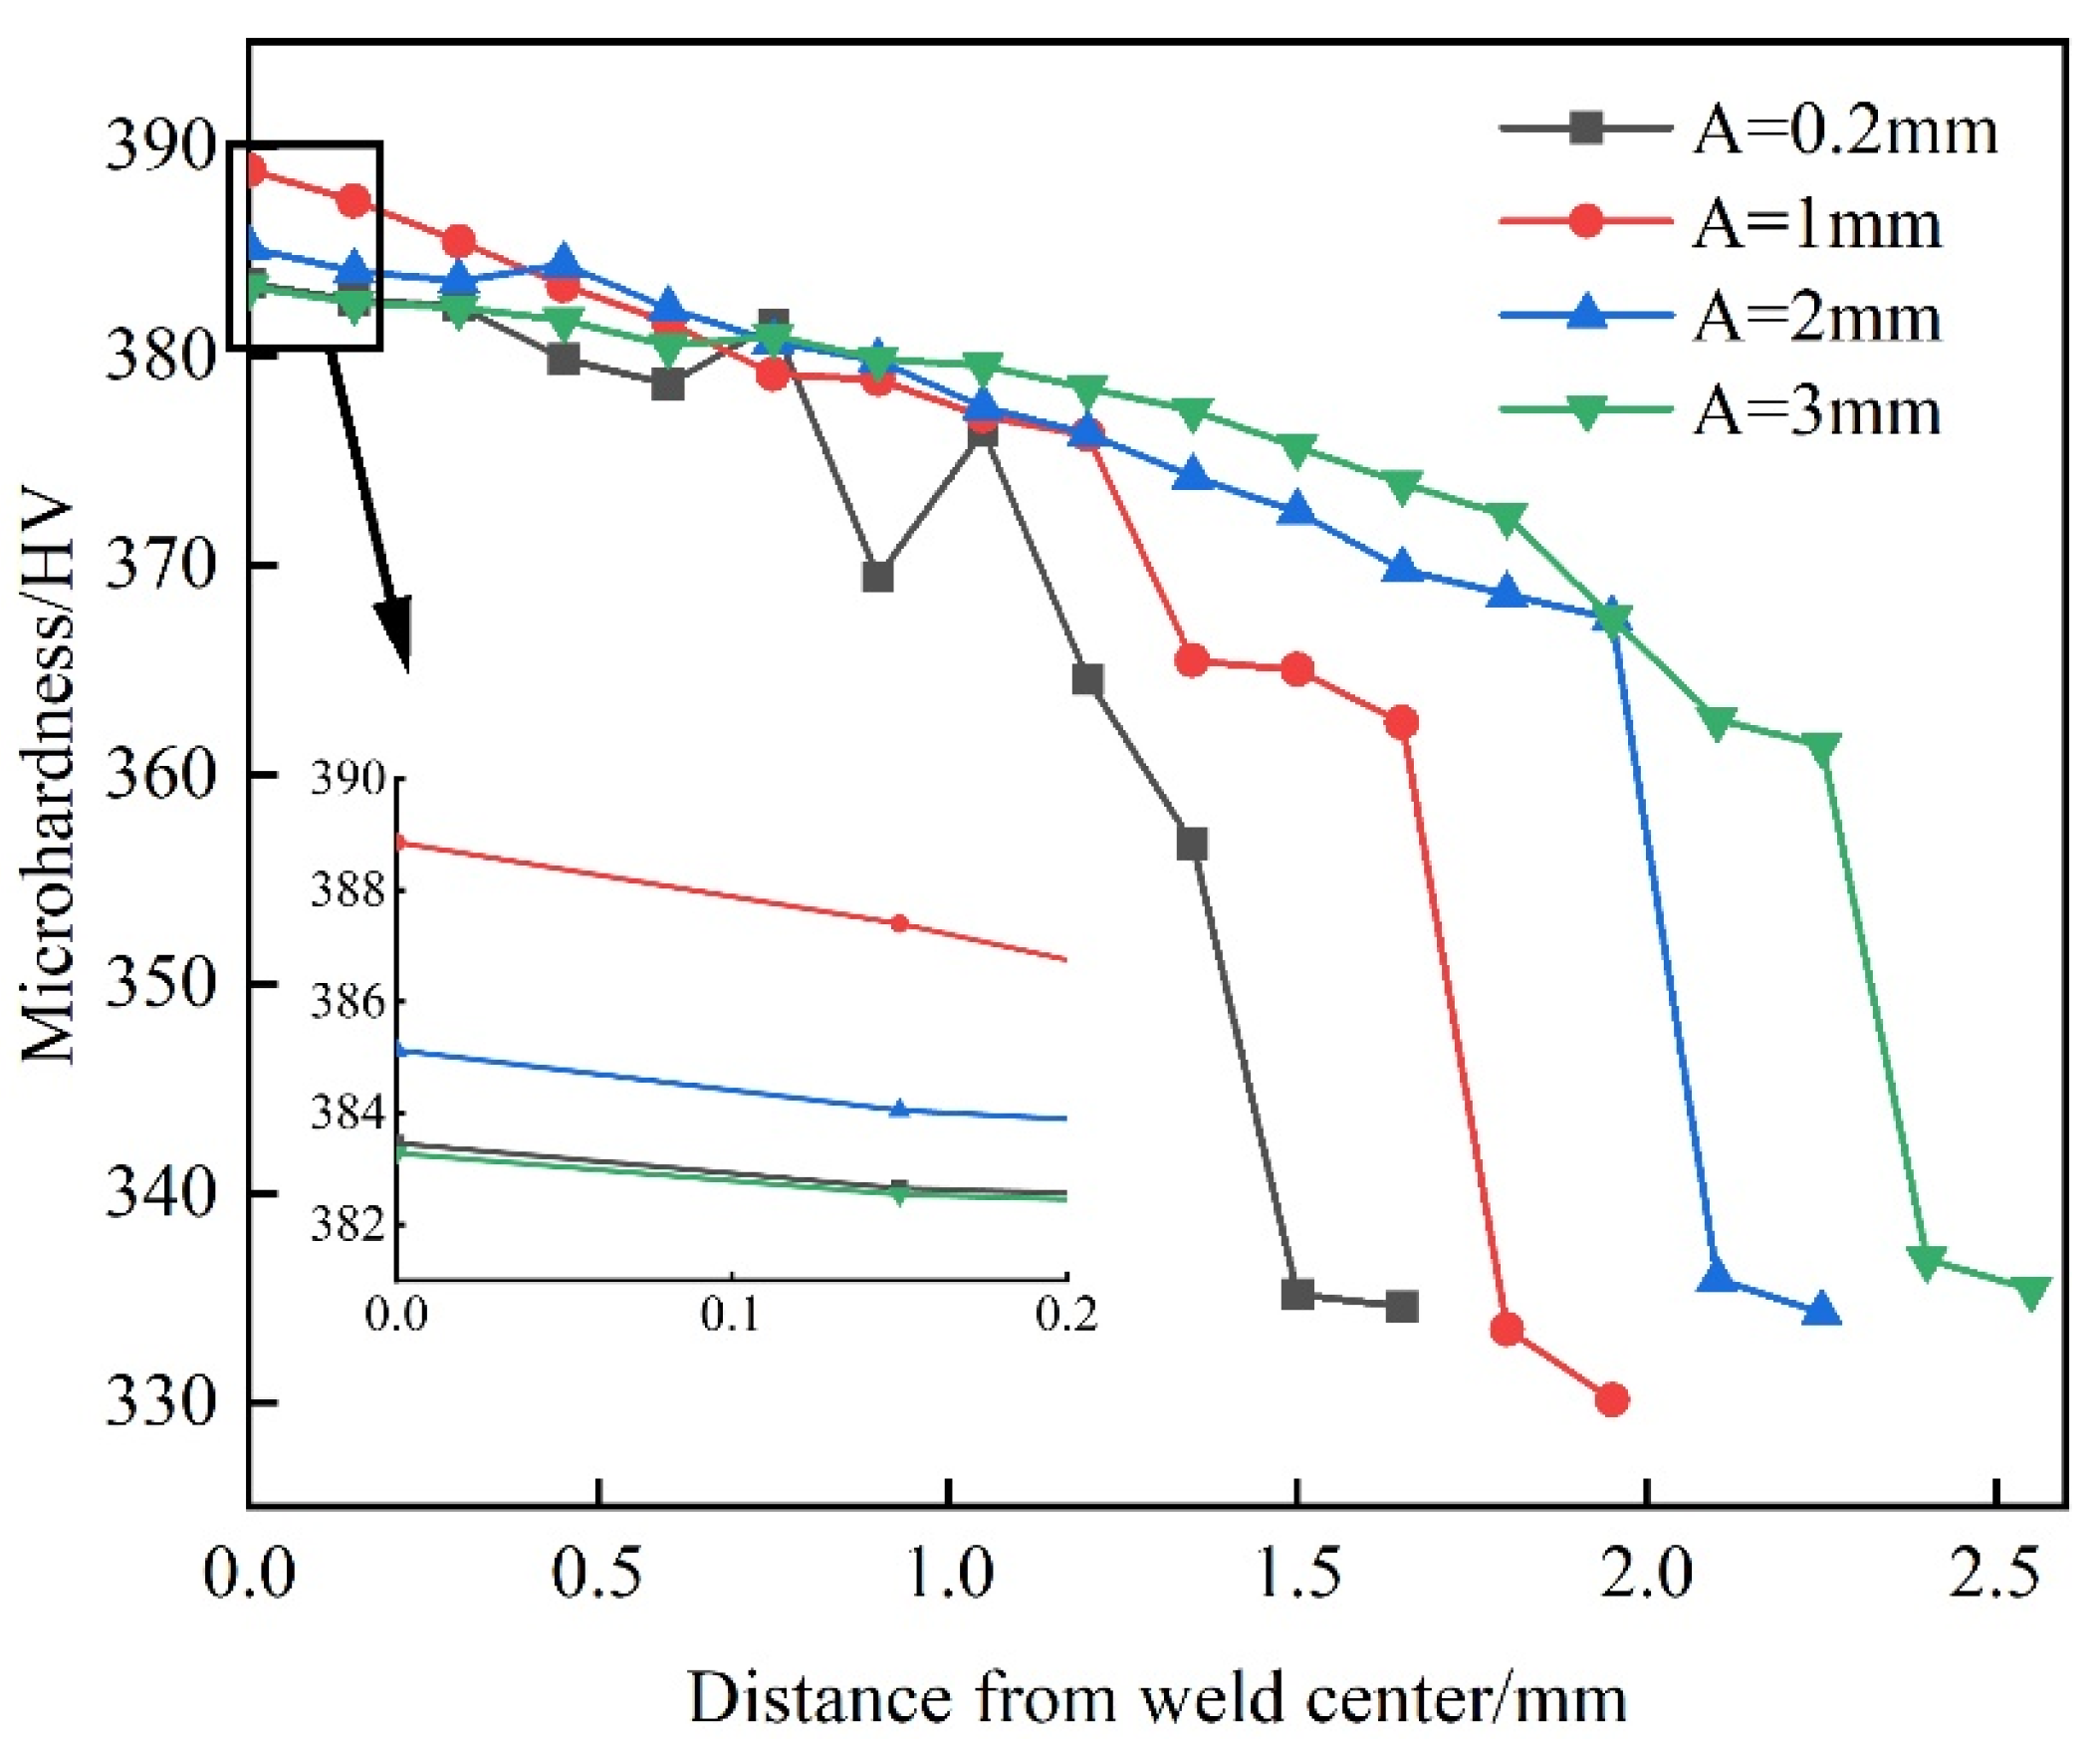
3.4. Analysis of Mechanical Properties of Weld Seams

Figure 11 depicts the tensile properties of samples under different wobble amplitudes. It can be observed from the figure that the tensile strengths and post-fracture elongations of specimens with A = 0.2 mm, A = 1 mm, A = 2 mm, and A = 3 mm were 1090.4 MPa, 1115.4 MPa, 1099.5 MPa, 1090.7 MPa, and 10.6%, 12.6%, 14%, 11%, respectively. The fracture locations of tensile samples are illustrated in Figure 11b. When A = 1 mm, the tensile strength of the weld was greater than that of the base material (1100 MPa), and when A = 2 mm, the tensile strength of the weld was similar to that of the base material, and the tensile part broke at the base material under both parameters. At A = 0.2 mm, the laser wobble amplitude was relatively small, resulting in a shorter duration for the keyhole to open. As a result, gases entering the keyhole failed to escape promptly, leading to the formation of pores. The presence of pores reduced the effective bearing area of the weld seam and caused stress concentration in the surrounding tissue under load, thereby decreasing the tensile strength of the weld seam. This is also confirmed by the presence of pores in the fracture after stretching. When A = 1 mm, the size of the acicular martensite in the weld seam was smaller, which increased the dislocation density and, consequently, enhanced the material’s strength. However, the interlaced acicular martensite structure tended to induce stress concentration, thereby reducing the ductility and toughness of the weld seam. At A = 2 mm, the acicular martensite present in the weld seam provided a lower dislocation density and larger grains, indicating fewer dislocations per unit grain volume. This typically leads to slightly lower material strength but increased toughness [24,25,26]. As seen in Figure 5, when A = 3 mm, the martensite in the weld seam was excessively coarse, and there was an overburning phenomenon in the weld seam. Overburning results in significantly enlarged grains of the weld metal, thereby reducing the strength of the weld seam. Additionally, the coarse acicular martensite restricted the movement of dislocations, further reducing the ductility of the material.
Figure 12 shows the hardness distribution from the weld center to the base metal under different swing amplitudes. As can be seen from the figure, the maximum hardness values of the weld seams at A = 0.2 mm, A = 1 mm, A = 2 mm, and A = 3 mm are 383.46 HV, 388.86 HV, 385.13 HV, and 383.28 HV, respectively. The overall hardness distribution from the weld center to the base metal shows a downward trend. As can be seen from the figure, the hardness distribution of the weld seam was irregular when A = 0.2 mm, mainly due to the presence of pores in the weld seam. The existence of pores damaged the coherence between grains inside the weld seam to a certain extent, hindered dislocation movement, and increased the local hardness of the weld seam. Therefore, although the weld seam hardness value at A = 0.2 mm was higher, its hardness source was not consistent but was affected by pores, showing an unstable distribution characteristic. As the laser swing amplitude increases, i.e., when A = 1 mm, A = 2 mm, and A = 3 mm, the maximum hardness of the weld seam shows a downward trend. When A = 1 mm, the weld seam hardness was the highest, reaching 388.86 HV, mainly due to the formation of more fine needle-like martensite in the weld seam structure at this time. These fine needle-like martensites had a larger surface area to volume ratio, significantly increasing the dislocation density, which means that the material needs to overcome higher energy during plastic deformation, making the weld seam stronger against plastic deformation. The formation of needle-like martensite leads to hindered crystal slippage [15,27,28,29]. This hindrance effect increased with the increase in dislocation density, ultimately manifesting as a significant increase in material hardness.

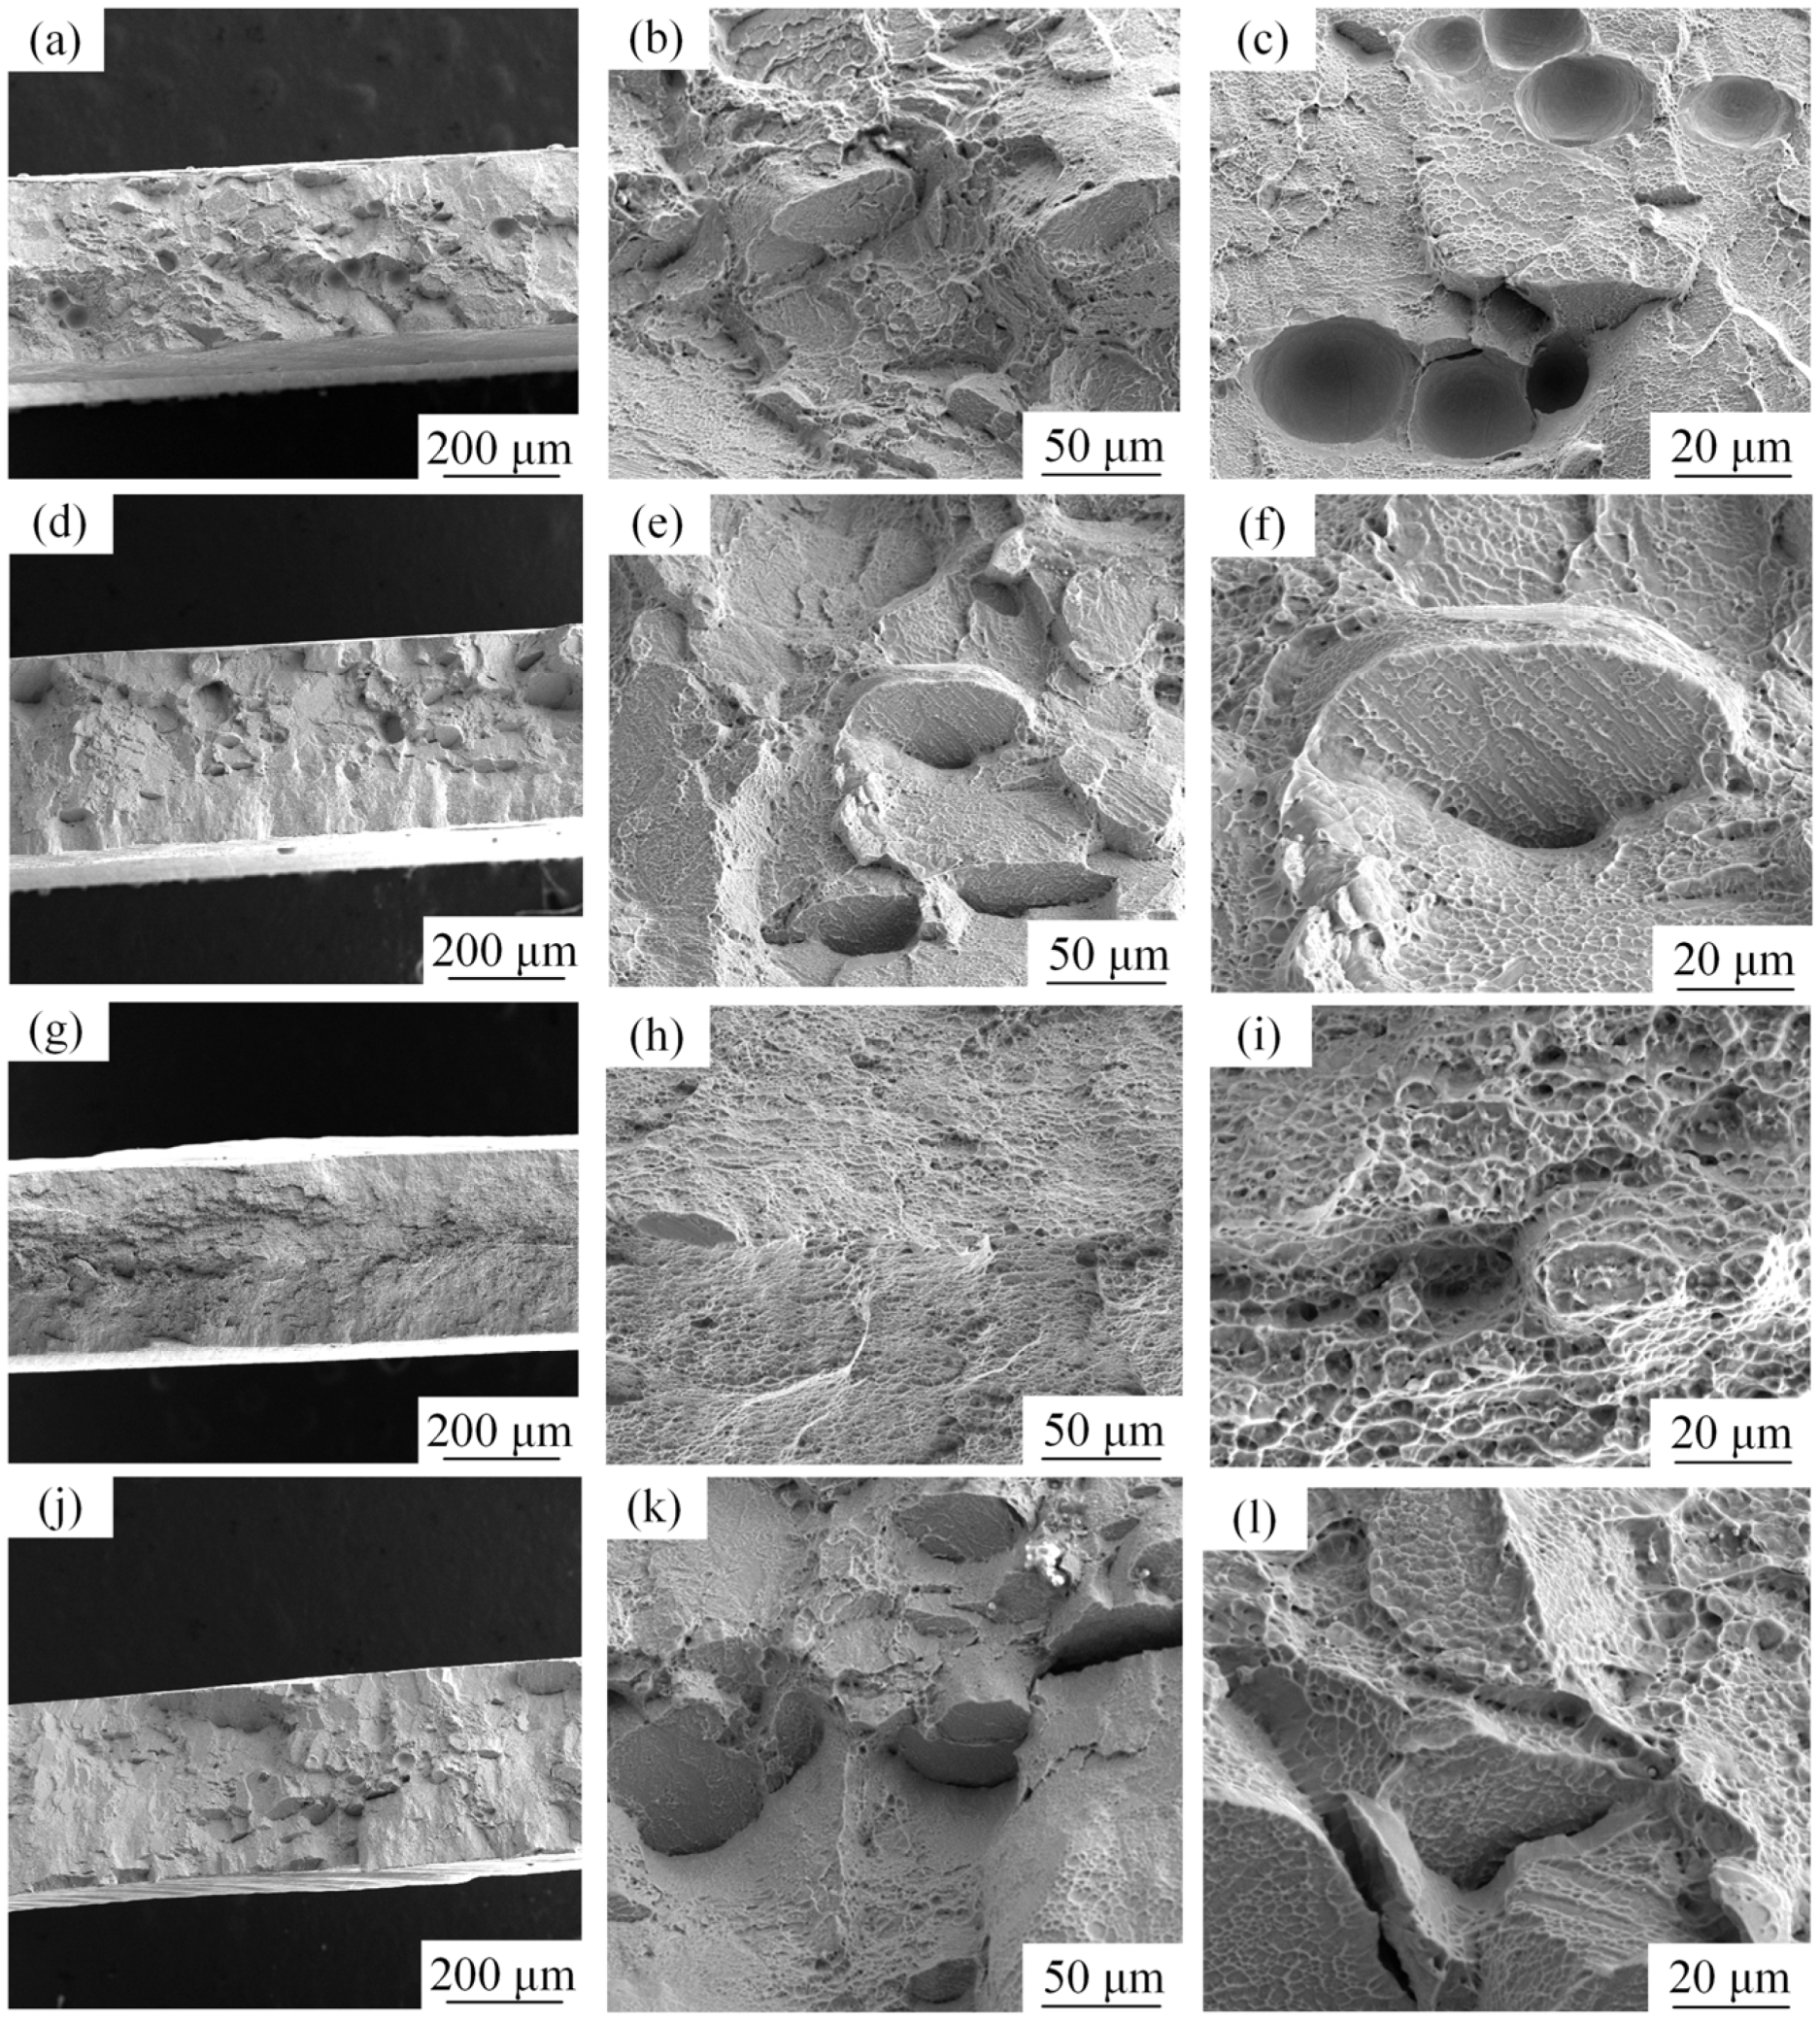
3.5. Fracture Surface Analysis

Figure 13 presents scanning electron microscope (SEM) images of tensile fracture surfaces under different oscillation amplitudes. By observing these images, we can conduct an in-depth analysis of the fracture behavior and mechanism of the material under different conditions. When A = 0.2 mm, A = 1 mm, and A = 3 mm, there were tearing ridges and dimples on the fracture surfaces, indicating that the fracture mode was a quasi-cleavage fracture between cleavage fracture and ductile fracture, accompanied by significant plastic deformation during the fracture process. When A = 2 mm, the fracture type of the tensile part belonged to ductile fracture [30,31]. Figure 13a–c shows that small pits and holes exist on the fracture surface when A = 0.2 mm, which were mainly caused by the pores in the weld seam. When A = 2 mm, the distribution, size, and depth of the dimples on the entire fracture surface are uniform. When A = 3 mm, large cleavage steps and microcracks existed on the fracture surface, primarily due to the overburning phenomenon in the weld seam. The overburned weld seam structure usually becomes more brittle as coarse grains increase stress concentration and reduce the material’s plastic deformation ability, thereby increasing the risk of crack formation and propagation.

4. Conclusions

This study focused on the effect of different oscillation amplitudes on the microstructure and mechanical properties of welds in 1 mm thick TC4 titanium alloy sheets welded with laser oscillating welding. When the swing amplitude A = 1 mm, the average grain size of the weld is the smallest, the microhardness of the weld is the highest (388.86 HV), the tensile strength is the largest (1115.4 MPa), and the fracture mechanism is a ductile fracture. When the oscillation amplitude A = 2 mm, the elongation of the tensile part is the largest (14%), and the fracture mechanism is a ductile fracture.
  • The weld molding of laser swing welding and continuous laser welding is different, the laser swing welding forms a fish-scale weld, and the heat-affected zone of the weld is narrower than that of the continuous laser welding weld, and the tensile property of the weld is improved, even higher than that of the base material.
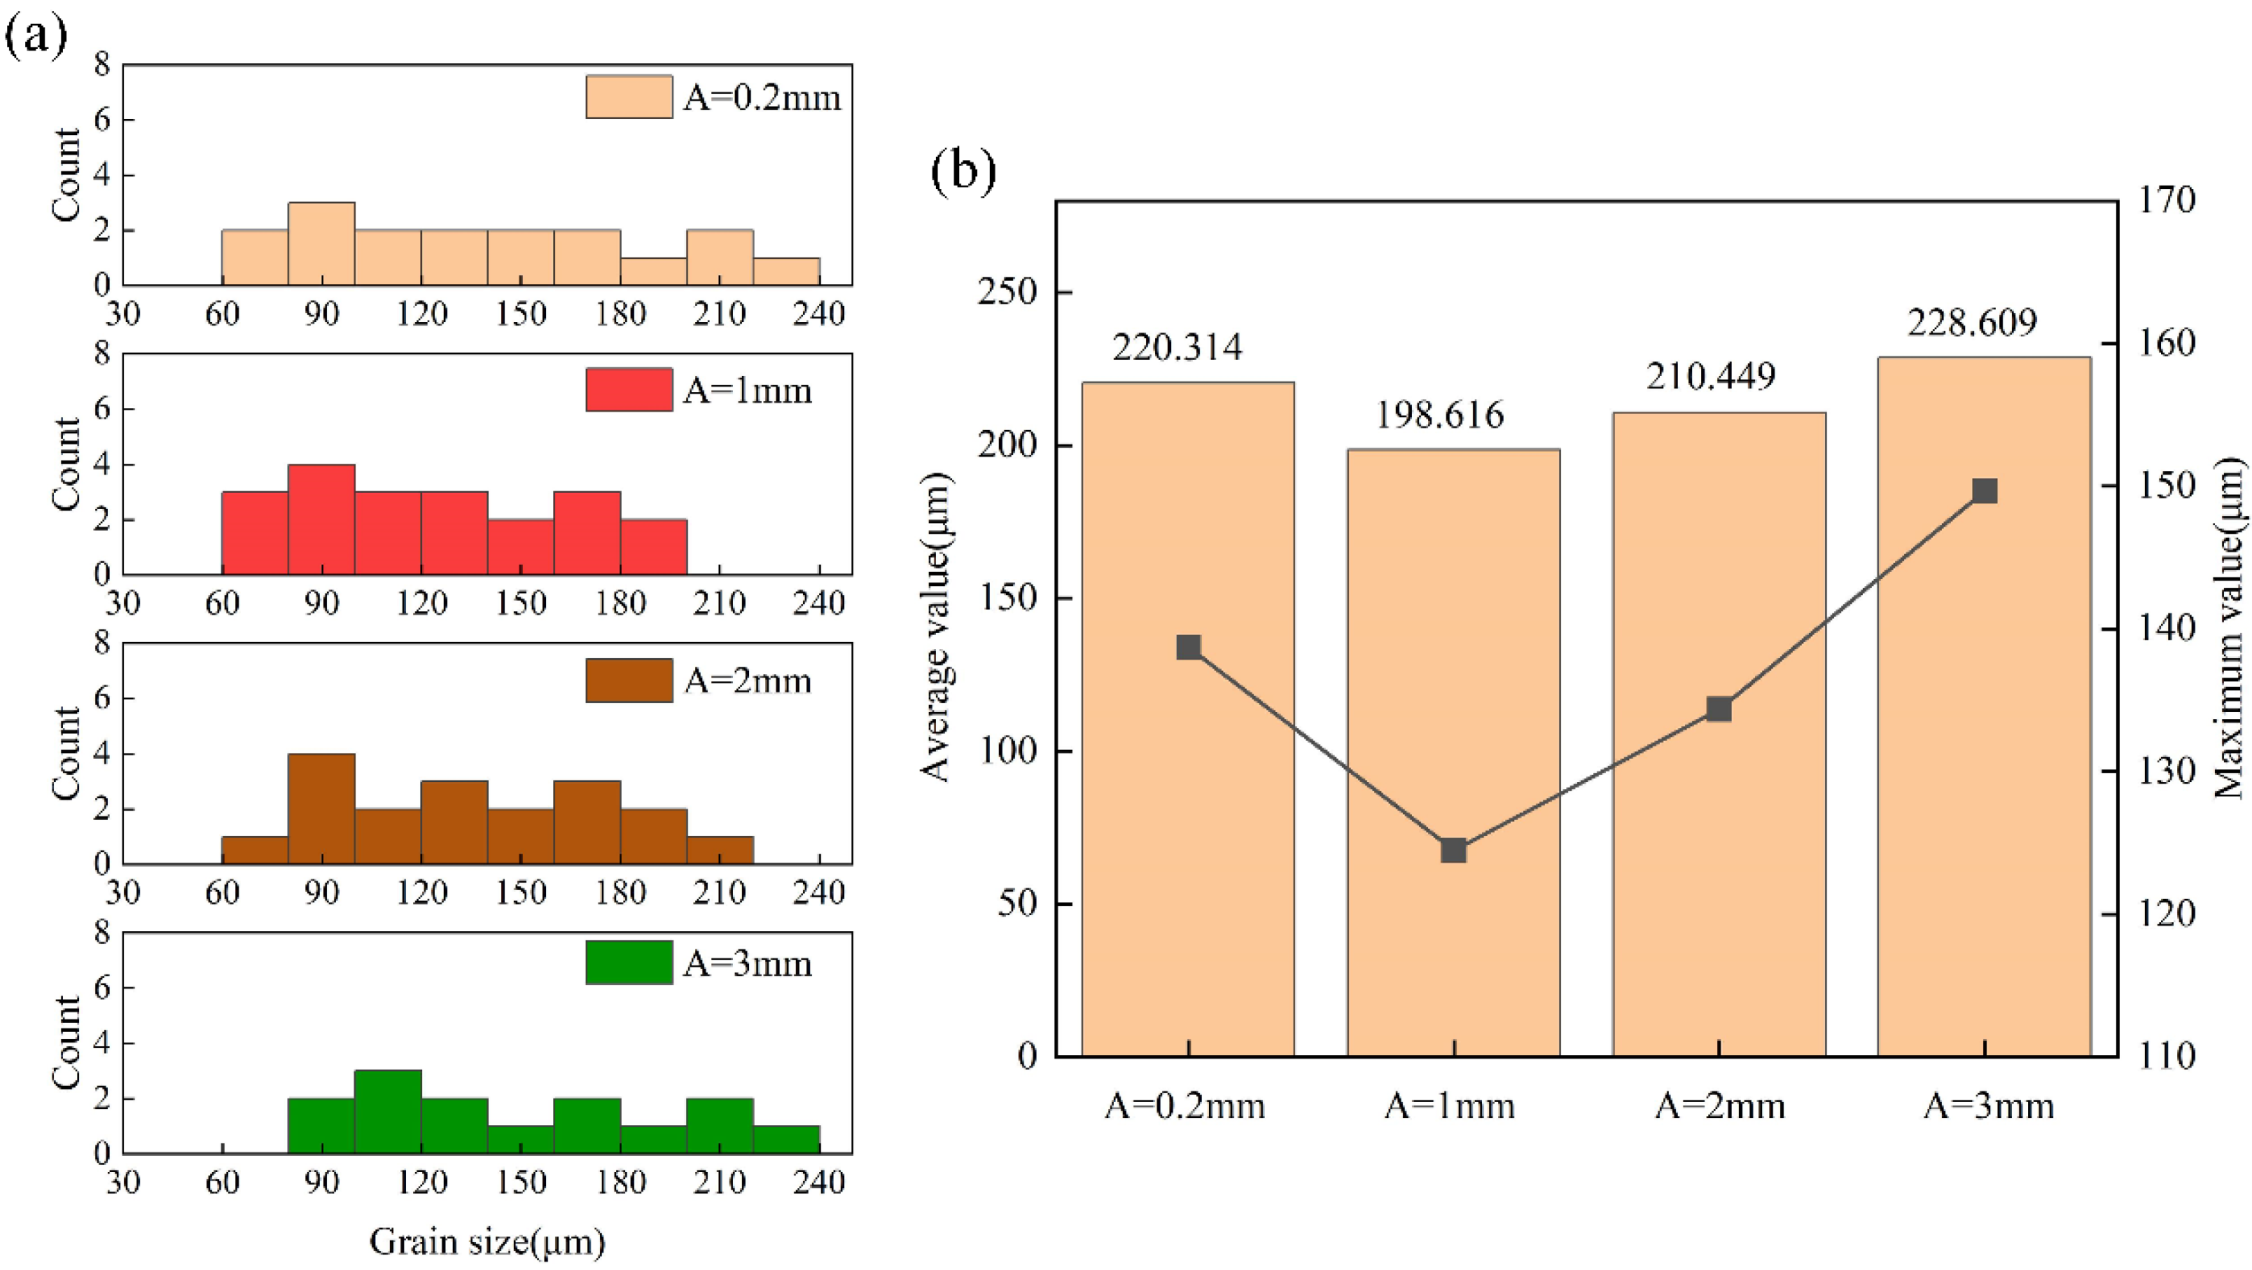
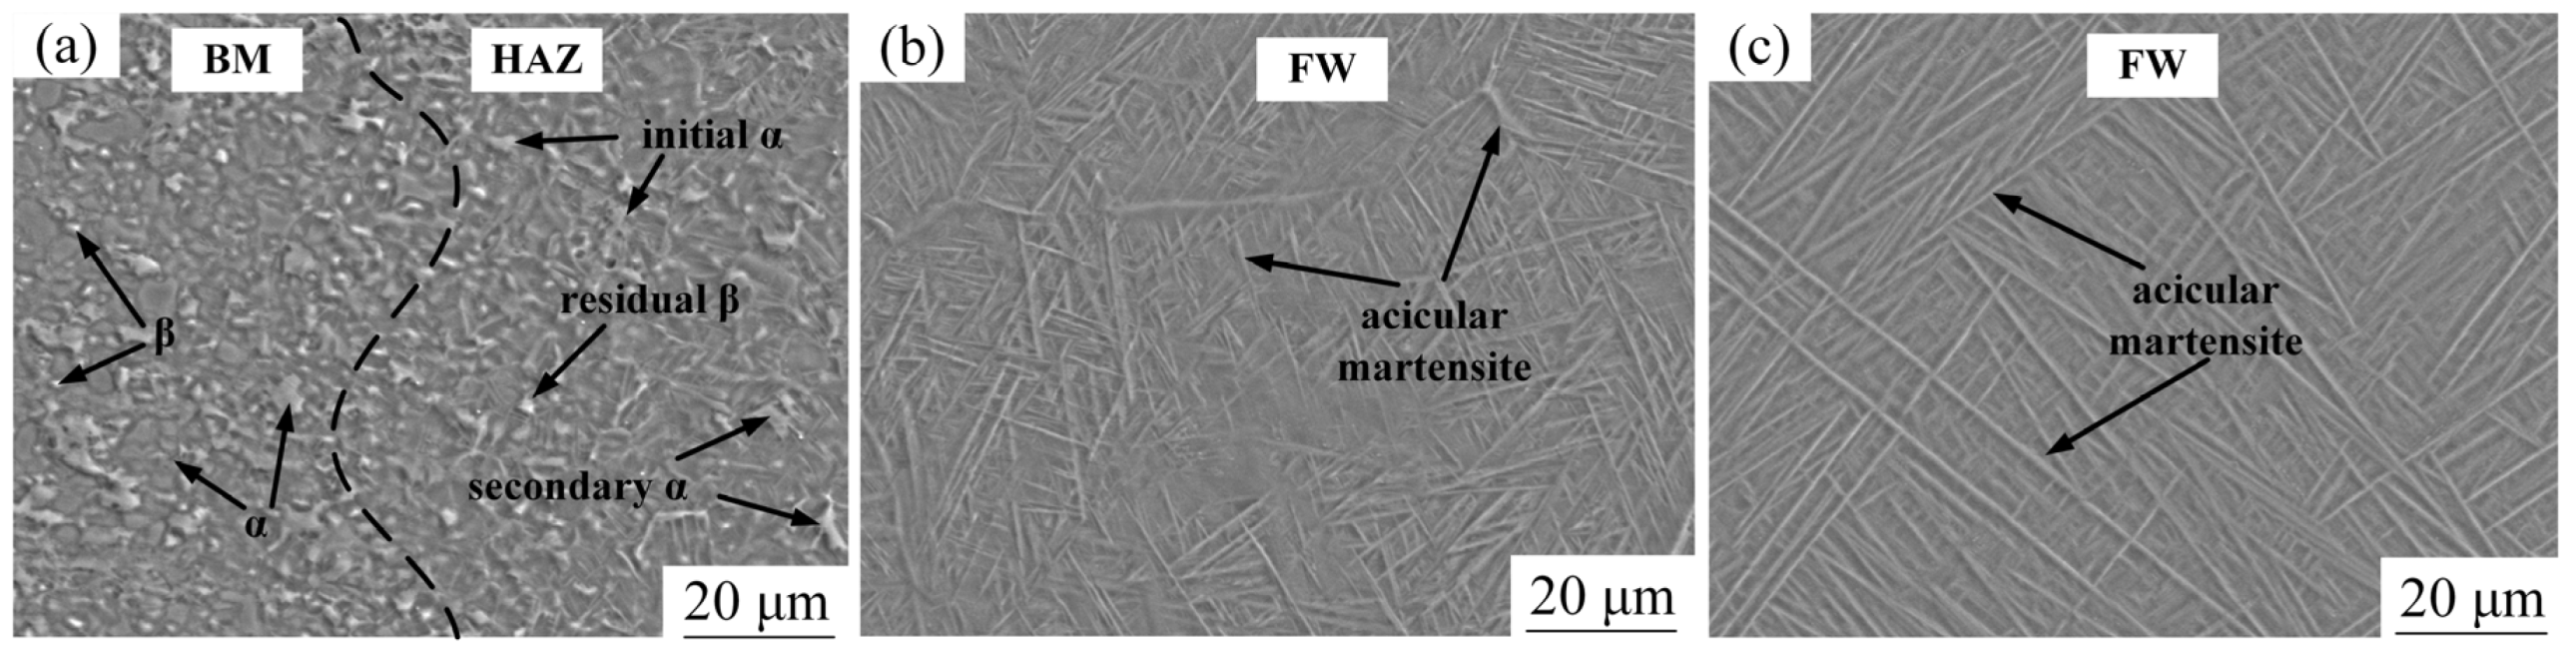
  • With the increase of swing amplitude, the width of the weld and the width of the fusion zone become wider, and the tensile strength of the weld first increases and then decreases. The weld microstructure is mainly composed of acicular α′ martensite, initial α phase, secondary α phase, and residual β phase, and there are net basket structures in the weld fusion zone, but the martensite morphology is different. A smaller swing amplitude may be more beneficial to the formation of pores, while a larger swing amplitude will lead to the stomata of the weld, so it is very important to select the appropriate swing amplitude.
  • With the increase of swing amplitude, the tensile strength and elongation of the weld also change. When A = 1 mm, the tensile strength of the weld is maximum, but the elongation is not large. When A = 2 mm, the elongation of the weld is maximum, but part of the strength is sacrificed.

Author Contributions

Conceptualization, J.L. and Z.L.; methodology, Z.L.; software, J.L.; validation, J.L. and Z.L.; formal analysis, J.L. and Z.L.; investigation, J.L.; resources, Z.L.; data curation, Z.L.; writing—original draft preparation, J.L.; writing—review and editing, Z.L.; visualization, Z.L.; supervision, Z.L.; project administration, Z.L.; funding acquisition, Z.L. All authors have read and agreed to the published version of the manuscript.

Funding

This research was funded by the Doctoral Start-up Foundation of Liaoning Province (grant number: 2023-BS-195) and the Basic Scientific Research Project of the Liaoning Provincial Department of Education (grant number: LJKMZ20220960).

Data Availability Statement

The data presented in this study are available on request from the corresponding author. The data are not publicly available due to some of the data involving confidential information.

Conflicts of Interest

The authors declare no conflict of interest.

References

  1. Wei, Y.; Ma, Q.; Wu, P.; Chen, B.; Zou, J.; Cao, H.; Bai, H. Research progress in laser welding technology of TC4 titanium alloy. Electr. Weld. Mach. 2023, 53, 55–66. [Google Scholar]
  2. Liu, Z.; Dai, F.; Lu, G.; Zhang, H.; Shen, Z. Research status and prospect of laser welding of titanium alloy. Mater. Rep. 2023, 37, 354–359. [Google Scholar]
  3. Long, J.; Zhang, L.; Zhuang, M.; Bai, L.; Na, S. Narrow-gap laser welding with beam wobbling and filler wire and microstructural performance of joints of thick TC4 titanium alloy plates. Opt. Laser Technol. 2022, 152, 108089. [Google Scholar]
  4. Kar, J.; Chakrabarti, D.; Roy, S.; Roy, G. Beam oscillation, porosity formation and fatigue properties of electron beam welded Ti-6Al-4V. Alloy J. Mater. Process. Technol. 2019, 266, 165–172. [Google Scholar] [CrossRef]
  5. Quazi, M.; Ishak, M.; Fazal, M.; Arslan, A.; Rubaiee, S.; Qaban, A.; Aiman, M.; Sultan, T.; Ali, M.; Manladan, S. Current research and development status of dissimilar materials laser welding of titanium and its alloys. Opt. Laser Technol. 2020, 126, 106090. [Google Scholar] [CrossRef]
  6. Auwal, S.; Ramesh, S.; Yusof, F.; Manladan, S. A review on laser beam welding of titanium alloys. Int. J. Adv. Manuf. Technol. 2018, 97, 1071–1098. [Google Scholar] [CrossRef]
  7. Huang, J.; Kong, L.; Wang, M.; Hua, X.; Li, F. Welding of titanium and titanium alloys thin sheets. Weld. Technol. 2018, 47, 1–5. [Google Scholar]
  8. Kotlarski, G.; Kaisheva, D.; Ormanova, M.; Stoyanov, B.; Dunchev, V.; Anchev, A.; Valkov, S. Electron-beam welding of titanium and Ti6Al4V alloy. Metals 2023, 13, 1065. [Google Scholar] [CrossRef]
  9. Caiazzo, F.; Alfieri, V.; Fierro, I.; Sergi, V. Investigation and optimization of disk-laser welding of 1 mm thick Ti-6Al-4V titanium alloy sheets. Adv. Mech. Eng. 2015, 7, 373561. [Google Scholar] [CrossRef]
  10. Balasubramanian, T.; Balasubramanian, V.; Manickam, M. Fatigue crack growth behaviour of gas tungsten arc, electron beam and laser beam welded Ti-6Al-4V alloy. Mater. Des. 2011, 32, 4509–4520. [Google Scholar] [CrossRef]
  11. Ghosh, P.; Sen, A.; Chattopadhyaya, S.; Sharma, S.; Singh, J.; Li, C.; Królczyk, G.; Rajkumar, S. Progressive developments and challenges in dissimilar laser welding of steel to various other light alloys (Al/Ti/Mg): A comprehensive review. Heliyon 2022, 8, e11710. [Google Scholar] [CrossRef] [PubMed]
  12. Chang, B.; Yuan, Z.; Cheng, H.; Li, H.; Du, D.; Shan, J. A Study on the Influences of Welding Position on the Keyhole and Molten Pool Behavior in Laser Welding of a Titanium Alloy. Metals 2019, 9, 1082. [Google Scholar] [CrossRef]
  13. Hagenlocher, C.; Sommer, M.; Fetzer, F.; Weber, R.; Graf, T. Optimization of the solidification conditions by means of beam oscillation during laser beam welding of aluminum. Mater. Des. 2018, 160, 1178–1185. [Google Scholar] [CrossRef]
  14. Zhou, J.; Zhou, D.; Liu, J. Effect of oscillating laser beam on the interface and mechanical properties of Ti/Al fusion welding joint. J. Mater. Res. Technol. 2022, 19, 1993–2007. [Google Scholar] [CrossRef]
  15. Li, T.; Wan, Y.; Bi, Z.; Yang, S.; Wu, D.; Lei, Y. Weld formation and porosity in TC4 joint by oscillating laser beam welding with circle trajectory model. J. Mater. Res. Technol. 2024, 30, 2680–2689. [Google Scholar] [CrossRef]
  16. Zhang, Y.; Zhu, Z.; Liu, J.; Lu, G.; Zhang, L. Research on laser welding of 1.2 mm thick TC4 titanium alloy. Appl. Laser 2019, 39, 596–601. [Google Scholar]
  17. Ai, Y.; Wang, Y.; Yan, Y.; Han, S.; Huang, Y. The evolution characteristics of solidification microstructure in laser welding of Ti-6Al-4V titanium alloy by considering transient flow field. Opt. Laser Technol. 2024, 170, 110195. [Google Scholar] [CrossRef]
  18. Fu, H.; Liu, G.; Xie, H.; Jiang, W.; Shi, J. Research on the microstructure and mechanical properties of 1.5 mm thick TC4 titanium ally laser welded joint. Mach. Met. Form. 2022, 3, 33–36. [Google Scholar]
  19. Xu, Z.; Dong, Z.; Yu, Z.; Wang, W.; Zhang, J. Relationships between microhardness, microstructure, and grain orientation in laser-welded joints with different welding speeds for Ti6Al4V titanium alloy. Trans. Nonferrous Met. Soc. China 2020, 30, 1277–1289. [Google Scholar] [CrossRef]
  20. Girerd, T.; Gameros, A.; Simonelli, M.; Norton, A.; Clare, A. Modulation of melt pool behaviour using novel laser beam oscillation methods. J. Mater. Process. Technol. 2024, 325, 118300. [Google Scholar] [CrossRef]
  21. Li, C.; Li, B.; Wu, Z.; Qi, X.; Ye, B.; Wang, A. Stitch welding of Ti-6Al-4V titanium alloy by fiber laser. Trans. Nonferrous Met. Soc. China 2017, 27, 91–101. [Google Scholar] [CrossRef]
  22. Xu, P.; Li, L.; Zhang, C. Microstructure characterization of laser welded Ti-6Al-4V fusion zones. Mater. Charact. 2014, 87, 179–185. [Google Scholar] [CrossRef]
  23. Kumar, B.; Bag, S.; Paul, C.; Das, C.; Ravikumar, R.; Bindra, K. Influence of the mode of laser welding parameters on microstructural morphology in thin sheet Ti6Al4V alloy. Opt. Laser Technol. 2020, 131, 106456. [Google Scholar] [CrossRef]
  24. Omoniyi, P.; Mahamood, M.; Jen, T.; Akinlabi, E. TIG welding of Ti6Al4V alloy: Microstructure, fractography, tensile and microhardness data. Data Brief. 2021, 38, 107274. [Google Scholar] [CrossRef] [PubMed]
  25. Jiang, Z.; Chen, X.; Li, H.; Lei, Z.; Chen, Y.; Wu, S.; Wang, Y. Grain refinement and laser energy distribution during laser oscillating welding of Invar alloy. Mater. Des. 2020, 186, 108195. [Google Scholar] [CrossRef]
  26. Le, T.; Faivre, N.; Vakili-Farahani, F.; Wasmer, K. Energy-efficient laser welding with beam oscillating technique—A parametric study. J. Clean. Prod. 2021, 313, 127796. [Google Scholar]
  27. Liu, J.; Wang, M.; Zhang, P.; Chen, Y.; Wang, S.; Wu, T.; Xie, M.; Wang, L.; Wang, K. Texture refinement and mechanical improvement in beam oscillation superimposed laser welding of TiAl-based alloy. Mater. Charact. 2022, 188, 111892. [Google Scholar] [CrossRef]
  28. Wu, M.; Luo, Z.; Li, Y.; Liu, L.; Ao, S. Effect of oscillation modes on weld formation and pores of laser welding in the horizontal position. Opt. Laser Technol. 2023, 158, 108801. [Google Scholar] [CrossRef]
  29. Horník, P.; Šebestová, H.; Novotný, J.; Mrňa, L. Laser beam oscillation strategy for weld geometry variation. J. Manuf. Process. 2022, 84, 216–222. [Google Scholar] [CrossRef]
  30. Zhong, Q.; Zhao, Z.; Zhang, Z. Development of “fractography” and research of fracture micromechanism. J. Mech. Strength 2005, 3, 358–370. [Google Scholar]
  31. Eremin, A.; Panin, S.; Sharkeev, Y. Fatigue behaviour of CG and UFG titanium: DIC and fractography studies. IOP Conf. Ser. Mater. Sci. Eng. 2019, 511, 012012. [Google Scholar] [CrossRef]
Figure 1. Microstructure of 1 mm thick TC4 titanium alloy.
Metals 14 00893 g001
Figure 2. Welding assembly drawing.
Metals 14 00893 g002
Figure 3. Size of the tensile specimen (unit: mm).
Metals 14 00893 g003
Figure 4. Weld morphology: (a) A = 0.2 mm, face of weld; (b) A = 0.2 mm, back of weld; (c) A = 1 mm, face of weld; (d) A = 1 mm, back of weld; (e) A = 2 mm, face of weld; (f) A = 2 mm, back of weld; (g) A = 3 mm, face of weld; (h) A = 3 mm, back of weld.
Metals 14 00893 g004
Figure 5. Microstructure of weld seam: (a) A = 0.2 mm; (b) A = 1 mm; (c) A = 2 mm; (d) A = 3 mm.
Metals 14 00893 g005
Figure 6. Grains in the fusion zone of weld seam: (a) grain size distribution diagram; (b) distribution diagram of maximum and average grain size.
Metals 14 00893 g006
Figure 7. Microstructure of weld when A = 1 mm: (a) Interface of base material and heat affected zone; (b) Fusion zone; (c) Fusion zone.
Metals 14 00893 g007
Figure 8. Distribution of elements in different areas of the weld: (a) Interface of base material and heat affected zone; (b) Fusion zone; (c) Fusion zone.
Metals 14 00893 g008
Figure 9. TC4 titanium alloy phase transition: (a) phase transition at temperature rise; (b) phase transition during cooling.
Metals 14 00893 g009
Figure 10. XRD comparison.
Metals 14 00893 g010
Figure 11. Tensile properties: (a) stress–strain curves of tensile samples with different parameters; (b) fracture locations of tensile samples; (c) line graph of tensile strength and elongation.
Metals 14 00893 g011
Figure 12. Distribution chart of weld joint hardness.
Metals 14 00893 g012
Figure 13. Fracture section of tensile fracture: (ac) A = 0.2 mm; (df) A = 1 mm; (gi) A = 2 mm; (jl) A = 3 mm.
Metals 14 00893 g013
Table 1. TC4 titanium alloy composition (mass fraction/%).
AlVFeCNHOTi
5.5~6.83.5~4.50.300.010.050.010.2Bal.
Table 2. Welding process parameters.
Experiment NumberLaser Power P (W)Welding Speed v (mm/s)Swing Frequency f (Hz)Swing Amplitude A (mm)
18009500.2
28009501
38009502
48009503
Disclaimer/Publisher’s Note: The statements, opinions and data contained in all publications are solely those of the individual author(s) and contributor(s) and not of MDPI and/or the editor(s). MDPI and/or the editor(s) disclaim responsibility for any injury to people or property resulting from any ideas, methods, instructions or products referred to in the content.

