Article

Analyzing Impact of Processing Parameters and Material Properties on Symmetry of Wire-Arc Directed Energy Deposit Beads

1
Department of Computer Science, Worcester Polytechnic Institute, Worcester, MA 01609, USA
2
Department of Mechanical and Materials Engineering, Worcester Polytechnic Institute, Worcester, MA 01609, USA
*
Author to whom correspondence should be addressed.
Metals 2024, 14(8), 905; https://doi.org/10.3390/met14080905
Submission received: 15 June 2024 / Revised: 31 July 2024 / Accepted: 6 August 2024 / Published: 9 August 2024

Abstract

:
Wire arc-directed energy deposit (wire-arc DED) enables the efficient manufacturing of large-scale metal parts. Many factors can impact overall part quality during manufacturing, including processing parameters such as feed rate, travel speed, and various material properties. Previous works have sought to use machine learning to evaluate and predict these impacts, but they have primarily focused on the width and height of single-layer deposits. Building upon these studies, this work offers a novel technique to characterize and evaluate the asymmetry of deposited beads to better understand the impact these parameters have. Specifically, leveraging time-series analysis techniques, the surface profiles of beads can be compared and analyzed to identify the degree of asymmetry. Additionally, this work relates these factors to the extent to which substrates warp during the depositing of material. With a better understanding of these impacts, manufacturing processes can be optimized for improved quality and reduced waste. These findings highlight that, while material selection and processing parameters do not strongly correlate with bead asymmetry, beads are deposited with varying degrees of asymmetry, requiring further analysis to identify the source. In contrast, substrate warping is significantly influenced by the thermal properties of the materials used. Of the properties analyzed, heat capacity, thermal diffusivity and thermal conductivity were found to be most relevant to substrate warping. Additionally, while to a lesser extent, material properties of the wire were found to be similarly correlated to warping as their substrate counterparts. These insights can inform the optimization of manufacturing processes, leading to improved part quality and reduced material waste. This study also underscores the need for further research into the interplay between processing conditions and material characteristics in wire-arc DED.

Graphical Abstract

1. Introduction

Additive manufacturing (AM) is a manufacturing approach that deposits material layer-by-layer, enabling advancements in manufacturing capabilities across many fields [1,2,3,4,5]. Using AM techniques can reduce material waste, lower housing and transportation costs, and simplify supply chain requirements [6]. This work focused on a specific subset of AM known as wire arc-directed energy deposition (wire-arc DED) or wire arc additive manufacturing (WAAM) [7,8,9]. Wire-arc DED utilizes an electric arc to melt and deposit a metal wire layer-by-layer and is specifically designed for manufacturing large-scale parts. This technology has recently gained traction due to its capability to manufacture parts with lower material waste, increased design flexibility, rapid prototyping capabilities [10], higher deposition rate, improved material utilization, and energy efficiency [8,11].
While wire-arc DED offers many benefits, the quality and efficiency of manufactured components are dependent on multiple factors, including processing parameters and the material properties of the substrate and wire [12,13]. Recent studies have begun to model this impact using machine learning techniques [14,15,16,17,18,19]. While previous ML-based studies have enhanced the understanding of wire-arc DED bead geometry by predicting the width and height for single-layer deposits, they overlook crucial aspects of bead morphology. Solely relying on width and height effectively treats each bead as a rectangular geometry, neglecting important shape characteristics such as deposition area, surface curvature, and skew. Additionally, these models assume each bead was deposited independently, ignoring external factors when multiple beads are deposited on the same substrate. For example, heat accumulates in the system as more beads are deposited, causing substrates to warp and potentially impacting bead geometry [20].
Building upon previous studies that leveraged machine learning techniques to model wire-arc DED bead geometry [14,15,16,17,18], this work seeks to extend the analysis by utilizing one of the largest and first multi-material datasets relating processing parameters to bead shape characteristics [19]. The exploration of this dataset showed that some of the surface profiles of deposited beads had asymmetrical geometries skewed toward one side. Additionally, the substrates that the beads were deposited on showed varying degrees of warping. This study aims to provide a more comprehensive understanding of the wire-arc DED process by quantifying bead asymmetry and substrate warping and relating these phenomena to processing parameters and material properties.
By gaining insights into these factors, the optimization of material selection and process parameters can be performed more efficiently to improve part quality and reduce material waste. For example, as multiple beads are deposited side-by-side, if some beads are asymmetrical, it can result in the excessive build-up of material in certain areas while leaving large porous sections in others. As a result, the quality and structural integrity of manufactured components may be decreased. Furthermore, as substrates warp during manufacturing, residual stress can increase [21]. If warping becomes severe, large deviations from the expected component dimensions may occur, resulting in height errors where future material is deposited incorrectly [22]. Thus, a better understanding of these phenomena and what causes them could enable an improved manufacturing process for stronger and more efficient components.

Contributions

The contributions of this work are as follows:
  • A novel technique to characterize asymmetrical bead geometries.
  • To the best of our knowledge, the first comparison between bead geometry asymmetry, processing parameters, and material properties.
  • A multi-material analysis of the relationship between material characteristics and the degree of substrate warping caused by wire-arc DED bead deposits.

2. Background

Welding technology is critical to the joining and fabrication of manufacturing processes, being used to assemble various components for buildings, bridges, ships, automobiles, trains, and aircraft. Maintaining the structural integrity in permanently joined objects and parts would not be possible without welding processes. However, distortion and warping in welded structures is a commonly realized problem and is difficult to eliminate or mitigate completely, particularly in thin-plate and thin-panel structures [23,24,25,26,27]. This phenomenon negatively effects manufacturability, accuracy of part assembly, and appearance of welded structures [24,25,28]. Warping occurs during the welding process from heterogeneous expansion followed by localized shrinkage due to rapid heating and cooling cycles in the weld zone [23,24,28,29,30]. As the melt pool of the weld and surrounding heat-affected substrate material are elevated in temperature, thermal expansion occurs, leading to the regions of compressive and tensile residual stresses within the welded structure [23,28,29,30].
The behavior of warping and complex distributions of residual stresses found within welds are intrinsically related due to thermal gradient distortion effects imparted on welded components. The effects of welding distortions and residual stresses heavily impair mechanical properties while also risking shape and dimensional tolerances [28]. For example, residual stresses have been shown to rupture welds, cause brittle fractures, and reduce fatigue strength and resistance to corrosion [28]. The extent of warping and residual stresses can be partially controlled by process and design-related variables such as welding parameters, heat input, travel speed, joint geometry, plate thicknesses, welding sequence, mechanical restraint conditions, and material properties of weld materials [26,27]. Furthermore, the effects of thermophysical properties on weld bead shape and geometry are also critical for determining the amount of distortion and stresses that will form. The magnitude and direction of angular warping and distortions are dependent on the contraction stresses that form during the solidification process of weld beads [29,31].
Moreover, weld bead geometry can influence the warping and residual stress patterns, as the size and shape of the weld pool dictate the molten mixing of the material, heat transfer rates, and solidification patterns during welding [32]. Control over welding parameters such as travel speed, arc voltage, wire feed rate, arc distance, gas flow, electrode angle, and position are key to depositing a weld profile that achieves the desired bead shape and the containment of stresses and warping [32,33]. The interdependent relationships of distortion, residual stresses, and thermophysical properties of welds underscore the importance of considering all these factors when optimizing and characterizing the quality of weld beads and components.

3. Methodology

3.1. Depositing Wire-Arc DED Beads

The measured beads in this study were deposited with a Fronius TPS400i welder on an ABB IRB 2600 robot with a gas mixture of 98% argon and 2% CO2. A modified approach, referred to as “cold metal transfer”, was used instead of maintaining a constant current and voltage. This approach, developed by Fronius, uses a modified short-circuit welding process to synchronize the waveform with the mechanical motion of the wire and enables more controlled and precise deposition of material. These beads were then scanned and processed with an Artec Scanner, as outlined in our previous work [19].

3.2. Calculating Asymmetry

While there was a noticeable asymmetry visible to the naked eye on specific beads, quantifying this asymmetry in a way that could be rigorously evaluated posed a significant challenge. For these purposes, a singular metric that quantifies the asymmetry of a specific bead is needed to enable ranking and comparing to other beads. One of the challenges was defining the central point to locate the line of symmetry. For example, the degree of measured asymmetry could change depending on whether the axis of symmetry was placed at the highest point or the central point of the bead. Additionally, it had to be determined whether asymmetry was measured based on the perimeter (surface profile) or distributed area.
Considering this, techniques commonly used in time-series data analysis were leveraged to quantify the asymmetry of the surface profiles without needing to locate and calculate a specific line of symmetry. Specifically, by treating X coordinates (relating to the width of the bead) similar to temporal values and Z coordinates (relating to the height of the bead) as magnitudes at a certain instance, surface profiles of beads become analogous to time-series data. Using this assumption, time-series distance equations were adapted to compare and quantify surface profile differences. With respect to measuring asymmetry, a bead’s surface profile can be mirrored, enabling a calculation of the difference between the original and mirrored profiles. This served as a metric to quantify the degree of asymmetry, as symmetrical profiles would have negligible differences when inverted. In contrast, asymmetrical profiles would show greater deviations between the true (as measured) and mirrored cross-sectional profiles of the bead.
To accomplish this, a standard Euclidean distance equation, as shown in Equation (1), was implemented with a few minor modifications. First, since the recorded height of beads varied from 1700 to 3500 microns [19], these surface profiles’ heights were normalized such that all height values fell between 0 and 1 using Equation (2). Thus, distances between mirrored profiles became unitless and unaffected by the magnitude of a bead’s height. Similarly, bead surface profiles recorded height measurements in intervals of 250 microns across the width of the bead. As a result, wider beads could be calculated to have larger distances, even with equal or smaller amounts of asymmetry. To account for this, the sum of distances between a surface profile and its mirrored counterpart was normalized based on the number of measured points, using Equation (3).
E u c l i d e a n D i s t a n c e = i = 1 N ( t r u e i m i r r o r e d i ) 2
N o r m a l i z e d V a l u e = V a l u e min ( A r r a y ) max ( A r r a y ) min ( A r r a y )
A d j u s t e d E u c l i d i a n D i s t a n c e = i = 1 N ( t r u e i m i r r o r e d i ) 2 N
To validate the proposed asymmetry metric, two theoretical cases were evaluated: a completely symmetric function and a completely asymmetric function. The symmetric function was created using a normal distribution, which, when mirrored, remains unchanged, as shown in Figure 1a. The asymmetric case was a stepwise function where every value was 0.0 or 1.0. As a result, the stepwise function’s mirror image represents the exact inverse function, as shown in Figure 1b. Applying the asymmetry equation, the normal distribution yielded a score of 0.0, indicating perfect symmetry, while the stepwise function scored 1.0, the maximum asymmetry value. These results validate the proposed asymmetry equation, as shown in Equation (3). While these examples highlight asymmetry values across the full range of 0.0–1.0, most bead profiles are likely to have scores on the lower side of this spectrum since their surface profiles are much closer to the normal distribution than the theoretical stepwise function.

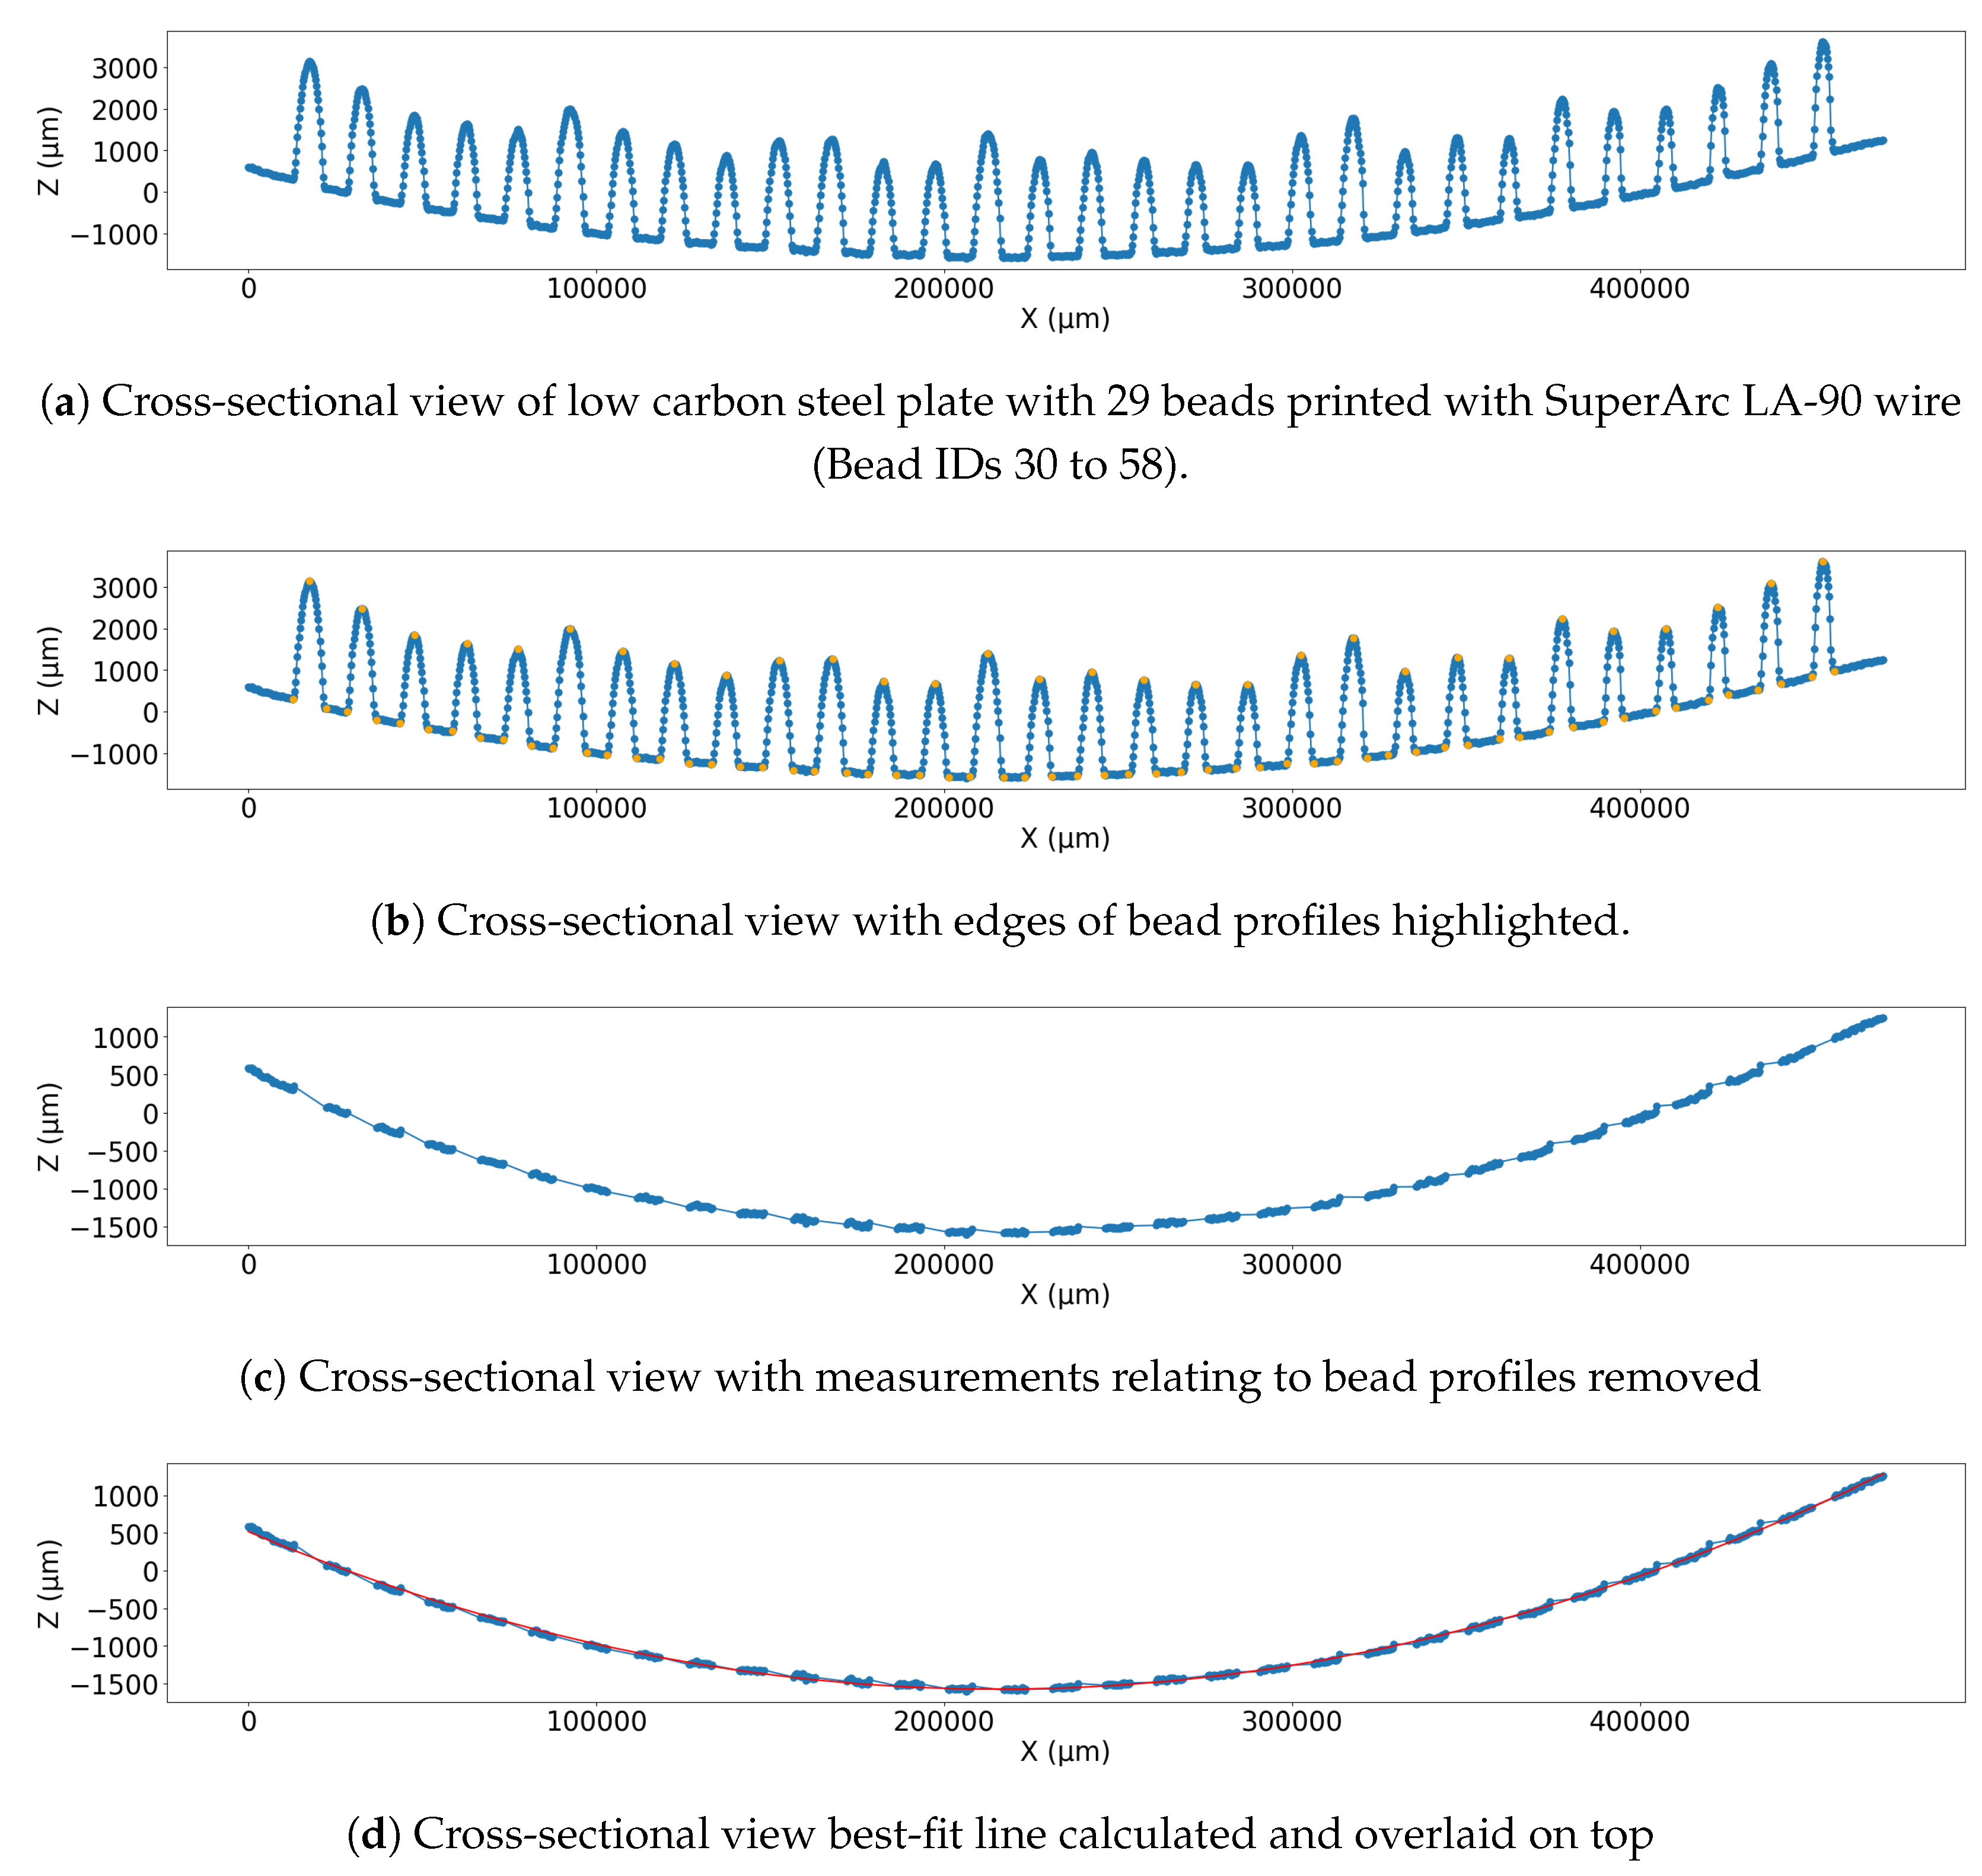
3.3. Calculating Substrate Curvature

In addition to quantifying the asymmetry of deposited beads, each substrate was evaluated to determine the shape and magnitude of warping that has occurred. Specifically, this sought to assess whether specific material properties of the substrate or the wire impacted warping. To calculate this, cross-sectional profiles of surface plates, as shown in Figure 2a, were processed to identify which points correlated to deposited beads, as shown in Figure 2b, and remove them from the surface profile, as shown in Figure 2c. Once the bead measurements were removed, a binomial curve was fit to the substrate measurements, as shown in Figure 2d. Warping was specifically quantified as the coefficient of the binomial parameter, representing the magnitude of the curve.

Filtering Experimental Data

The initial wire-arc DED study [19] was collected with the primary objective of training a machine learning model to predict bead shape. As a result, warping and residual stresses were not considered in the DOE and not all beads were deposited on substrates of the same length. As shown in Figure 3, the number of beads deposited on a substrate ranges from 9 to 30, with 15 of the 22 substrates having between 27 and 30 beads deposited on them. The most frequent number of beads deposited on a single substrate was 29, with nearly half (10 of 22) of the substrates having 29. Since a change in length or number of beads deposited could impact the warping, this part of the study was limited to only the substrates with at least 27 beads deposited on them, which was approximately 75% of the collected data. However, the whole dataset was utilized for the bead asymmetry analysis.
In addition to removing the substrates with less than 27 beads deposited from consideration, one additional substrate was removed from this warping analysis. This substrate was removed from the analysis because a mistake was made while depositing Super-Arc LA75 beads onto a 4140 substrate, in which the substrate was flipped over, and the beads were reprinted on the opposite side, as shown in Figure 4. As a result, this substrate warped differently than the others, creating a cubic curve instead of a quadratic one, as shown in Figure 5. Since this only occurred once, it was also removed from consideration when comparing material properties to substrate warping.

3.4. Computing Thermophysical Properties

In addition to relating symmetry and warping to processing parameters, this study compared symmetry and warping measurements to the thermophysical properties of the wire and substrate. To achieve this, Thermo-Calc software, version 2024-B, was used to model and extract these parameter values. Instead of being scalars, these properties are functions dependent on temperature. During the deposition process, these beads existed across this range of temperatures. Thus, the mean value from 273 Kelvin to each material’s melting point was computed for each thermophysical property as a summative metric.

4. Results and Discussion

While previous studies have primarily focused on predicting wire-arc DED bead geometry through width and height, this work analyzes the context of material composition and processing parameters on bead symmetry and substrate warping. A better understanding of these concepts could help improve predictions of width and height, as well as improve the quality and efficiency of manufacturing parts.

4.1. Asymmetry Measurements

Using the adjusted Euclidean distance equation, the asymmetry of each bead was computed. These results confirm visual observations that beads were deposited with differing levels of asymmetry. For example, as shown in Figure 6a, some of the beads were deposited near-perfectly symmetrical, scoring a symmetry score of 0.01617. However, as shown in Figure 6b, others were deposited with a skew to one side, resulting in much higher symmetry scores, as 0.19029, indicated by the deviations from the orange and blue line.
These calculated symmetry values were first compared against processing parameters, bead dimensions, and bead locations on the substrate. Specifically, processing parameters included feed rate and travel speed, bead dimensions included width, height, peak curvature and tail curvature, and bead locations included PrintCount and DistanceFromMin. PrintCount refers to the order of deposit such that the first bead deposited is 1, the second deposited bead is 2 and continuing for all deposited beads. This parameter was included in the analysis as a higher PrintCount, which indicates that the bead was deposited when there was likely more heat in the system. DistanceFromMin refers to the number of beads away from the lowest bead. A value of 0 indicates being positioned in the center, at the lowest point. In contrast, a larger value indicates a position further from the center, and as a result, deposited at a higher slope angle on the substrate. This was included in the analysis to identify whether substrate warping impacted bead symmetry.
A Pearson correlation matrix [34] was utilized to compare these parameters to bead asymmetry, as shown in Figure 7. In this correlation matrix, scores range from −1.0 to 1.0, where a score of 0 indicates no correlation, a score of 1.0 (in dark red) indicates a strong correlation between two parameters and a score of −1.0 (in dark blue) indicates a strong inverse correlation between two parameters. In this correlation matrix, the right-most (or bottom-most) column is most relevant regarding the relationship between asymmetry and the previously mentioned parameters. These results highlight that none of the parameters had a particularly strong correlation with asymmetry. Specifically, of the evaluated features, peak curvature, feed rate, and width had the strongest correlations with −0.24, −0.21, and −0.21, respectively. While these are the strongest of the evaluated parameters, none had a particularly strong correlation that would indicate a close relationship.
With no strong correlation from asymmetry to processing parameters, bead geometry, or bead location, the material selection was also evaluated. A similar correlation matrix was calculated, as shown in Figure 8, highlighting the impact a specific material had on asymmetry. From this analysis, where the strongest correlation was −0.1, material selection had even less of an impact on bead asymmetry. As a result, there must be other factors impacting asymmetry that were not recorded at the time of the experiment. Future research is required to better understand this phenomenon.

4.2. Impact of Asymmetrically Deposited Beads

Asymmetrical bead geometries in wire-arc DED can significantly impact the quality and integrity of the final manufactured part. When multiple asymmetrical beads are deposited side-by-side, the irregular bead shape can lead to inconsistent pooling and solidification. This could lead to increased porosity and weakened structural integrity. Additionally, this could increase residual stresses within a part due to inconsistent cooling rates, as some parts may be thicker than others. Thus, by better understanding these factors, they can be removed, improving overall part quality.

4.3. Substrate Warping

For each material, the density, viscosity, electric conductivity, electric resistivity, enthalpy, heat capacity, surface tension, thermal conductivity, thermal diffusivity, thermal expansivity, and thermal resistivity were evaluated, as outlined in Section 3.4. Before discussing how these properties correlate to the magnitude of warping, it is necessary to understand the fundamentals of thermophysical properties such as heat capacity, thermal conductivity, and thermal diffusivity and how they impact the welding of steels. The heat capacity can be defined as a material’s ability to store thermal energy and describes how much heat is required to cause an increase in one temperature unit. Conversely, thermal conductivity measures a material’s efficiency in transferring heat, whereby heat transfer occurs at a higher rate in materials that have a higher thermal conductivity. Furthermore, thermal diffusivity is the measure of the rate of heat transfer throughout a material or, in mathematical terms, the thermal conductivity divided by the product of density and specific heat capacity. Physical properties, such as the ones just listed, are all temperature-dependent and underscore the complexity of thermal dynamics in steel welding. Steels exhibit a highly non-linear heat capacity that can vary widely as a function of temperature, but the heat capacity will not significantly change between steel types [35,36]. Alternatively, the thermal conductivity of steels will differ based on the chemical composition of the alloy type [36].
The various engineered physical property values were compared to the amount of warping each substrate endured with a correlation matrix, as shown in Table 1 highlighting processing parameters and the most correlated thermophysical properties. Analysis of these correlations and results identified that heat capacity and thermal diffusivity were the most relevant features of those examined. For example, the Pearson correlation analysis showed that, as the heat capacity of a steel substrate decreases, the amount of warping in the substrate will increase during the welding process. This can be explained by the fact that a reduced heat capacity in steel causes a lower required energy input to increase the temperature of the substrate, leading to concentrated, localized heating within the substrate and weld deposit. Greater thermal gradients are induced by elevated heat absorption in the substrate which ultimately leads to non-uniform thermal expansion and subsequently increased levels of warping. Conversely, correlation analysis of thermal diffusivity highlighted that, as the thermal diffusivity of the steel substrate increased, the degree of warping in the plate decreased. A higher thermal diffusivity in steel will minimize thermal gradients and temperature disparities, initiating a more uniform distribution of thermal expansion, by which reduced warping occurs.
However, the effects of thermal diffusivity, thermal conductivity, and heat capacity on warping are all interrelated thermophysical properties; when combining their effects together as one, an increase in thermal conductivity and a decrease in heat capacity will result in an increase in thermal diffusivity, thereby decreasing the effects of warping. Comparatively, when examining each of these properties individually, without the influence of each other, an increase in thermal conductivity and a decrease in heat capacity results in lower and higher amounts of warping, respectively. This inverse relationship ultimately affects the thermal diffusivity where effects of thermal conductivity must play a dominant role over the heat capacity to result in the lower overall warping effects observed. This inverse relationship ultimately affects the thermal diffusivity where effects of thermal conductivity must play a dominant role over the heat capacity to result in the lower warping effects observed. This highlights the need for careful material selection and process control to mitigate warping effects. To a lesser extent, the same correlations between warping and physical properties in the steel substrate were observed in wire analysis. Finally, the wire feed rate was also found to have a relevant impact on the amount of warping, whereby an increase in wire feed rate resulted in lower amounts of warping. It is hypothesized that an increased feed rate, which typically corresponds to a faster weld speed, reduces the time that a single area is saturated with heat and distributes the thermal energy over a larger area to inhibit the effects of warping.

4.4. Impact of Substrate Warping

Substrates serve as the base for deposited material in additive manufacturing. As more material is deposited, the substrate continues to heat and cool rapidly, introducing residual stresses and causing it to warp [21]. If this warping becomes significant, it can impact the overall quality of a part. For example, excessive warping could cause deviations in shape where the deposited material does not align with the expected form [22]. As a result of warping, in addition to manufacturing a part that does not meet specifications, defects such as porosity or lack of fusion could be present as well. Additionally, as the substrate warps, it could begin to put more stress on the manufactured part and, as a result, negatively impact the structural integrity. This tensile residual stress is usually the most impactful to manufactured parts and, in the case of steels, can be as high as the yield strength of the material at room temperature [37].

4.5. Utilizing Results to Improve Manufacturing

The results from this study confirm that beads are deposited with varying levels of symmetry, as demonstrated in Figure 6. However, no specific trend was revealed that would indicate how to optimize or mitigate asymmetry. As a result of this, future research is required to understand this better. Some factors that may play a role include thermal history, wire-feeder angle, or the slope of the plate. Future research is required to better determine this. In addition to asymmetry analysis, these results highlight ways in which substrate warping can be reduced. By selecting substrate materials with low heat capacities or high thermal diffusivity, the extent to which substrates warp during the wire-arc DED manufacturing process can be mitigated. This reduction in warping can lead to more consistent bead deposition angles, reducing the likelihood of misaligned deposits, porosity, or lack of fusion. Lastly, these results were all collected using a half-inch thick substrate. Switching to a thicker plate may also reduce warping, without causing any changes to material properties.

4.6. Improving Experimental Design

The wire-arc DED samples utilized for this study were originally collected during a prior experiment focused on machine learning applications [19]. That initial experimental design was specifically tailored to generate an extensive and evenly distributed dataset across the selected parameters and number of samples per material. However, analyzing bead asymmetry was not a consideration at that time. As a result, the beads were deposited on the substrate in ascending order of feed rate, such that the lowest feed rate beads for a given substrate were deposited first.
This sequential deposition approach complicates the analysis of feed rate’s influence on asymmetry, as higher feed rates coincided with increased heat within the system. Confirming this, the feed rate had a correlation of −0.21 with asymmetry, while the print count, a measure of how many beads had previously been deposited, displayed a similar negative correlation of −0.19. Moreover, these two variables were highly correlated at 0.90.
Future experiments should incorporate a design-of-experiments (DOE) approach that considers the sample parameter space and accounts for potential confounding factors introduced by location and thermal history to enable a more comprehensive analysis of bead shape asymmetry. This would facilitate an independent evaluation of individual parameters without unintended compounding effects.

5. Conclusions

This study introduced a novel quantification technique to characterize asymmetrical bead geometries in wire-arc DED. While no strong correlations between asymmetry and processing parameters or material selection were identified, to the best of our knowledge, the work presented here is the first that confirms asymmetrical bead deposition. Additionally, this work analyzed the impact of processing parameters and material properties on substrate warping, identifying that heat capacity and thermal diffusivity were the dominant factors in substrate warping. While most have focused on predicting the width and height of the bead shape, this work offers a broader understanding of the impacts that changes in the manufacturing process can have on the whole system. The analysis of substrate asymmetry, curvature, and impact of thermophysical properties and process parameters resulted in the following conclusions:
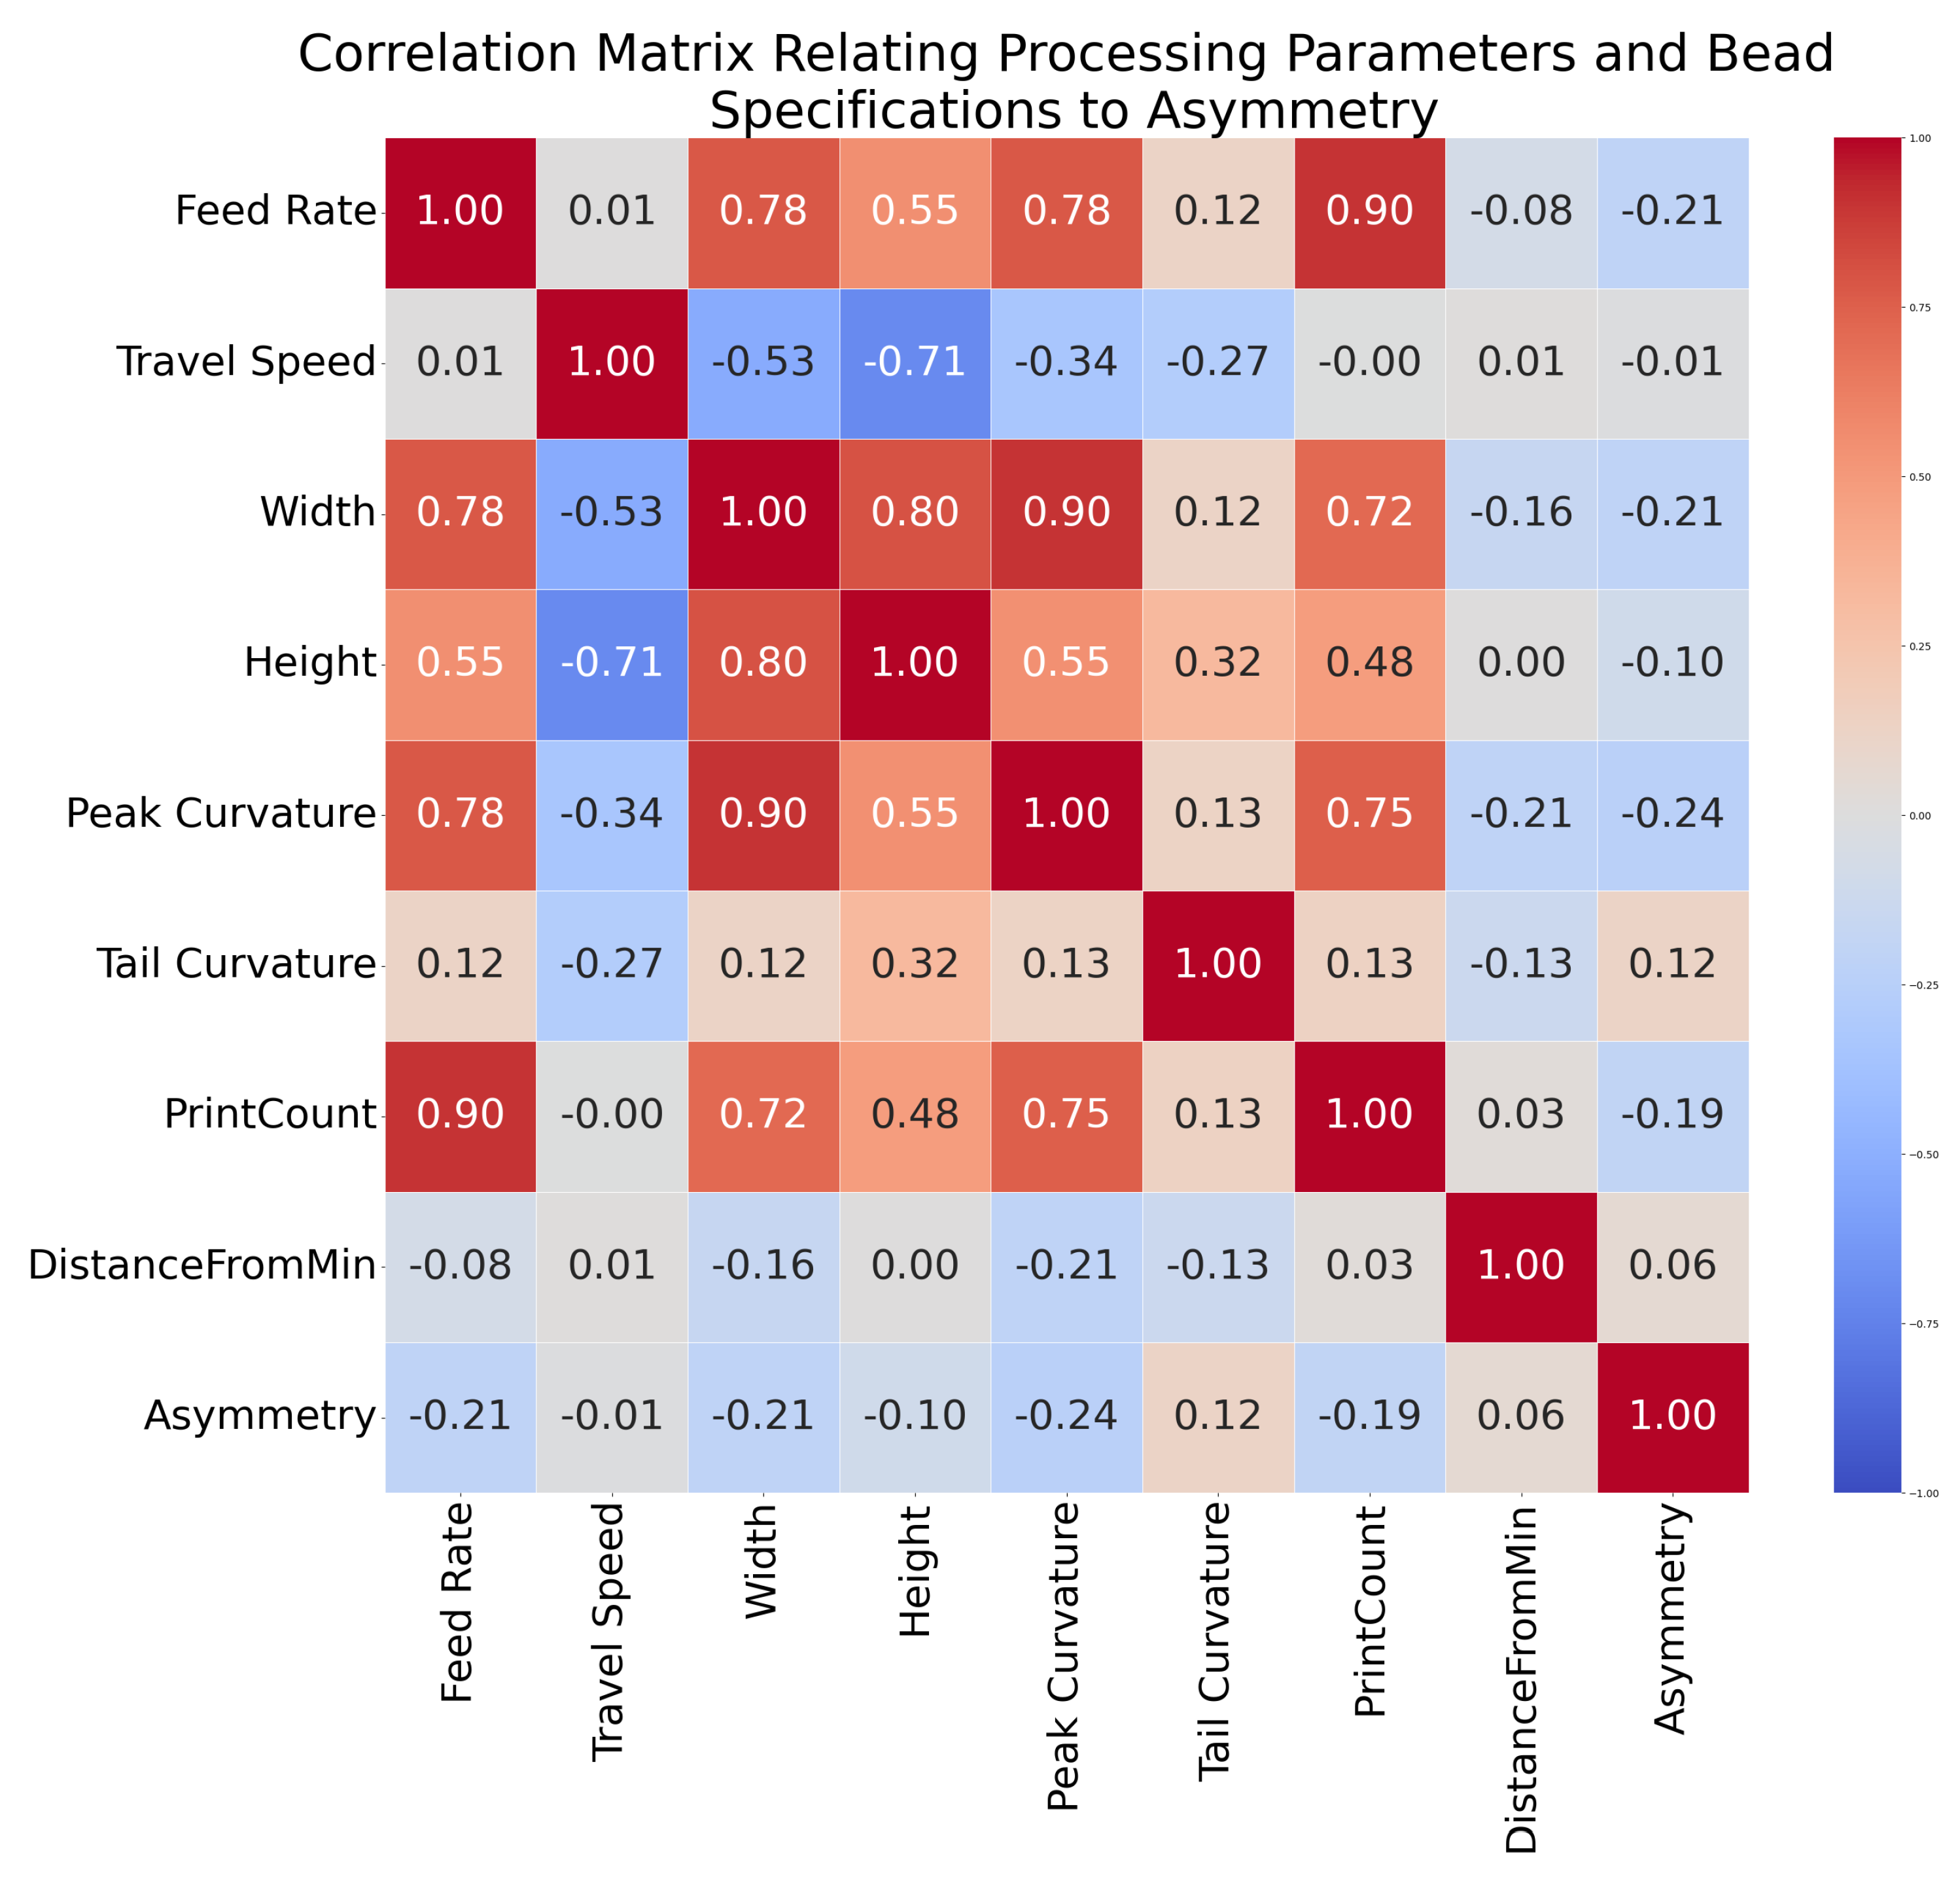
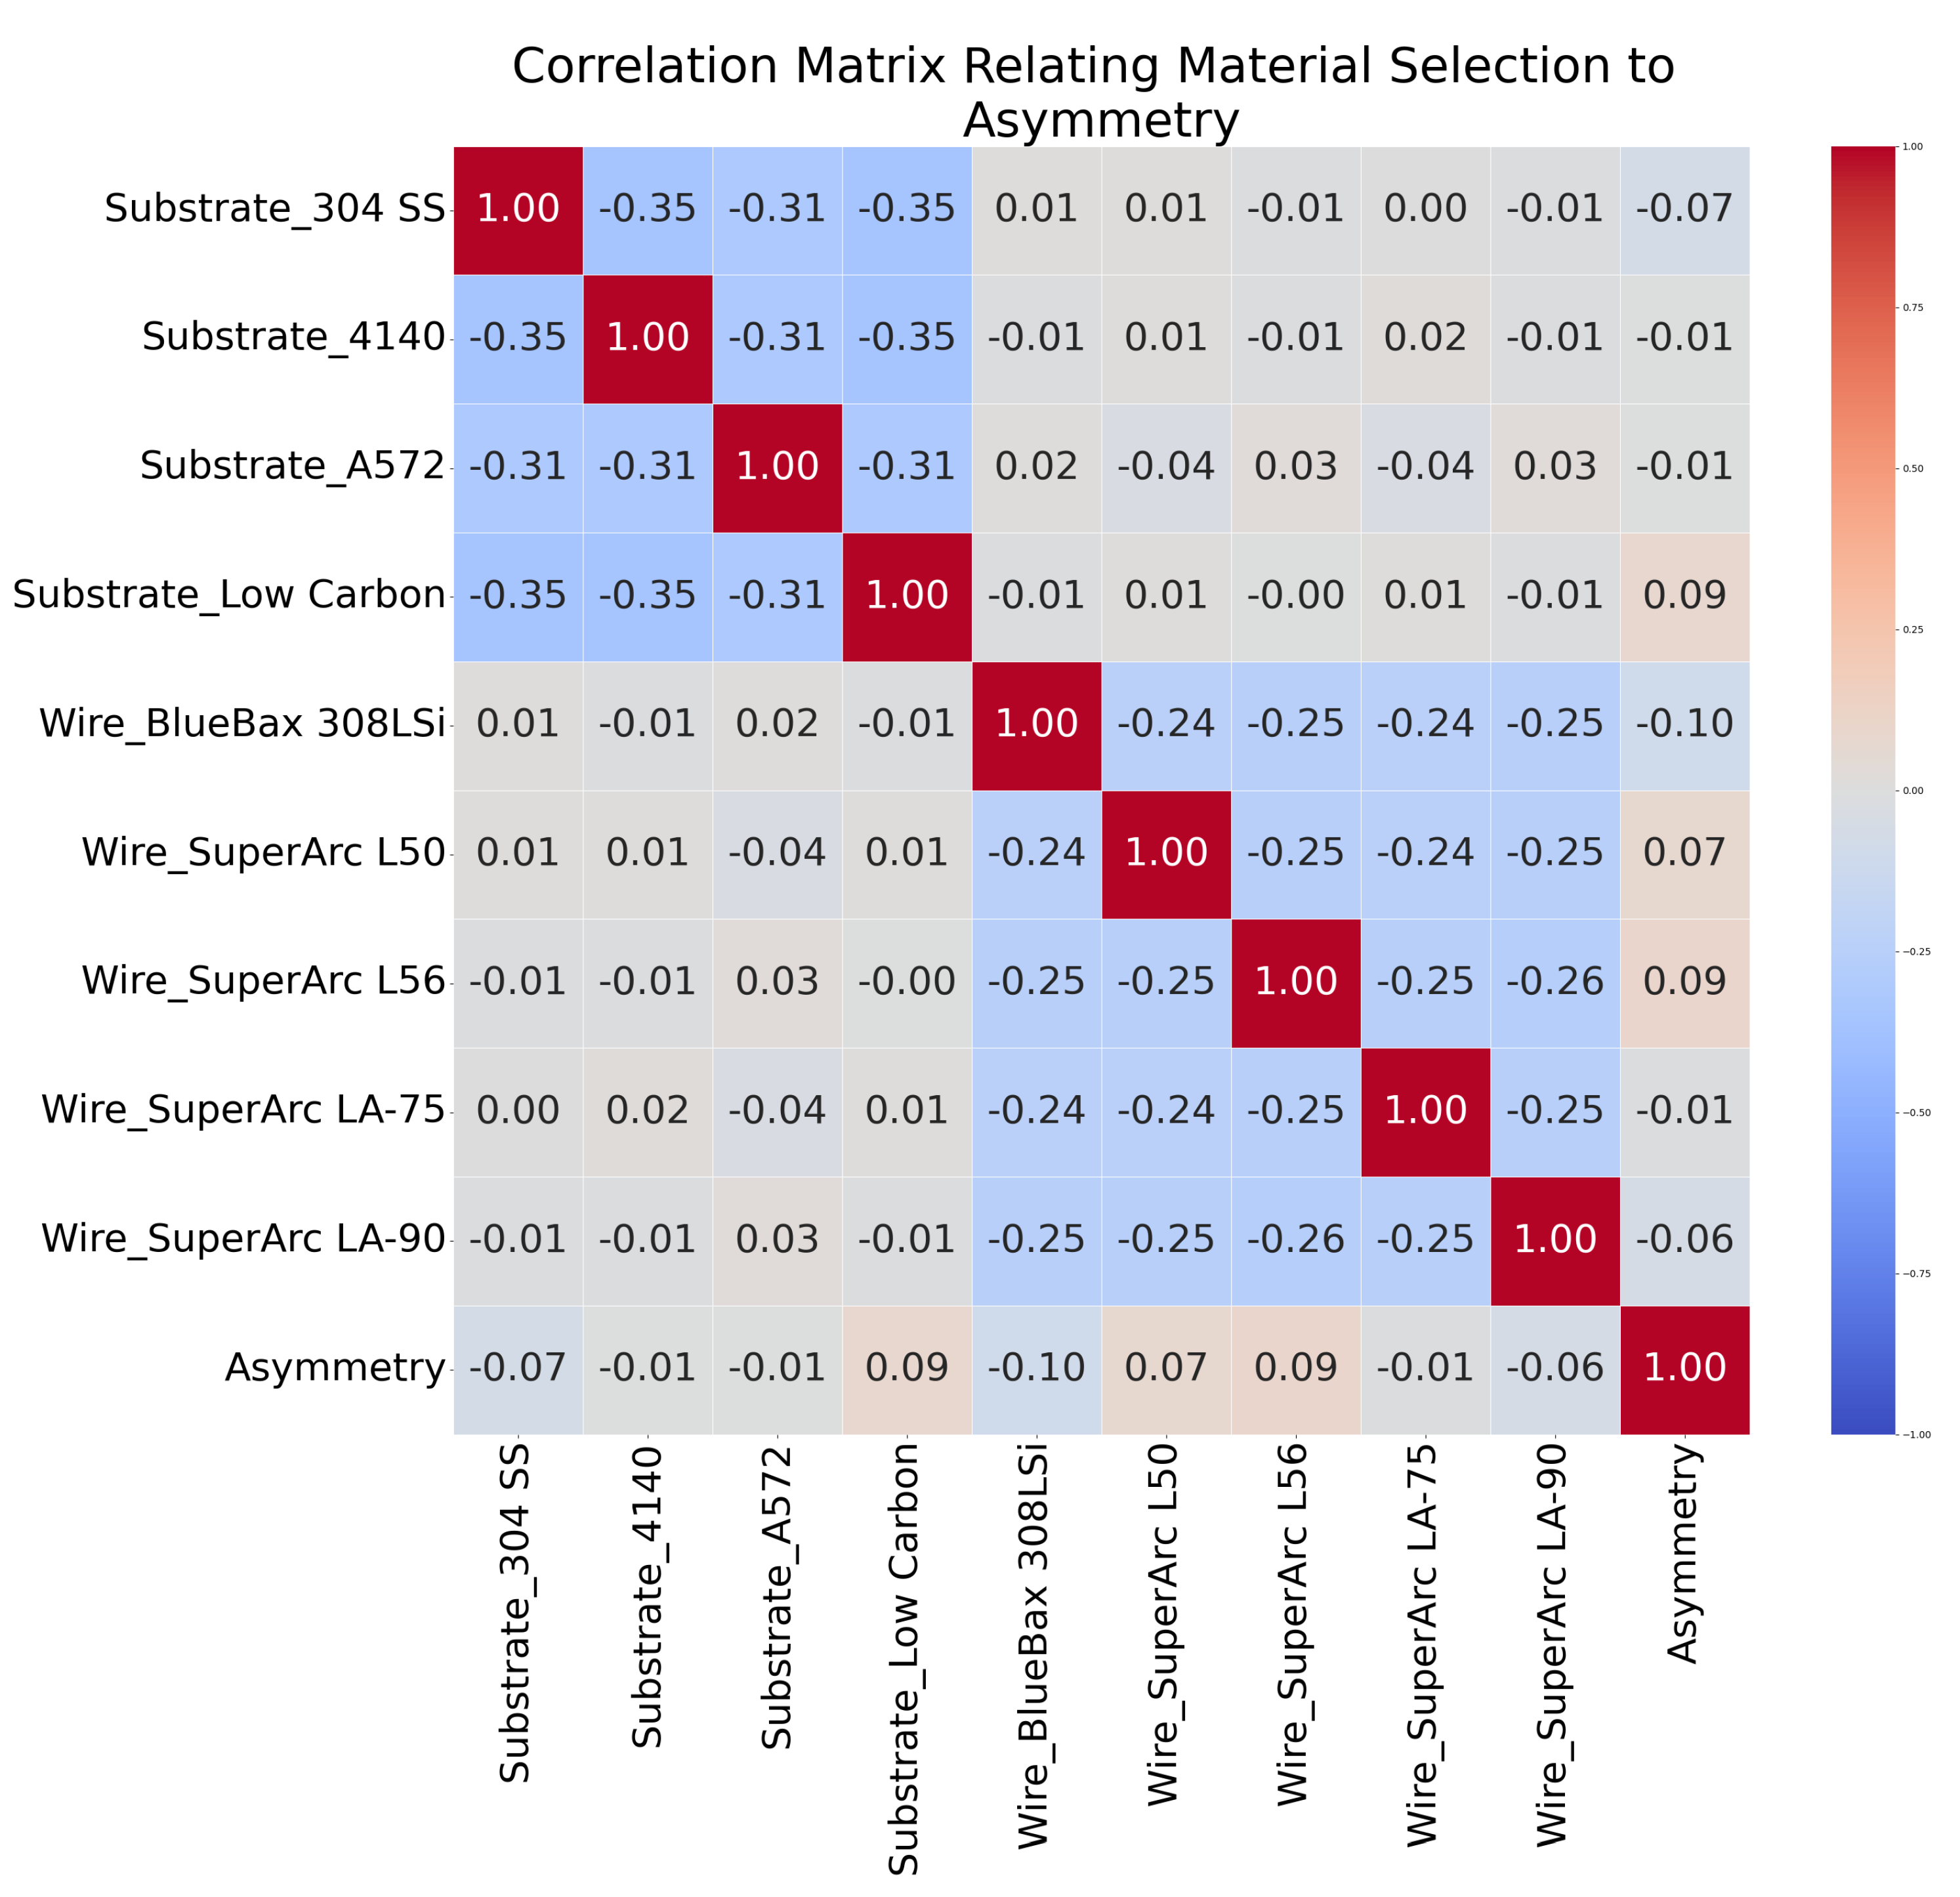
  • The asymmetry of each bead was calculated using a normalized Euclidean distance equation and compared between each other using a correlation matrix, finding that none of the parameters had a particularly strong correlation with asymmetry. Peak curvature, feed rate and width had the strongest correlations with −0.24, −0.21 and −0.21, respectively.
  • Correlation matrix between process parameters, physical properties and warping revealed the strongest correlation with feed rate, travel speed, substrate mean heat capacity, substrate means thermal diffusivity, wire mean heat capacity and wire means thermal diffusivity with −0.26, −0.01, 0.60, −0.67, 0.47 and −0.40, respectively.
  • Heat capacity and thermal diffusivity were the most relevant features examined.
  • As substrate heat capacity decreased, substrate warping increased.
  • As substrate thermal conductivity increased, warping decreased.
  • As substrate thermal diffusivity increased, substrate warping decreased.
  • Thermal conductivity exhibits a dominating role over heat capacity to cause an increase in thermal conductivity and decrease in resultant warping.
  • Increased wire feed rates caused decreased warping effects.
Future work plans to build upon this study’s findings to better understand the effects of warping during welding and wire-arc DED processes. Further research endeavors will measure the effects of residual stresses based on the magnitude of stresses and warping. These measurements can then be added to the correlation matrix to compare how they are influenced based on process parameters and thermophysical property factors. Additionally, future experiments will incorporate a design-of-experiments (DOE) approach that will better space welding deposits from previous welds to enable a more comprehensive analysis of weld bead shape and substrate warping. Further attention will also be placed on determining how the coefficient of thermal expansion of wire and substrate materials influences substrate heat uptake.

Author Contributions

Conceptualization: S.P., D.L.C. and R.N.; data collection and curation: S.P., K.J. and M.G.; software: S.P.; analysis: S.P., K.J., M.G., K.T., D.L.C. and R.N.; writing: S.P., K.J., M.G., K.T., D.L.C. and R.N.; supervision: K.T., D.L.C. and R.N. All authors have read and agreed to the published version of the manuscript.

Funding

This research received no external funding.

Data Availability Statement

The raw data supporting conclusions made in this work can be found here: https://github.com/sprice134/wireArcDED_Asymmetry.

Conflicts of Interest

The authors declare no conflicts of interest.

References

  1. Najmon, J.C.; Raeisi, S.; Tovar, A. Review of additive manufacturing technologies and applications in the aerospace industry. Addit. Manuf. Aerosp. Ind. 2019, 7–31. [Google Scholar] [CrossRef]
  2. Singh, S.; Ramakrishna, S. Biomedical applications of additive manufacturing: Present and future. Curr. Opin. Biomed. Eng. 2017, 2, 105–115. [Google Scholar] [CrossRef]
  3. Bhatia, A.; Sehgal, A.K. Additive manufacturing materials, methods and applications: A review. Mater. Today Proc. 2023, 81, 1060–1067. [Google Scholar] [CrossRef]
  4. Costello, S.C.; Cunningham, C.R.; Xu, F.; Shokrani, A.; Dhokia, V.; Newman, S.T. The state-of-the-art of wire arc directed energy deposition (WA-DED) as an additive manufacturing process for large metallic component manufacture. Int. J. Comput. Integr. Manuf. 2023, 36, 469–510. [Google Scholar] [CrossRef]
  5. Yi, H.; Yang, L.; Jia, L.; Huang, Y.; Cao, H. Porosity in wire-arc directed energy deposition of aluminum alloys: Formation mechanisms, influencing factors and inhibition strategies. Addit. Manuf. 2024, 84, 104108. [Google Scholar] [CrossRef]
  6. Calignano, F.; Mercurio, V. An overview of the impact of additive manufacturing on supply chain, reshoring, and sustainability. Clean. Logist. Supply Chain. 2023, 7, 100103. [Google Scholar] [CrossRef]
  7. Derekar, K. A review of wire arc additive manufacturing and advances in wire arc additive manufacturing of aluminium. Mater. Sci. Technol. 2018, 34, 895–916. [Google Scholar] [CrossRef]
  8. Xia, C.; Pan, Z.; Polden, J.; Li, H.; Xu, Y.; Chen, S.; Zhang, Y. A review on wire arc additive manufacturing: Monitoring, control and a framework of automated system. J. Manuf. Syst. 2020, 57, 31–45. [Google Scholar] [CrossRef]
  9. Karouanas, I.; Foteinopoulos, P.; Bikas, H.; Stavropoulos, P. A practical simulation approach for the support of wire arc DED additive manufacturing systems design. Procedia Comput. Sci. 2024, 232, 3161–3172. [Google Scholar] [CrossRef]
  10. Nie, Y.; Zhang, P.; Wu, X.; Li, G.; Yan, H.; Yu, Z. Rapid prototyping of 4043 Al-alloy parts by cold metal transfer. Sci. Technol. Weld. Join. 2018, 23, 527–535. [Google Scholar] [CrossRef]
  11. Ding, D.; Pan, Z.; Cuiuri, D.; Li, H. Wire-feed additive manufacturing of metal components: Technologies, developments and future interests. Int. J. Adv. Manuf. Technol. 2015, 81, 465–481. [Google Scholar] [CrossRef]
  12. Rosli, N.A.; Alkahari, M.R.; Ramli, F.R.; Sudin, M.N.; Maidin, S. Influence of process parameters in wire and arc additive manufacturing (WAAM) process. J. Mech. Eng. (JMechE) 2021, 17, 69–78. [Google Scholar] [CrossRef]
  13. Tomar, B.; Shiva, S.; Nath, T. A review on wire arc additive manufacturing: Processing parameters, defects, quality improvement and recent advances. Mater. Today Commun. 2022, 31, 103739. [Google Scholar] [CrossRef]
  14. Nagesh, D.; Datta, G. Genetic algorithm for optimization of welding variables for height to width ratio and application of ANN for prediction of bead geometry for TIG welding process. Appl. Soft Comput. 2010, 10, 897–907. [Google Scholar] [CrossRef]
  15. Xiong, J.; Zhang, G.; Hu, J.; Wu, L. Bead geometry prediction for robotic GMAW-based rapid manufacturing through a neural network and a second-order regression analysis. J. Intell. Manuf. 2014, 25, 157–163. [Google Scholar] [CrossRef]
  16. Karmuhilan, M. Intelligent process model for bead geometry prediction in WAAM. Mater. Today Proc. 2018, 5, 24005–24013. [Google Scholar] [CrossRef]
  17. Dinovitzer, M.; Chen, X.; Laliberte, J.; Huang, X.; Frei, H. Effect of wire and arc additive manufacturing (WAAM) process parameters on bead geometry and microstructure. Addit. Manuf. 2019, 26, 138–146. [Google Scholar] [CrossRef]
  18. Barrionuevo, G.O.; Ríos, S.; Williams, S.W.; Ramos-Grez, J.A. Comparative Evaluation of Machine Learning Regressors for the Layer Geometry Prediction in Wire Arc Additive Manufacturing. In Proceedings of the 2021 IEEE 12th International Conference on Mechanical and Intelligent Manufacturing Technologies (ICMIMT), Cape Town, South Africa, 13–15 May 2021; pp. 186–190. [Google Scholar]
  19. Price, S.; Judd, K.; Gleason, M.; Tsaknopoulos, K.; Cote, D.L.; Neamtu, R. Advancing Wire Arc Directed Energy Deposition: Analyzing Impact of Materials and Parameters on Bead Shape. Metals 2024, 14, 282. [Google Scholar] [CrossRef]
  20. Manokruang, S. Phenomenological Model of Thermal Effects on Weld Beads Geometry Produced by Wire and Arc Additive Manufacturing (WAAM). Ph.D. Thesis, Université Grenoble Alpes, Saint-Martin-d’Hères, France, 2022. [Google Scholar]
  21. Ali, M.H.; Han, Y.S. Effect of phase transformations on scanning strategy in WAAM fabrication. Materials 2021, 14, 7871. [Google Scholar] [CrossRef]
  22. Song, G.H.; Lee, C.M.; Kim, D.H. Investigation of path planning to reduce height errors of intersection parts in wire-Arc Additive manufacturing. Materials 2021, 14, 6477. [Google Scholar] [CrossRef]
  23. Deng, D.; Murakawa, H.; Liang, W. Numerical simulation of welding distortion in large structures. Comput. Methods Appl. Mech. Eng. 2007, 196, 4613–4627. [Google Scholar] [CrossRef]
  24. Deng, D.; Murakawa, H. Prediction of welding distortion and residual stress in a thin plate butt-welded joint. Comput. Mater. Sci. 2008, 43, 353–365. [Google Scholar] [CrossRef]
  25. Fahlström, K.; Andersson, O.; Todal, U.; Melander, A. Minimization of distortions during laser welding of ultra high strength steel. J. Laser Appl. 2015, 27, S29011. [Google Scholar] [CrossRef]
  26. Tsai, C.L.; Park, S.C.; Cheng, W.T. Welding distortion of a thin-plate panel structure. Weld. J. N. Y. 1999, 78, 156-s. [Google Scholar]
  27. Ojalvo, M. Discussion of “Warping and Distortion at I-Section Joints”. J. Struct. Div. 1975, 101, 343–345. [Google Scholar] [CrossRef]
  28. Radaj, D. Heat Effects of Welding: Temperature Field, Residual Stress, Distortion; Springer Science & Business Media: Berlin/Heidelberg, Germany, 2012. [Google Scholar]
  29. Dogan, E.; Ay, M.; Kurtulmus, M.; Yukler, A.I.; Etyemez, A. Effects of welding parameters on the angular distortion of welded steel plates. Open Chem. 2022, 20, 417–423. [Google Scholar] [CrossRef]
  30. Lincoln, J.F. The Procedure Handbook of Arc Welding; The Lincoln Electric Company: Cleveland, OH, USA, 2000; Volume 10. [Google Scholar]
  31. Tseng, K.H.; Hsu, C.Y. Performance of activated TIG process in austenitic stainless steel welds. J. Mater. Process. Technol. 2011, 211, 503–512. [Google Scholar] [CrossRef]
  32. Murugan, N.; Gunaraj, V. Prediction and control of weld bead geometry and shape relationships in submerged arc welding of pipes. J. Mater. Process. Technol. 2005, 168, 478–487. [Google Scholar] [CrossRef]
  33. Kumar, A.; Maji, K. Selection of process parameters for near-net shape deposition in wire arc additive manufacturing by genetic algorithm. J. Mater. Eng. Perform. 2020, 29, 3334–3352. [Google Scholar] [CrossRef]
  34. Sedgwick, P. Pearson’s correlation coefficient. Bmj 2012, 345, e4483. [Google Scholar] [CrossRef]
  35. Little, G.; Kamtekar, A. The effect of thermal properties and weld efficiency on transient temperatures during welding. Comput. Struct. 1998, 68, 157–165. [Google Scholar] [CrossRef]
  36. Armentani, E.; Esposito, R.; Sepe, R. The effect of thermal properties and weld efficiency on residual stresses in welding. J. Achiev. Mater. Manuf. Eng. 2007, 20, 319–322. [Google Scholar]
  37. Colegrove, P.; Ganguly, S. Residual stress characterization and control in the additive manufacture of large scale metal structures. Residual Stress. 2017, 2016, 455. [Google Scholar]
Figure 1. Validating edge cases of calculating asymmetry with a minimum and maximum asymmetry.
Metals 14 00905 g001
Figure 2. Overview of the process to calculate substrate curvature as a result of warping.
Metals 14 00905 g002
Figure 3. Distribution of the number of beads deposited per substrate.
Metals 14 00905 g003
Figure 4. Front and back of 4140 steel substrate with beads deposited on the top and bottom, creating a cubic warp.
Metals 14 00905 g004
Figure 5. Side profile of cubic warping of 4140 steel substrate.
Metals 14 00905 g005
Figure 6. Highlighting differing levels of symmetry in deposited beads’ surface profiles.
Metals 14 00905 g006
Figure 7. Correlation matrix relating processing parameters, bead dimensions, and bead location to asymmetry.
Metals 14 00905 g007
Figure 8. Correlation matrix relating material to asymmetry.
Metals 14 00905 g008
Table 1. Correlations from warping to processing parameters and material thermophysical properties.
ParameterCorrelation
Feed rate−0.26
Travel speed−0.01
Substrate mean heat capacity0.60
Substrate mean thermal diffusivity−0.67
Wire mean heat capacity0.47
Wire mean thermal diffusivity−0.40
Disclaimer/Publisher’s Note: The statements, opinions and data contained in all publications are solely those of the individual author(s) and contributor(s) and not of MDPI and/or the editor(s). MDPI and/or the editor(s) disclaim responsibility for any injury to people or property resulting from any ideas, methods, instructions or products referred to in the content.

