
Evolutions on Microstructure and Impact Toughness of G115 Steel after Long-Term Aging at 700 °C

Abstract
1. Introduction
2. Materials and Experiments
3. Results
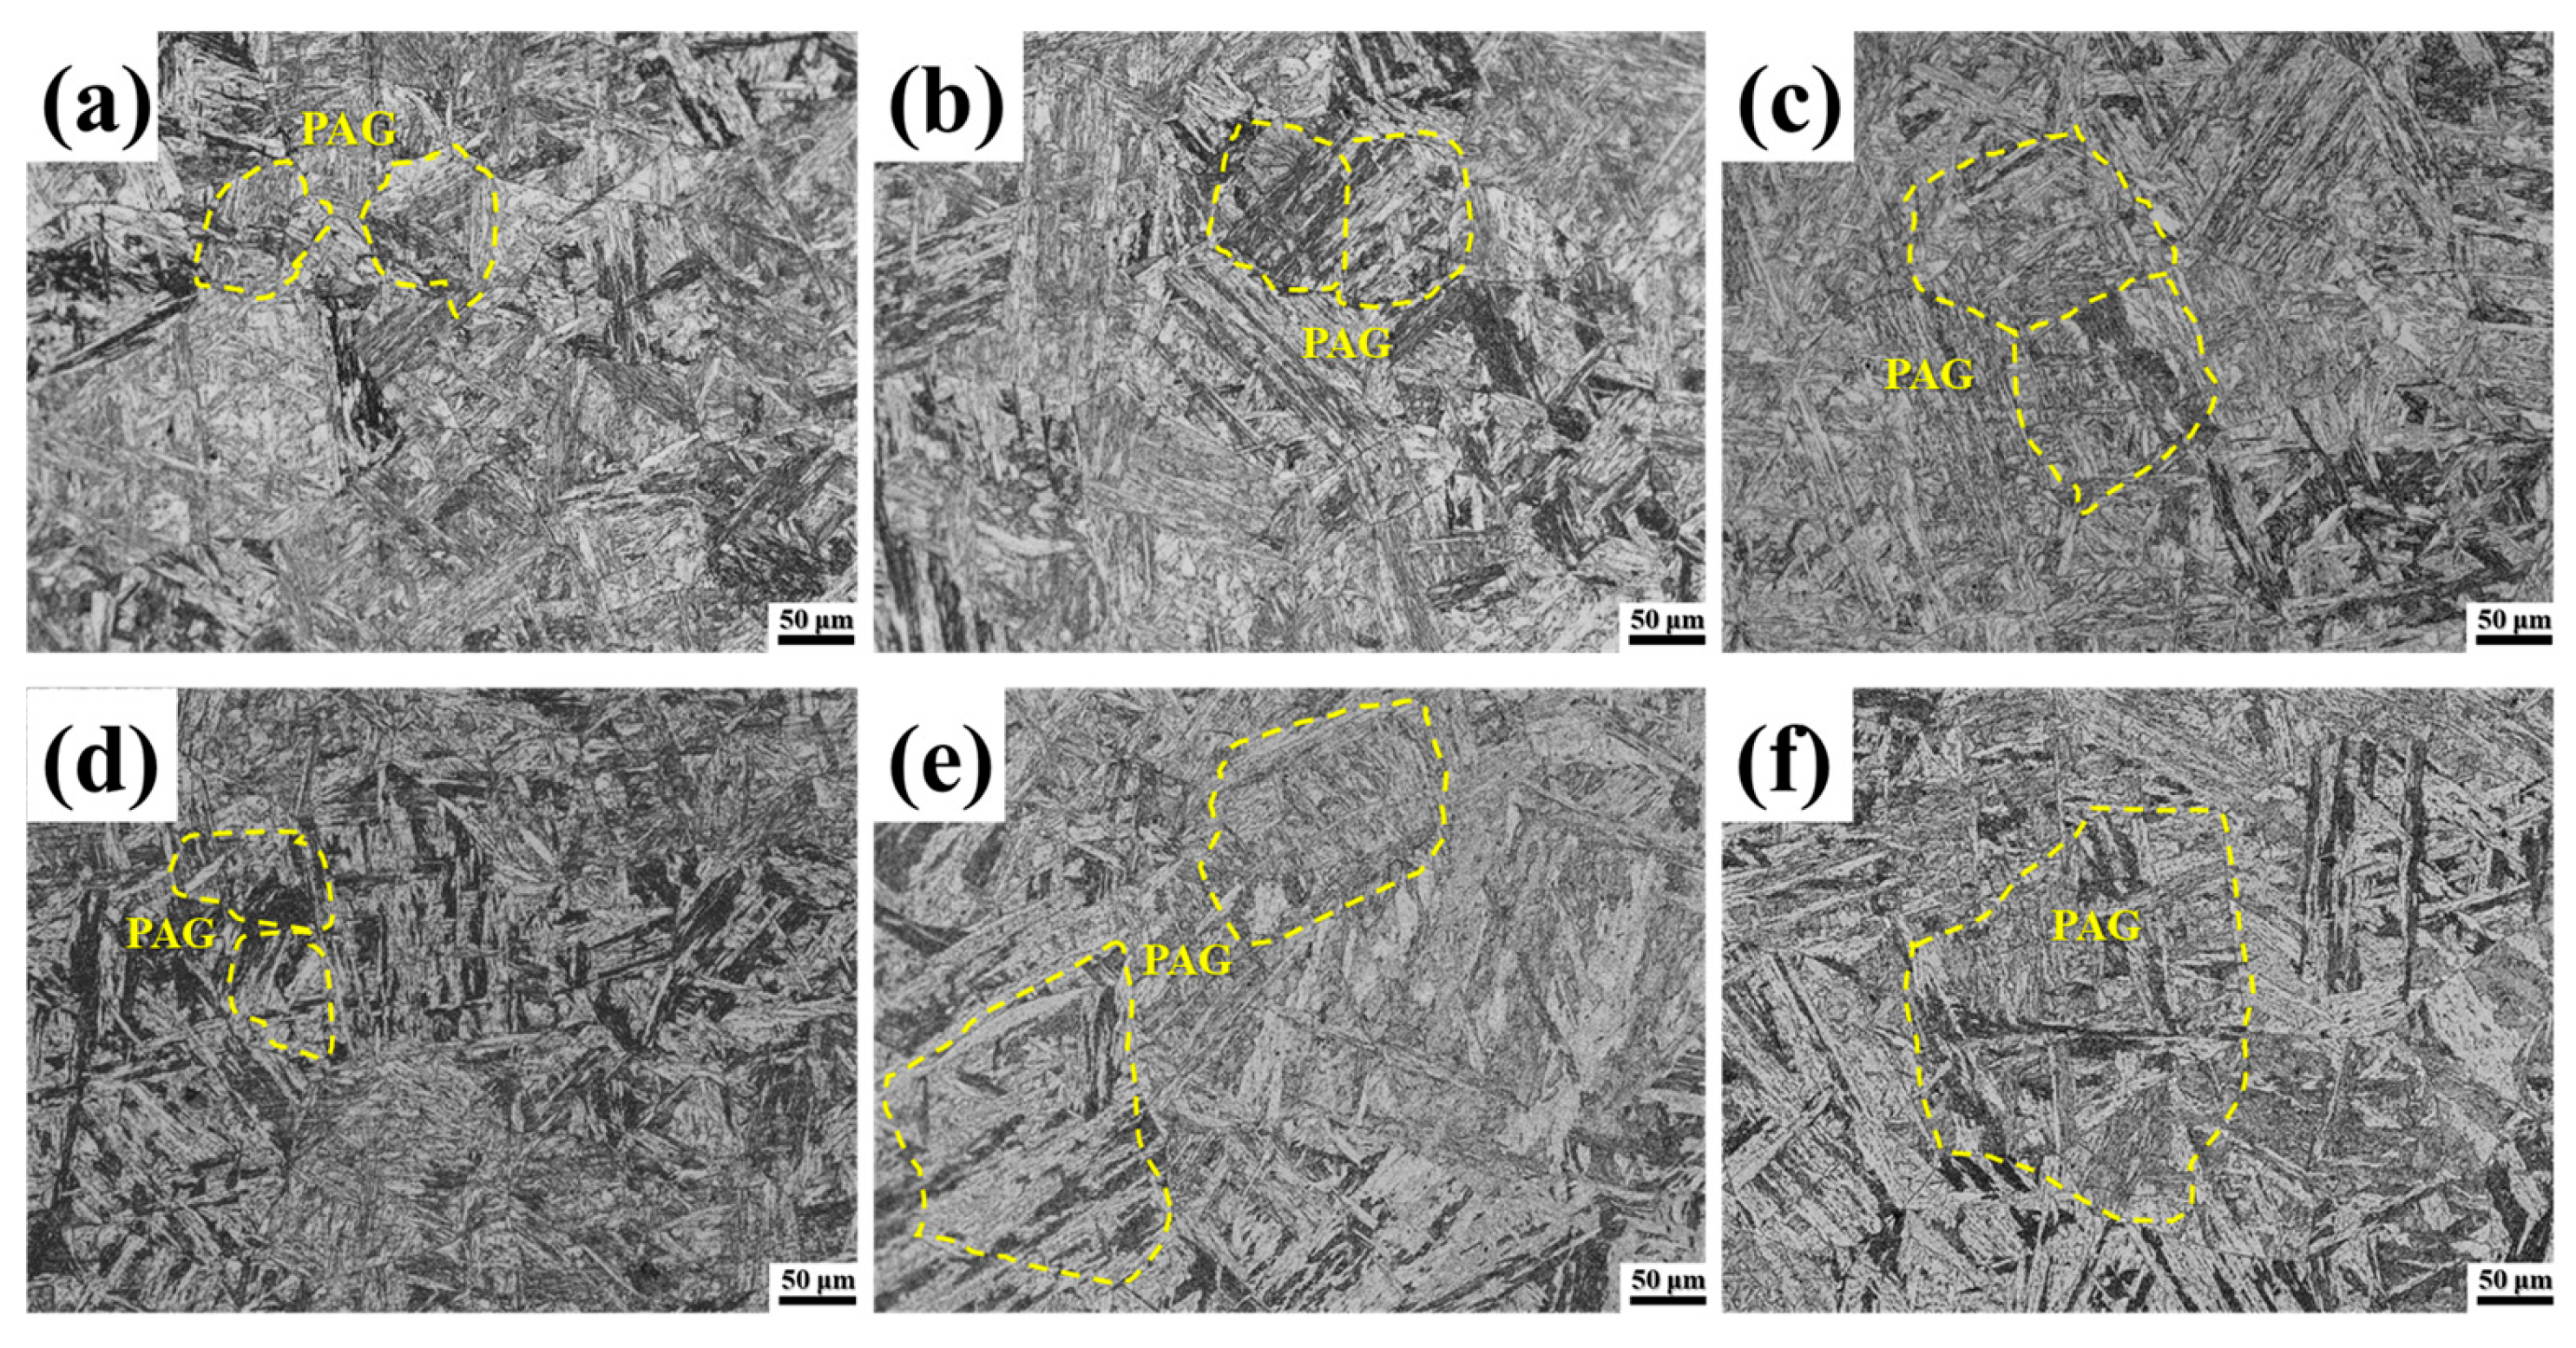
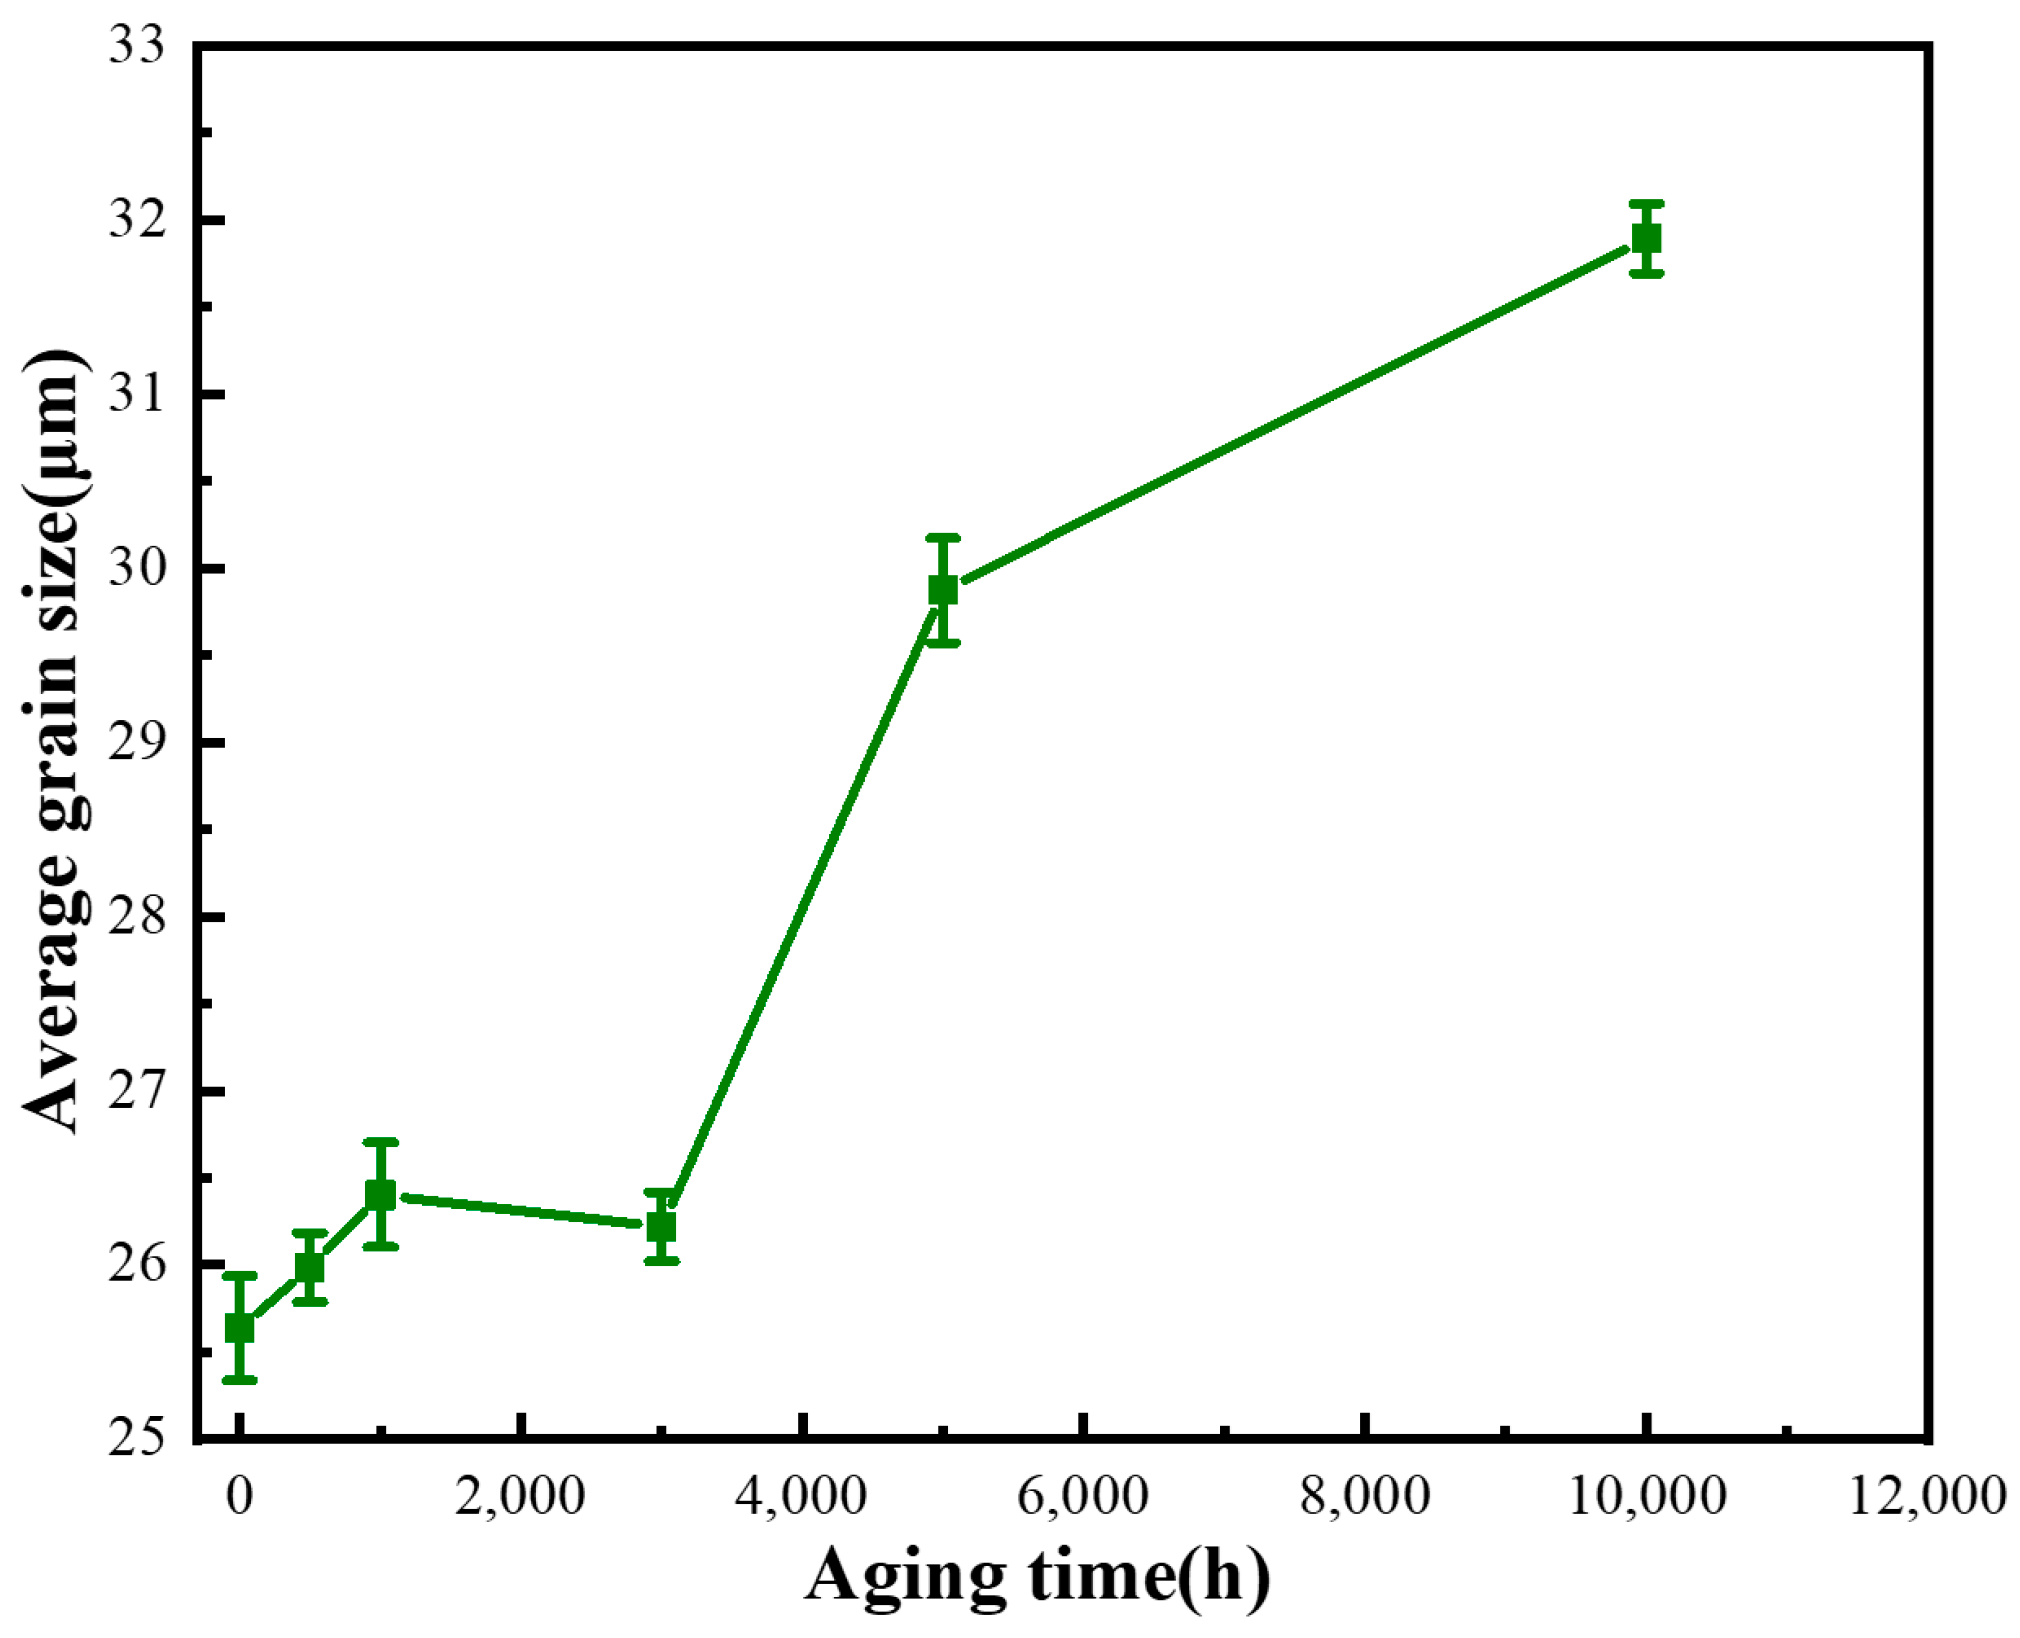
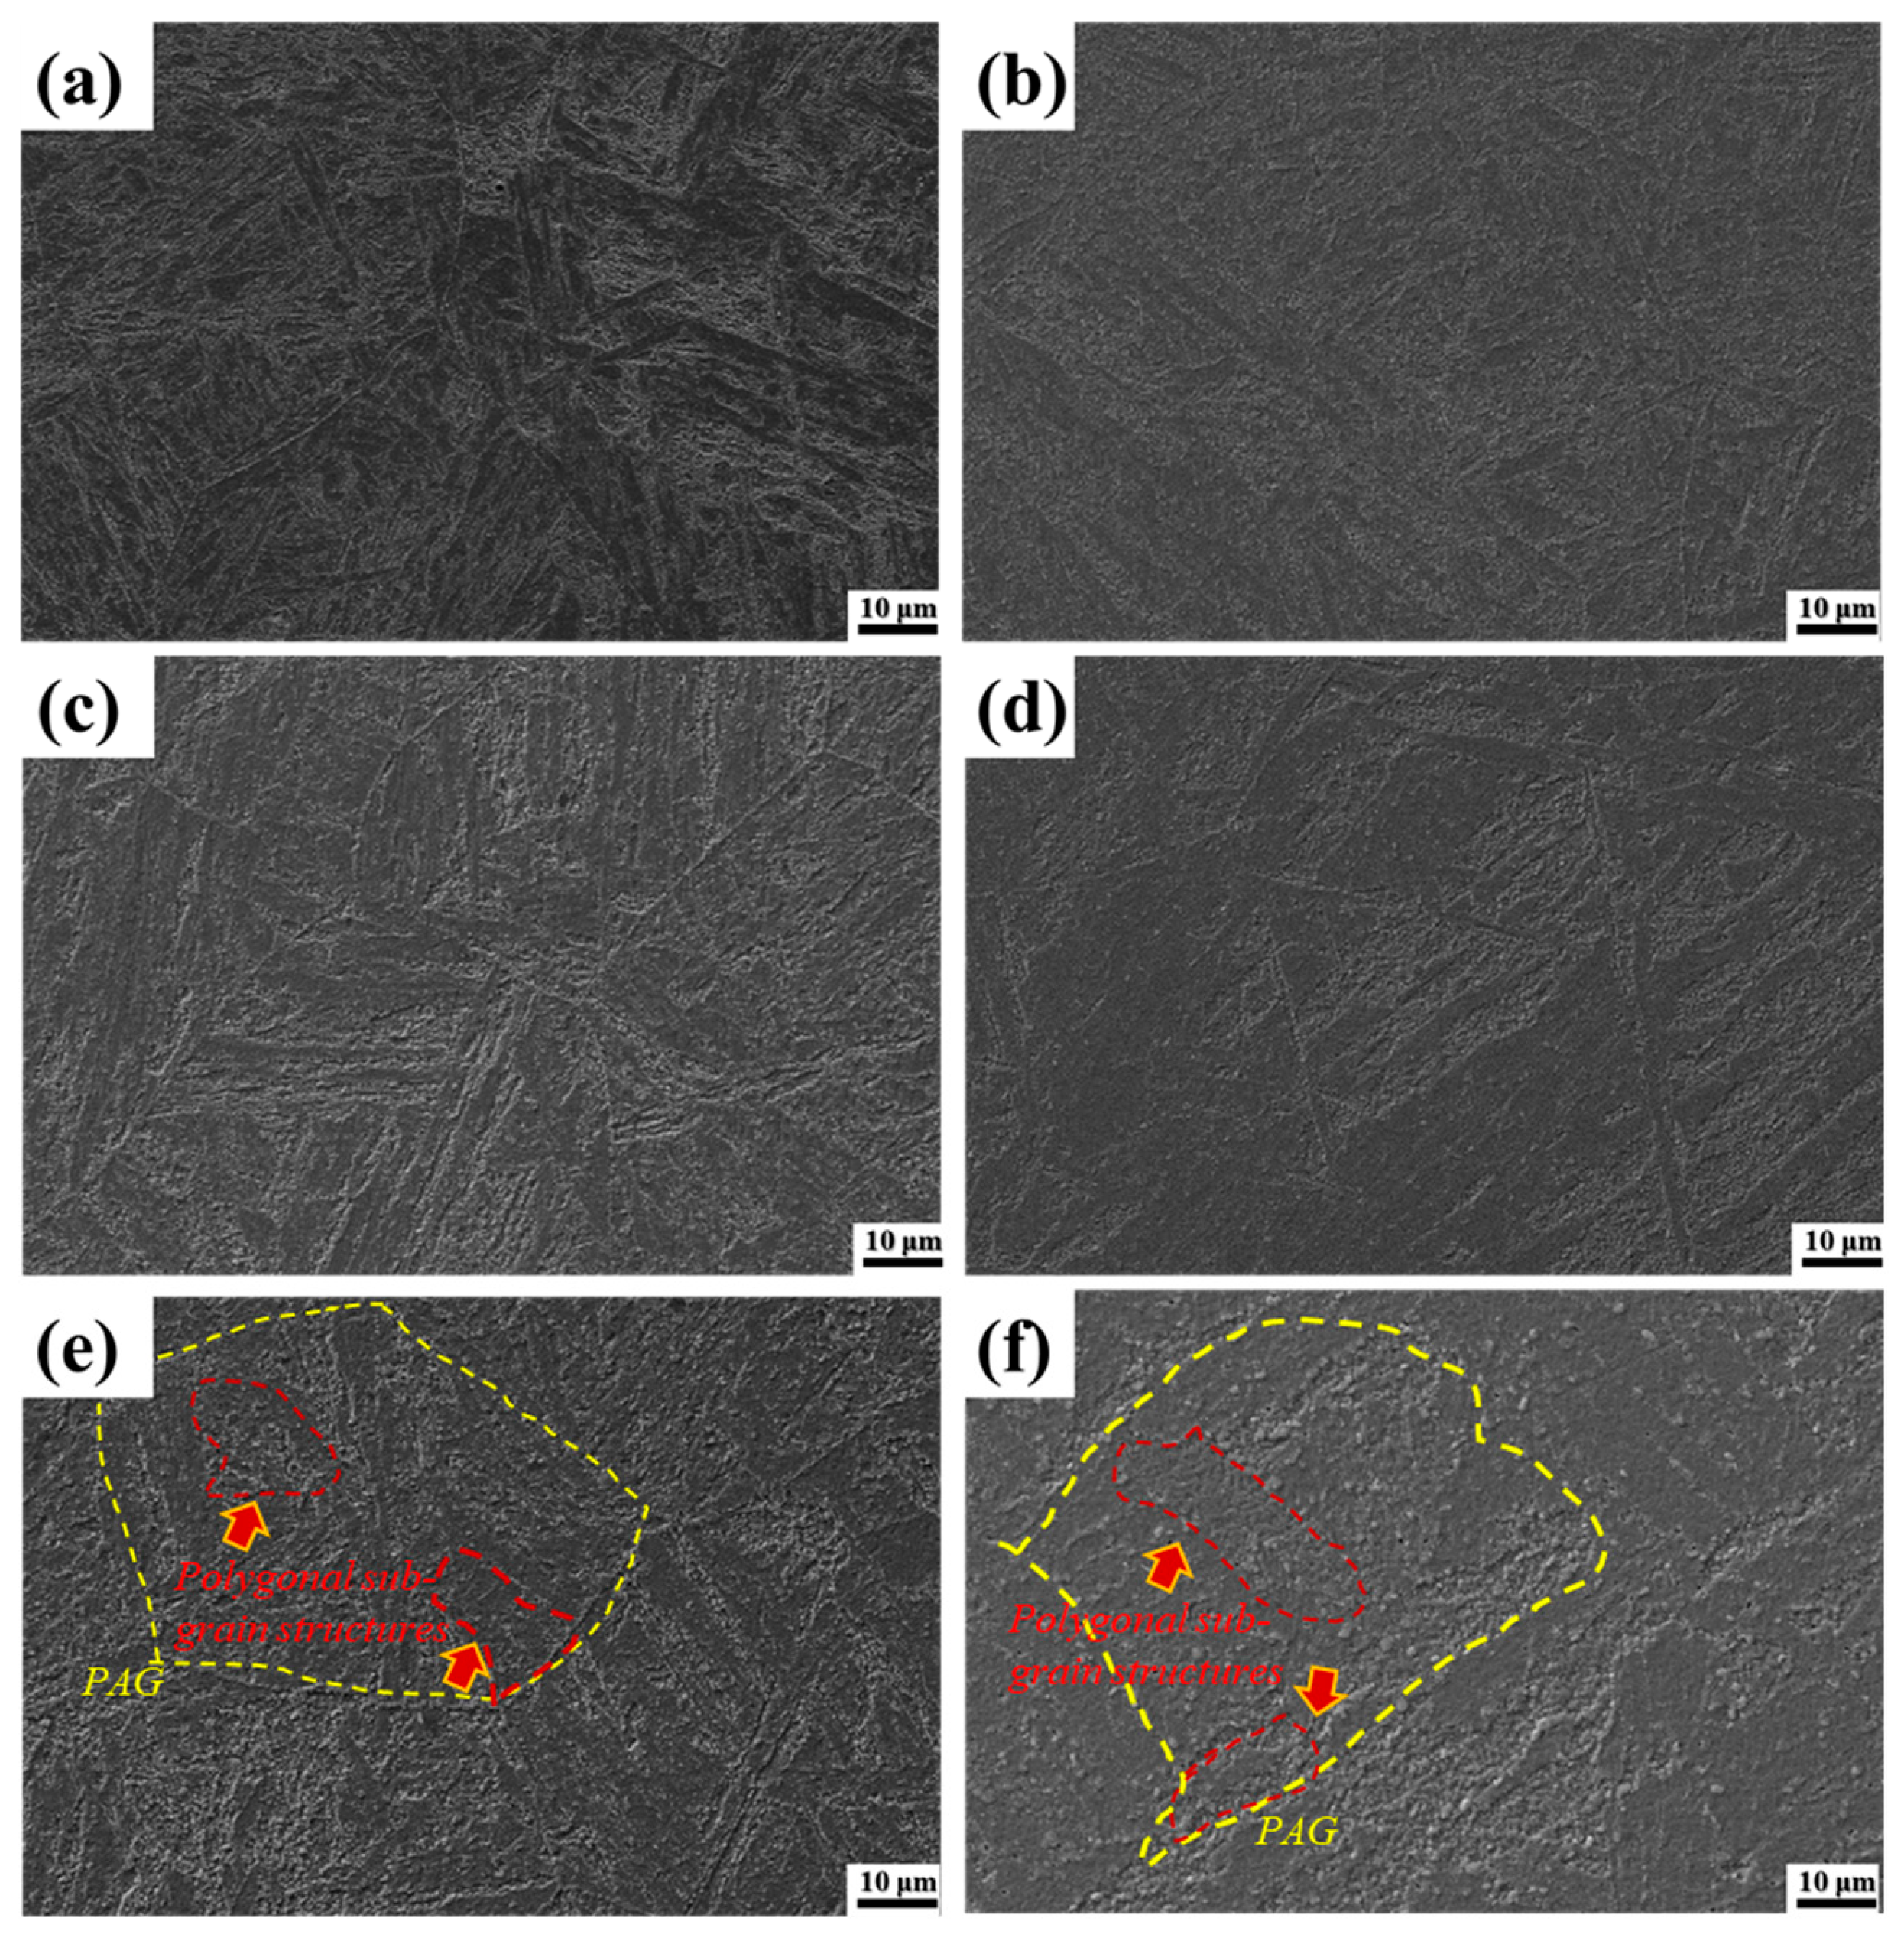
3.1. Microstructure
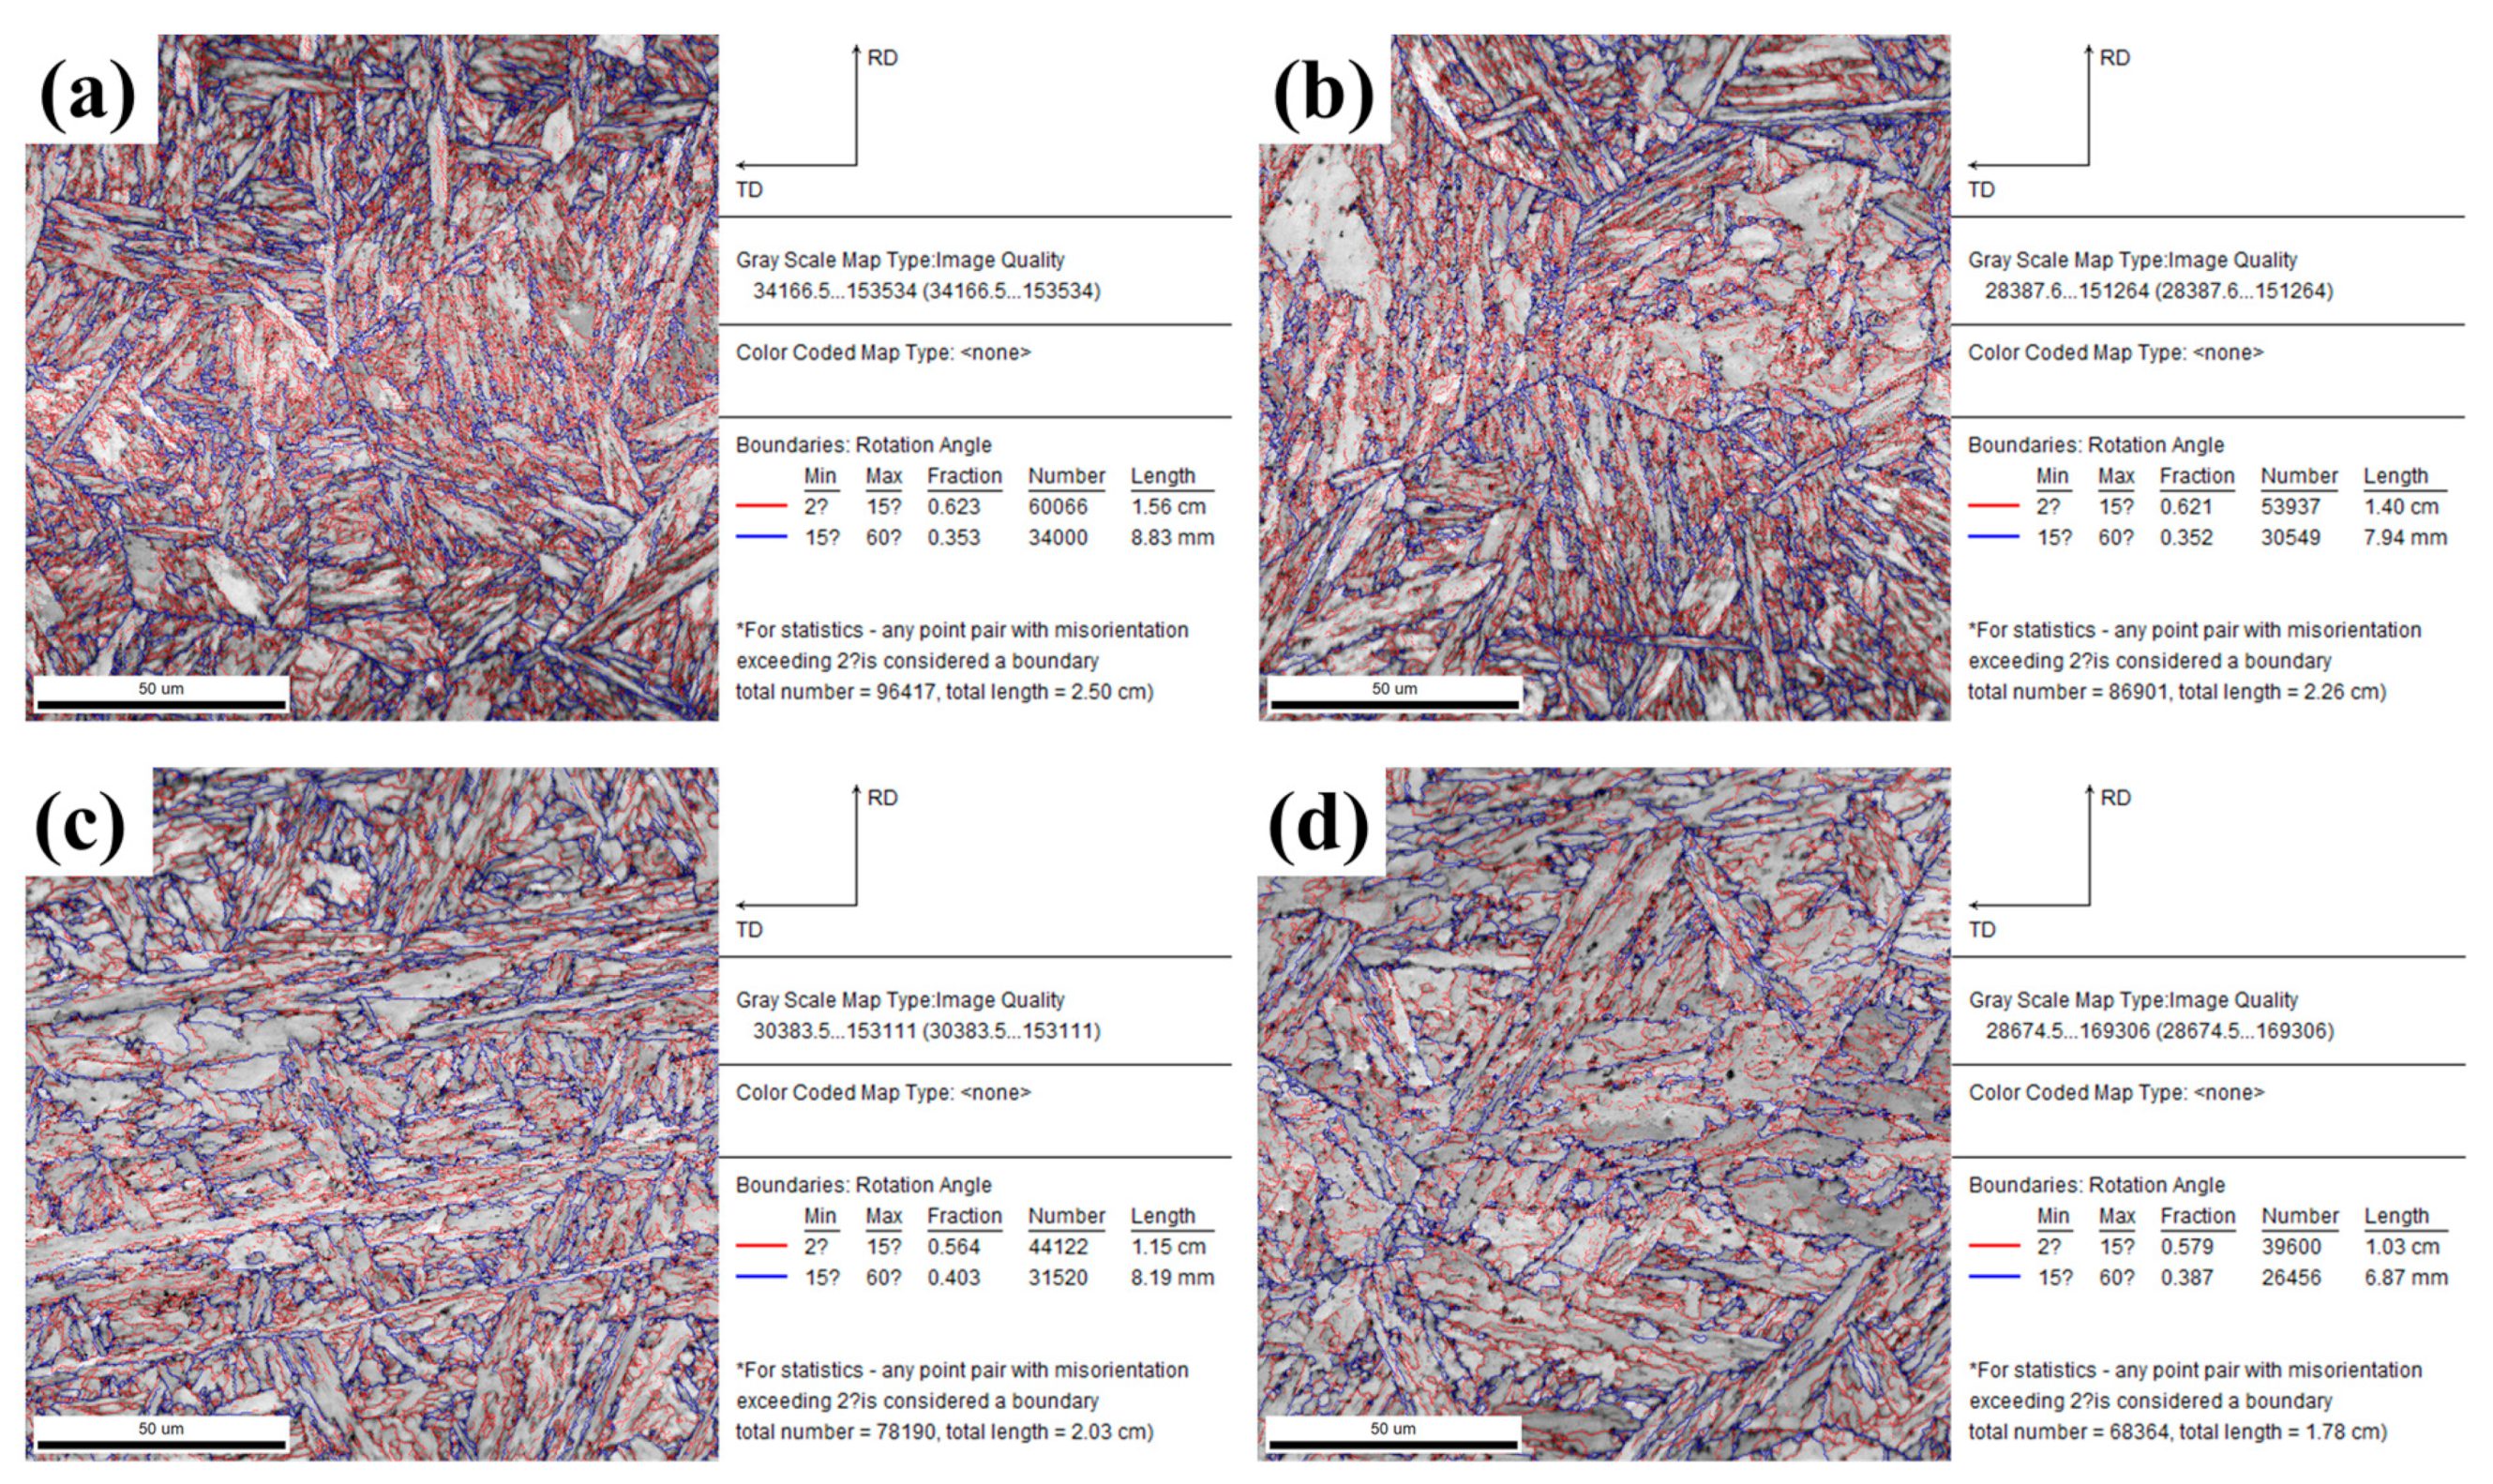
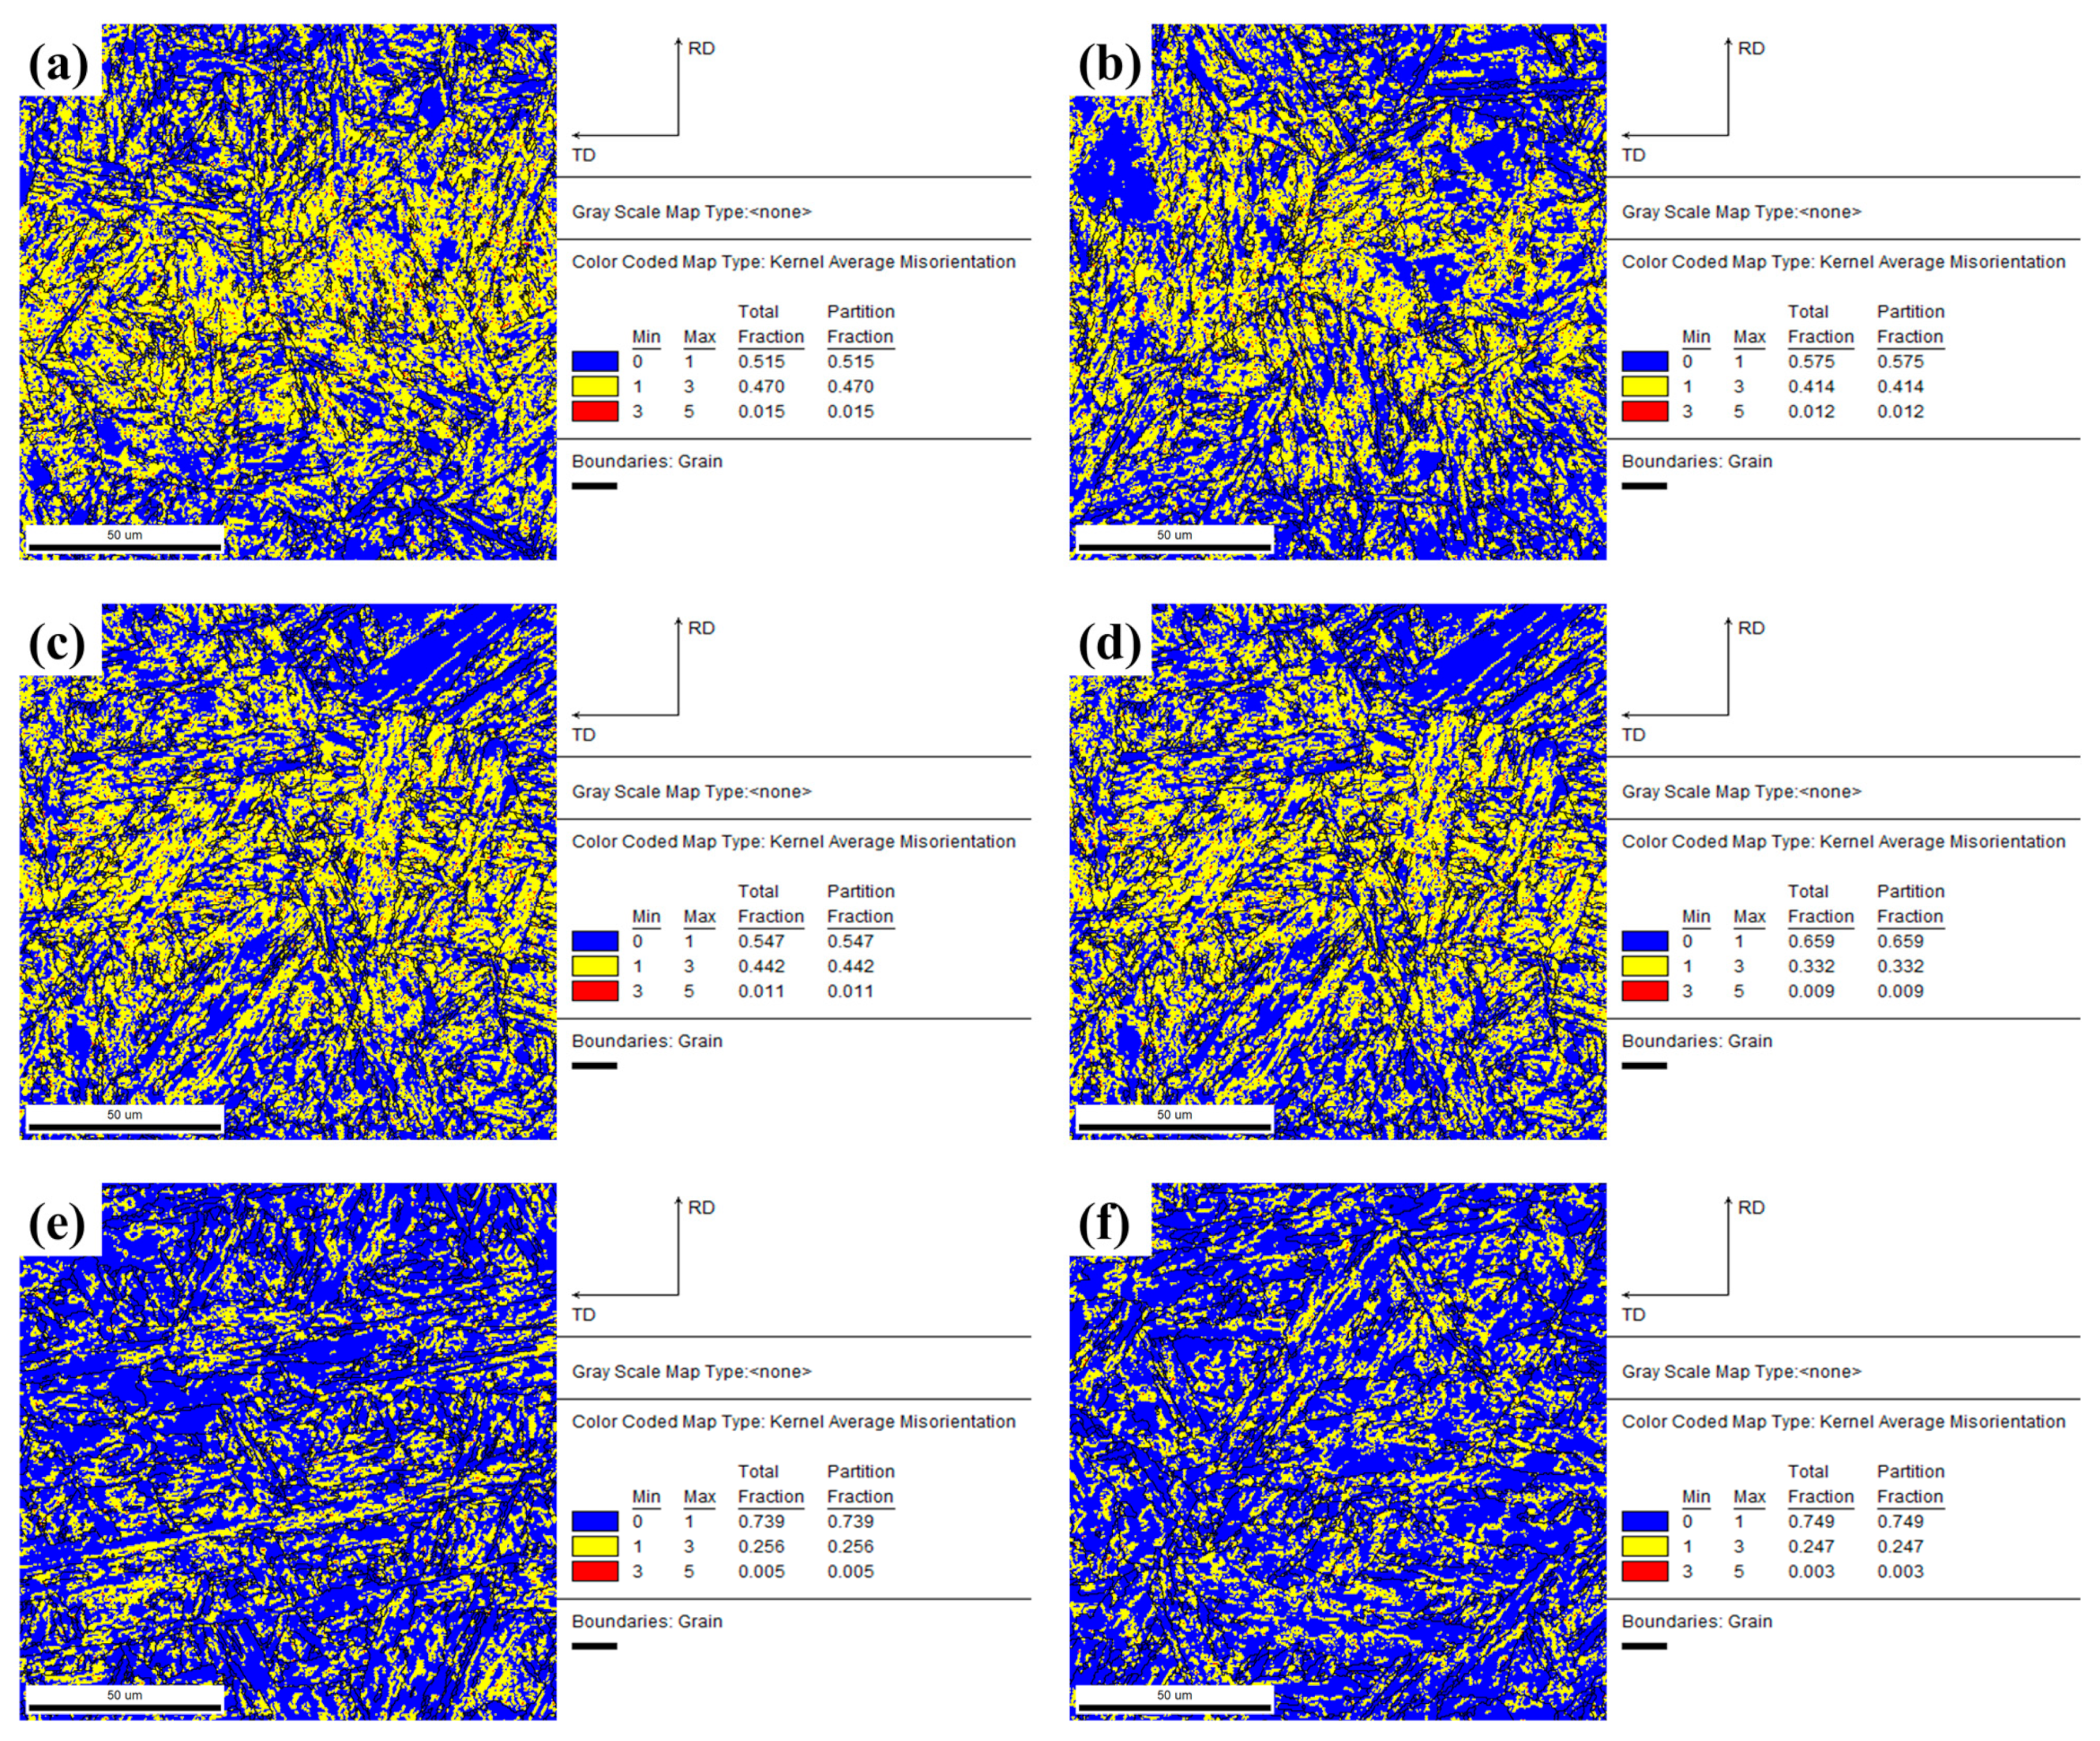
3.2. EBSD Characterizations
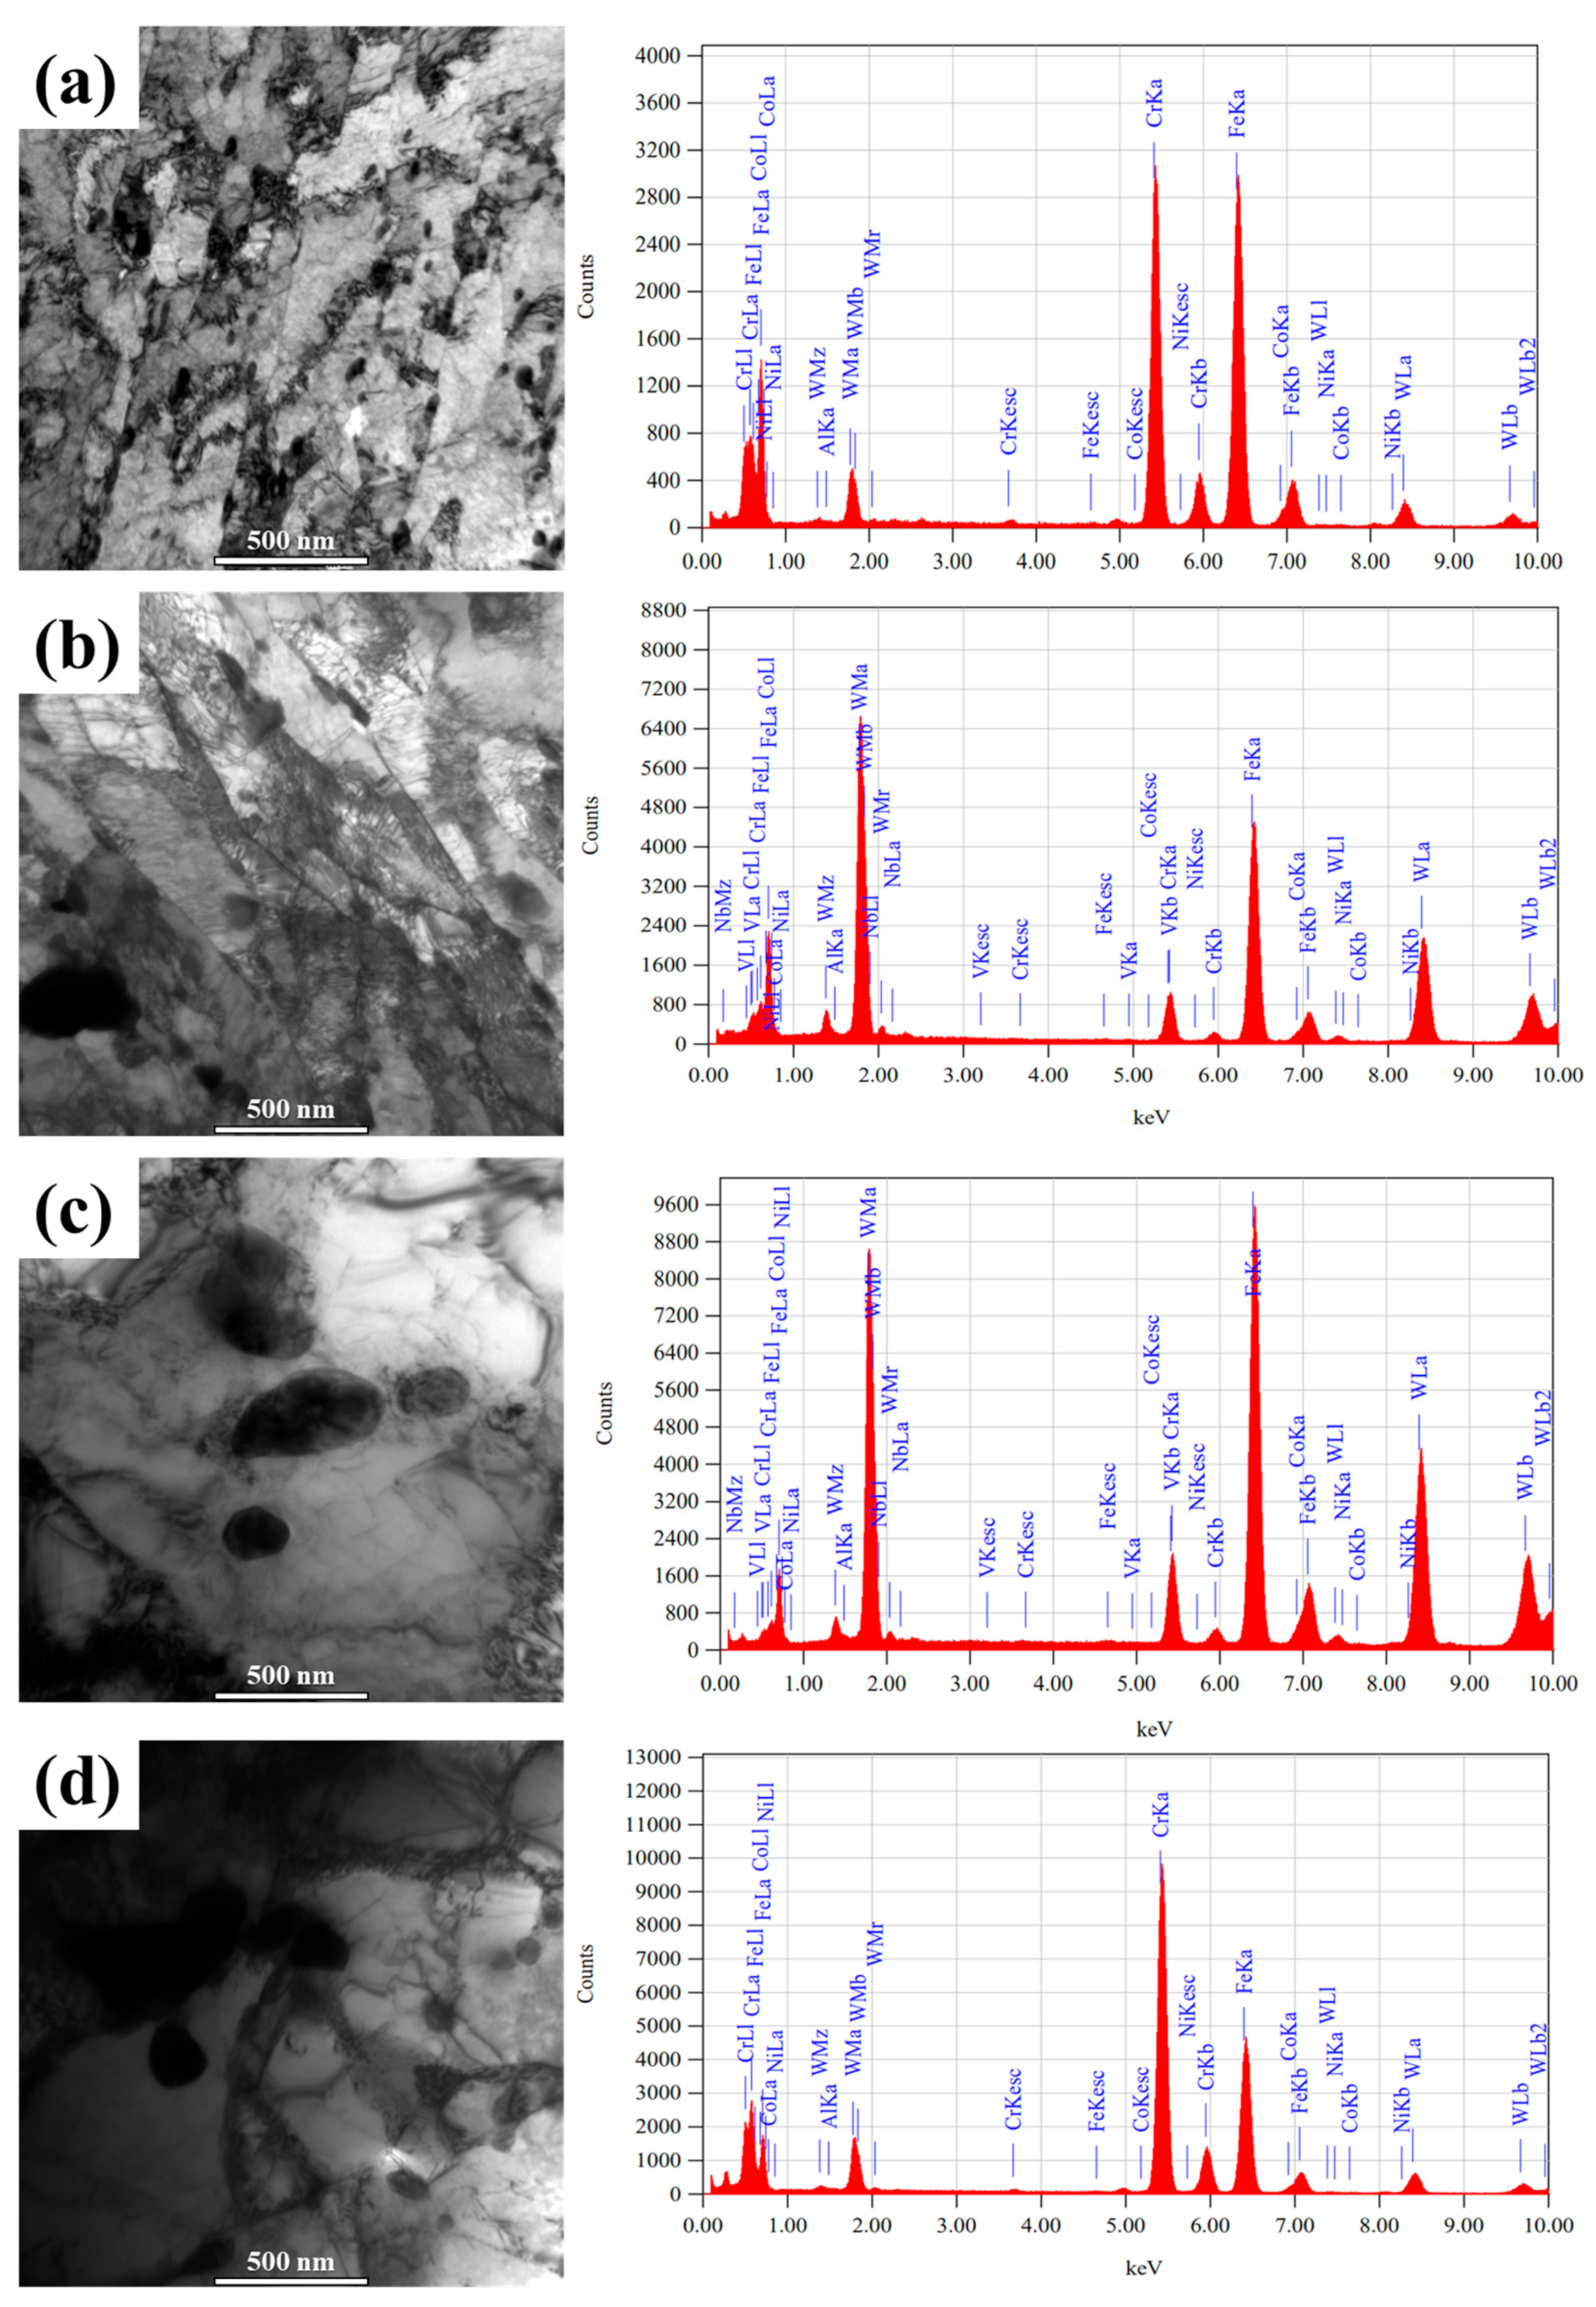
3.3. TEM Observation
3.4. Impact Toughness Evolution and Analysis
4. Conclusions
Author Contributions
Funding
Data Availability Statement
Conflicts of Interest
References
- Abe, F. Precipitate design for creep strengthening of 9% Cr tempered martensitic steel for ultra-supercritical power plants. Sci. Technol. Adv. Mater. 2008, 9, 013002. [Google Scholar] [CrossRef] [PubMed]
- Chen, Y.D.; Chen, X.D.; Jiang, H.F.; Chen, C.G.; Zhang, X.A. Design technology of large-scale spiral wound heat exchanger in refinery industry. Proc. Eng. 2015, 130, 286–297. [Google Scholar] [CrossRef]
- Yang, Z.H.; Liu, B.; Zhao, H.C.; Li, J.F.; Guo, X.H.; Zhang, D.Q.; Liu, Z.H. Pyrolysis mechanism of composite binder composed of coal tar pitch and phenolic resin for carbon materials. J. Anal. Appl. Pyrolysis 2023, 169, 105840. [Google Scholar] [CrossRef]
- Yang, X.J.; Liu, M.H.; Liu, Z.Y.; Du, C.W.; Li, X.G. Failure analysis of a 304 stainless steel heat exchanger in liquid sulfur recovery units. Eng. Fail. Anal. 2020, 116, 104729. [Google Scholar] [CrossRef]
- Hamaguchi, T.; Kurihara, S.; Hirata, H.; Okada, H. Creep rupture properties and microstructures of 9Cr-3Co-3W-Nd-B steel welded joints. Mater. Sci. Eng. A 2022, 831, 142231. [Google Scholar] [CrossRef]
- Panait, C.G.; Zielinska-Lipiec, A.; Koziel, T.; Czyrska-Filemonowicz, A.; Gourgues-Lorenzon, A.-F.; Bendick, W. Evolution of dislocation density, size of subgrains and MX-type precipitates in a P91 steel during creep and during thermal ageing at 600 C for more than 100,000 h. Mater. Sci. Eng. A 2010, 527, 4062. [Google Scholar] [CrossRef]
- Sellars, C.M.; Whiteman, J.A. Recrystallization and grain growth in hot rolling. Met. Sci. 1978, 13, 187–194. [Google Scholar] [CrossRef]
- Semba, H.; Abe, F. Alloy design and creep strength of advanced 9% Cr USC boiler steels containing high concentration of boron. Energy Mater. 2006, 1, 238–244. [Google Scholar] [CrossRef]
- Zhang, T.; Liu, W.; Sun, Y.; Dong, B.; Yang, W.; Chen, L. Investigating the corrosion resistance of Cu-doped Ni-Mo low alloy steel through electrochemical tests. Corros. Commun. 2023, 10, 10–26. [Google Scholar] [CrossRef]
- Wen, J.F.; Tu, S.T. A multiaxial creep-damage model for creep crack growth considering cavity growth and microcrack interaction. Eng. Fract. Mech. 2014, 123, 197–210. [Google Scholar] [CrossRef]
- Muhammed, M.; Mustapha, M.; Ginta, T.L.; Ali, A.M.; Mustapha, F.; Hampo, C.C. Statistical review of microstructure-property correlation of stainless steel: Implication for pre-and post-weld treatment. Processes 2020, 8, 811. [Google Scholar] [CrossRef]
- Niu, J.W.; Wang, Z.F.; Liu, H.; Ma, Y.; Pang, H.X.; Wang, X.T. Response surface optimization of pitch phase change densification using composite phenolic resin co-carbonization to prepare high performance carbon refractories. J. Anal. Appl. Pyrolysis 2023, 175, 106144. [Google Scholar] [CrossRef]
- Yoon, K.B.; Saxena, A.; Liaw, P.K. Characterization of creep-fatigue crack growth behavior under trapezoidal waveshape using C t -parameter. Int. J. Fract. 1993, 16, 95–114. [Google Scholar] [CrossRef]
- Zhang, T.; Liu, W.; Dong, B.; Yang, W.; Chen, L.; Sun, Y.; Li, H.; Zhang, B. Clarifying the effect of Cu element on the corrosion properties of Ni-Mo low alloy steel in marine environment. Corros. Sci. 2023, 216, 111107. [Google Scholar] [CrossRef]
- Xu, L.; Zhao, L.; Gao, Z.; Han, Y. A novel creep-fatigue interaction damage model with the stress effect to simulate the creep-fatigue crack growth behavior. Int. J. Mech. Sci. 2017, 130, 143–153. [Google Scholar] [CrossRef]
- Yan, P.; Liu, Z.; Bao, H.; Weng, Y.; Liu, W. Effect of normalizing temperature on the strength of 9Cr-3W-3Co martensitic heat resistant steel. Mater. Sci. Eng. A 2014, 597, 148–156. [Google Scholar] [CrossRef]
- Zhang, T.; Liu, W.; Dong, B.; Mao, R.; Sun, Y.; Chen, L. Corrosion of Cu-doped Ni–Mo low-alloy steel in a severe marine environment. J. Phys. Chem. Solids 2022, 163, 110584. [Google Scholar] [CrossRef]
- Zhao, L.; Xu, L.; Nikbin, K. Predicting failure modes in creep and creep-fatigue crack growth using a random grain/grain boundary idealised microstructure meshing system. Mater. Sci. Eng. A 2017, 704, 274–286. [Google Scholar] [CrossRef]
- Zhao, L.; Jing, H.; Han, Y.; Xiu, J.; Xu, L. Prediction of creep crack growth behavior in ASME P92 steel welded joint. Comput. Mater. Sci. 2012, 61, 185–193. [Google Scholar] [CrossRef]
- Calderón, L.A.Á.; Rehmer, B.; Schriever, S.; Ulbricht, A.; Jácome, L.A.; Sommer, K.; Mohr, G.; Skrotzki, B.; Evans, A. Creep and creep damage behavior of stainless steel 316L manufactured by laser powder bed fusion. Mater. Sci. Eng. A 2022, 830, 142223. [Google Scholar] [CrossRef]
- Abe, F. Effect of fine precipitation and subsequent coarsening of Fe2W laves phase on the creep deformation behavior of tempered martensitic 9Cr-W steels. Metall. Mater. Trans. A 2005, 36, 321–332. [Google Scholar] [CrossRef]
- Zhang, T.; Liu, W.; Khan, H.I.; Dong, B.; Yang, W.; Sun, Y.; Zhang, B.; Chen, L.; Li, H. Effects of Cu on the corrosion resistance of heat-treated weathering steel in a marine environment. Mater. Today Phys. 2023, 36, 101160. [Google Scholar] [CrossRef]
- Yan, P.; Liu, Z.; Bao, H.; Weng, Y.; Liu, W. Effect of microstructural evolution on high temperature strength of 9Cr-3W-3Co martensitic heat resistant steel under different aging conditions. Mater. Sci. Eng. A 2013, 588, 22–28. [Google Scholar] [CrossRef]
- Gao, Q.; Dong, X.; Li, C.; Lin, Z.; Yang, X.; Dai, M. Microstructure and oxidation properties of 9Cr-1.7W-0.4Mo-Co ferritic steel after isothermal aging. J. Alloys Compd. 2015, 651, 537–543. [Google Scholar] [CrossRef]
- GB/T 229-2007; Metallic Materials-Charpy Pendulum Impact Test Method. National Standard of the People’s Republic of China: Beijing, China, 2007.
- Xiao, B.; Xu, L.; Zhao, L.; Jing, H.; Han, Y.; Tang, Z. Microstructure evolution and fracture mechanism of a novel 9Cr tempered martensite ferritic steel during short term creep. Mater. Sci. Eng. A 2017, 707, 466–477. [Google Scholar] [CrossRef]
- Jiang, H.T.; Wang, Y.X.; Wang, C.J.; Li, M.F.; Xu, Z.H. Catalyst optimization and reduction condition of continuous growth of carbon nanotubes on carbon fiber surface. Ceram. Int. 2023, 49, 25469–25476. [Google Scholar] [CrossRef]
- Wen, J.F.; Srivastava, A.; Benzerga, A.; Tu, S.T.; Needleman, A. Creep crack growth by grain boundary cavitation under monotonic and cyclic loading. J. Mech. Phys. Solids 2017, 108, 68–84. [Google Scholar] [CrossRef]
- Msuyama, F. History of power plants and progress in heat resistant steels. ISIJ Int. 2007, 41, 612–625. [Google Scholar] [CrossRef]


| Impact Toughness Results | BM | 500 h | 1000 h | 3000 h | 5000 h | 10,000 h |
|---|---|---|---|---|---|---|
| Minimum value (J) | 48.5 | 14.8 | 14.9 | 19.2 | 16.5 | 15.3 |
| Maximum value (J) | 53.6 | 20.1 | 21.6 | 21.8 | 17.1 | 16.8 |
| Mean value (J) | 51.3 | 17.4 | 18.2 | 19.6 | 16.7 | 15.7 |
Disclaimer/Publisher’s Note: The statements, opinions and data contained in all publications are solely those of the individual author(s) and contributor(s) and not of MDPI and/or the editor(s). MDPI and/or the editor(s) disclaim responsibility for any injury to people or property resulting from any ideas, methods, instructions or products referred to in the content. |
© 2024 by the authors. Licensee MDPI, Basel, Switzerland. This article is an open access article distributed under the terms and conditions of the Creative Commons Attribution (CC BY) license (https://creativecommons.org/licenses/by/4.0/).
Share and Cite
Yu, J.; Ma, S.; Liang, K.; Yan, K.; Yang, X.; Zhang, S. Evolutions on Microstructure and Impact Toughness of G115 Steel after Long-Term Aging at 700 °C. Metals 2024, 14, 921. https://doi.org/10.3390/met14080921
Yu J, Ma S, Liang K, Yan K, Yang X, Zhang S. Evolutions on Microstructure and Impact Toughness of G115 Steel after Long-Term Aging at 700 °C. Metals. 2024; 14(8):921. https://doi.org/10.3390/met14080921
Chicago/Turabian StyleYu, Jianming, Shaohai Ma, Kui Liang, Kai Yan, Xisheng Yang, and Shuli Zhang. 2024. "Evolutions on Microstructure and Impact Toughness of G115 Steel after Long-Term Aging at 700 °C" Metals 14, no. 8: 921. https://doi.org/10.3390/met14080921
APA StyleYu, J., Ma, S., Liang, K., Yan, K., Yang, X., & Zhang, S. (2024). Evolutions on Microstructure and Impact Toughness of G115 Steel after Long-Term Aging at 700 °C. Metals, 14(8), 921. https://doi.org/10.3390/met14080921