Article

Effect of Etching Condition on Nanoporous Structure and Methyl Orange Decomposition of Fe-Si-B Metallic Glass

The State Key Laboratory for Refractories and Metallurgy, Collaborative Innovation Center for Advanced Steels, International Research Institute for Steel Technology, Hubei Province Key Laboratory of Systems Science in Metallurgical Process, College of Science, Wuhan University of Science and Technology, Wuhan 430081, China
*
Authors to whom correspondence should be addressed.
Metals 2024, 14(8), 936; https://doi.org/10.3390/met14080936
Submission received: 24 June 2024 / Revised: 1 August 2024 / Accepted: 9 August 2024 / Published: 16 August 2024
(This article belongs to the Special Issue Corrosion of Metals: Behaviors and Mechanisms)

Abstract

:
As an efficient advanced oxidation process, the Fenton-like reaction provides a promising way toward the degradation of organic pollutants; thus, the development of a highly efficient heterogeneous catalyst is of great significance. Herein, the chemical etching behavior of Fe-Si-B metallic glass (MG) ribbons in a dilute HF solution is studied by varying the etching time. Based on this, the uniform nanoporous (NP) structures are successfully fabricated. The Fe-Si-B MG ribbons after etching for 30, 60, and 90 min still maintain an amorphous structure and possess much larger specific surface areas than untreated Fe-Si-B ribbons. The thicknesses of their nanoporous structures, with a pore size range of tens to hundreds of nanometers, are about 92.0, 180.5, and 223.4 nm, respectively. The formation of the nanoporous structure probably follows the pitting corrosion mechanism, mainly referring to the generation of corrosion pits due to the selective leaching of Si and B and pore growth and integration owing to the selective corrosion of Fe. The Fenton-like system of NPFe/H2O2 exhibits enhanced degradation performance toward methyl orange (MO), primarily due to the high intrinsic catalytic activity of the amorphous structure and the large specific surface areas of nanoporous structures, indicating the great potential application of NPFe in wastewater treatments. The mechanism analysis shows that MO degradation mainly contains two sub-processes: the heterogeneous reaction on the catalyst surface and the homogeneous reaction in MO solution, which exhibit a strong synergistic effect with excellent degradation performance.

1. Introduction

Currently, with the promotion of modern industrial systems, ever-increasing volumes of wastewater with various organic pollutants are abundant and generated in dyestuff, papermaking, textiles, plastics, and dyestuff petrochemical industrial activities [1,2]. Among them, synthetic dyestuff-containing wastewaters, including biological toxic and refractory organics, cause serious ecological and environmental problems [3,4]. Thus, various degradation methods have been used to remove these organic contaminants, such as physical adsorption, biological degradation, redox reactions, and Fenton processes [2]. Due to the advantages of simple operation, cost-effectiveness, high efficiency, and non-preference, Fenton or Fenton-like reactions have attracted extensive attention [5]. The classic Fenton process, using Fe2+/H2O2 as the Fenton reagent, is a homogeneous redox reaction that occurs via the interconverting of Fe2+/Fe3+ to generate hydroxyl free radical (HO•), which thus oxidizes and decomposes the organic pollutants to produce CO2, H2O, and inorganic salts. However, the homogeneous process not only causes a great amount of sludge required for further treatment but also exhibits a limit in separating and recycling the Fenton catalyst [6,7]. Therefore, Fenton-like reactions employing solid zero-valent metals as catalysts, such as zero-valent iron (ZVI) [8], have received wide attention and been studied in depth. The significant advantages of ZVI are environmental friendliness, low cost, and easy recyclability. Otherwise, the traditional ZVI also exhibits the obvious limitation that the surface is easily oxidized and thus forms hydroxides during the degradation process, leading to a severe decrease in degradation efficiency in the long-term service process [9].
It is well-known that metallic glasses (MGs) with a metastable nature and unique disordered atom structure exhibit specific physical and chemical properties [10,11,12]. Recently, besides the prominent soft magnetic properties of Fe-based MGs, their much better catalytic degradation activity, compared with their crystalline counterparts and conventional ZVI, has also been identified for application in organic contaminant wastewater treatments. The enhanced catalytic activity is mainly attributed to the lower activation energy of electron transfer because of the metastable character of surface atoms [13,14]. For instance, Yao’s group [15] reported that the reaction rate constant of commercial Fe-Si-B MG ribbons was 1300 and 60 times higher than that of commercial Fe powders for the reduction degradation of Orange II (100 mg L−1) and Direct Blue 6 (200 mg L−1), respectively. In addition, the combination of Fe-based MGs with H2O2 was also reported for the oxidative degradation of azo dyes via a Fenton-like process. Pan’s group [16] found the ultra-high degradation rate of Fe-Si-B MG ribbons in the presence of H2O2 at pH 3.0 toward Rhodamine B. Jia et al. [17] also reported the significantly enhanced degradability of azo dyes by Fe-based MG alloy compared with other Fe-based catalysts, such as Fe2+, crystallized a-Fe, and iron oxides.
Recently, in order to further improve the catalytic degradation performance, the construction of porous structures with large specific surface areas has been widely studied for application in wastewater treatments [18,19]. For instance, Wang et al. [20] prepared Fe-Si-B-Nb MG powders with many nanoscale corrugations on the surface using the ball-milling method and found that the degradation efficiency of Direct Blue was about 200 times faster than that of conventional Fe powders. Si et al. [19] constructed the micrometer-scale porous composite structure by grappling Fe-Si-B powders into Ni foam, and this composite structure achieved a compelling improvement in degradation activity and durability toward azo dyes. Quite notably, using Fe-based MGs as the precursor, the dealloying technique was applied to the preparation of nanometer-scale porous structures, which refers to the selective dissolution of non-noble elements and the self-assembly of residual noble metal atoms to form bi-continuous three-dimensional (3D) nanoporous structures [21]. Generally speaking, MG alloys can be considered as an ideal etching precursor to synthetic homogeneous nanoporous structures due to their uniform composition distribution and single-phase amorphous structure [22,23,24]. Nevertheless, because of the high chemical activity (poor corrosion resistance) of the Fe element in etchant solutions, the fabrication of Fe-based nanoporous structures through dealloying still faces many challenges. Chan’s group [25,26] successfully synthesized nanoporous structures on the Fe-B MG ribbon surface through chemical/electrochemical etching, which presented a dramatic increase in the specific surface area, thus greatly improving the catalytic degradability toward Direct Blue 15. However, the preparation of a nanoporous structure through the dealloying of Fe-Si-B MG alloy has not been studied in detail; it is one of the typical Fe-based MG grades, and it has been widely used in power transformers. And, one can expect that there will be a great deal of obsolete Fe-Si-B MG products from the electric power industry in the near future. Moreover, the catalytic degradation of organic pollutants by a solid catalyst is derived from both the heterogeneous reaction on the catalyst surface and the homogeneous reaction in an aqueous solution [4,24]. Hence, a detailed analysis of the degradation process of solid Fe-based nanoporous catalysts also requires in-depth discussion.
In this work, using commercial Fe78Si9B13 (at. %) MG ribbons as a precursor (commercial code 1K101), a nanoporous structure was successfully fabricated on the ribbon surface through simple chemical etching in a diluted HF solution. Focusing on the origin of pitting corrosion and the evolution of the element proportion, the formation mechanism of the nanoporous structure was discussed in detail. Subsequently, using methyl orange (MO) solution as the simulated organic wastewater, the degradation properties and mechanism were studied in depth, as well as the effect of reaction parameters on the MO degradation efficiency.

2. Materials and Experiments

2.1. Materials and Reagents

The commercial 1K101 MG ribbons of Fe78Si9B13 (at. %) were purchased from MCC Advanced Materials Technology Co., Ltd. (Beijing, China). The ribbon thickness and width are about 25 μm (±5 μm) and 150 mm (±1 mm), respectively. The chemicals methyl orange (MO, C14H14N3SO3Na), hydrofluoric acid (HF, 40 wt.%) (National Pharmaceutical Reagents, Shanghai, China), sulfuric acid (H2SO4, 96-98 wt.%) (National Pharmaceutical Reagents, Shanghai, China), sodium hydroxide (NaOH) (National Pharmaceutical Reagents, Shanghai, China), ferric sulfate (FeSO4∙7H2O) (National Pharmaceutical Reagents, Shanghai, China), hydrogen peroxide (H2O2, 30 wt.%) (National Pharmaceutical Reagents, Shanghai, China), methanol (CH3OH) (National Pharmaceutical Reagents, Shanghai, China), and alcohol (C2H5OH) (National Pharmaceutical Reagents, Shanghai, China) were purchased from Sinopharm Chemical Reagent Co., Ltd. (National Pharmaceutical Reagents, Shanghai, China). All the chemical reagents used in this work were of analytical grade, and deionized water was used throughout this study.

2.2. Preparation and Structural Characterization

The chemical etching of Fe-Si-B MG ribbons was performed in a 0.1 M HF ( National Pharmaceutical Reagents, Shanghai, China) solution at room temperature for several minutes (0–90 min), and then the as-etched ribbons were repeatedly rinsed with deionized water and absolute ethyl alcohol. The ribbon structures with and without the etching treatment were confirmed through grazing-incidence X-ray diffraction (GI-XRD, Rigaku/SmartLab SE, Tokyo, Japan) with Co K alpha radiation. The step angle, grazing angle, and scanning range of GI-XRD are 0.05°/step, 0.5°, and 20–80°, respectively. The surface morphology and composition were examined through Field-Emission Scanning Electron Microscopy in Secondary Electron Mode (FE-SEM, ThermoFisher, Apreo S Hivac, Waltham, MA, USA) coupled with energy dispersive X-ray spectroscopy (EDX, Oxford, Aztec Ultim Live 100 X, Oxford, UK) and atomic force microscopy (AFM, Bruker, Dimension ICON, Karlsruhe, Germany). Furthermore, the specific surface area of the porous products was measured by Brunner/Emmet/Teller (BET, JW-BK112T, Beijing, China) test using several small pieces cut from Fe-Si-B ribbons with an average area of about 1.0 square centimeter as the test samples. The above characterization and testing have been conducted multiple times to eliminate any possible randomness. And in order to obtain the uniform nanoporous structure, we excluded the possible influence of environmental factors during acid invasion. After multiple characterizations of the eroded sample surface, we obtained appropriate composition and experimental parameters for uniform pores.

2.3. Batch Experiments for Degradation of Azo Dyes

The azo dye degradation experiments were carried out in a 250 mL glass beaker under water bath heating conditions. The azo dye of MO as the main target contaminant was dissolved in deionized water to obtain a 100 mg/L aqueous solution as the simulated dye-containing wastewater. The pH value of the wastewater was adjusted using 0.5 M H2SO4 and 1.0 M NaOH solutions and measured through a digital pH meter (PH818, Dongguan, China). In the typical degradation run, the glass beaker with 150 mL (±2 mL) simulated wastewater was put into the water bath. When the MO wastewater reached the desired temperature (20–50 °C), the degradation reaction was started by adding a given amount of the as-etched Fe-Si-B ribbons (some small pieces with an average area of about 1.0 square centimeter) and a certain dosage of H2O2 into the glass reactor. At predetermined intervals, a 1.0 mL solution specimen was taken out and then subjected to various examinations. In the degradation experiment, we conducted three repeated experiments for each performance test to eliminate any possible randomness. And during the experimental process, we conducted repeated experiments to eliminate potential environmental factors that may affect the experimental results. The concentration of the Fe ion in the MO solution was measured by an inductively coupled plasma-mass spectrometer (ICP-MS, PerkinElmer NexION 1000G/NexION 1000G, Waltham, MA, USA). The dye concentration was measured by an ultraviolet-visible (UV-vis) spectrophotometer (UV-1500PC, Shanghai, China). The degradation rate was evaluated by Equation (1) as follows:
D e g r a d a t i o n   r a t e = C t C 0 × 100 %
where Ct is the MO concentration (mg/L) at the reaction time t and C0 is the initial concentration of the MO solution (mg/L). In order to research the effect of reaction parameters on the degradation performance, the experiments were conducted at various pH values (2–9), catalyst dosages (0–0.5 g/L), H2O2 concentrations (0–50 mM), and temperatures (20–50 °C).

3. Results and Discussion

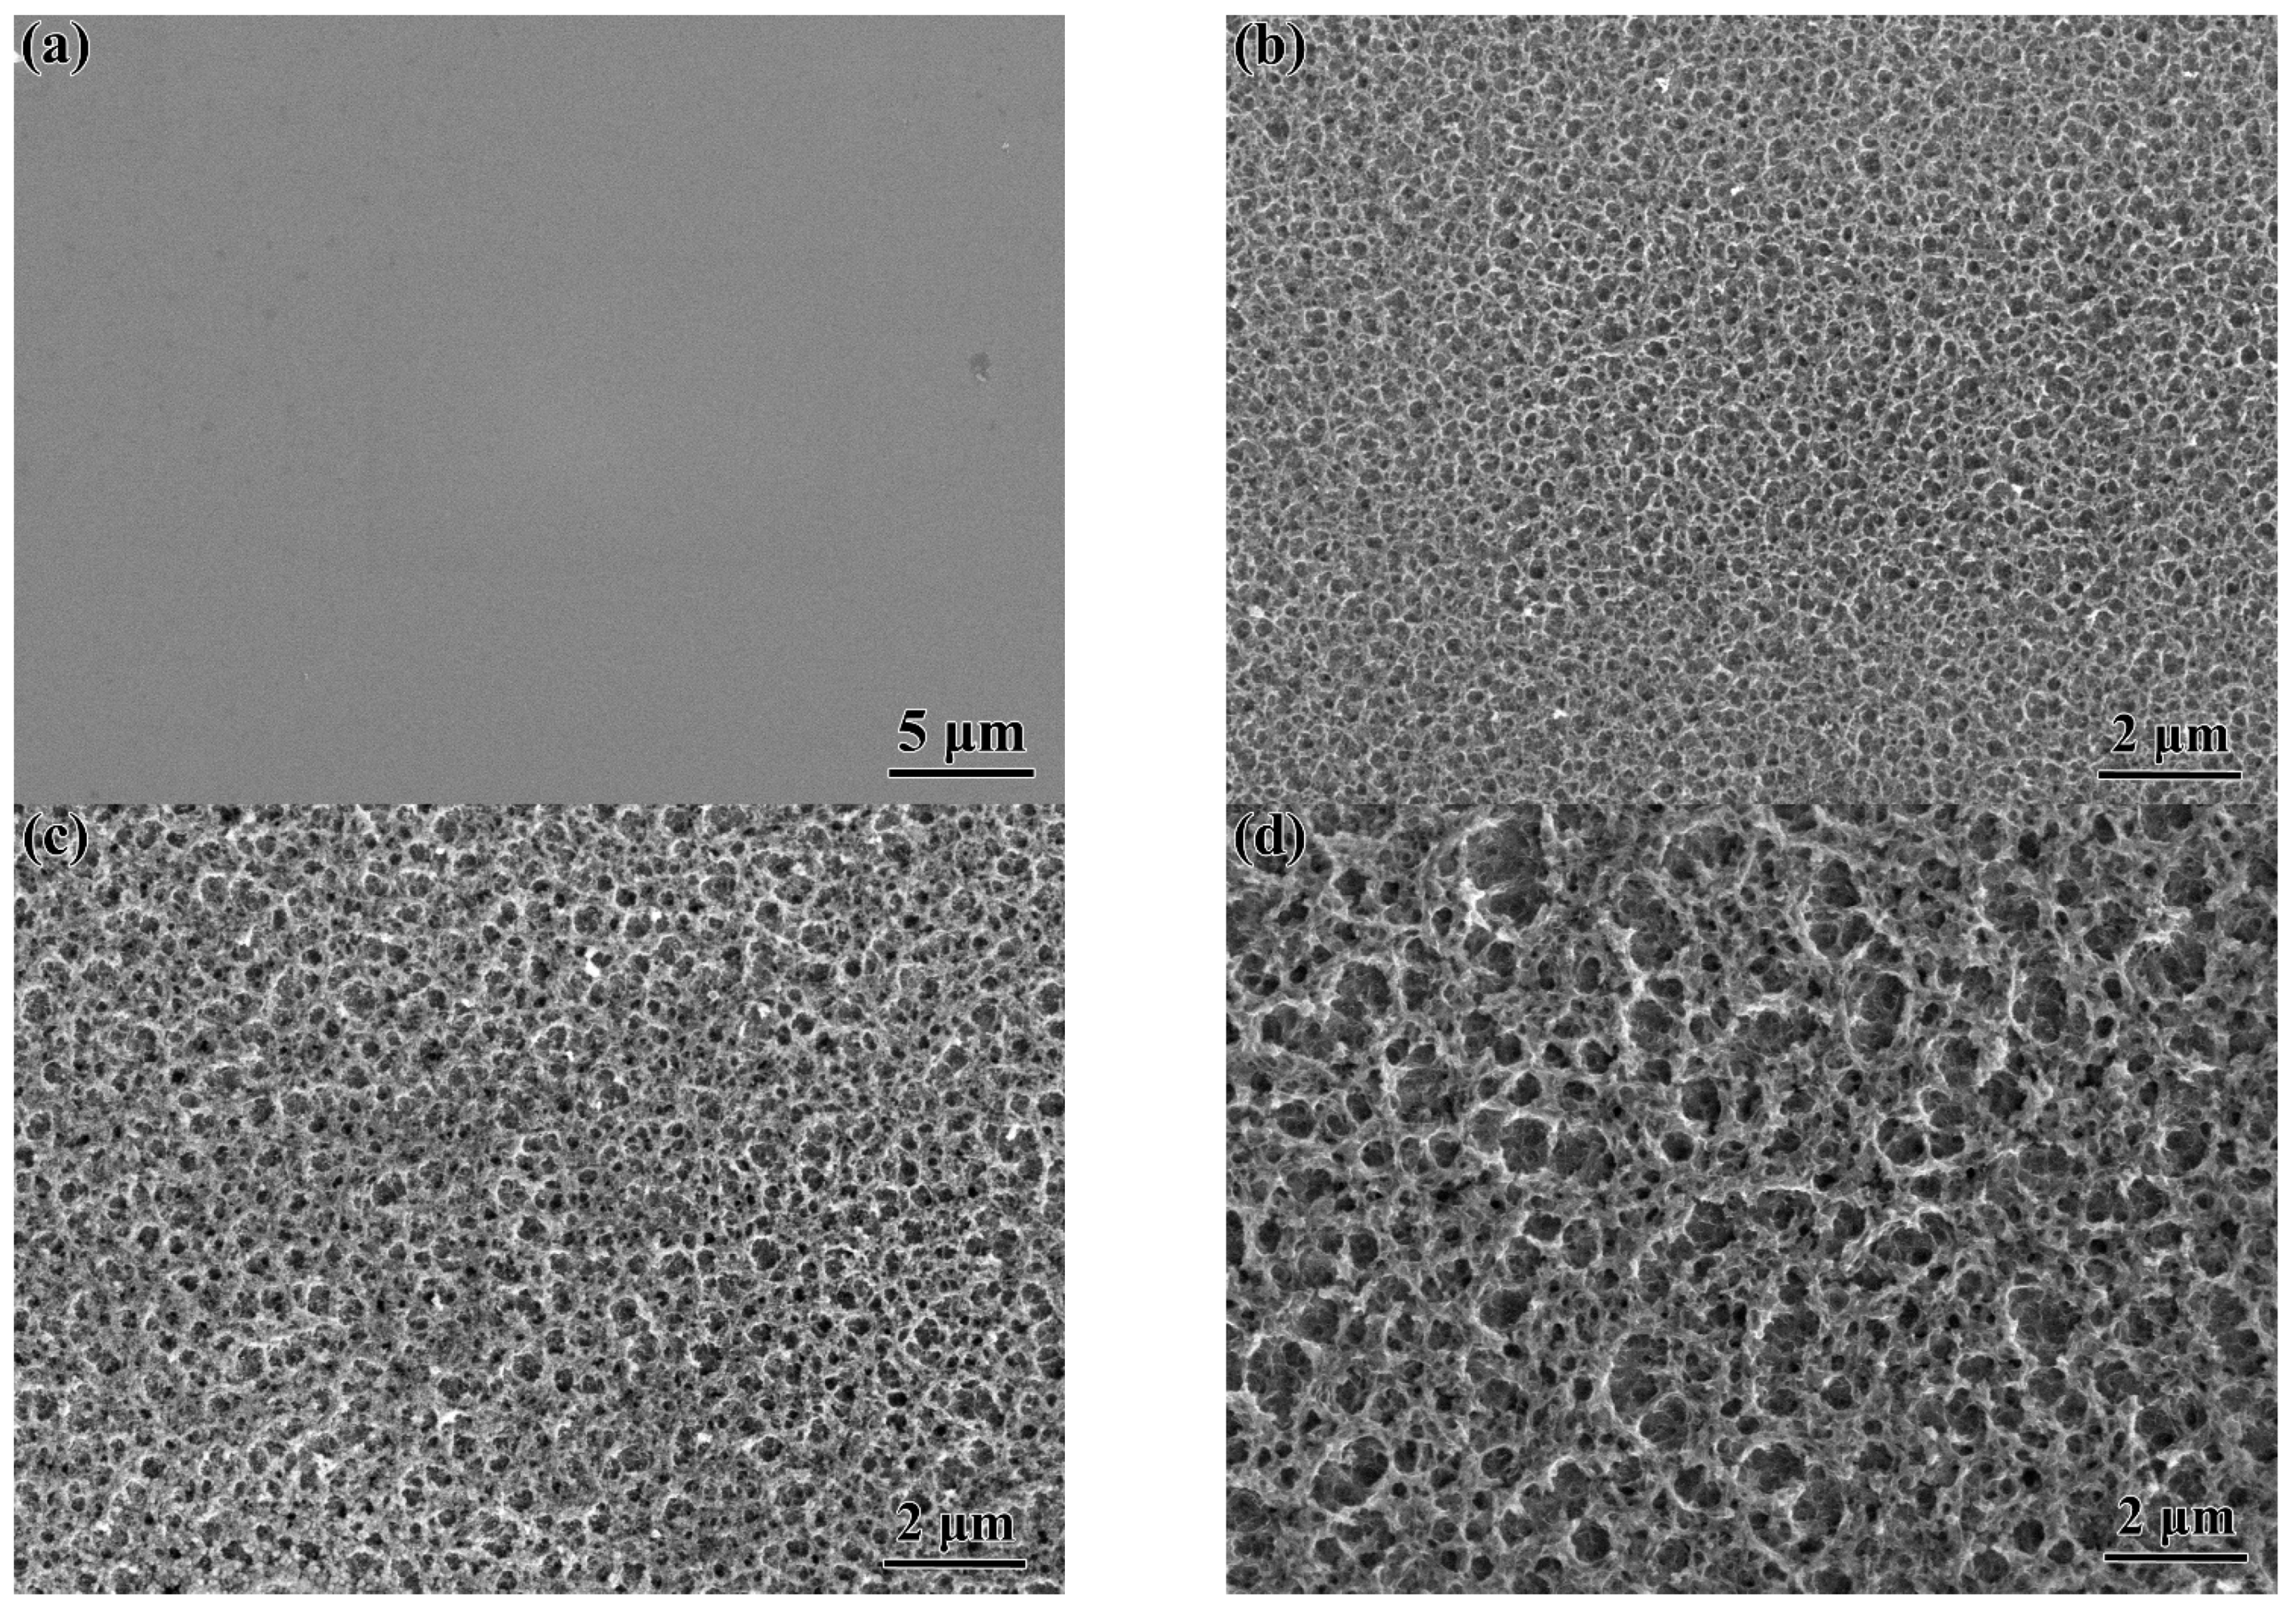
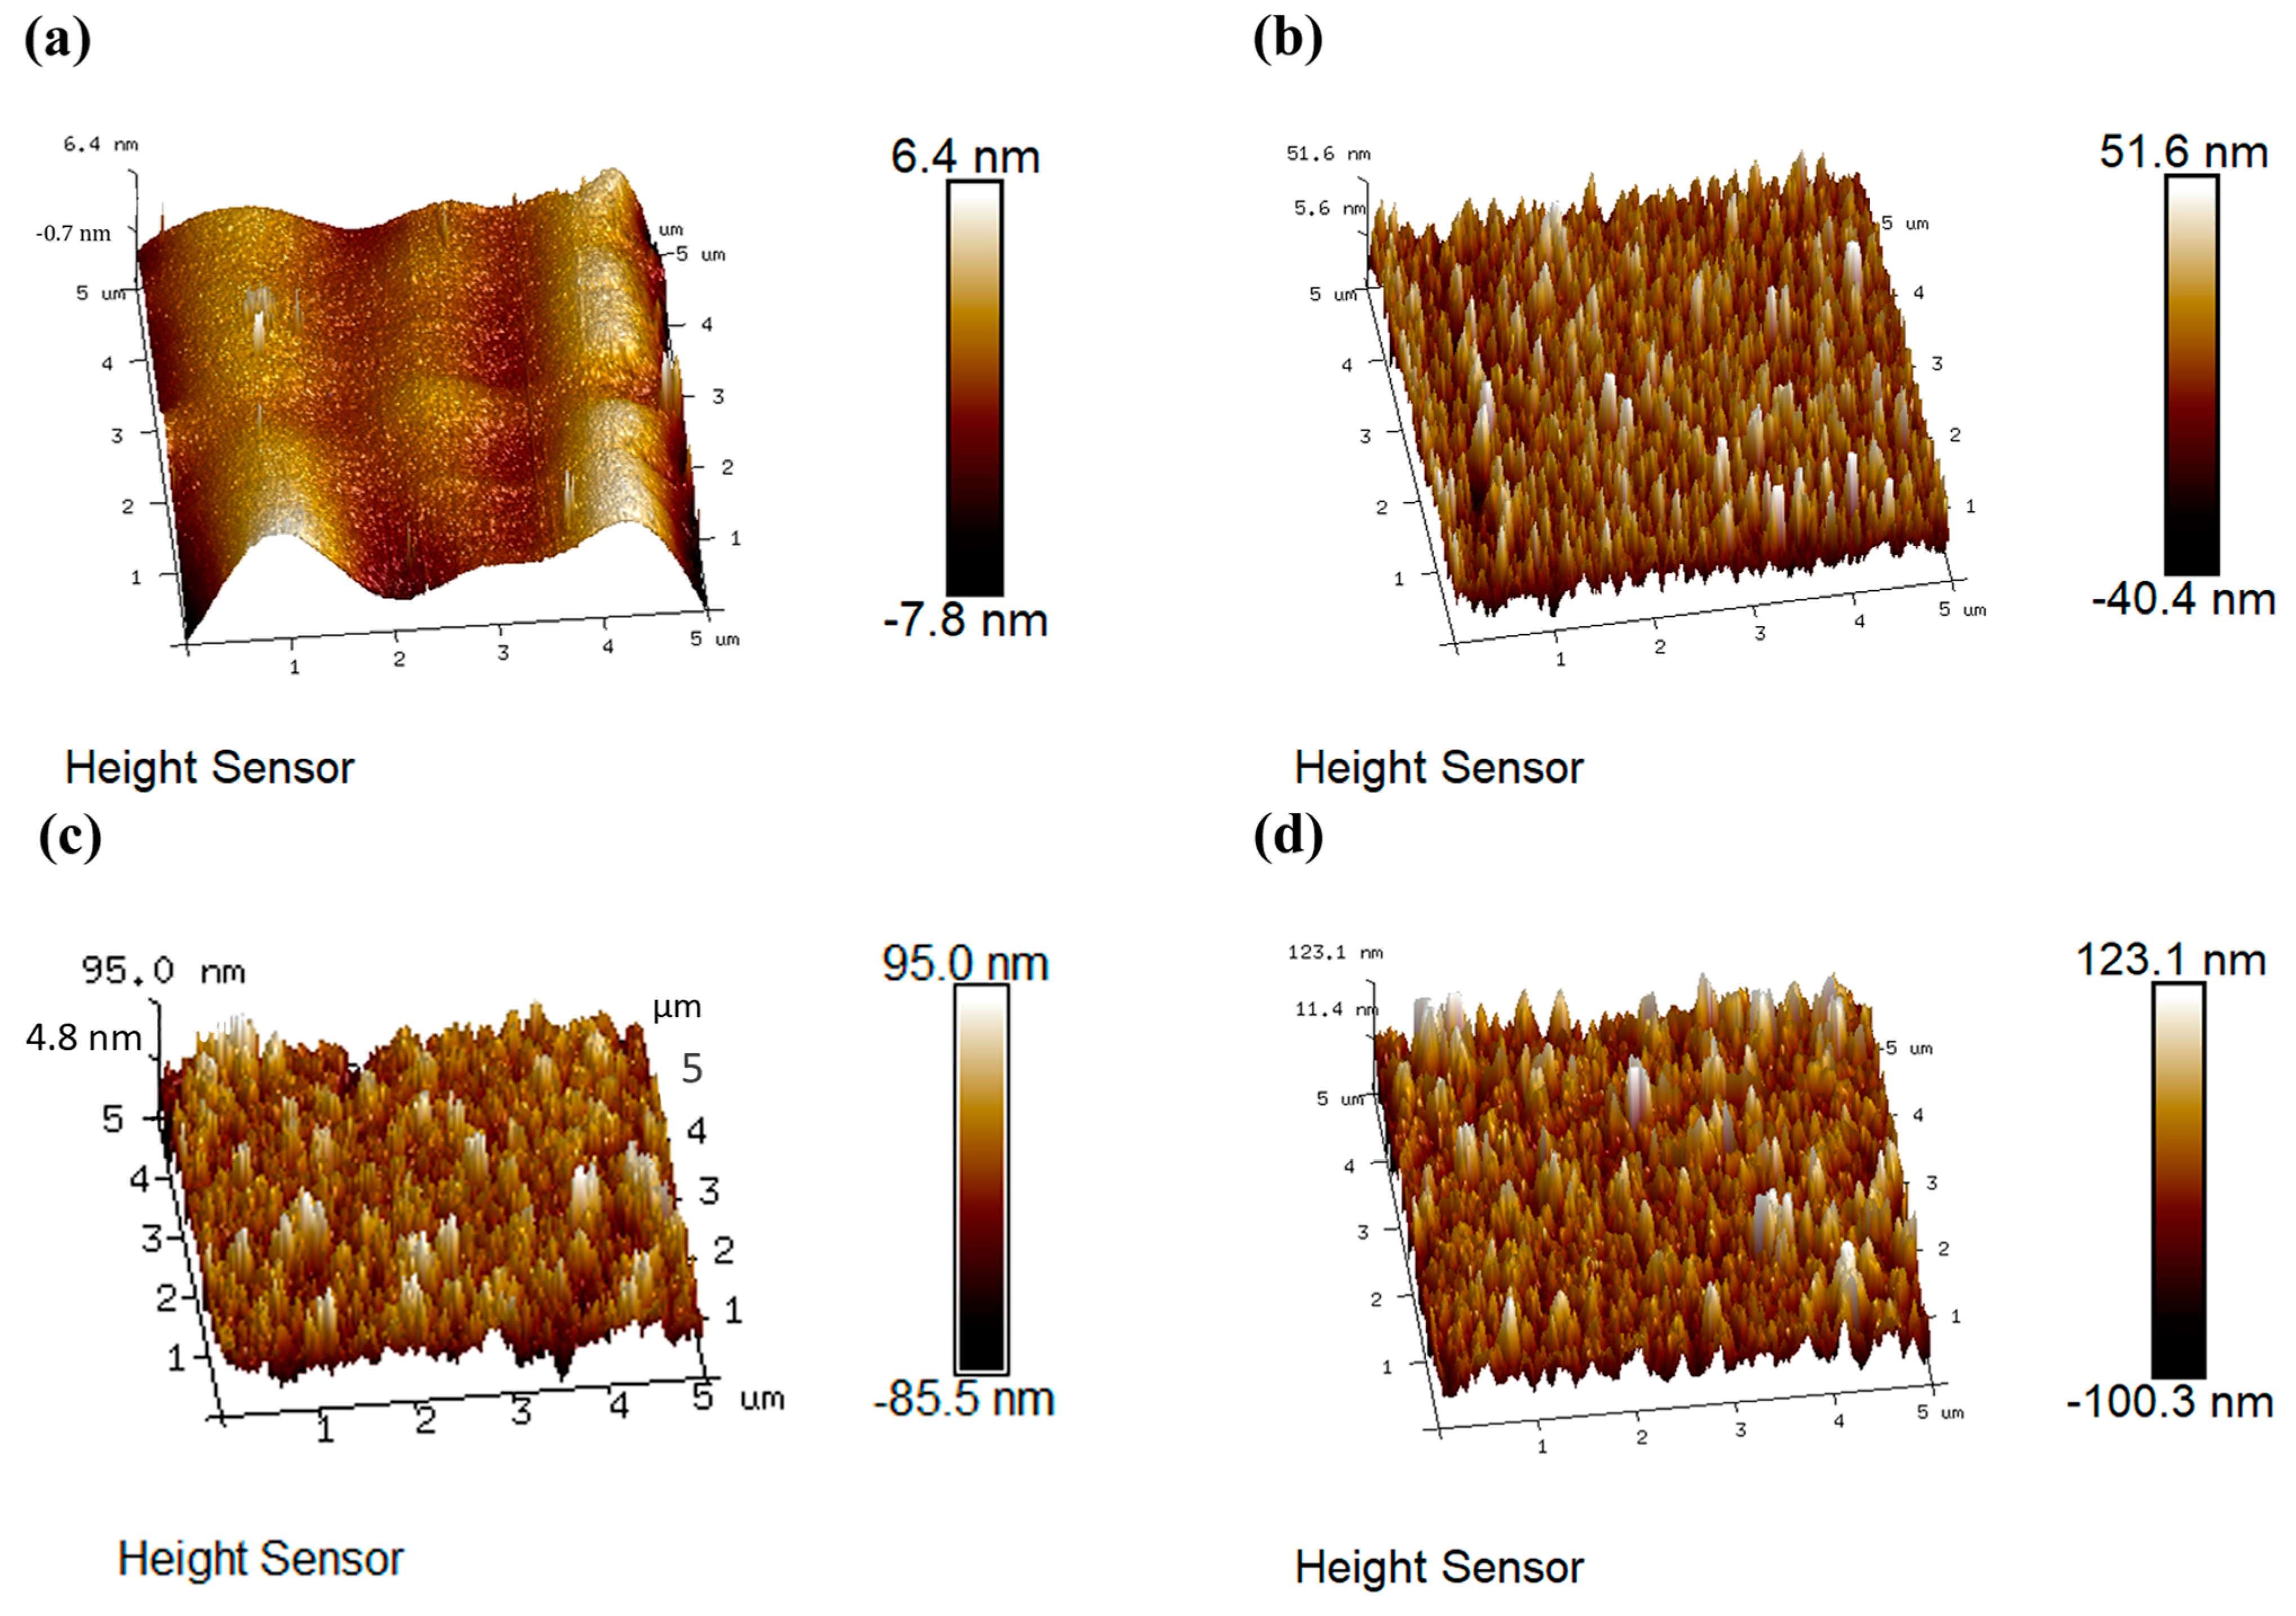
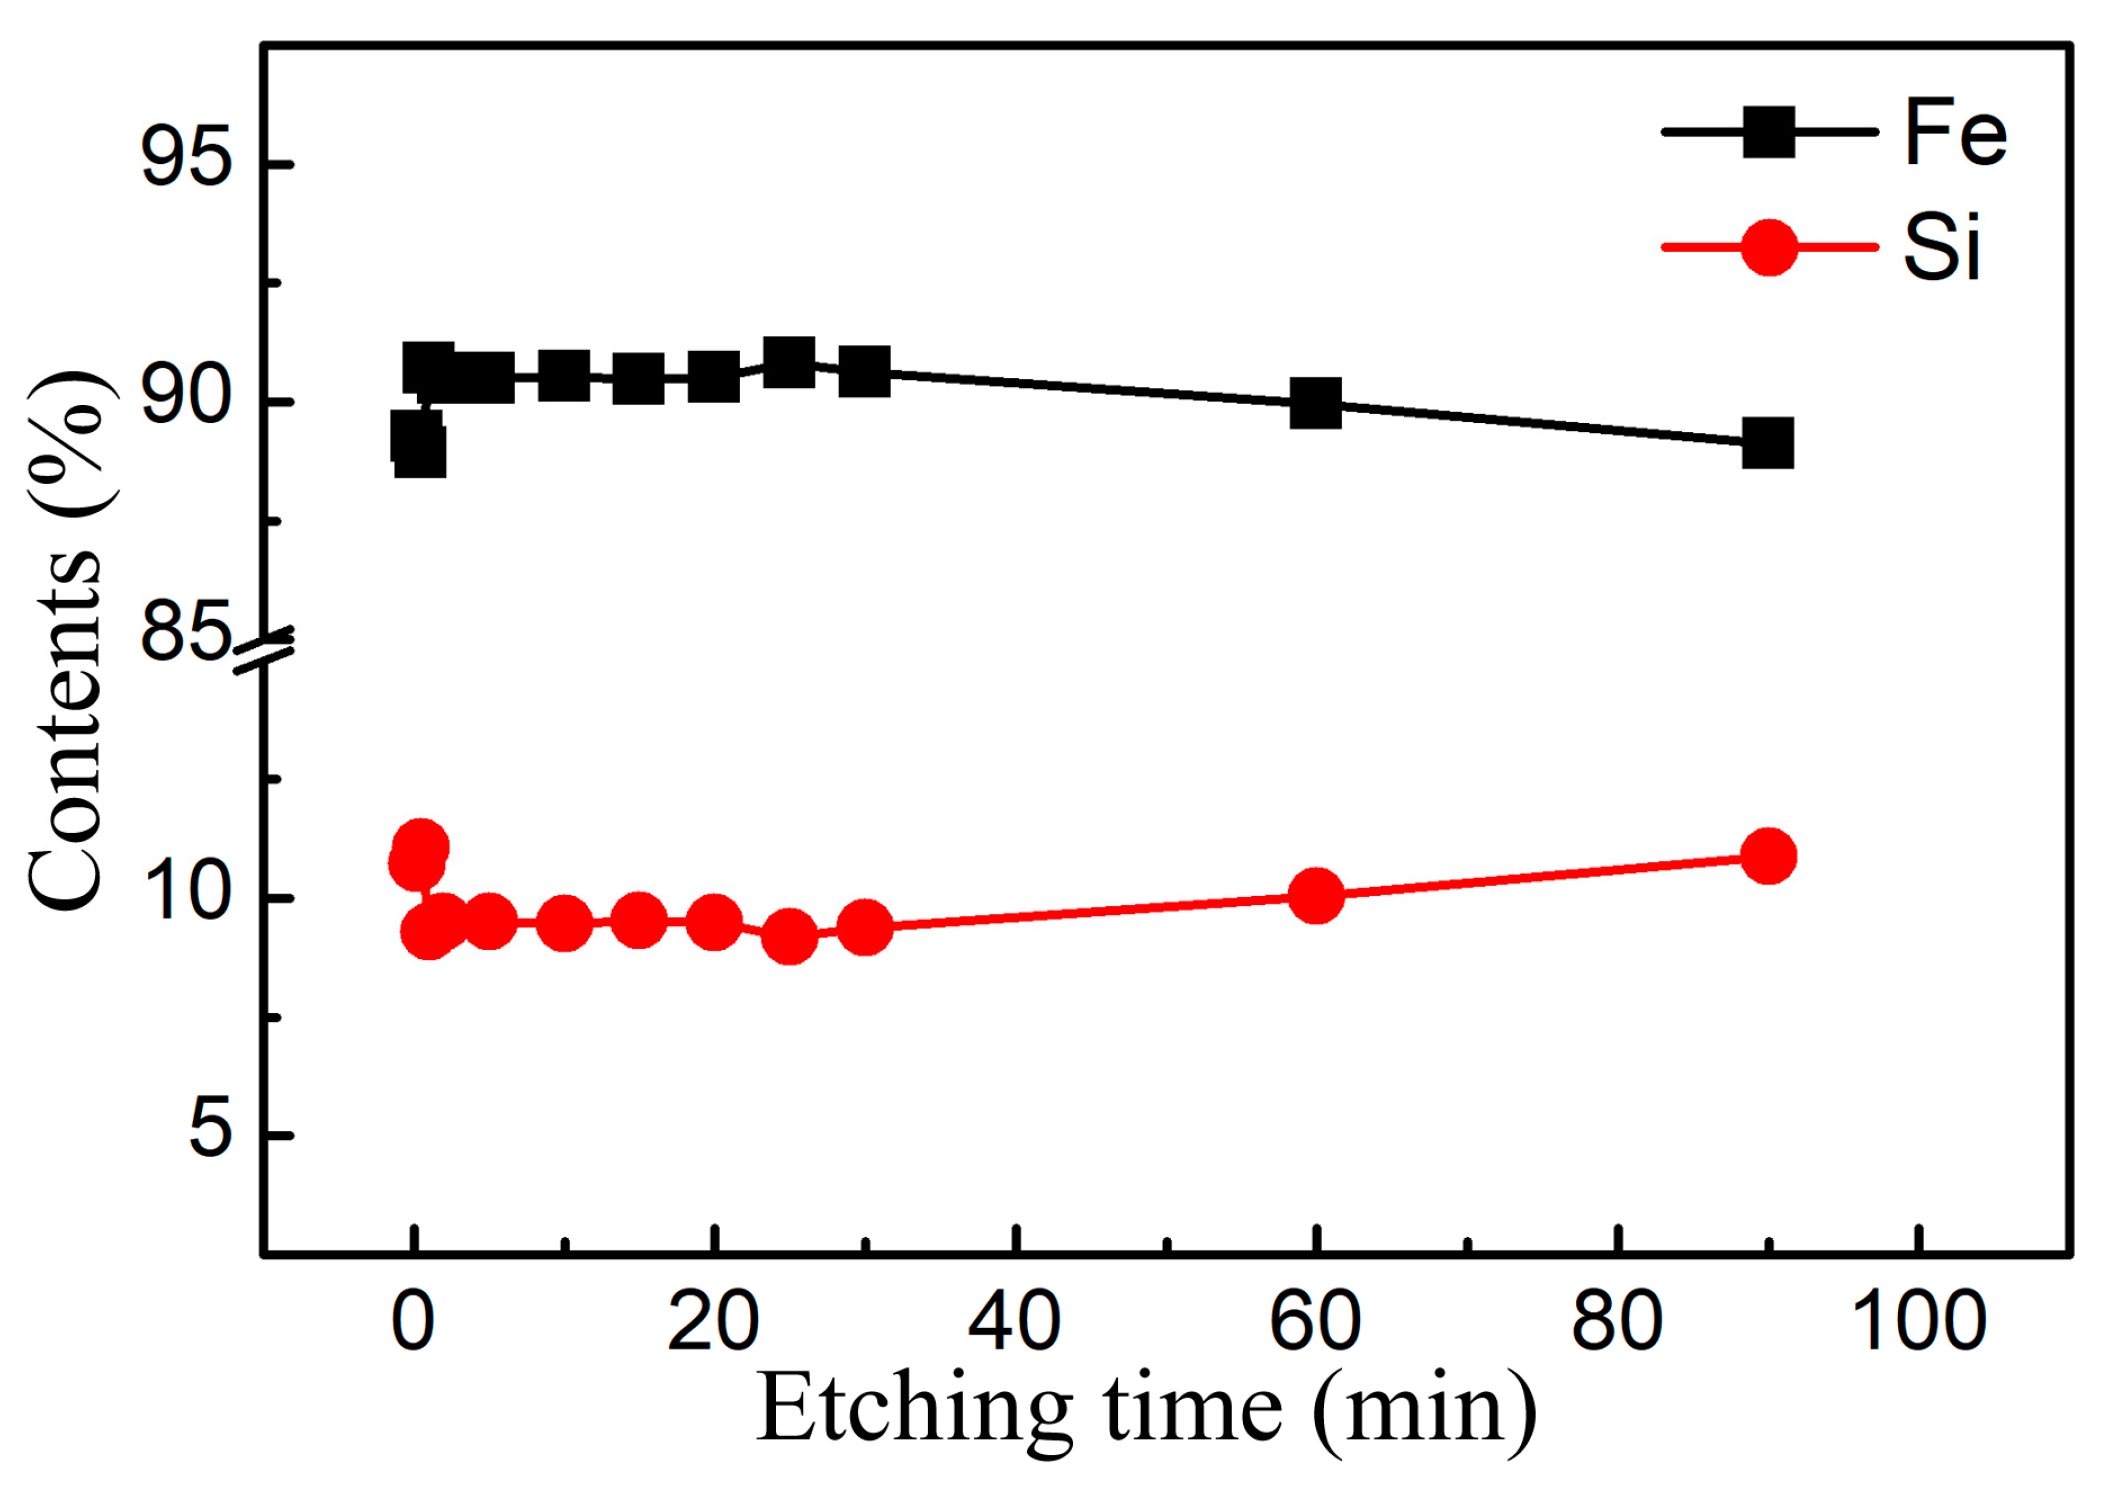
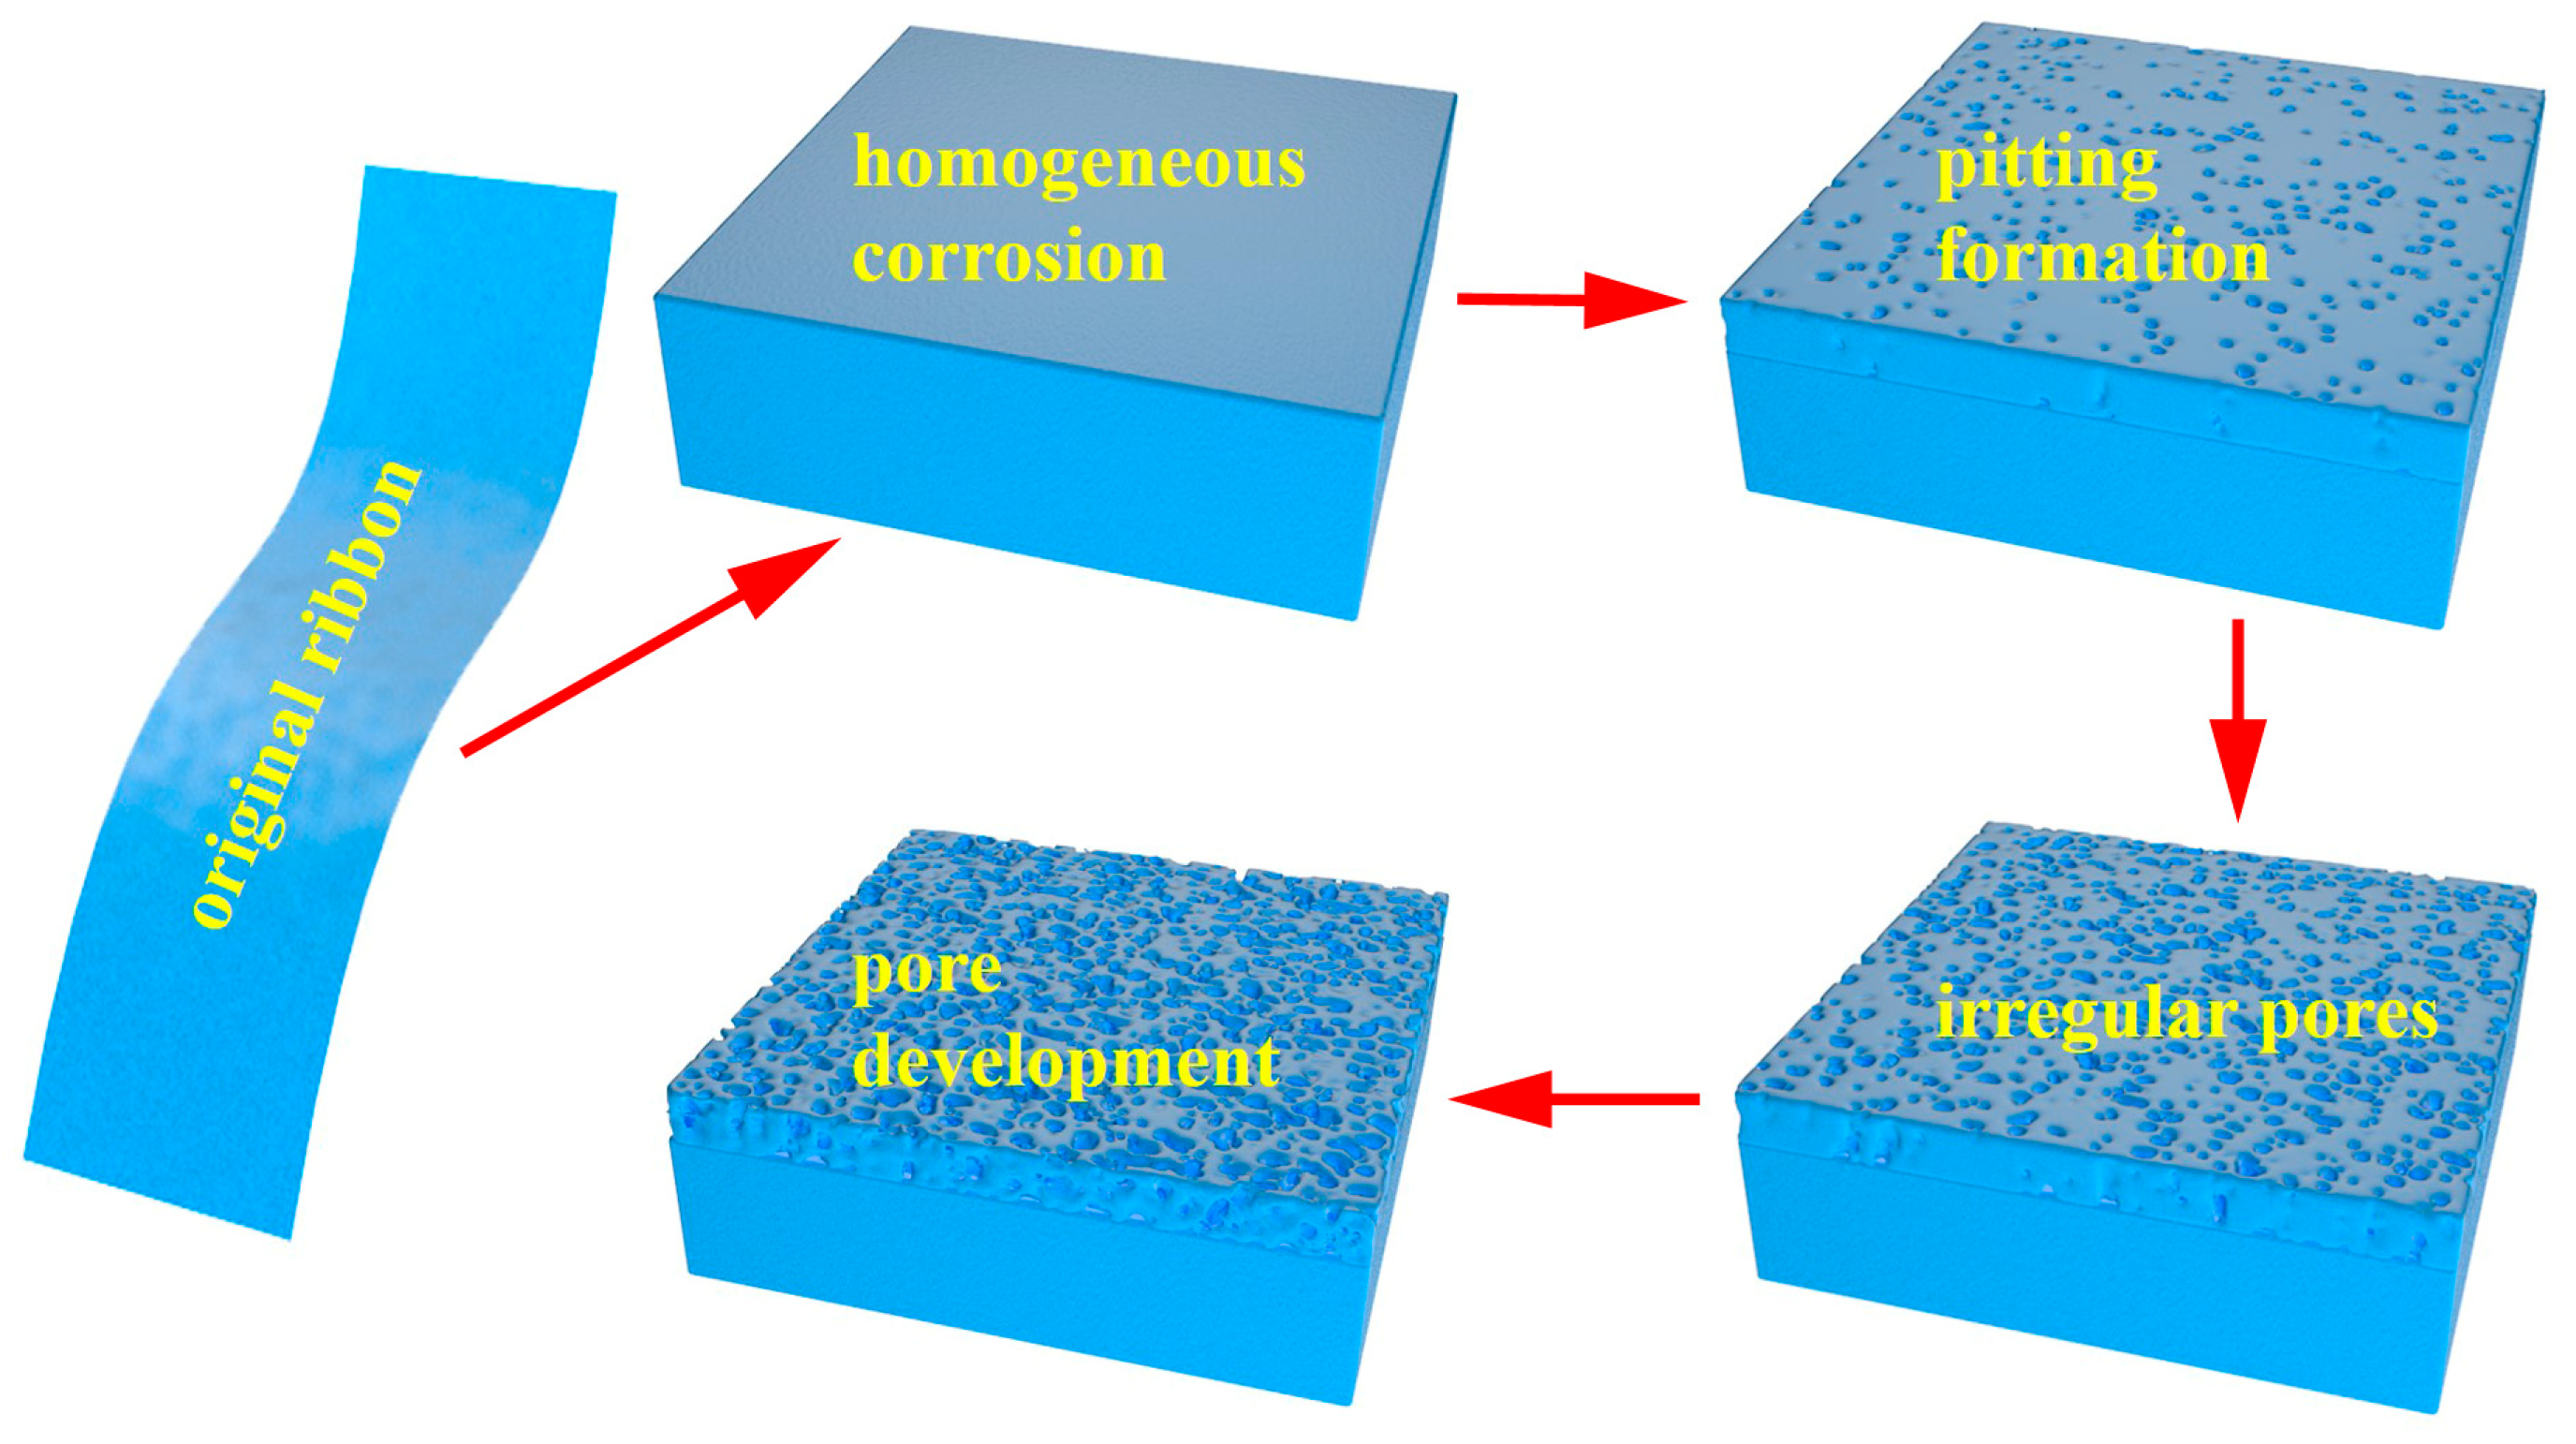
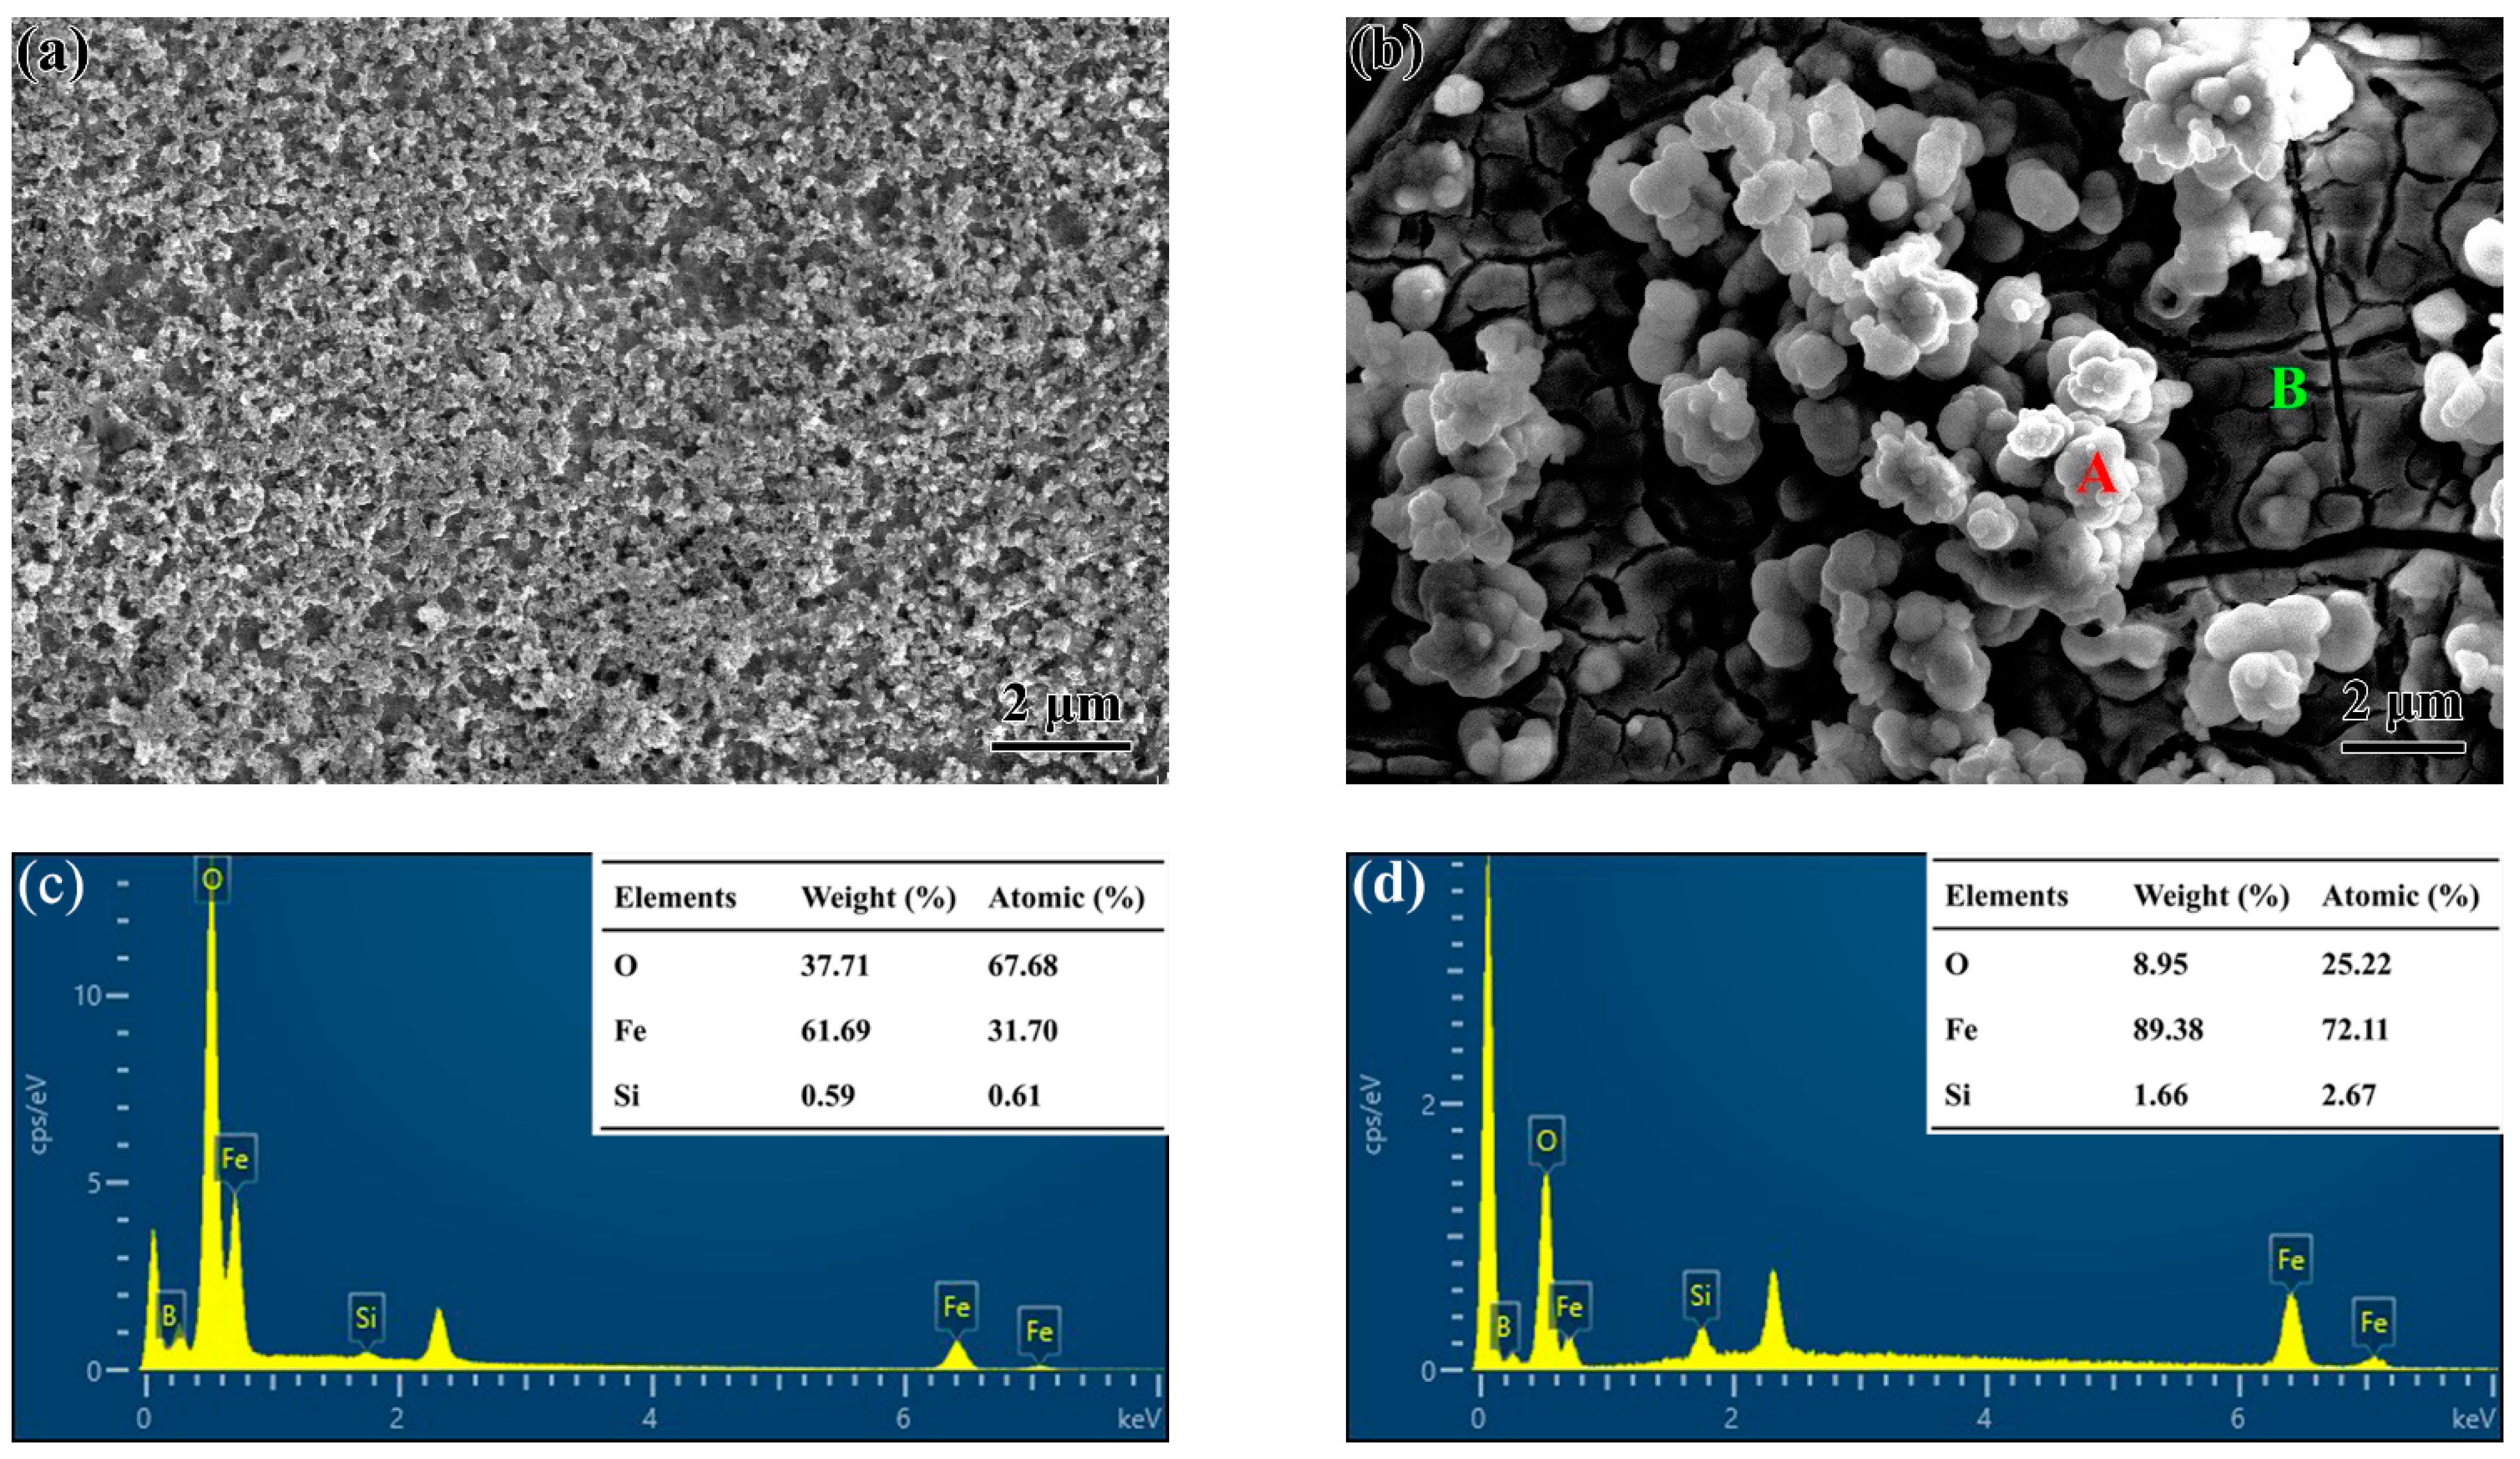
3.1. Structural Characterization and Forming Mechanism of the Surface Porous Structures

Figure 1 shows the surface morphologies (Secondary Electron Mode, voltage: 10 kV, and current: 0.8 nA) of the untreated Fe-Si-B MG ribbon and the MG ribbons after the chemical etching in the 0.1 M HF solution for 30, 60, and 90 min (named as NPFe-30, NPFe-60, and NPFe-90, respectively). It is seen that the untreated Fe-Si-B ribbon has a relatively smooth surface (Figure 1a). After the etching, the uniform nanoporous structure was formed for all three specimens (Figure 1b–d), and the pore size within a range from tens to hundreds of nanometers persistently increased with the prolonging of the etching time. The GI-XRD test can characterize the phase structure of the surface thin film, as shown in Figure 2a. It is found that the XRD curves only have a broad halo around 2θ = 42°, revealing the classic amorphous structure of the treated Fe-Si-B ribbons, even though the etching treatment lasts for a long time. This result is very different from the previous reports on the dealloying technique [21,22], which not only refers to the selective leaching of non-noble metals but also the surface/interface diffusion of resident noble-metal atoms, and thus the latter self-assembles that formed the porous structure with crystalline characteristics. As shown in Figure 2b, the EDX analysis reveals that the composition of NPFe-90 is about 89.13 at. % Fe and 10.87 at. % Si, and no signal of the B element is detected mainly due to the small atomic number of B that needs a relatively lower excitation voltage. In general, the B atom is positioned at the interstitial lattice site in Fe-based alloys due to the small atomic radius, which has little influence on the lattice structure. That is to say, the location of the break peak (42°) in the XRD pattern is mainly determined by Fe and Si. Given that the (110) peak of the XRD standard pattern of Fe (PDF#06-0696) is about 44°, and the (111) peak of Si (PDF#35-1158) is about 39°, one can deduce that the EDX analysis is closely related with the XRD result.
Figure 3 shows the surface AFM images of the untreated Fe-Si-B MG ribbons and the NPFe-30, NPFe-60, and NPFe-90 specimens. It was found that the surface roughness of the as-etched MG ribbons was obviously increased in comparison with that of the untreated ribbon. The depths after the etching treatments for 30, 60, and 90 min, i.e., the thicknesses of the porous films in NPFe-30, NPFe-60, and NPFe-90, are about 92.0, 180.5, and 223.4 nm, respectively. This demonstrates that the etched film thickness continually increases with the increase in the etching time. In addition, the BET measurements were also conducted, as shown in Figure 4a. It is found that there is an inflection point at about P/P0 = 0.4–0.5, indicating that the adsorption curves belong to the II type isotherm [27]. The specific surface areas of the NPFe-30, NPFe-60, and NPFe-90 samples are 5.23, 6.40, and 8.77 cm2 g−1, respectively, about 8.1, 10.0, and 13.7 times larger than that of the untreated Fe-Si-B MG ribbons (about 0.64 cm2 g−1). Figure 4b–d display the pore size distributions of the three samples, which were calculated through statistical methods from a minimum of three SEM images for each one. It is found that the specimens of NPFe-30, NPFe-60, and NPFe-90 have size ranges of about 60-150 nm, 80–200 nm, and 120–350 nm, respectively, and their pore size distribution obeys normal distribution on the whole.
To reveal the formation mechanism of the NPFe structures, the short-time evolution of the surface porous structure and chemical composition were investigated. Figure 5 shows the surface SEM images (Secondary Electron Mode, voltage: 10 kV, and current: 0.8 nA) of the Fe-Si-B ribbons after the chemical etching in the 0.1 M HF solution for 15 s, 30 s, 60 s, and 120 s. It can be seen that a uniform porous structure was successfully obtained in a very short time. For the corrosion of 15 s, besides the uniform and slightly etched tracks, many circular corrosion pits were found on the ribbon surface, marked in Figure 5a,b. With the corrosion time increasing to 30 s, an immature porous structure with sparse and irregular open pores was generated (Figure 5c,d). One can deduce that these pores might derive from the corrosion pits in Figure 5a,b. After increasing the corrosion time to 60 s, a uniform and mature porous structure started to form (Figure 5e). As the etching time prolonged up to 120 s or above, the porous structure persistently evolved via pore growth and integration (Figure 1b–d and Figure 5f), and the pore size after etching for 120 s was obviously bigger than that etched for 60 s, as well as the pore depth.
Figure 6 shows the evolution of the chemical composition of the nanopore structure containing the short-time and long-time etching treatments. Each value of the elemental composition is calculated based on a minimum of three EDX tests (one of the EDX patterns and chemical composition is shown in Figure 2a). Obviously, the short-time etching (less than 120 s) leads to a significant decrease in Si and an increase in the Fe proportion. It has been reported that in the Fe-B MG system, the corrosion generally derives from the local depletion of B because of the lower standard electrode potential of B than that of Fe [26]. Therefore, due to the fact that the standard electrode potentials of Fe2+/Fe, SiO32−/Si, SiF62−/Si, and H2BO3/B are −0.44 V, −1.697 V, −1.24 V, and −1.79 V, respectively, one can conclude that the formation of corrosion pits primarily originates from the local dissolution of Si and B. From the view of long-time etching (etching for more than 20 min), the Fe proportion continuously decreases with the etching time increasing to 90 min. This result reveals that the evolution of the porous structure (pores grow and become connected) is mainly attributed to the selective corrosion of Fe. Overall, the formation of the nanoporous structure primarily refers to the generation of corrosion pits due to the selective leaching of Si and B, and then involves pore growth and integration owing to the selective leaching of Fe.
Based on the above analyses (Figure 2a and Figure 3), it is found that the etched products still maintain an amorphous structure and just possess the surface porous structure (only 100–200 nm of thickness). According to the dealloying mechanism [21], the diffusion and rearrangement of residual atoms would lead to a crystallization behavior in the amorphous alloy precursor, thus naturally acquiring microcrystalline/nanocrystalline characteristics and obtaining a 3D bi-continuous porous structure. Therefore, it is possible that the widespread surface/interface diffusion of the residual atoms was not involved in the chemical etching of the Fe-Si-B MG ribbons, which seems very different from the general dealloying process. Thus, we can deduce that the formation of the nanoporous structure in the present work primarily follows the pitting corrosion mechanism [25,26]. As shown in Figure 7, firstly, the uniform pitting corrosion occurred throughout the Fe-Si-B ribbon surface and a great many circular pits were formed mainly due to the selective corrosion of B and Si. And then, starting from these corrosion pits, the surface irregular pores were generated and further enlarged via the growth and integration of the corrosion pits, mainly attributing to the selective leaching of the Fe atom.

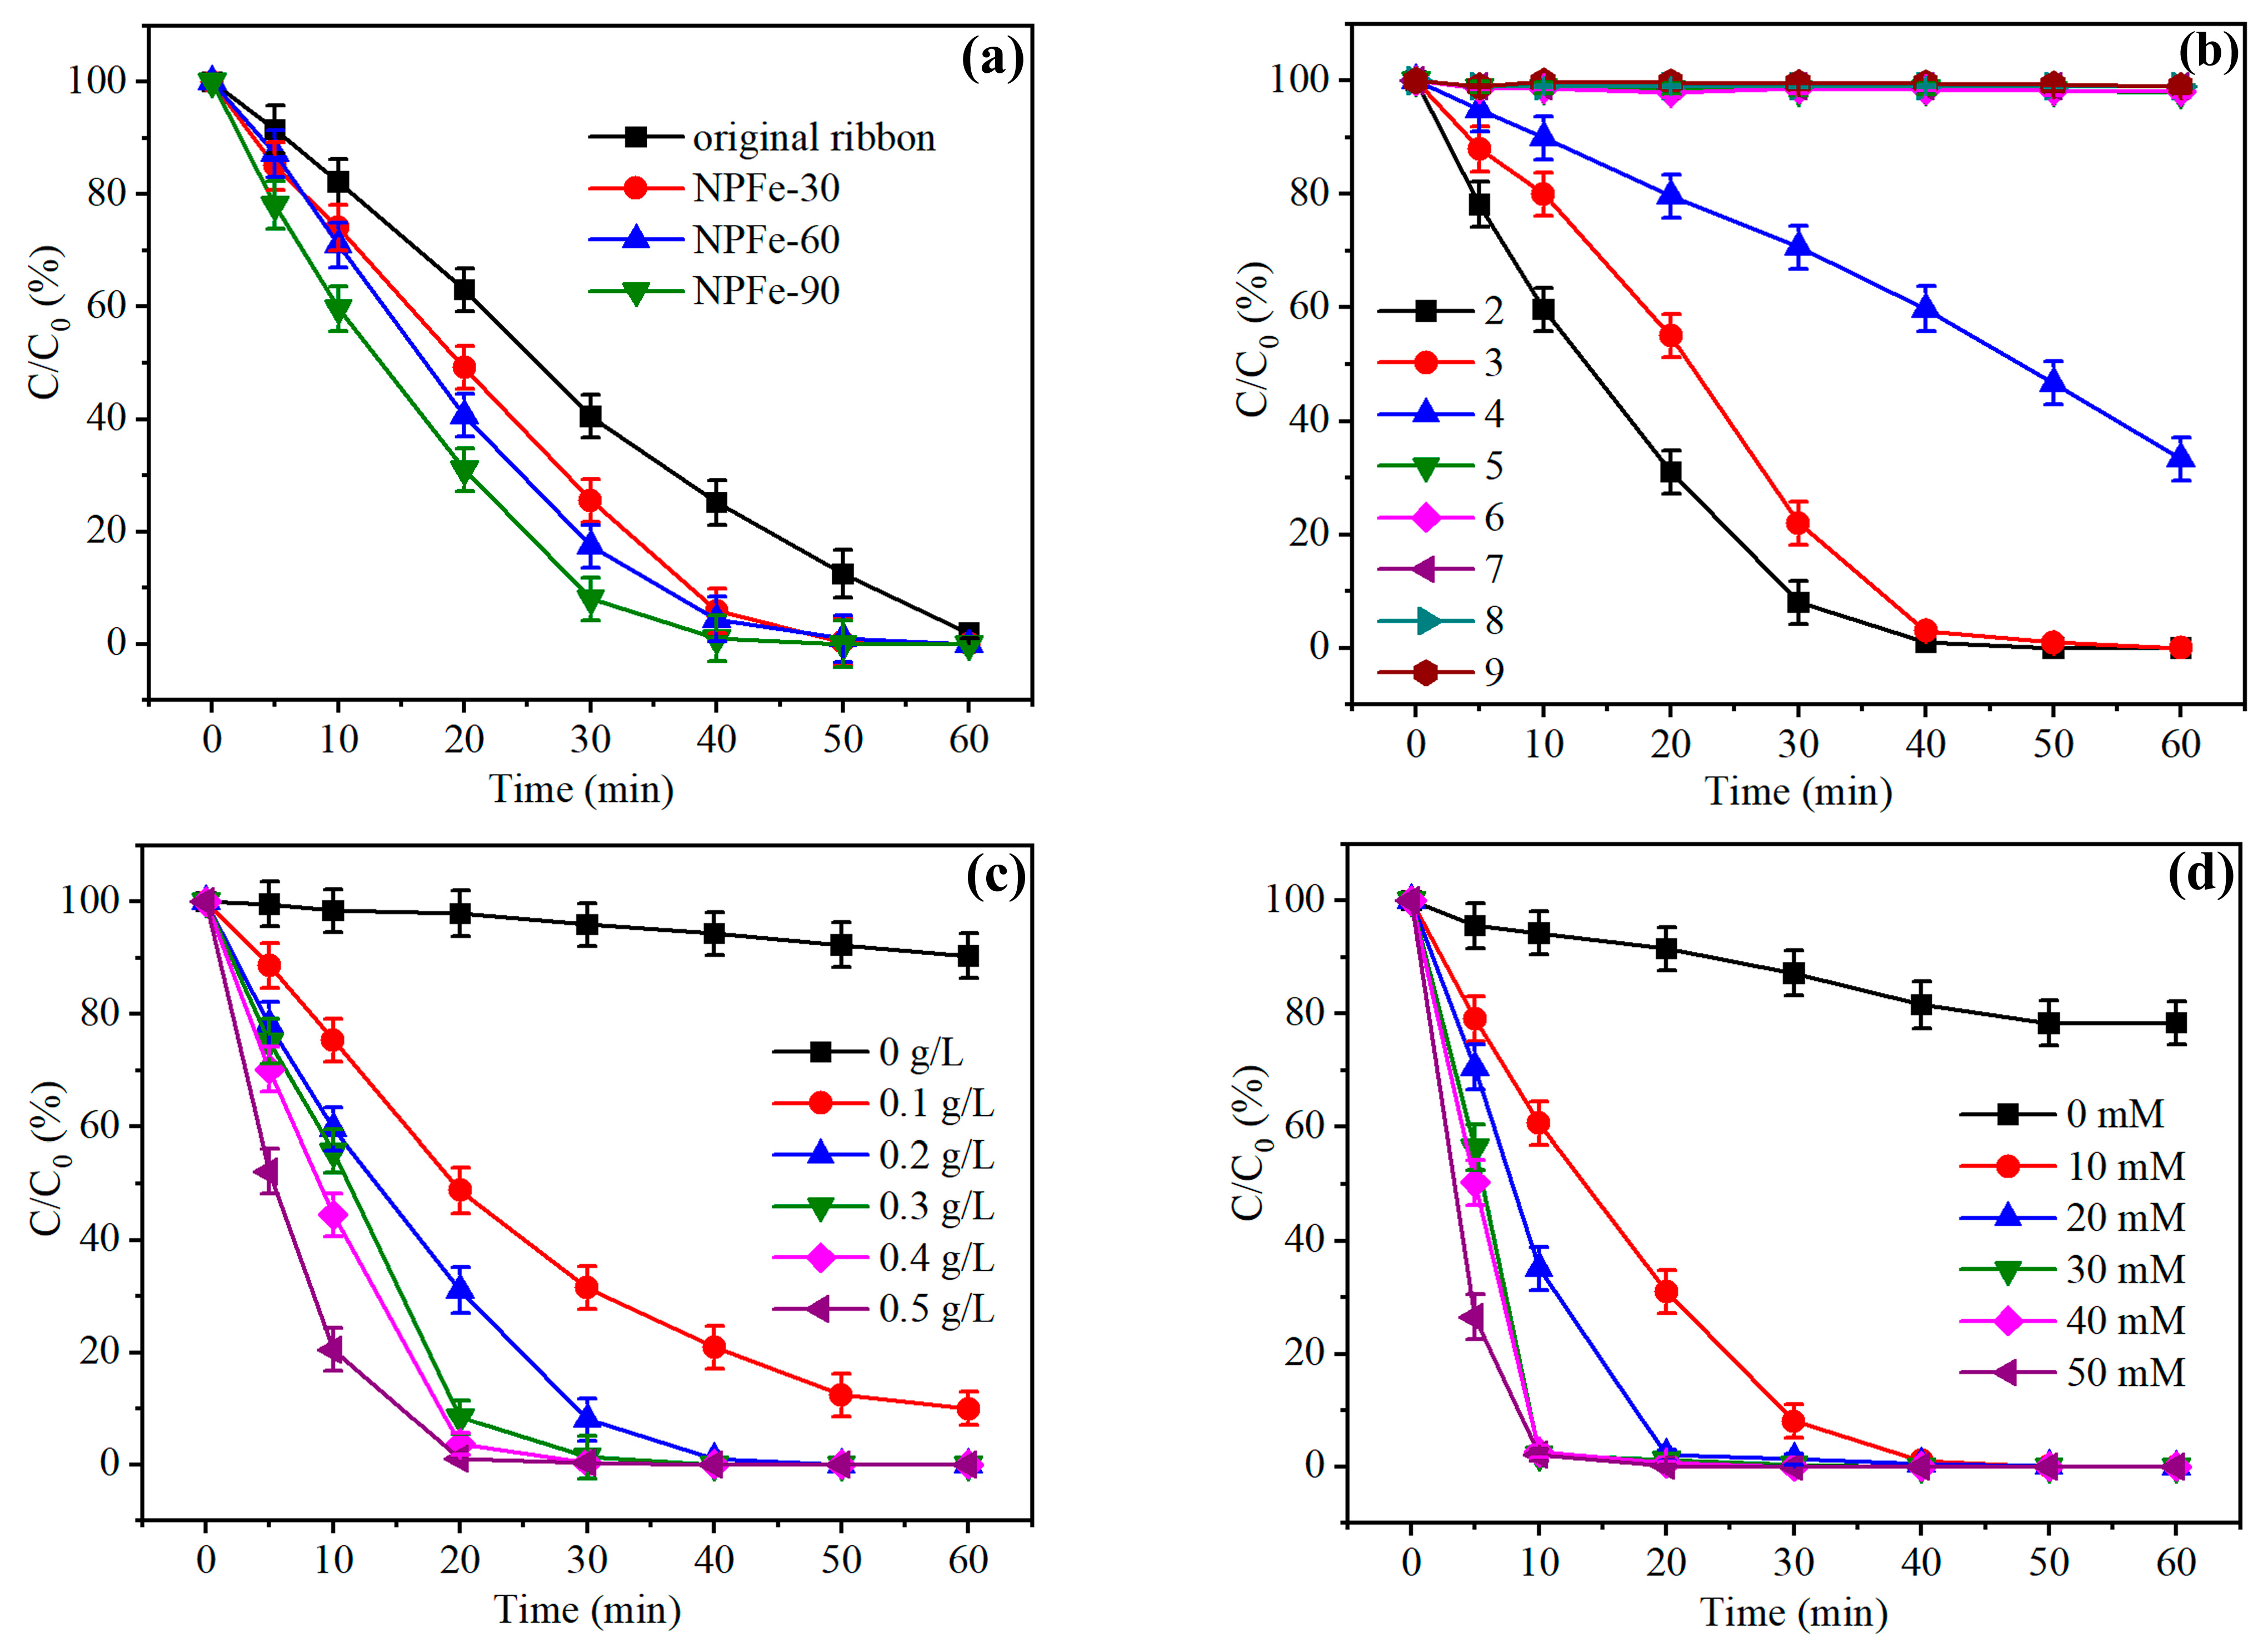
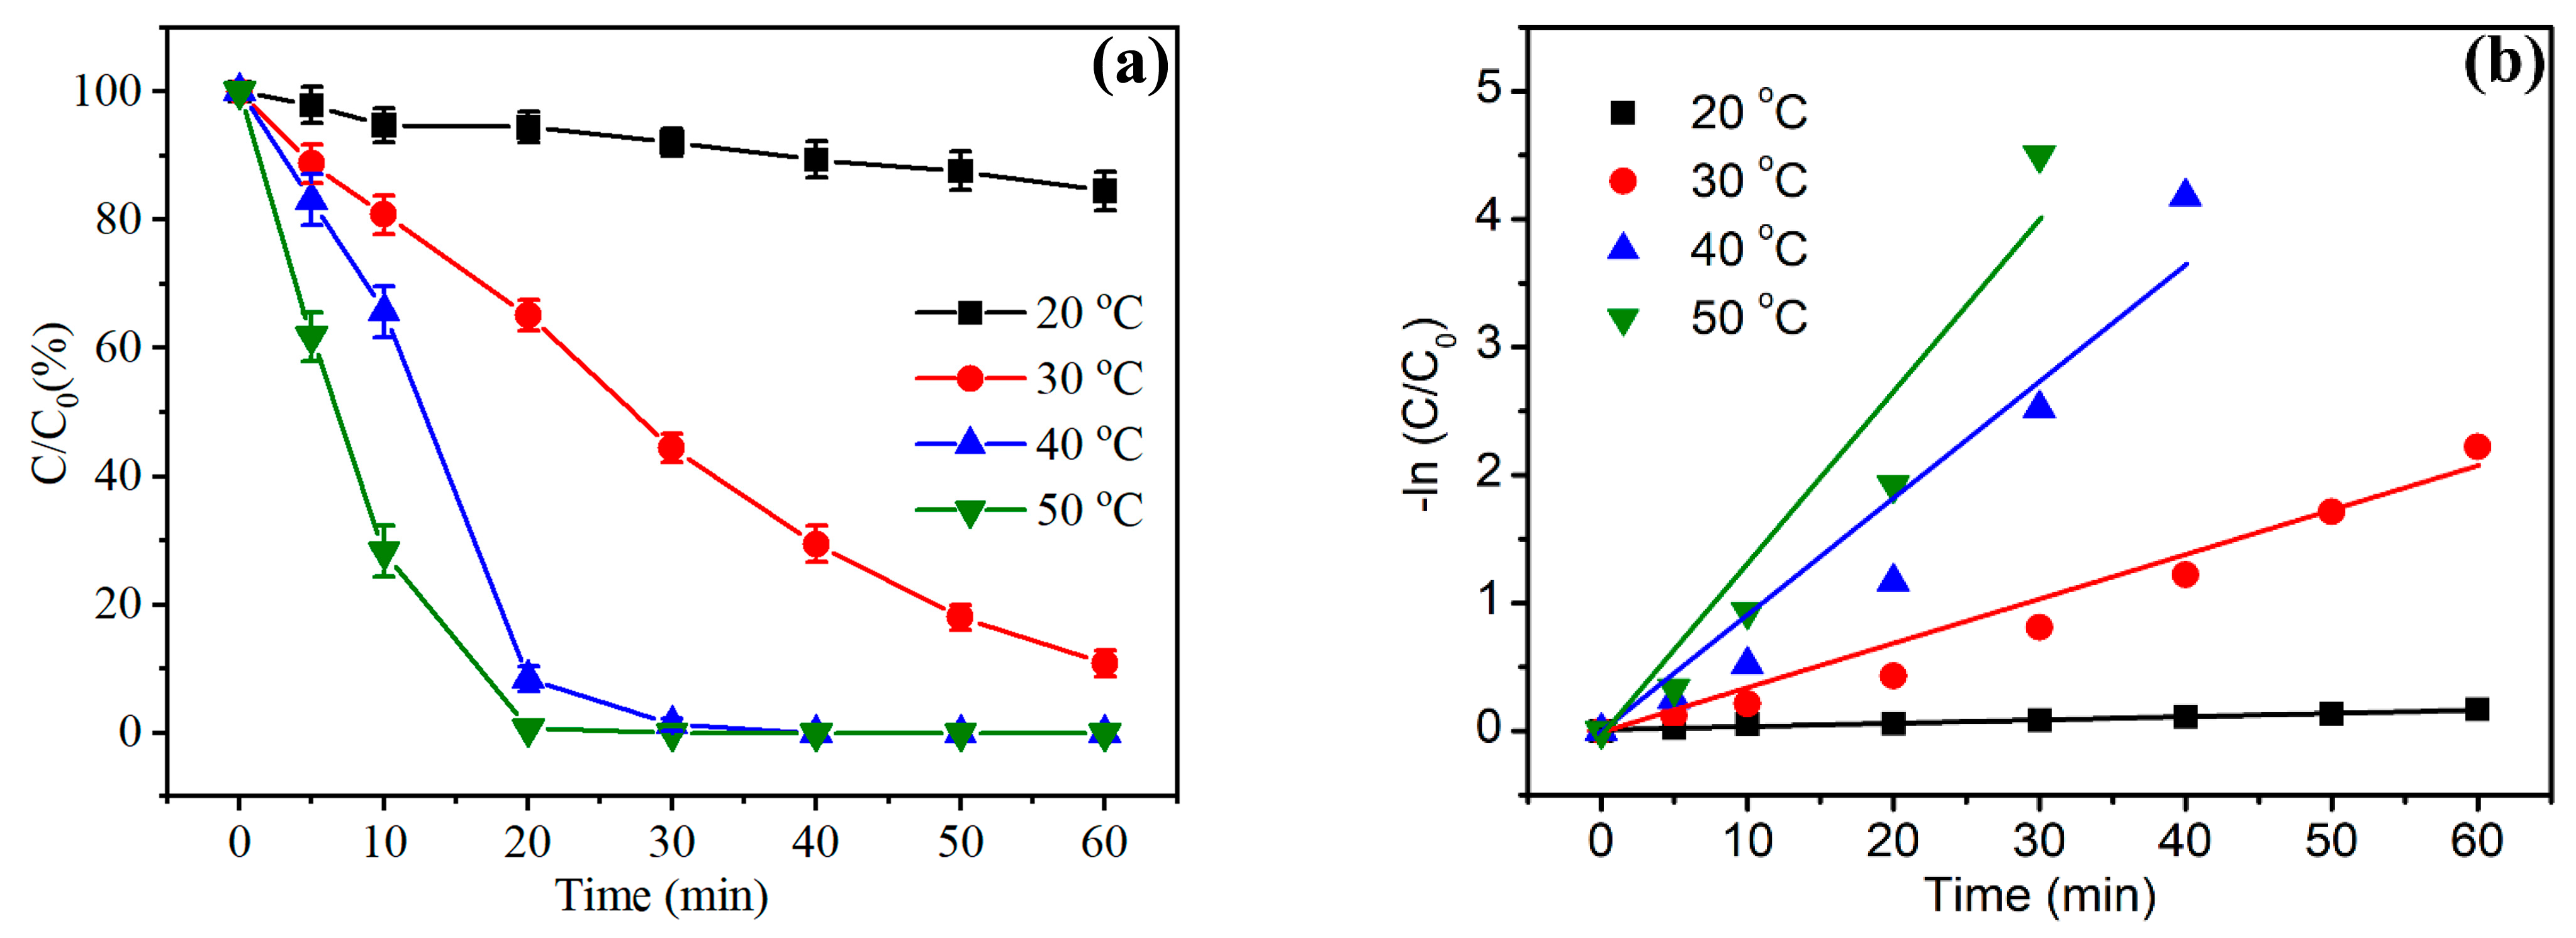
3.2. Dye Degradation Properties of NPFe Catalyst

In total, 150 mL of the MO solution (containing 100 mg/L of MO) was taken as the simulated wastewater for the degradation measurements of the NPFe ribbons. Figure 8a presents the degradation efficiency (with an error bar) of NPFe-30, NPFe-60, and NPFe-90 in the presence of H2O2, as well as the original Fe-Si-B ribbon for comparison. The following degradation parameters were adopted: pH = 2, NPFe catalyst = 0.2 g/L, H2O2 concentration = 10 mM, and temperature = 40 °C. It is seen that the four ribbon samples all possess excellent degradation ability toward the MO dye, primarily attributed to the high chemical activity of Fe-based MGs [15,16,17,20]. It is worth noting that compared to the original Fe-Si-B ribbon, the three etched samples exhibit much better degradation properties. Specially, the degradation efficiency of NPFe-90 reaches nearly 100% after degradation for just 40 min, probably due to its largest specific surface area (see Figure 4a).
In the presence of the H2O2, the degradation of organic pollutants through Fe-based catalyst involves the decomposition of H2O2 to produce the active radical of HO• via Fenton or Fenton-like reactions, and then the HO• radical can resolve organic molecules into H2O, CO2, and inorganic minerals [5,6,7,8]. It is important that some factors play a key role in the degradation of organic pollutants. Thus, the influence of pH, catalyst dosage, H2O2 concentration, and reaction temperature on the MO degradation of NPFe-90 was investigated, and Figure 8b shows the pH dependence of the degradation efficiency. It is seen that NPFe-90 exhibits excellent degradability under acidic conditions but very little performance when the pH value is more than 5, which is consistent with the published literature [4,27,28]. Notably, the degradation efficiency at pH 3 can reach about 98% after 40 min, and that at pH 2 reaches nearly 100%.
Figure 8c displays the effect of NPFe-90 dosage on the MO degradation. The result shows a very low degradation efficiency without the NPFe catalyst, only 10% after degradation for 60 min. However, just adding 0.1 g/L NPFe-90 can lead to an obvious increase in the degradation rate of up to 90% after 60 min, manifesting the superior catalytic activity of NPFe-90. As the NPFe-90 dosage increases to 0.2 g/L, the degradation rate reaches about 100% after 40 min, and that continually and slowly improves with the increase in catalyst dosage to 0.5 g/L. These results are mainly attributed to the increase in the catalyst dosage which can significantly increase the number of catalytic active sites, thus benefitting the degradation of the MO.
Figure 8d shows the effect of the H2O2 concentration on the degradation of MO using NPFe-90 as the catalyst. The H2O2 concentration is directly connected with the number of HO• radicals. It is seen that the degradation efficiency without H2O2 is about 20% after 60 min, possibly due to the reducing degradation reaction of the NPFe-90 catalyst [15,19,20]. The degradation rate of 10 mM H2O2 is about 100% after 40 min, and as the H2O2 concentration increases to 20 mM and 30 mM, the degradation rate reaching 100% just needs about 30 min and 10 min, respectively, whereas there is no significant increase in the degradation efficiency when the H2O2 concentration further increases to above 30 mM. This is because the excess amount of H2O2 can promote a side reaction to produce the hydroperoxyl radicals of HO2•, which exhibit low oxidation capacity toward organic contaminants [29].
Figure 9a shows the effect of temperature on the degradation efficiency (with an error bar) of the NPFe-90 sample. The degradation rate is obviously improved as the temperature increases to 30 °C and above. The efficiencies after 30 min are about 95% and nearly 100% at 40 °C and 50 °C, respectively. The enhanced degradability is mainly due to the fact that the degradation reaction belongs to a thermally activated process. Figure 9b presents the fitting lines of ln(Ct/C0)/time, revealing that the MO degradation process follows a pseudo-first-order reaction kinetic model. According to Equation (2), the reaction rate constants at different temperatures (kT) can be evaluated from the fitting line slopes. Thus, the kT values at 40 °C and 50 °C are about 0.122 min−1 and 0.146 min−1, respectively, which are obviously higher than those of the other reported Fe-based catalysts, such as Fe0 powders (0.1025 min−1) [30], Fe83Si2B11P3C1 MG ribbons (0.09 min−1) [31], and Fe78Si9B13 MG powders (0.031 min−1) [19].
l n ( C t C 0 ) = k T t
The cycling performance of NPFe-90 for the MO degradation was also studied under the conditions of pH 2, NPFe loading of 0.2 g/L, H2O2 concentration of 10 mM, and temperature of 40 °C. The as-used NPFe-90 ribbons were collected and washed with deionized water and ethyl alcohol, and then applied to the next degradation test. The durability test was repeated several times and the median one was used (the errors may be due to the temperature variation and equipment error). Figure 10 shows the results of the durability test for five cycles. It can be seen that there is no obvious loss of degradability after two cycles, which just has a slight decrease in the third round. Besides, after five cycles, the degradation efficiency can still be maintained at about 95% after 60 min. These results demonstrate the very good cycling stability of the as-prepared NPFe-90 with the surface porous structure.

3.3. Dye Degradation Mechanism of NPFe Catalyst

Foremost, compared to their crystalline counterparts, metallic glassy materials exhibit much better catalytic activity towards various catalytic/electrocatalytic reactions, primarily due to the fact that the amorphous structure can reduce the reaction activation energy [11,13,20]. Actually, in the present work, the activation energy of the degradation reaction of NPFe-90 could be estimated via Equation (3), where kT is the reaction rate constant, ΔE is the reaction activation energy, R is the ideal gas constant, T is the temperature, and A is the pre-exponential factor. From the results in Figure 8, the fitting line of –lnkT versus 1/T can be obtained (Figure 11a), and the ΔE value is directly associated with the fitting line slope. It is calculated that this value is about 23.44 kJ/mol, much less than that of the Fe-Si-B amorphous ribbon (27.4 kJ/mol) [16] and Fe-Si-B-Nb MG powders (78–114 kJ/mol) [20], manifesting the excellent catalytic degradation activity of NPFe-90.
l n k T = Δ E R T + l n A
In addition to the intrinsic catalytic activity of the Fe-Si-B MG, the nanoporous structure on the ribbon surface also plays an important role in the degradation of the MO dye. This is because the degradation reaction might utilize the active sites on the catalyst surface for resolving H2O2 to generate HO• radicals, which further decomposes the MO molecules. The porous structures possess large specific surface areas (see Figure 4a), which can provide more surface-active sites, thus benefitting the MO degradation process. The important significance of oxidant active species can be verified by drawing methyl alcohol (MA, 0.1 M) as the scavenger of HO• into the degradation tests [24]. As shown in Figure 11b, it can be found that there is a significant reduction in the degradation rate from nearly 100% to about 65%, indicating that MA exhibits an evident inhibition influence on degradability. This result reveals that HO• is the dominating active species in the MO degradation of NPFe-90.
According to the previous study on solid Fe catalysts (such as zero-valent iron) [9], the accepted mechanism of NPFe can be represented by Equations (4)–(7). It is found that compared to the classical Fenton reaction (Equations (5) and (6)), there is an extra way to produce Fe2+ (Equation (4)). That is to say, the organic contaminants are degraded by NPFe just through the homogeneous Fenton-like process. Actually, besides the homogeneous reaction, there should be a heterogeneous reaction on the catalyst surface. Similar to Zeo-Fe [27,32], the relevant proposed mechanism of NPFe can be described by Equations (8)–(11), referring to the adsorption of the MO molecules and surface reaction. Hence, based on the above analysis, the degradation mechanism of NPFe-90 can be manifested by the schematic drawing shown in Figure 12. Necessarily, the concentration of the Fe ions (maybe in the form of Fe2+ or Fe3+) in the MO solution versus the degradation time was monitored by ICP-MS, as shown in Figure 13a. The concentration of the Fe ions increases linearly with the extension of the reaction time, which is about 8.0 mg/L after 60 min. For a deeper understanding of the contribution of the homogeneous and heterogeneous reactions for the MO degradation, the degradation tests were carried out only using Fe ions as catalysts (in the form of FeSO4, H2O2 = 10 mM), and the results are shown in Figure 13b. The degradation efficiency of Fe2+/H2O2 steadily increases with the Fe2+ concentration increase, which is almost the same as that of NPFe-90/H2O2 as the concentration reaches 8.0 mg/L. It is assumed that the degradation rate is basically in direct proportion to the catalyst loading (see Figure 8c). Therefore, given that the Fe ion concentration is about 8.0 mg/L in the NPFe-90/H2O2 system after 60 min and keeps a linear relation with the reaction time (see Figure 13a), the MO degradation through the NPFe-90/ H2O2 system follows a synergistic mechanism between the heterogeneous reaction on the catalyst surface and homogeneous reaction in a liquid solution (the efficiency of the two is equal). And after multiple measurements, some degradation performance errors in the experiment may be due to the slight temperature effects, and the experimental results obtained are within the allowable error range.
s u r f a c e F e 0 + H 2 O 2 + 2 H + F e 2 + + 2 H 2 O
F e 2 + + H 2 O 2 + H + F e 3 + + H 2 O + H O
F e 3 + + H 2 O 2 F e 2 + + H + + H O 2
  M O + H O C O 2 + H 2 O + i n o r g a n i c   s a l t
s u r f a c e F e 0 + H 2 O 2 + 2 H + s u r f a c e F e 2 + + 2 H 2 O
s u r f a c e F e 2 + + H 2 O 2 + H + s u r f a c e F e 3 + + H 2 O + H O
s u r f a c e F e 3 + + H 2 O 2 s u r f a c e F e 2 + + H + + H O 2
s u r f a c e M O + H O C O 2 + H 2 O + i n o r g a n i c   s a l t
Moreover, to reveal the stabilizing mechanism of cyclic performance, the surface morphologies of NPFe-90 after the first and fifth cyclic degradation tests were observed, as shown in Figure 14a,b. Figure 14c,d show the EDX patterns of the surface products marked in Figure 14b, indicating the formation of many Fe oxides on the sample surface after the long-time degradation. For one cycle of degradation, NPFe-90 still maintained a porous structure, although there were some fine oxides formed, whereas after the fifth cyclic degradation, it was found that there was a great amount of microscale oxide particles on the surface, leading to the blocking of the surface pores. Perhaps, the formation of Fe oxides and MO degradation products is the main cause of the decrease in the degradation capability of NPFe-90 (primarily referring to the heterogeneous reaction). Nevertheless, based on the above analysis of the degradation process, the NPFe-90 ribbons are still able to steadily release Fe ions into the MO solution for a homogeneous reaction, hence resulting in the high degradability of MO. At last, based on the above analyses, a practical method can be suggested to reactivate and reuse the used Fe-Si-B MG ribbons. The first thing is that the surface Fe oxides have to be removed through the specific corrosion method to obtain the fresh ribbon surface, and then the nanoporous structure have to be regained through chemical etching.

4. Conclusions

In this work, a uniform nanoporous structure with a pore size range from tens to hundreds of nanometers was prepared through the chemical etching of the commercial Fe-Si-B MG ribbon in a diluted HF solution. The obtained nanoporous ribbons after etching for 30, 60, and 90 min (NPFe-30, NPFe-60, and NPFe-90), with the thickness of porous structure films about 92.0, 180.5, and 223.4 nm, respectively, still maintained amorphous structure and possessed much larger specific surface areas than an untreated Fe-Si-B ribbon. The formation of the nanoporous structure primarily follows the pitting corrosion mechanism, which refers to the generation of corrosion pits due to the selective leaching of Si and B and then involves pore growth and integration owing to the selective corrosion of Fe. In the presence of H2O2, the NPFe samples exhibited enhanced catalytic degradation activity toward the MO dye, as well as excellent cycling durability, mainly attributed to the high intrinsic catalytic activity of the amorphous structure and the large specific surface areas of the nanoporous structure. Furthermore, the degradation process could be divided into two aspects: the heterogeneous reaction on the NPFe catalyst surface and the homogeneous reaction in the MO solution, which are of roughly equal effectiveness toward the MO degradation of the NPFe/H2O2 system. At last, although the NPFe/H2O2 system shows good degradation properties for MO in an acidic environment, it currently faces challenges such as the formation of Fe oxides or other degradation products, leading to a decrease in performance. Anyway, in consideration of the high chemical activity of Fe and the widespread use of the Fe-Si-B MGs, the preparation of Fe-based nanoporous structure through the selective chemical leaching of the Fe-Si-B ribbon still exhibits very important practical significance for commercial application in wastewater treatment.

Author Contributions

Conceptualization, S.W.; methodology, S.W.; software, Y.G.; validation, S.W., Z.D. and Y.G.; formal analysis, S.W.; investigation, Z.D. and L.G.; resources, K.W.; data Z.D. and Y.G.; writing—original draft preparation, S.W.; writing—review and editing, S.W.; visualization, K.W.; supervision, K.W.; project administration, K.W.; funding acquisition, K.W. All authors have read and agreed to the published version of the manuscript.

Funding

The authors greatly acknowledge the financial support from the State Key Lab of Advanced Metals and Materials (No. 2019-Z04), Knowledge Innovation Program of Wuhan-Shuguang Project (No. 2023010201020404), and National Natural Science Foundation of China (Nos. U20A20279, 52201189). We would like to thank G. H. Zhang at the Analytical & Testing Center of Wuhan University of Science and Technology for their help with structural characterization.

Data Availability Statement

The raw data supporting the conclusions of this article will be made available by the authors on request.

Conflicts of Interest

The authors declare no conflicts of interest.

References

  1. Xu, H.B.; Wang, F.; Lu, Q.M.; Qiu, Y.B.; Liu, W.Q.; Chen, J.W.; Yi, X.F.; Yue, M. Nd-Fe-B: From sludge waste to powders via purification and modified Ca-reduction reaction process. J. Magn. Magn. Mater. 2022, 543, 168606. [Google Scholar] [CrossRef]
  2. Zhao, B.W.; Liu, Y.L.; Zhao, H.; Li, S.T.; Ma, G.F.; Zhang, S.M.; Zhang, H.F.; Zhu, Z.W. In-situ activation of Fe78Si9B13 metallic glasses for electro-Fenton degradation of industrial oily wastewater. Sustain. Mater. Technol. 2023, 35, e00539. [Google Scholar] [CrossRef]
  3. Lin, H.M.; Chen, K.L.; Zheng, S.J.; Zeng, R.P.; Lin, Y.C.; Jian, R.K.; Bai, W.B.; Xu, Y.L. Facile fabrication of natural superhydrophobic eleostearic acid-SiO2@cotton fabric for efficient separation of oil/water mixtures and emulsions. Sustain. Mater. Technol. 2022, 32, e00418. [Google Scholar] [CrossRef]
  4. Wang, S.S.; Liu, L. Fabrication of novel nanoporous copper powder catalyst by dealloying of ZrCuNiAl amorphous powders for the application of wastewater treatments. J. Hazard. Mater. 2017, 340, 445–453. [Google Scholar] [CrossRef]
  5. Babuponnusami, A.; Muthukumar, K. A review on Fenton and improvements to the Fenton process for wastewater treatment. J. Environ. Chem. Eng. 2014, 2, 557–572. [Google Scholar] [CrossRef]
  6. Zuo, M.Q.; Yi, S.H.; Choi, J.H. Excellent dye degradation performance of FeSiBP amorphous alloys by Fenton-like process. J. Environ. Sci. 2021, 105, 116–127. [Google Scholar] [CrossRef]
  7. Pignatello, J.J.; Oliveros, E.; Mackay, A. Advanced oxidation processes for organic contaminant destruction based on the Fenton reaction and related chemistry. Crit. Rev. Environ. Sci. Technol. 2006, 36, 1–84. [Google Scholar] [CrossRef]
  8. Crane, R.A.; Scott, T.B. Nanoscale zero-valent iron: Future prospects for an emerging water treatment technology. J. Hazard. Mater. 2012, 211, 112–125. [Google Scholar] [CrossRef]
  9. Fu, F.; Dionysiou, D.D.; Liu, H. The use of zero-valent iron for groundwater remediation and wastewater treatment: A review. J. Hazard. Mater. 2014, 267, 194–205. [Google Scholar] [CrossRef] [PubMed]
  10. Zhang, L.; Qiu, L.; Zhu, Q.; Liang, X.; Huang, J.; Yang, M.; Zhang, Z.; Ma, J.; Shen, J. Insight into efficient degradation of 3,5-dichlorosalicylic acid by Fe-Si-B amorphous ribbon under neutral condition. Appl. Catal. B 2021, 294, 120258. [Google Scholar] [CrossRef]
  11. Zhang, P.; Tan, J.; Tian, Y.; Yan, H.; Yu, Z. Research progress on selective laser melting (SLM) of bulk metallic glasses (BMGs): A review. Int. J. Adv. Manuf. Technol. 2022, 118, 2017–2057. [Google Scholar] [CrossRef]
  12. Li, H.F.; Zheng, Y.F. Recent advances in bulk metallic glasses for biomedical applications. Acta. Biomater. 2016, 36, 1–20. [Google Scholar] [CrossRef] [PubMed]
  13. Yang, C.; Zhang, C.; Chen, Z.; Li, Y.; Yan, W.; Yu, H.; Liu, L. Three-dimensional hierarchical porous structures of metallic glass/copper composite catalysts by 3D Printing for efficient wastewater treatments. ACS Appl. Mater. Interfaces 2021, 13, 7227–7237. [Google Scholar] [CrossRef] [PubMed]
  14. Weng, N.; Wang, F.; Qin, F.; Tang, W.; Dan, Z. Enhanced Azo-Dyes Degradation Performance of Fe-Si-B-P Nanoporous Architecture. Materials 2017, 10, 1001. [Google Scholar] [CrossRef] [PubMed]
  15. Tang, Y.; Shao, Y.; Chen, N.; Liu, X.; Chen, S.Q.; Yao, K.F. Insight into the high reactivity of commercial Fe–Si–B amorphous zero-valent iron in degrading azo dye solutions. RSC Adv. 2015, 5, 34032–34039. [Google Scholar] [CrossRef]
  16. Wang, X.; Pan, Y.; Zhu, Z.; Wu, J. Efficient degradation of rhodamine B using Fe-based metallic glass catalyst by Fenton-like process. Chemosphere 2014, 117, 638–643. [Google Scholar] [CrossRef] [PubMed]
  17. Jia, Z.; Kang, J.; Zhang, W.C. Surface aging behaviour of Fe-based amorphous alloys as catalysts during heterogeneous photo Fenton-like process for water treatment. Appl. Catal. B Environ. 2017, 204, 537–547. [Google Scholar] [CrossRef]
  18. Liang, S.X.; Salamon, S.; Zerebecki, S.; Zhang, L.C.; Jia, Z.; Wende, H.; Reichenberger, S.; Barcikowski, S. A laser-based synthesis route for magnetic metallic glass nanoparticles. Scr. Mater. 2021, 203, 114094. [Google Scholar] [CrossRef]
  19. Si, J.J.; Gu, J.L.; Luan, H.W. Porous composite architecture bestows Fe-based glassy alloy with high and ultra-durable degradation activity in decomposing azo dye. J. Hazard. Mater. 2020, 388, 122043. [Google Scholar] [CrossRef]
  20. Wang, J.Q.; Liu, Y.H.; Chen, M.W.; Xie, G.Q. Rapid Degradation of Azo Dye by Fe-Based Metallic Glass Powder. Adv. Funct. Mater. 2012, 22, 2567–2570. [Google Scholar] [CrossRef]
  21. Wang, H.; Wang, B.; Liu, Z.Q.; Zhao, J.F.; Zhang, H.M. Microstructure and mechanical properties of NiTi nanoporous structures fabricated with dealloying process. J. Alloys Compd. 2023, 933, 167804. [Google Scholar] [CrossRef]
  22. Paschalidou, E.M.; Celegato, F.; Scaglione, F. The mechanism of generating nanoporous Au by dealloying amorphous alloys. Acta. Mater. 2016, 119, 177–183. [Google Scholar] [CrossRef]
  23. Li, R.; Liu, X.J.; Wang, H.; Wu, Y.; Chu, X.M.; Lu, Z.P. Nanoporous silver with tunable pore characteristics and superior surface enhanced Raman scattering. Corros. Sci. 2014, 84, 159–164. [Google Scholar] [CrossRef]
  24. Gu, L.Y.; Wang, S.S.; Hui, X.D.; Li, F.D.; Lin, H.F.; Wu, K.M. Degradation performance and mechanism toward methyl orange via nanoporous copper powders fabricated by dealloying of ZrCuNiAl metallic glassy precursors. Nanotechnology 2022, 33, 135713. [Google Scholar] [CrossRef] [PubMed]
  25. Chen, S.Q.; Li, M.; Ji, Q.M.; Chen, X.; Lan, S.; Feng, T.; Yao, K.F. Functional 3D nanoporous Fe-based alloy from metallic glass for high-efficiency water splitting and wastewater treatment. J. Non-Cryst. Solids 2021, 571, 121070. [Google Scholar] [CrossRef]
  26. Zhang, X.H.; Zeng, Y.Q.; Yin, L. Formation of micro/nano pits with high catalytic activity on Fe80B20 amorphous alloy. Corros. Sci. 2018, 141, 109–116. [Google Scholar] [CrossRef]
  27. Liotta, L.F.; Gruttadauria, M.; Carlo, G.D. Heterogeneous catalytic degradation of phenolic substrates: Catalysts activity. J. Hazard. Mater. 2009, 162, 588–606. [Google Scholar] [CrossRef] [PubMed]
  28. Si, J.J.; Yang, X.L.; Luan, H.W.; Shao, Y.; Yao, K.F. Cheap, fast and durable degradation of azo dye wastewater by zero-valent iron structural composites. J. Environ. Chem. Eng. 2021, 9, 106314. [Google Scholar] [CrossRef]
  29. Laat, J.D.; Gallard, H. Catalytic decomposition of hydrogen peroxide by Fe(III) in homogeneous aqueous solution: Mechanism and kinetic modeling. Environ. Sci. Technol. 1999, 33, 2726–2732. [Google Scholar] [CrossRef]
  30. Devi, L.G.; Kumar, S.G.; Reddy, K.M.; Munikrishnappa, C. Photo degradation of methyl orange an azo dye by advanced Fenton process using zero valent metallic iron: Influence of various reaction parameters and its degradation mechanism. J. Hazard. Mater. 2009, 164, 459–467. [Google Scholar] [CrossRef]
  31. Jia, Z.; Wang, Q.; Sun, L.; Wang, Q.; Zhang, L.C.; Wu, G.; Luan, J.H.; Jiao, Z.B.; Wang, A.D.; Liang, S.X. Attractive in situ self-reconstructed hierarchical gradient structure of metallic glass for high efficiency and remarkable stability in catalytic performance. Adv. Funct. Mater. 2019, 29, 1807857. [Google Scholar] [CrossRef]
  32. Noorjahan, M.; Kumari, V.D.; Subrahmanyam, M.; Panda, L. Immobilized Fe(III)-HY: An efficient and stable photo-Fenton catalyst. Appl. Catal. B Environ. 2005, 57, 291–298. [Google Scholar] [CrossRef]
Figure 1. SEM images of surface morphologies of (a) original Fe-Si-B MG ribbon, (b) NPFe-30, (c) NPFe-60, and (d) NPFe-90.
Metals 14 00936 g001
Figure 2. (a) GI-XRD patterns of the as-etched and original Fe-Si-B MG ribbons and (b) the EDX analysis of the Fe-Si-B MG ribbon after etching for 90 min.
Metals 14 00936 g002
Figure 3. Surface AFM images of (a) the original Fe-Si-B MG ribbon and the samples of (b) NPFe-30, (c) NPFe-60, and (d) NPFe-90.
Metals 14 00936 g003
Figure 4. (a) Nitrogen adsorption and desorption isotherms of the original Fe-Si-B MG ribbon and the as-etched NPFe-30, NPFe-60, and NPFe-90 samples, and (bd) the statistical pore size distribution of the three etched specimens.
Metals 14 00936 g004
Figure 5. Surface SEM images of Fe-Si-B MG ribbons after chemical etching for (a,b) 15 s, (c,d) 30 s, (e) 60 s, and (f) 120 s.
Metals 14 00936 g005
Figure 6. The evolution of the chemical composition of the surface nanoporous structures with the increase in the etching time.
Metals 14 00936 g006
Figure 7. Schematic illustration of the formation process of the surface porous structures.
Metals 14 00936 g007
Figure 8. (a) Degradation performance of the NPFe-30, NPFe-60, NPFe-90, and original Fe-Si-B MG ribbons, and the effect of the (b) pH value, (c) NPFe dosage, and (d) H2O2 concentration on the degradability of NPFe-90 toward the MO dye. The following parameters were adopted unless otherwise specified: Ph = 2, NPFe catalyst = 0.2 g/L, H2O2 concentration=10 mM, and temperature = 40 °C.
Metals 14 00936 g008
Figure 9. (a) Effect of temperature on the MO degradation of NPFe-90, and (b) the fitting lines of ln(Ct/C0) versus reaction time at different temperatures.
Metals 14 00936 g009
Figure 10. Cycling properties of the NPFe-90 specimen toward the degradation of MO dye.
Metals 14 00936 g010
Figure 11. (a) The fitting line of −lnkT versus 1/T, and (b) the MO degradability by only the NPFe-90 catalyst and H2O2 oxidant, and the NPFe/H2O2 system with and without the loading of MA.
Metals 14 00936 g011
Figure 12. Schematic drawing of degradation mechanism of NPFe-90 catalyst toward MO dye.
Metals 14 00936 g012
Figure 13. (a) The concentration variation in the Fe ions in the degraded solutions of NPFe-90, and (b) the degradation performances of the various Fe2+/H2O2 systems and NPFe/H2O2 toward the MO dye.
Metals 14 00936 g013
Figure 14. SEM images of the surface morphologies of NPFe-90 after (a) the 1st and (b) 5th cyclic degradation tests, and (c,d) the EDX analyses of the surface products marked in the areas A and B in figure (b).
Metals 14 00936 g014
Disclaimer/Publisher’s Note: The statements, opinions and data contained in all publications are solely those of the individual author(s) and contributor(s) and not of MDPI and/or the editor(s). MDPI and/or the editor(s) disclaim responsibility for any injury to people or property resulting from any ideas, methods, instructions or products referred to in the content.

