Article

Material Properties and Friction and Wear Behavior of Ti–18 mass% Nb Alloy after Gas Nitriding and Quenching Process

1
Department of Materials Science and Engineering, National Institute of Technology (KOSEN), Suzuka College, Suzuka 510-0294, Japan
2
Advanced Engineering Course of Science and Technology for Innovation, National Institute of Technology (KOSEN), Suzuka College, Suzuka 510-0294, Japan
3
Mie Prefecture Industrial Research Institute Metal Science Branch, Kuwana 511-0927, Japan
4
Department of Mechanical Engineering, Nagaoka University of Technology, Nagaoka 940-2188, Japan
*
Author to whom correspondence should be addressed.
Metals 2024, 14(8), 944; https://doi.org/10.3390/met14080944
Submission received: 18 July 2024 / Revised: 16 August 2024 / Accepted: 18 August 2024 / Published: 19 August 2024
(This article belongs to the Special Issue Light Alloy and Its Application (2nd Edition))

Abstract

:
We performed a gas nitriding and quenching process (GNQP) on Ti–18 mass% Nb alloy to obtain a high damping capacity and wear resistance. GNQP was performed at temperatures of 1023, 1123, and 1223 K. The outermost surface of the GNQP specimen obtained at 1023 K mainly comprised TiO2, whereas that at 1223 K mainly comprised TiN. The surface and interior of the specimens exhibited higher hardness at 1223 K than that at 1023 K. Compared to the specimen obtained by solution–quenching (AQ), the unit volume of the α” martensite phase at a depth of 320 μm of the GNQP specimen obtained at 1023 K was similar, and that at 1223 K was higher. Such a difference can be related to the difference in the core hardness of the specimens. The wear amounts of all GNQP specimens were lower than those of the AQ specimen. The coefficient of friction of the GNQP specimen obtained at 1023 K was lower than that obtained at 1223 K. The surface constituent phase and surface roughness exhibited a strong influence on the wear at a load of 500 g. Meanwhile, the nitride layer and damping capacity were considered to be related to the wear at a load of 3000 g.

1. Introduction

Ti alloys have excellent specific strength, corrosion resistance, and biocompatibility and are used in various fields, such as aircraft, automotive, biological applications, and buildings [1,2,3]. In addition to developing Ti alloys for applications that utilize their excellent properties as structural materials, research has also focused on the utilization of their functionality. In particular, several studies have been conducted with a focus on the low Young’s modulus of materials based on β-type Ti alloys [4,5,6,7], and the superelasticity [8,9,10] and shape-memory properties [10,11,12,13] in compositions with stress-induced α” martensite phases.
Improving new properties is necessary to further expand the applications of Ti alloys. One of the properties that we are currently focusing on is damping capacity. Ti alloys are recognized as metallic materials with low damping capacities [14]. Although an increase in the damping capacity of existing Ti–6246 alloys has been reported using a martensite structure [15,16], few studies have focused on the microstructural state that maximizes the damping capacity of Ti alloys.
In our previous research, we experimentally examined the relationship between the quenched microstructural state and mechanical properties of Ti–(15, 18, 20) mass% Nb alloys based on (α + β)-type Ti alloys [17,18]. This composition range exhibited a high damping capacity, which was not achieved with previous Ti alloys. However, lower hardness and poor wear resistance were observed owing to the martensite structure of the Ti–Nb alloys. Therefore, improving the surface hardness and wear resistance of Ti alloys while maintaining a high damping capacity is needed to increase their damping capacity and enable their use in frictional sliding parts. To achieve this, a surface-hardened layer must be generated while maintaining the interior martensite structure. The mechanism of nitrogen adsorption, penetration, and diffusion into α-Ti is also shown by the results of first-principles calculations [19]. Therefore, surface hardening of the Ti–15Nb alloy has been attempted using plasma nitriding; however, plasma nitriding at a relatively low temperature while maintaining the quenched martensite hardened only the outermost surface [20]. Based on this result, we developed a gas nitriding and quenching process (GNQP), whereby gas nitriding and quenching are simultaneously performed using an equipment simpler than that used in plasma nitriding, and applied it on Ti–15Nb alloy. When the GNQP treatment was performed, high damping capacity and surface hardness could be achieved [21]. In this study, the core hardness of the GNQP material of the Ti–15Nb alloy at 1223 K was approximately 200 HV higher than that of the Ti–15Nb alloy at 1023 K. However, the reason for such a difference remains unclear. The Ti–18Nb alloy was revealed to have a higher internal friction value than the Ti–15Nb alloy after quenching [17,18].
Therefore, in this study, a higher damping capacity and wear resistance were obtained through the application of GNQP treatment on the Ti–18Nb alloy to investigate the material properties and friction and wear behavior. Several reports have focused on the friction and wear behavior of surface-hardened Ti alloys [22,23,24,25,26,27,28]. However, Vickers hardness, wear resistance, and coefficient of friction do not have a simple proportional relationship, whereby wear resistance is considered to be influenced by various factors, such as surface roughness, surface and inner phase constituents, indenter material, and applied load.
Based on the tribological background, experimental methods, and results, friction and wear tests were conducted on the Ti–18Nb alloy after GNQP. Moreover, the relationship between the material properties and the friction and wear behavior is discussed based on the obtained results.

2. Materials and Methods

A α-rich (α + β)-type Ti–18 mass% Nb alloy (Nb: 18.05%, O: 0.15%) and 1 mm thick plates cut from the same material used in a previous report [18,19] were used in the experiment. Figure 1 shows a schematic of the experimental method. Figure 1a shows a schematic of the GNQP. The specimen was placed on a quartz boat and then in a quartz tube in an electric furnace. Evacuation and N2 replacement were repeated several times. N2 gas with a purity of 99.999% and heated to 1023, 1123, or 1223 K at a pressure of 0.15 MPa was used. After heating for 1 and 5 h, the quartz boat was immersed in ice water for quenching. The aforementioned steps constitute GNQP. Subsequently, the Ti–18Nb alloy was vacuum sealed in a quartz tube and heated at 1223 K for 1 h. The quartz tube was then crushed in ice water and quenched. This solution-quenching condition is referred to as AQ.
After GNQP, the specimens were subjected to cross-sectional scanning electron microscopy (SEM), cross-sectional Vickers hardness tests, X-ray diffraction (XRD) analysis, internal friction and surface roughness measurements, and friction and wear tests. Elemental analysis was also performed using SEM–energy-dispersive spectroscopy (EDS) during SEM analysis. Table 1 lists the heat-treatment conditions and tests conducted for each specimen.
Cross-sectional SEM observations (Hitachi S-4300, Tokyo, Japan) and SEM–EDS measurements were performed using specimens that were buffed and then ion-milled. Cross-sectional Vickers hardness tests were performed using a Mitutoyo HM-220D (Kawasaki, Japan) with a test force of 0.01 kgf, from a position of 5 μm from the outermost surface to 385 μm at intervals of 20 μm along the depth direction of the specimen cross section. This measurement was repeated thrice, and the average value and standard deviations were calculated. XRD measurements were performed at a Rigaku SmartLab (Tokyo, Japan) using Cu-Kα radiation with a tube voltage of 40 kV, tube current of 30 mA, and diffraction angle range of 20–90°. In addition to the surface structure after GNQP, the constituent phases were examined at depths of 30, 70, 150, and 320 μm after the surface was polished. Internal friction measurements were performed using an Onosokki DS-3000 (Yokohama, Japan) instrument to apply vibrations using the free-resonance method. The damping waveform of the vibration amplitude was obtained, and the internal friction Q−1 was calculated using the Hilbert calculation. The surface roughness was measured thrice using a Mitutoyo SURFTEST SJ-310 (Kawasaki, Japan) based on the ISO standard, and the average value and standard deviation of the arithmetic average roughness Ra and maximum height roughness Rz were calculated. Friction and wear tests were performed using a Rhesca FPR-2100 (Tokyo, Japan) with a diameter of φ5 mm steel or alumina ball as a friction indenter on a circumference of radius r = 1 mm at a rotation speed of 50 rpm for up to 1800 s. The coefficient of friction was sampled at a speed of 0.01 s, and the graph was smoothed. The wear tracks after the test are illustrated in Figure 1b. The width and depth of the wear tracks were measured in four directions, as shown in Figure 1, based on a previous study [26]. The wear track width was measured using an optical microscope, and the wear track depth was measured using a laser displacement meter (KEYENCE CL-3000, Osaka, Japan). In addition, SEM and SEM–EDS were performed on some specimens.

3. Results

3.1. Microstructures and Material Properties after GNQP

Figure 2 shows the cross-sectional SEM images after GNQP for (a) 1023 K for 1 h, (b) 1023 K for 5 h, (c) 1223 K for 1 h, and (d) 1223 K for 5 h. As shown in Figure 2a, a film is formed on the outermost surface at the left end, and a structure is developed at a depth of 15 µm from the outermost surface. As shown in Figure 2b, a dense region at a depth of up to approximately 10 µm and a sparse region at a depth of up to approximately 40 µm are observed. Minimal changes in the depth of the dense region are noted, even at the GNQP temperature of 1223 K. However, at 1223 K, the sparse region is observed at a depth of 70 µm after 1 h (Figure 2c) and approximately 80 µm after 5 h (Figure 2d). GNQP at 1023 K for 1 h resulted in a needle-like structure. As the nitriding temperature and time increased, the formed structures became thicker, longer, and rounder. In addition, as depicted in the cross-sectional analysis results, the nitrided surface is relatively flat at 1023 K with the presence of surface irregularities increasing at 1223 K.
Elemental analysis by SEM–EDS was performed on the specimen heated at 1223 K for 5 h, whereby a massive structure is clearly visible. Figure 3 shows the structural image (a) and elemental distributions of Nb (b), O (c), and N (d). (e) is the enlarged structure of the outermost surface of (a). The dark areas in the structural image have low Nb content and high N content. The O content increases in the outermost surface area, and an oxide film is considered to be formed on the outermost surface during quenching in ice water. The elemental analysis results of points ①–④ in Figure 3a are listed in Table 2. The areas that could not be quantified are indicated by horizontal lines. In point ①, the N content is 8.1 mass% and the Nb content decreases to 6.8 mass%. In terms of the atomic content, the N content is 23.4 at.%, suggesting that nitride layers, such as composed Ti2N, are formed in this region. As the O content hardly increases after GNQP, a thin oxide film less than a few µm is formed. In contrast, in the parent phase region of ②, the Nb content increased to 27.9 mass%, and a nearby Nb-enriched region is formed as nitrides or a N solid-solution layer. In the region at point ③, N is detected at 2.5 mass%, which is not detected in point ②, with a slight decrease in the Nb content. This N content is equivalent to 8.6 at.%, suggesting that it is a N solid-solution layer. Meanwhile, N is not detected in point ④, and the Nb content is slightly higher than the average composition. Hence, this is a region of the base structure. This nitrided structural morphology is different from that formed in Titanium Grade 2 [27] or Ti6Al4V alloys [28], and this change is considered to be due to the amount of Nb, a β-stabilizing element.
Figure 4 shows the cross-sectional Vickers hardness distribution after GNQP under different conditions. For the GNQP specimen obtained at 1023 K for 1 h, the outermost surface has a hardness of 400 HV0.01, which gradually decreased. Moreover, its hardness at a depth of 150 μm is the same as that of the AQ specimen (203 HV). At 1023 K, the hardness at a depth of 385 μm obtained at 5 h is higher than that at 1 h. At 1223 K for 1 h, the hardness of the outermost surface exceeded 700 HV0.01 and that of the interior was greater than 300 HV0.01. At 1223 K, the hardness of the outermost surface at 5 h is slightly higher than that at 1 h. This difference in hardness continued to the interior, where it was higher than the hardness of 1023 K. As the gas nitriding temperature and process duration increase, the hardness of the material increases from the surface to approximately 100 µm, where nitrides and N solid solution phases are observed, and in the interior. This tendency in hardness is considered to be due to the formation of nitride and nitrogen solid solution phases and the accompanying structural changes. This finding is consistent with the measurement results for the Ti–15Nb alloy [21].
The composition of each phase with respect to the surface depth after GNQP was clarified using XRD after polishing the specimens to the desired depth. Figure 5 shows the XRD profiles at various depths under the GNQP conditions of (a) 1023 K for 5 h and (b) 1223 K for 5 h. For the surface obtained at 1023 K, sharp diffraction peaks of TiO2 and Ti2N, TiN, and N solid-solution-phase α-TiN0.3 are detected. In addition to Ti2N and α-TiN0.3, diffraction peaks of the β phase are noted at a depth of 30 μm. Diffraction peaks of the α” martensite are observed at depths of 70–320 µm. In contrast, Ti2N and α-TiN0.3 are detected on the surface at 1223 K with the highest diffraction peak intensity for TiN. A weak TiO2 peak is also noted, which can be ascribed to the inhibited formation of a TiO2 film during water quenching when the nitride formation and N solid solution increased at high temperatures owing to gas nitriding. At depths of less than 30 µm, diffraction peaks of the β phase, Ti2N, and α-TiN0.3 are observed. At depths of less than 70 µm, the α″ martensite is the main component and α-TiN0.3 is also detected. At depths of 150 and 320 µm, the main diffraction peaks of α″ martensite are noted. In particular, the diffraction peaks at 150 and 320 µm at 1223 K are broader than those at 1023 K, corresponding to the internal residual strain, which is considered to be the result of a difference in the Vickers hardness. Similar results were obtained in previous studies on Ti–15Nb alloys [21].
Figure 6 shows the internal friction (a) and surface roughness (b) after GNQP. The internal friction of the annealed α + β structure is approximately 0.3 × 10⁻³, whereas that of the AQ specimen is extremely high at 7.2 × 10⁻³. This measured value is consistent with previous internal friction measurement results for Ti-Nb alloys [17,18]. The same findings are observed for the GNQP specimen obtained at 1023 K and the AQ specimen. Although the internal friction for the GNQP specimens obtained at 1123 and 1223 K decreased, high values are maintained. This difference in the internal friction can be ascribed to the difference in the nitride layer and N solid-solution phase on the surface side and α” martensite phase. For the AQ specimen, Ra is 0.14 µm and Rz is 0.97 µm. The Ra and Rz values of the GNQP specimen obtained at 1023 K are higher than those of the AQ specimen; however, only a small difference is noted for the specimens obtained after 1 and 5 h. The Ra and Rz of the GNQP specimen obtained at 1223 K are higher than those obtained at 1023 K. Moreover, these values increased as the time was increased from 1 h to 5 h. At 1223 K for 5 h, Ra is 0.64 µm and Rz is 5.4 µm. The surface roughness increased owing to the formation of a nitride layer and the growth of the N solid-solution phase.

3.2. Changes in Friction and Wear Behavior Based on the Indenter Material and Load

We investigated the differences in the friction and wear behaviors based on the indenter material. Figure 7 shows the changes in the coefficient of friction using (a) steel balls and (b) alumina balls with an applied load of 200 g for up to 1200 s. For measurements of steel balls other than at 1223 K, the measurement time was shorter than 1200 s, although they were taken until a stable coefficient of friction was reached. Using the steel ball, the coefficient of friction of the AQ specimen increased and decreased repeatedly to an average value of approximately 0.4. For the GNQP specimen obtained at 1023 K, the initial coefficient of friction is approximately 0.2, which increased rapidly to a constant value of 0.5 after approximately 200 s. For the GNQP specimens obtained at 1123 and 1223 K, the coefficient of friction gradually increased, reaching approximately 0.5 at 1200 s. Using alumina balls, the coefficient of friction for the AQ specimen increased and decreased repeatedly to an average value of 0.6. For the GNQP specimens, the coefficient of friction is maintained at 0.1 under all conditions; however, the slope of the coefficient of friction increased as the temperature increased to 1023, 1123, and 1223 K. The highest coefficient of friction is obtained for the GNQP specimen obtained at 1023 K using steel balls, whereas the lowest coefficient of friction is noted for that obtained at 1023 K using alumina balls. This difference in the coefficient of friction can be ascribed to the wear state of the Ti alloy; therefore, we investigated the wear tracks on the specimens.
Figure 8 shows the SEM–EDS results for the wear tracks under different conditions: (a) GNQP at 1023 K and using a steel ball, (b) GNQP at 1223 K and using a steel ball, (c) AQ and using an alumina ball, and (d) GNQP at 1223 K and using an alumina ball. In Figure 8a, the wear track appears to be raised. As the area has lower Ti content and higher O and Fe contents, a part of the steel ball attaches to the GNQP surface. In Figure 8b, minimal adhesion is observed, and the Ti content decreased, whereas the O and Fe content increased. As the GNQP surface is harder than the steel ball, the effect of the increase in the coefficient of friction owing to adhesion increases when a steel ball is used. In contrast, a wider wear track is noted in Figure 8c. The Ti content in the area decreased, whereas the O and Al content increased. Although the AQ surface is soft, adhesion occurred to the alumina ball, causing alumina to adhere to the AQ surface. In Figure 8d, wear marks are observed, whereas no decrease in the Ti content or increase in the O content is detected. As both surfaces are hard, a small amount of alumina adheres to the GNQP surface.
These results are useful for selecting a counterbody for tribological studies. In particular, it was found that the Ti–18Nb alloy hardened by GNQP adhered to the steel ball and had little reaction to the alumina ball.
Based on the above results, we conducted tests with a larger load and test time using an alumina ball on a GNQP surface. Figure 9 shows the results of friction and wear tests conducted for up to 1800 s with a load of 500 g. The change in coefficient of friction is shown in Figure 9a. The coefficient of friction of AQ is in the range of 0.5–0.6, whereas that of GNQP obtained at 1023 K is less than 0.2 for up to 1800 s. For GNQP at 1123 K, the coefficient of friction increased from approximately 200 s, reaching 0.5 at 1000 s, and then remained almost constant. For GNQP at 1223 K, the coefficient of friction increased from the early stages, which is equivalent to that of AQ at approximately 0.6.
After the tests, the wear tracks were observed by SEM. Figure 9b shows the wide wear track of the AQ specimen, and the worn part re-adhered to the center. For the wear tracks of the GNQP specimens obtained at (c) 1023 K, (d) 1123 K, and (e) 1223 K, the widths are smaller at all temperatures. No simple correlation can be obtained between the coefficient of friction and wear progression. Wear progresses rapidly with time, as in AQ. The AQ specimen exhibited a morphology in which the wear debris re-adhered, whereas the GNQP specimens produced almost no wear debris and was considered to have a morphology in which the nitride layer was compressed.
We conducted friction and wear tests under various loads. Figure 10 shows the changes in the coefficient of friction at an applied load of (a) 2000 g and (b) 3000 g. For the AQ specimen, the coefficient of friction fluctuated at approximately 0.8 for both loads. In contrast, for the GNQP specimen, a characteristic change is observed. At a load of 2000 g applied to the GNQP specimen obtained at 1023 K, the coefficient of friction is relatively low up to 1600 s, which then increased sharply. At a load of 2000 g applied to the GNQP specimen obtained at 1223 K, the coefficient of friction exhibits a two-step increase up to 1000 s, followed by the same increase and decrease behavior as that of the AQ specimen at approximately 0.6. In contrast, at a load of 3000 g applied to the GNQP specimen obtained at 1023 K, the coefficient of friction is relatively low up to 600 s, followed by an increasing and decreasing pattern after 1400 s. At a load of 3000 g applied to the GNQP specimen obtained at 1223 K, the coefficient of friction is similar to that obtained at 1023 K up to 200 s. However, a two-step change is noted similar to that obtained at a load of 2000 g applied to the GNQP specimen obtained at 1023 K after 1200 s. These changes in the coefficient of friction can be ascribed to the wear of the oxide film, nitride layer, or N solid-solution phase.
Figure 11 shows the cross-sectional shapes of the wear tracks measured using a laser displacement meter to investigate the depth and appearance of the wear tracks. The applied loads were (a) 200, (b) 500, (c) 2000, and (d) 3000 g. The results at the left side are those of the center of the wear circle and those at the right side are those of the outer periphery of the wear circle. In the friction and wear tests of the Ti alloy TC11, adhesive and abrasive wear modes have been reported [24]. Notable differences are noted in the cross-sectional morphology. At a load of 200 g, the test continued for up to 1200 s. At 200 g, the AQ specimen has the deepest wear tracks, and adhesive wear occurred with the outer periphery raised. In contrast, minimal difference is noted in the wear track depth for the GNQP specimens obtained at different temperatures. At a load of 500 g, the test was continued for up to 1800 s, whereby the wear track of AQ is approximately 16 µm deep and its outer periphery is elevated by approximately 6 µm. No significant difference is obtained in the wear track depth for GNQP, even at a load of 500 g. At 2000 g, AQ adhered to the bottom of the wear track rather than to the outer periphery. For the GNQP specimen obtained at 1023 K, a small coefficient of friction is maintained until the final stage and increased rapidly at approximately 1600 s, showing a wear track at 2400 s. The specimen was subjected to friction and wear tests for an additional 600 s, suggesting the longer test time from 1800 s. In this case, adhesion occurred at the bottom of the wear track. For the GNQP specimen obtained at 1223 K, the wear track is symmetrical, but deeper than that obtained at 1023 K. Similar trends are observed for the loads at 2000 and 3000 g with adhesion at the bottom for AQ. Moreover, the wear track is deeper for the GNQP specimen obtained at 1223 K than that at 1023 K.
Figure 12 shows the wear track width and depth against the applied load. The results obtained at 200 g are presented for 1200 s, and those for the GNQP specimen obtained at 1023 K under the applied load of 2000 g are presented for 2400 s. The reference data are presented in the parentheses. The wear track width increases with increasing load for AQ. However, for the GNQP specimens obtained at 1023 K and 1223 K, a narrow wear track width is obtained up to 500 g, which increased to 900 µm at 2000 and 3000 g. The wear track depth also exhibits a similar trend. However, at 2000 g, the wear track is deeper for the GNQP specimen obtained at 1223 K than that of AQ. This result is attributed to the presence of adherent wear debris at the bottom of the wear track for AQ. Another notable feature is the smaller wear track width and depth at 1023 K than at 1223 K. In particular, a threshold value between 500 and 2000 g can be assumed, at which the surface layer of the GNQP is worn. However, this phenomenon is still a subject for future measurements.

4. Discussion

4.1. Changes in the Internal Structure after GNQP

The cross-sectional structures in Figure 2, cross-sectional hardness distributions in Figure 4, and XRD profiles in Figure 5 depict the increase in hardness from the surface to a depth of approximately 50 µm under all GNQP conditions, which is mainly ascribed to the formation of a nitride layer and an α-TiN0.3 N solid-solution phase. The cross-sectional hardness distribution shown in Figure 4 depicts higher nitriding temperatures and longer nitriding times that resulted in higher hardness even with increasing depth. The factors for such a phenomenon were elucidated from the perspective of the constituent phases and their structures at depths of 70, 150, and 320 µm using XRD, as shown in Figure 5. Figure 13 shows the changes in the crystal structure of the quenched α″ martensite and β phase with the depth after GNQP. Compared to AQ, the lattice constant a of α″ martensite at 1023 K is slightly larger at depths of 70 and 150 μm and similar at 320 μm. The axial ratio b/a is consistent for the GNQP and AQ specimen, whereas the axial ratio c/a of the GNQP specimen is slightly smaller but approached that of AQ with increasing depth. Meanwhile, for the α″ martensite at 1223 K, the lattice constant a is larger than that of AQ at 70 μm, but equivalent to that of AQ at the inner part. Moreover, the axial ratios b/a and c/a are smaller than that of AQ at 70 μm but are equivalent to that of AQ at 150 and 320 μm. The lattice constant a of the β phase was calculated from the diffraction peak of 110β only, resulting in the low accuracy. Meanwhile, the lattice constant a decreased with increasing depth at 1023 and 1223 K.
Figure 13d shows the unit volume change of the α″ and β phases calculated by orthorhombic conversion. At 70 μm, more N is dissolved in both phases than in AQ, and the unit volume is larger than that of AQ. The α″ martensite phases expanded at both temperatures, even at 150 μm, and is harder than AQ, as shown in Figure 4, suggesting the influence of the N solid solution. At 320 μm, the expanded unit volume at 1023 K is equivalent to that of AQ. However, at 1223 K, the same expanded unit volume is obtained at 150 μm. The unit volume of the β phase is larger at 1223 K than at 1023 K, both of which decreased with increasing depth. Although whether the hardening at 1223 K is ascribed to the N solid solution is difficult to determine, it is considered to be related to the expansion of the α” martensite at 320 μm at 1223 K. In addition, the XRD profile in Figure 5 shows a broader XRD peak at 1223 K than at 1023 K, indicating a larger residual strain. A similar broadening of the diffraction peak width is observed for the Ti–15Nb alloy [21]. Although quantitative evaluation is difficult to realize owing to the peak overlap, work hardening due to residual strain is considered to be a factor for such a phenomenon. After gas nitriding at 1223 K, hardening of the internal structure was reported for the Ti–29Nb–13Ta–4.6Zr and Ti–6Al–4V alloys, which was not observed by gas nitriding at lower temperatures [29]. Although the underlying mechanism remains unclear, a similar phenomenon is believed to occur.

4.2. Changes in the Wear Amount and Coefficient of Friction

The friction and wear test results in Section 3.2 are evaluated from a microstructural viewpoint using the cross-sectional structure in Figure 2, the surface-phase composition of the XRD profile in Figure 5, and the internal friction and surface roughness results in Figure 6. Figure 14 shows a schematic of the changes in the coefficient of friction and microstructure state. At 500 g, the wear track depth remains unchanged at approximately 4 μm at 1023 and 1223 K, whereas the coefficient of friction varies. The coefficient of friction after 1200 s at 1223 K is equivalent to that of AQ. The wear progresses with repeating increases and decreases similar to AQ. Moreover, an evaluation based on the coefficient of friction value alone is difficult to achieve. Similarly, the untreated Ti alloy BT22 has large variations in the coefficient of friction, which is reduced by gas nitriding [22]. In the surface structure worn up to approximately 4 µm at a load of 500 g for 1800 s during the friction and wear tests, the main constituent phase and surface roughness are different for the specimens obtained at 1023 and 1223 K. The XRD profiles show that the main constituent phase at 1023 K is TiO2, whereas that at 1223 K is TiN. The TiO2 film formed during quenching may have contributed to the maintained low coefficient of friction. In addition, the surface roughness is higher at 1223 K than that at 1023 K. At 1223 K, Ra is 0.6 μm and Rz is 5.4 μm, indicating that Rz exceeds the average wear depth. The difference in the coefficients of friction can be attributed to the relationship between the contact surface of the alumina ball and the constituent phase. In particular, the surface oxide layer of an electron beam-melted Ti–6Al–4V alloy has been reported to exhibit a low coefficient of friction, which increases rapidly as the oxide layer peels off and with the formation of surface protrusions [23]. A similar trend was observed in the experiment results for the GNQP specimens.
Under a high applied load of 3000 g, the wear track depth at 1023 K was 32 μm, whereas that at 1223 K was 47 μm, and the coefficient of friction varied up to 1400 s. The predicted positions of the wear track depth at each time point are shown in the SEM images. At 1023 and 1223 K, the positions up to the point where the outermost oxide film and nitride phase are predominant correspond to region 1. At 1023 K, wear is thought to progress through region 2, which contains the N solid-solution phase, hardened region 3, and region 4 of the α″ martensite. At 1223 K, wear is considered to progress through region 2, which contains the dense N solid-solution phase; region 3, which contains the sparse N solid-solution phase; hardened region 4; and region 5, which consists mainly of the α″ martensite. In addition, the wear track depth at 1223 K exceeded that at 1023 K owing to two possible reasons. First, the harder layer was more likely to peel off under high loads. Second, as shown in Figure 6a, the damping capacity at 1023 K was higher than that at 1223 K. Such a high damping capacity at 1023 K may have contributed in maintaining a low coefficient of friction and reducing the amount of wear.
Based on these results, the material, friction, and wear properties of the Ti–18Nb alloy treated with GNQP were examined. However, several points remain unclear, such as the N solid-solution depth. This phenomenon could be elucidated accurately through further experiments.

5. Conclusions

The material properties of the quenched α” martensite structure, which was gas-nitrided on the surface of the Ti–18Nb alloy by GNQP, were investigated using cross-sectional SEM, the cross-sectional Vickers hardness test, XRD analysis, and internal friction and surface roughness measurements. In addition, the friction and wear behavior was investigated by examining the coefficient of friction and morphology of the wear tracks using friction and wear tests. The following findings were obtained:
(1)
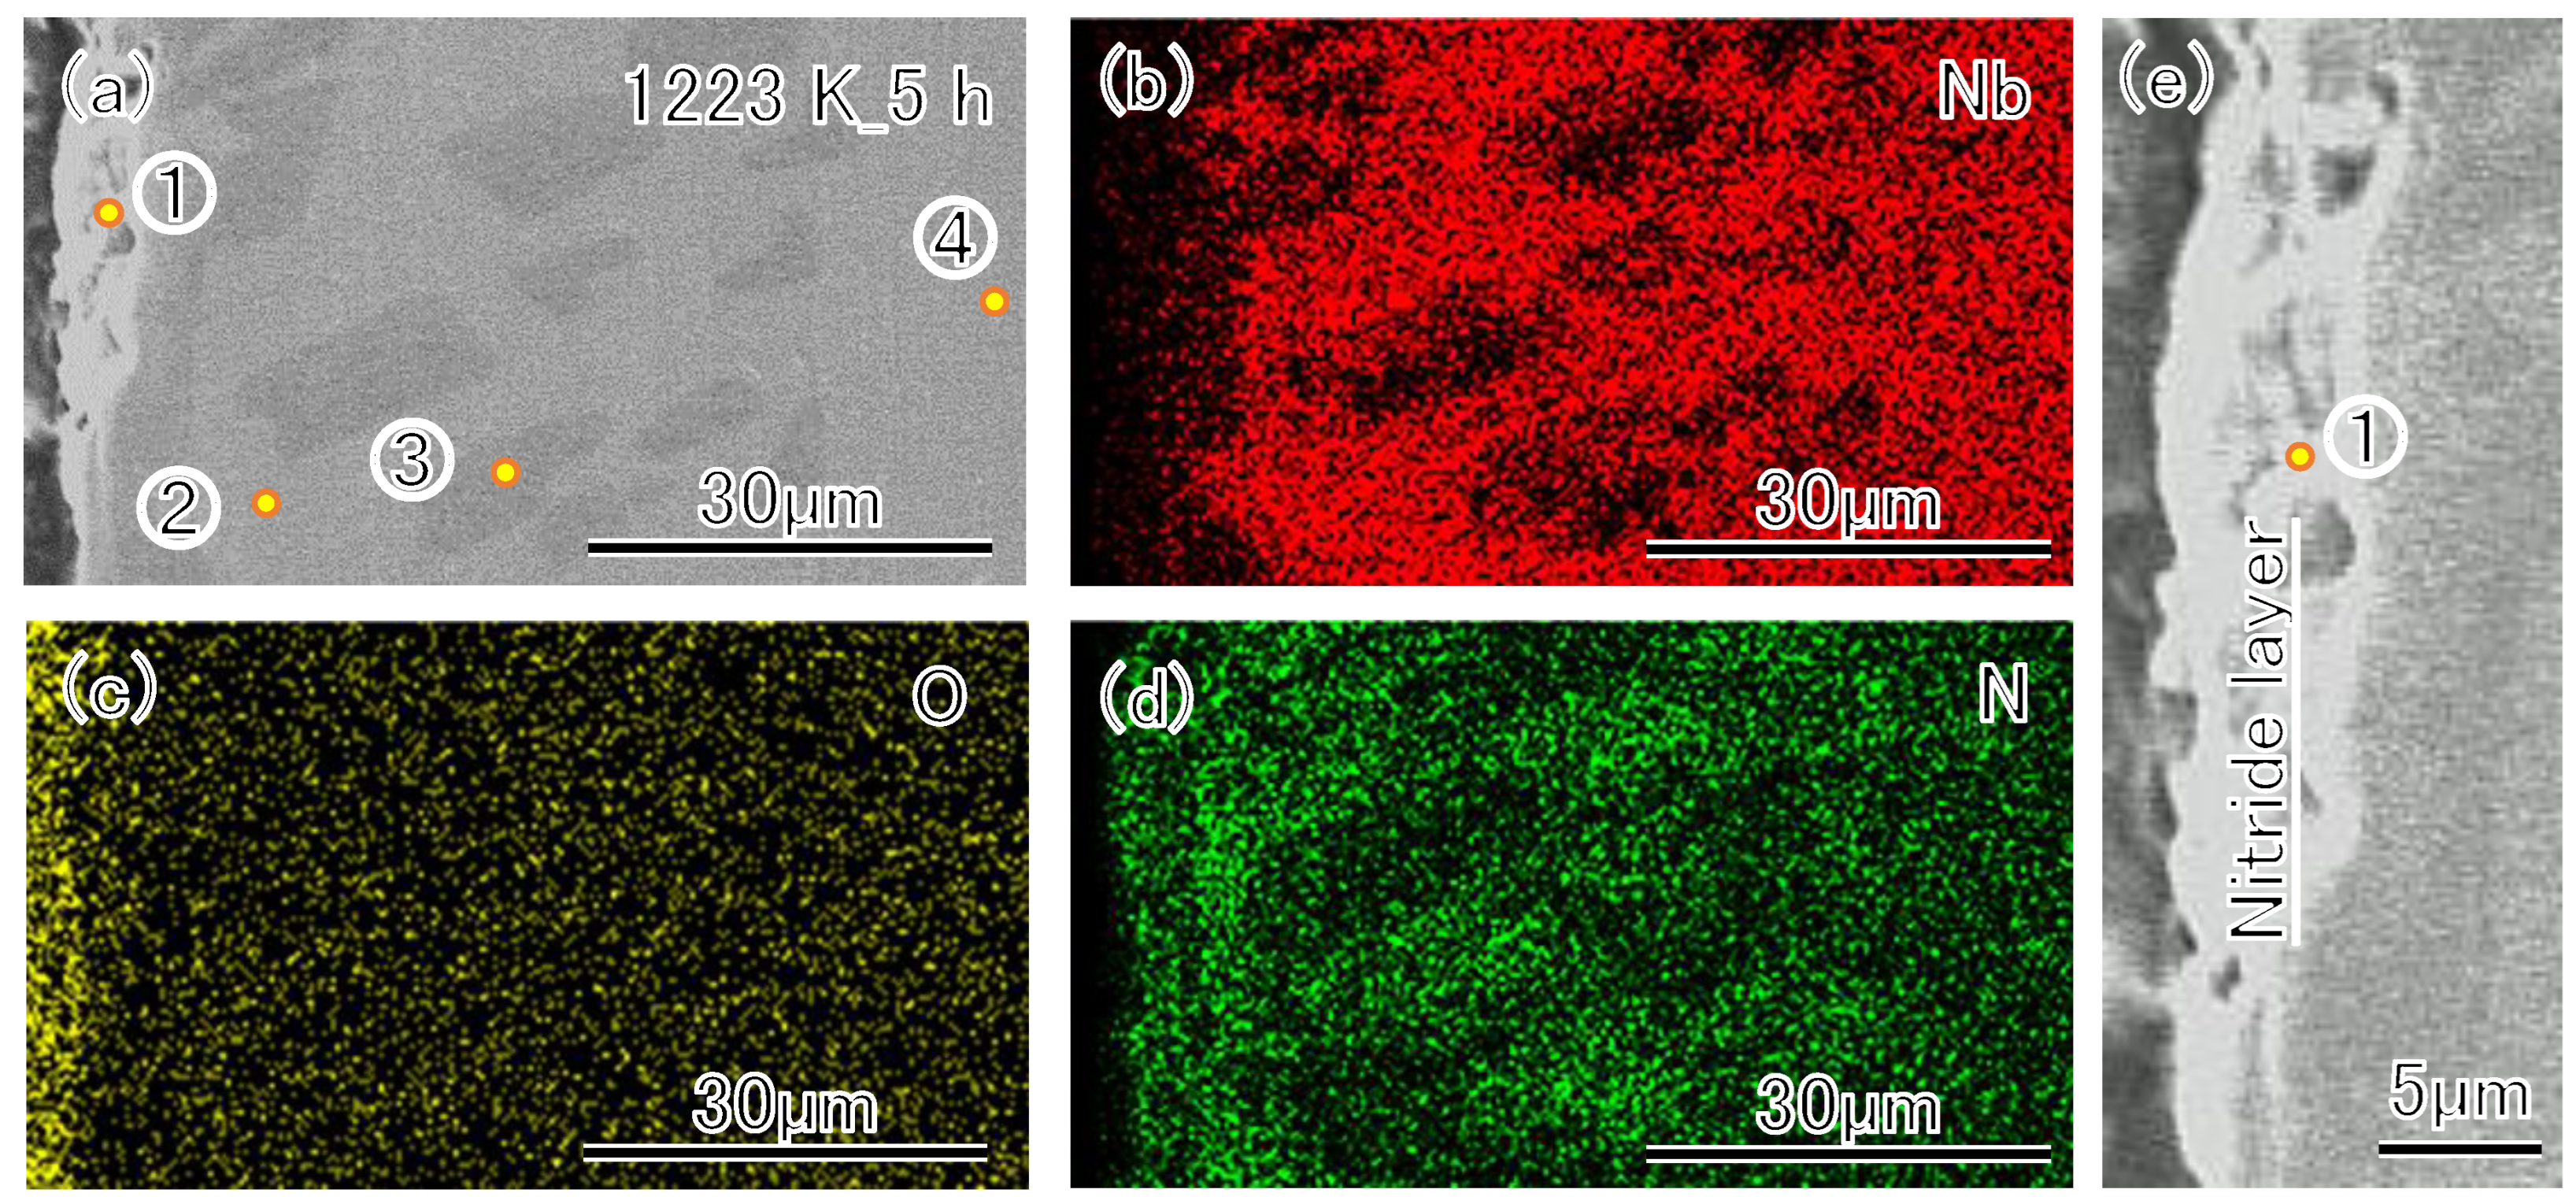
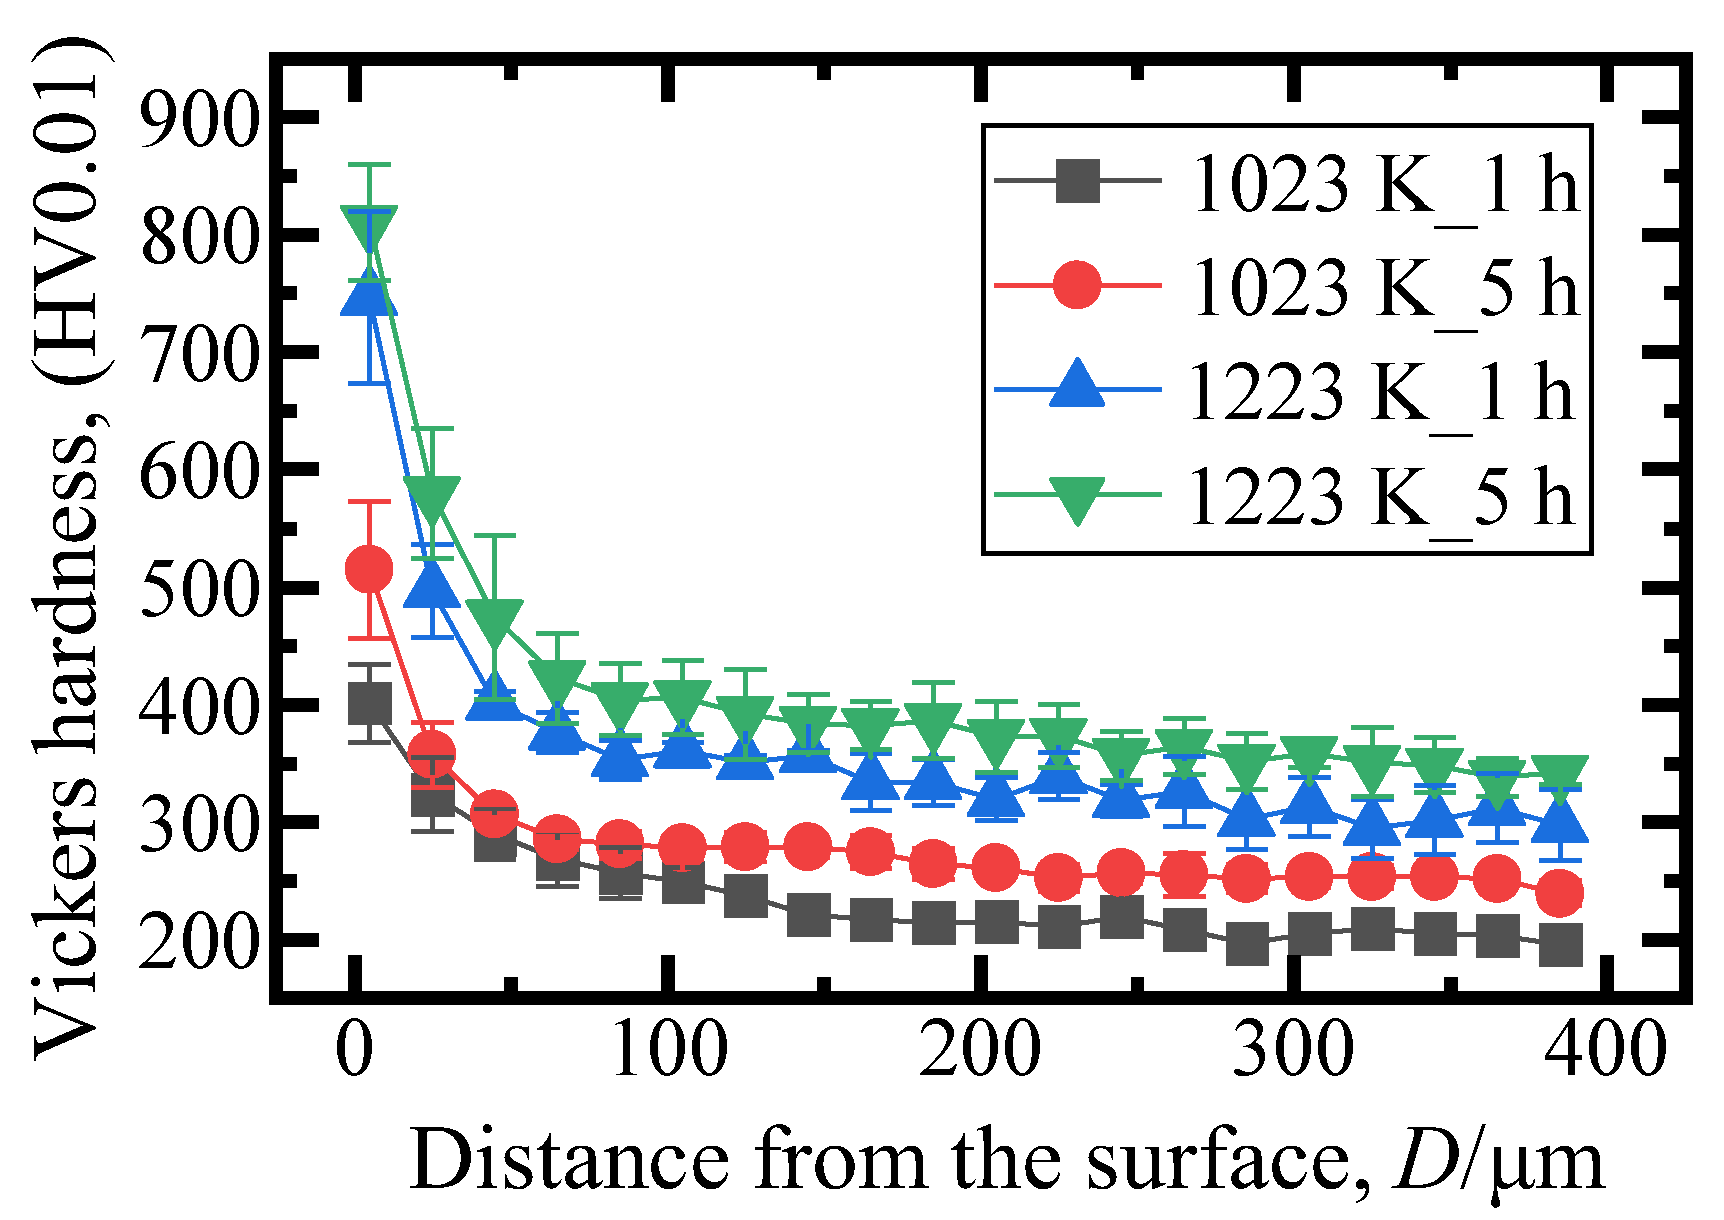
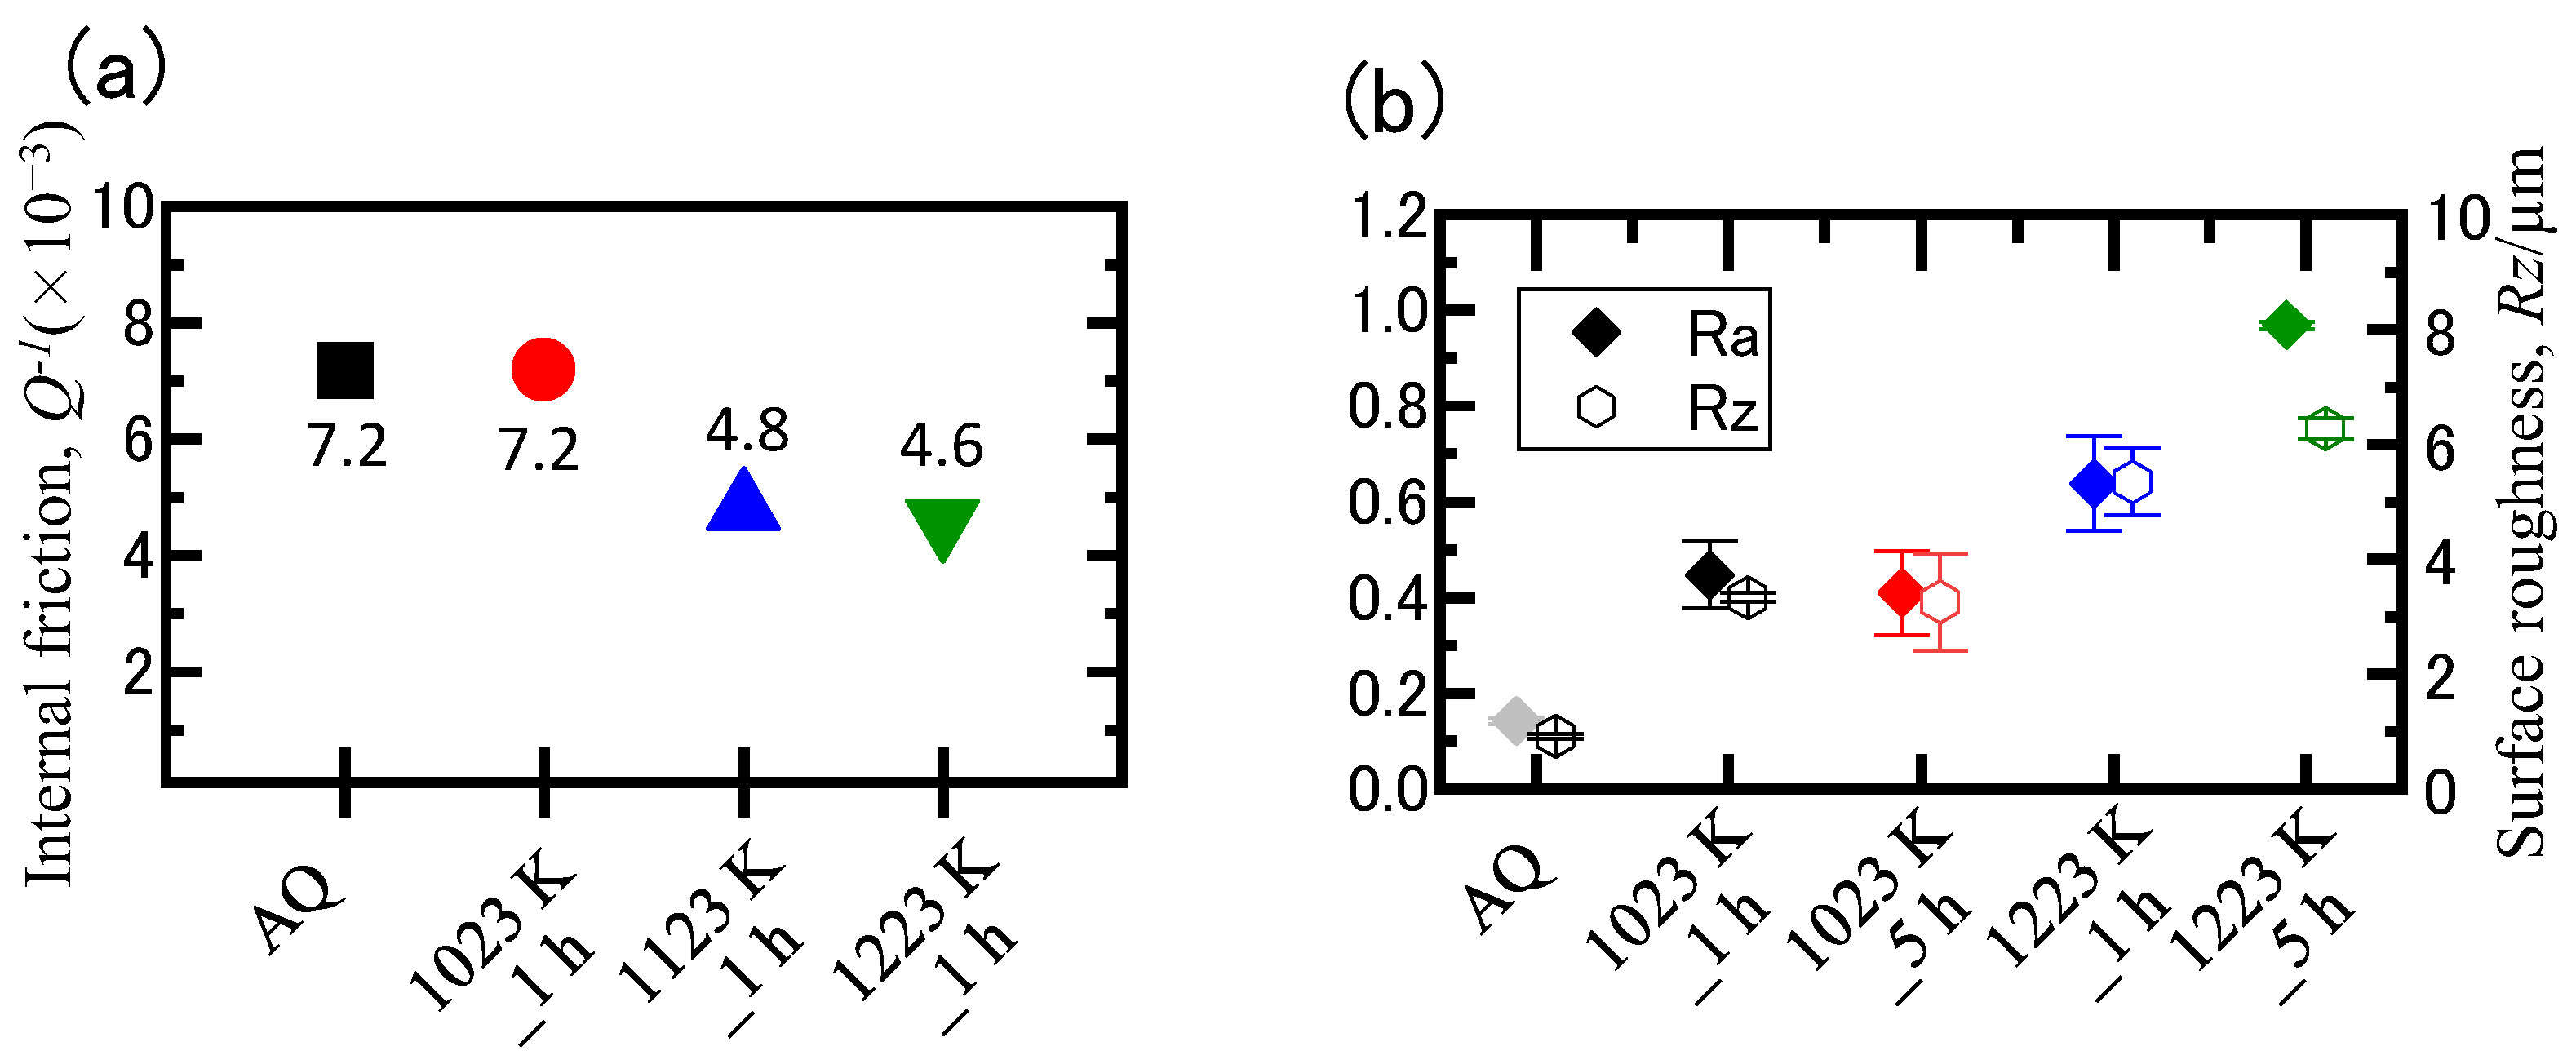
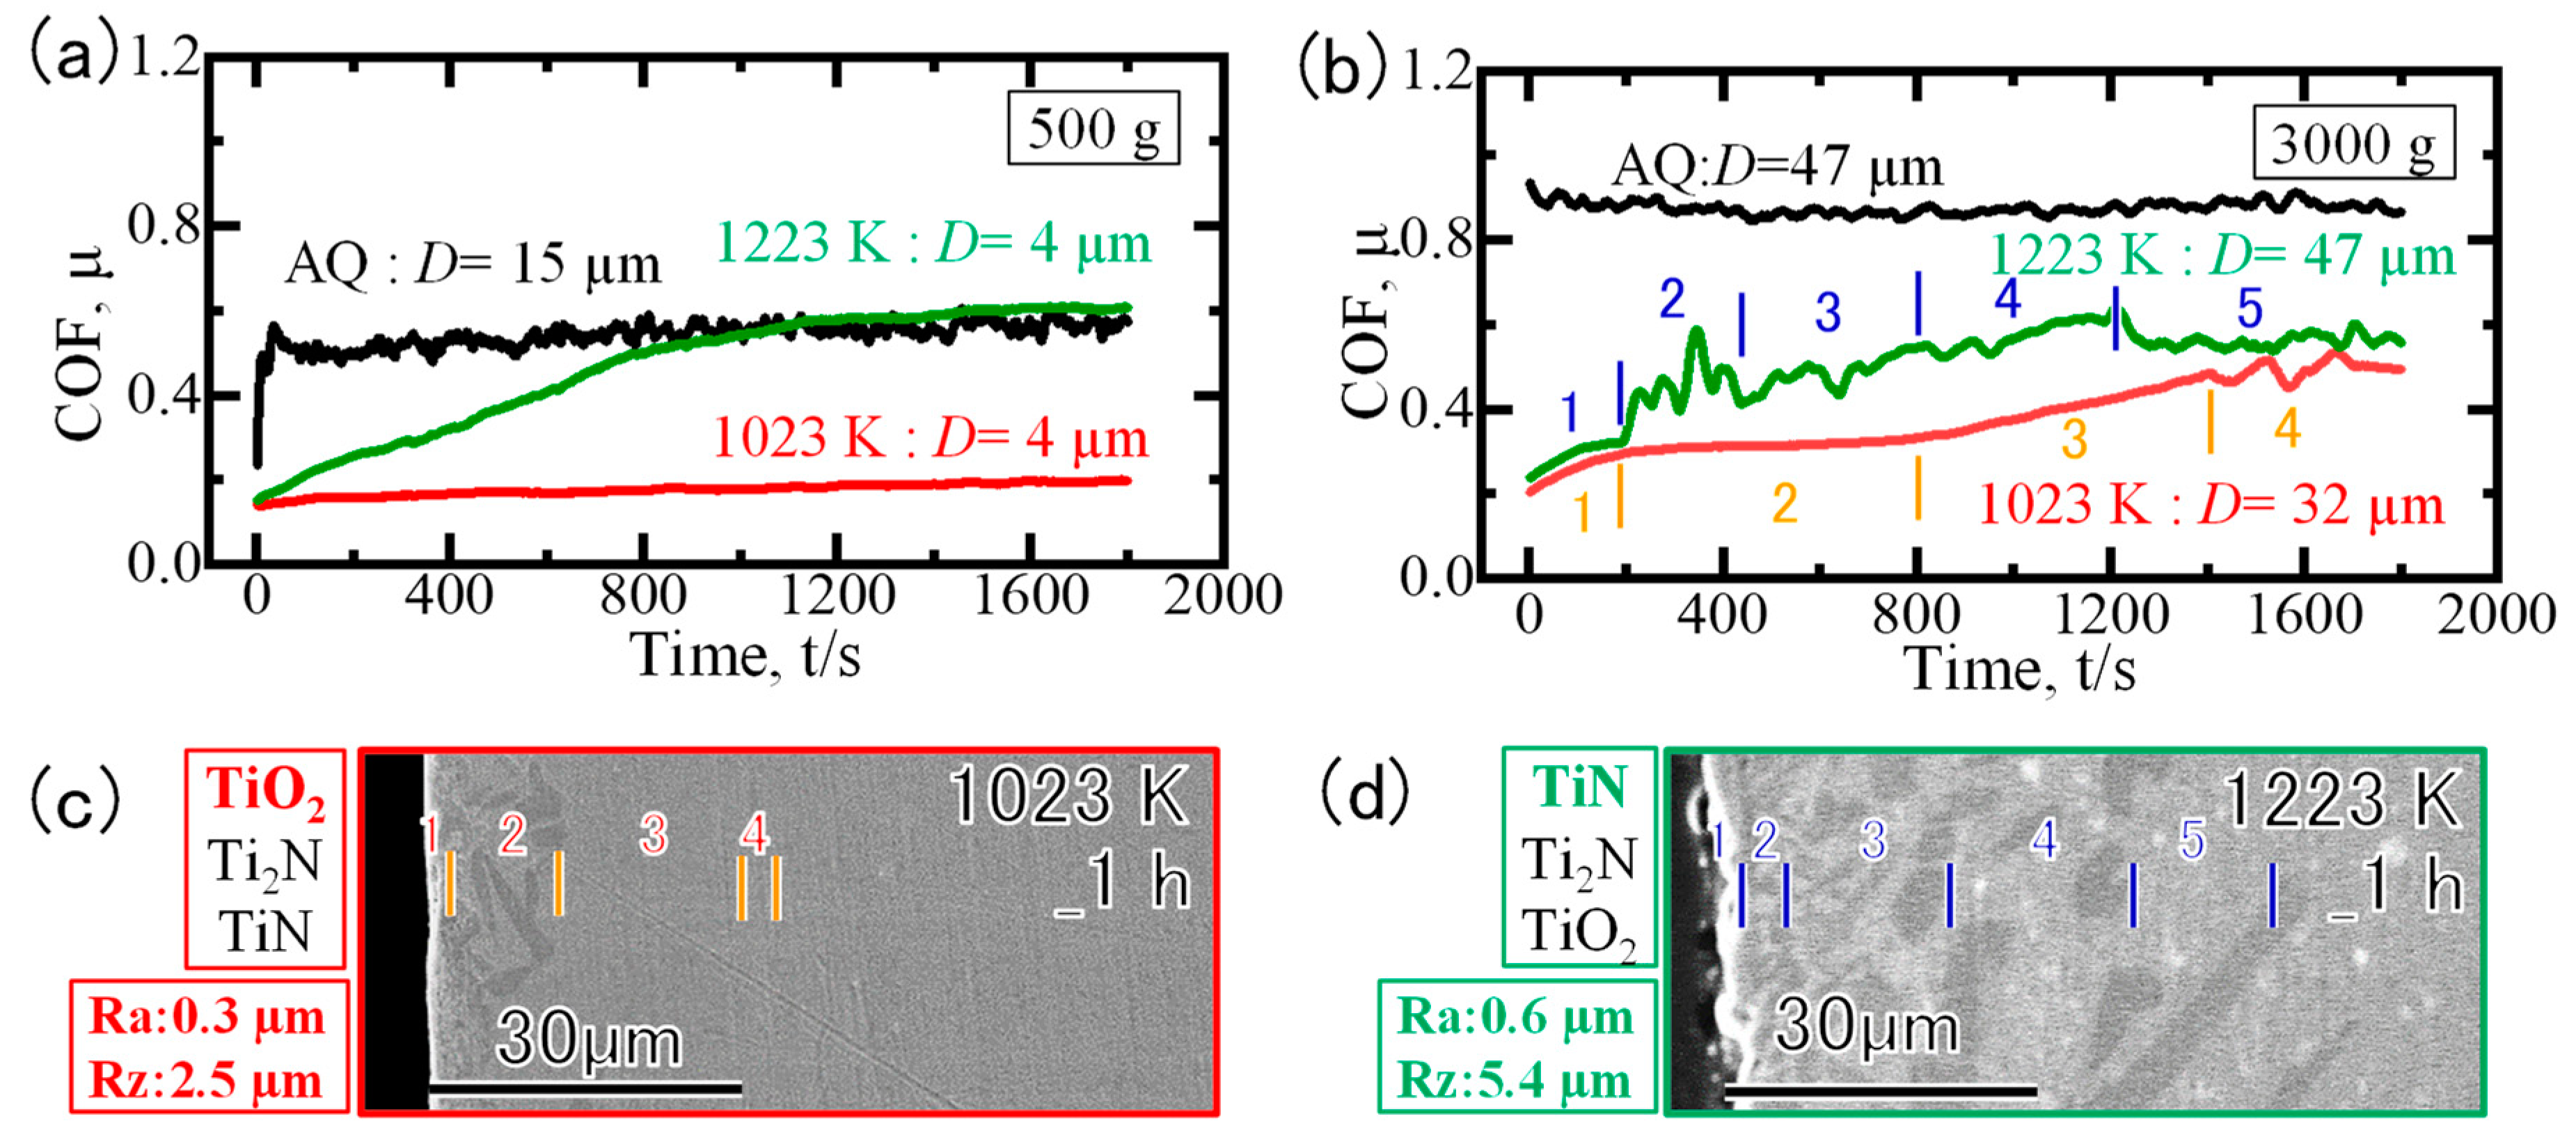
For GNQP at 1023 and 1223 K for 1 and 5 h, a N solid-solution phase of α-TiN0.3 was formed with a high gas nitriding temperature applied for a longer time. The constituent phase of the outermost surface was mainly TiO2 at 1023 K and TiN at 1223 K. As the gas nitriding temperature and time increased, the hardness of the surface and interior increased. At 1023 K, the internal friction was equivalent to that of AQ; however, at 1223 K, it decreased because of the formation of a nitrided layer. At 1223 K, both Ra and Rz were higher than those at 1023 K and increased as the reaction time was increased from 1 h to 5 h.
(2)
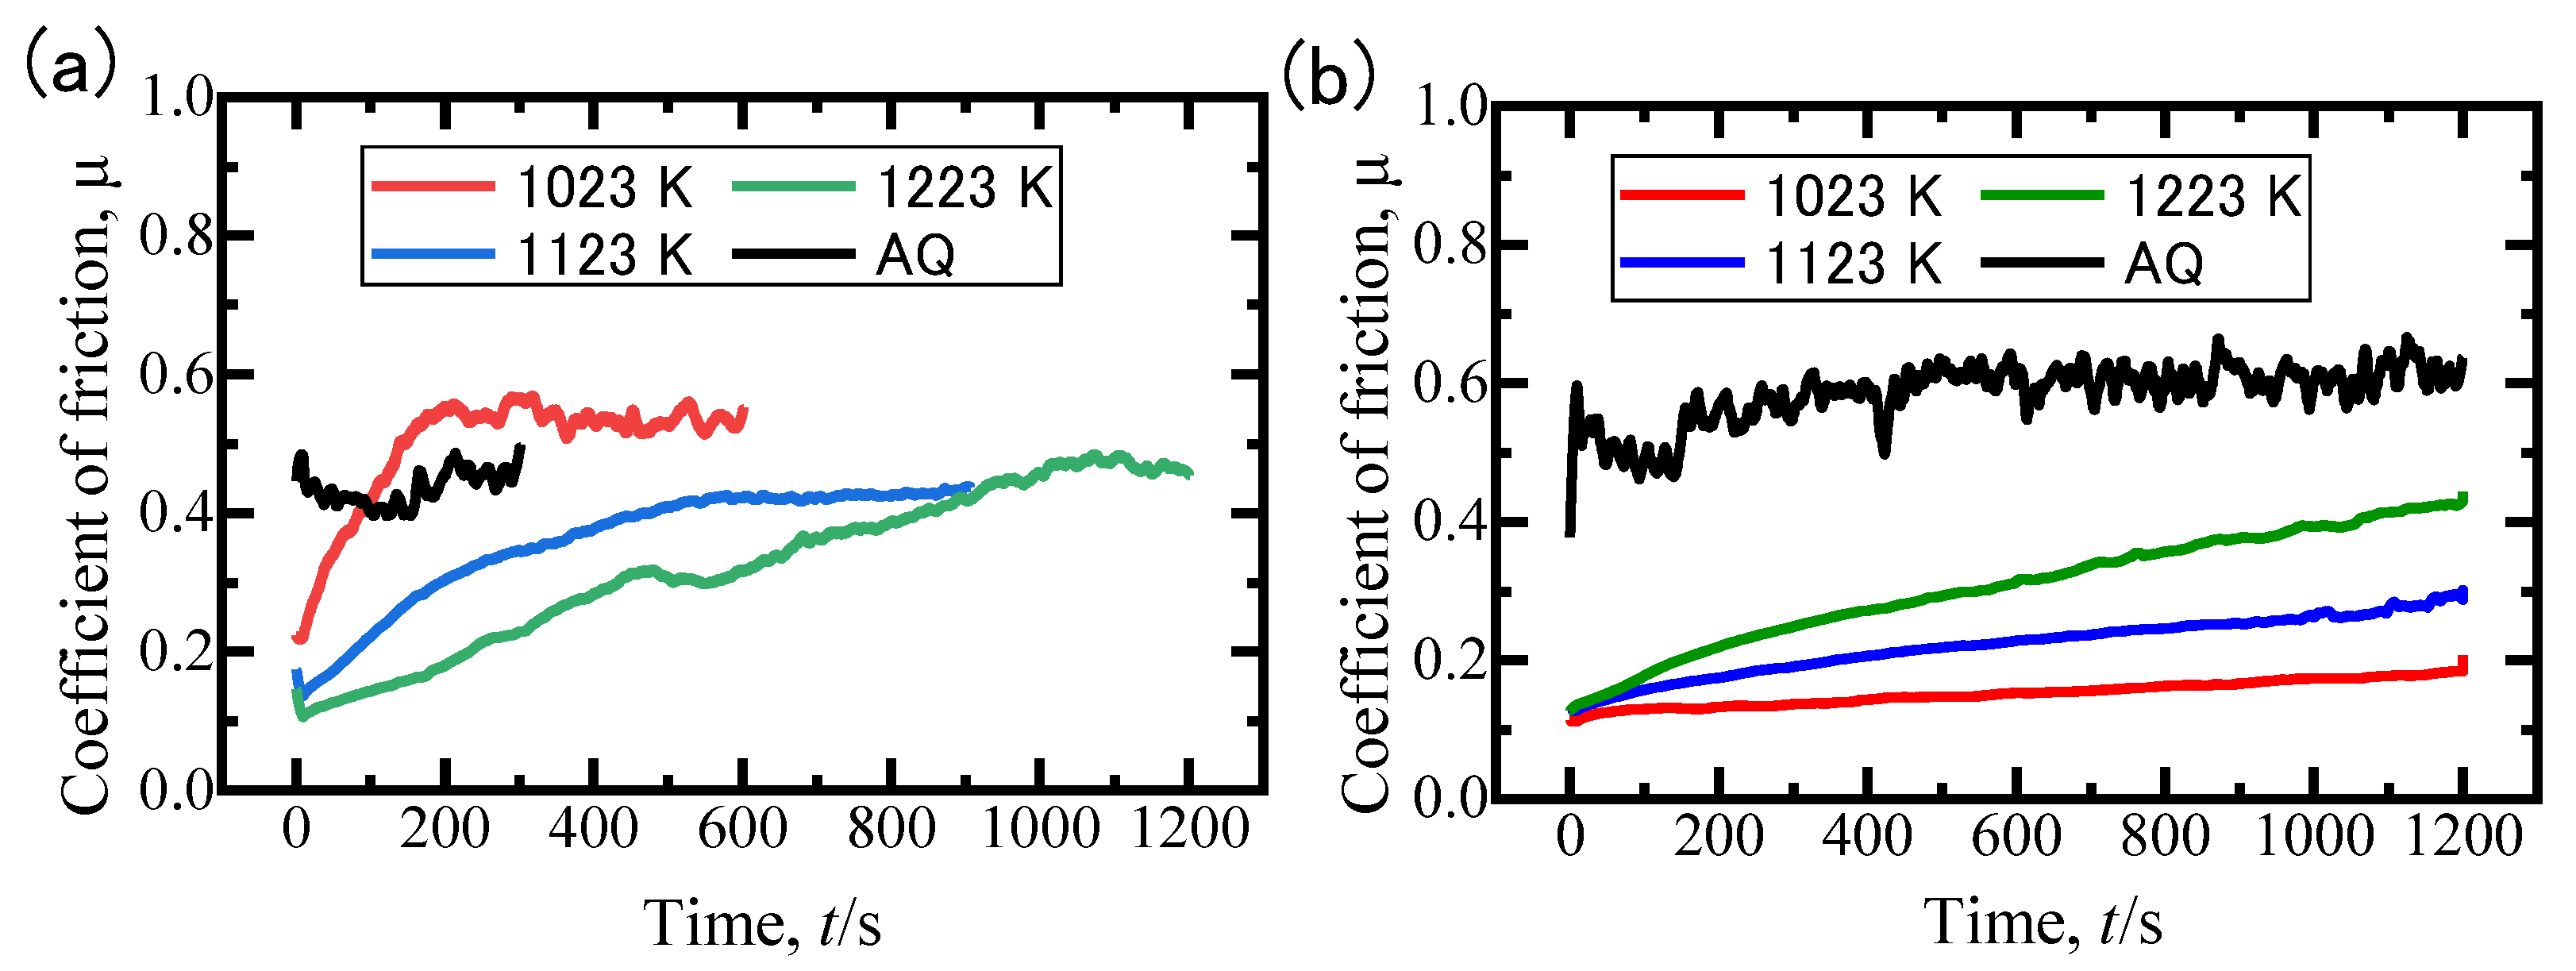
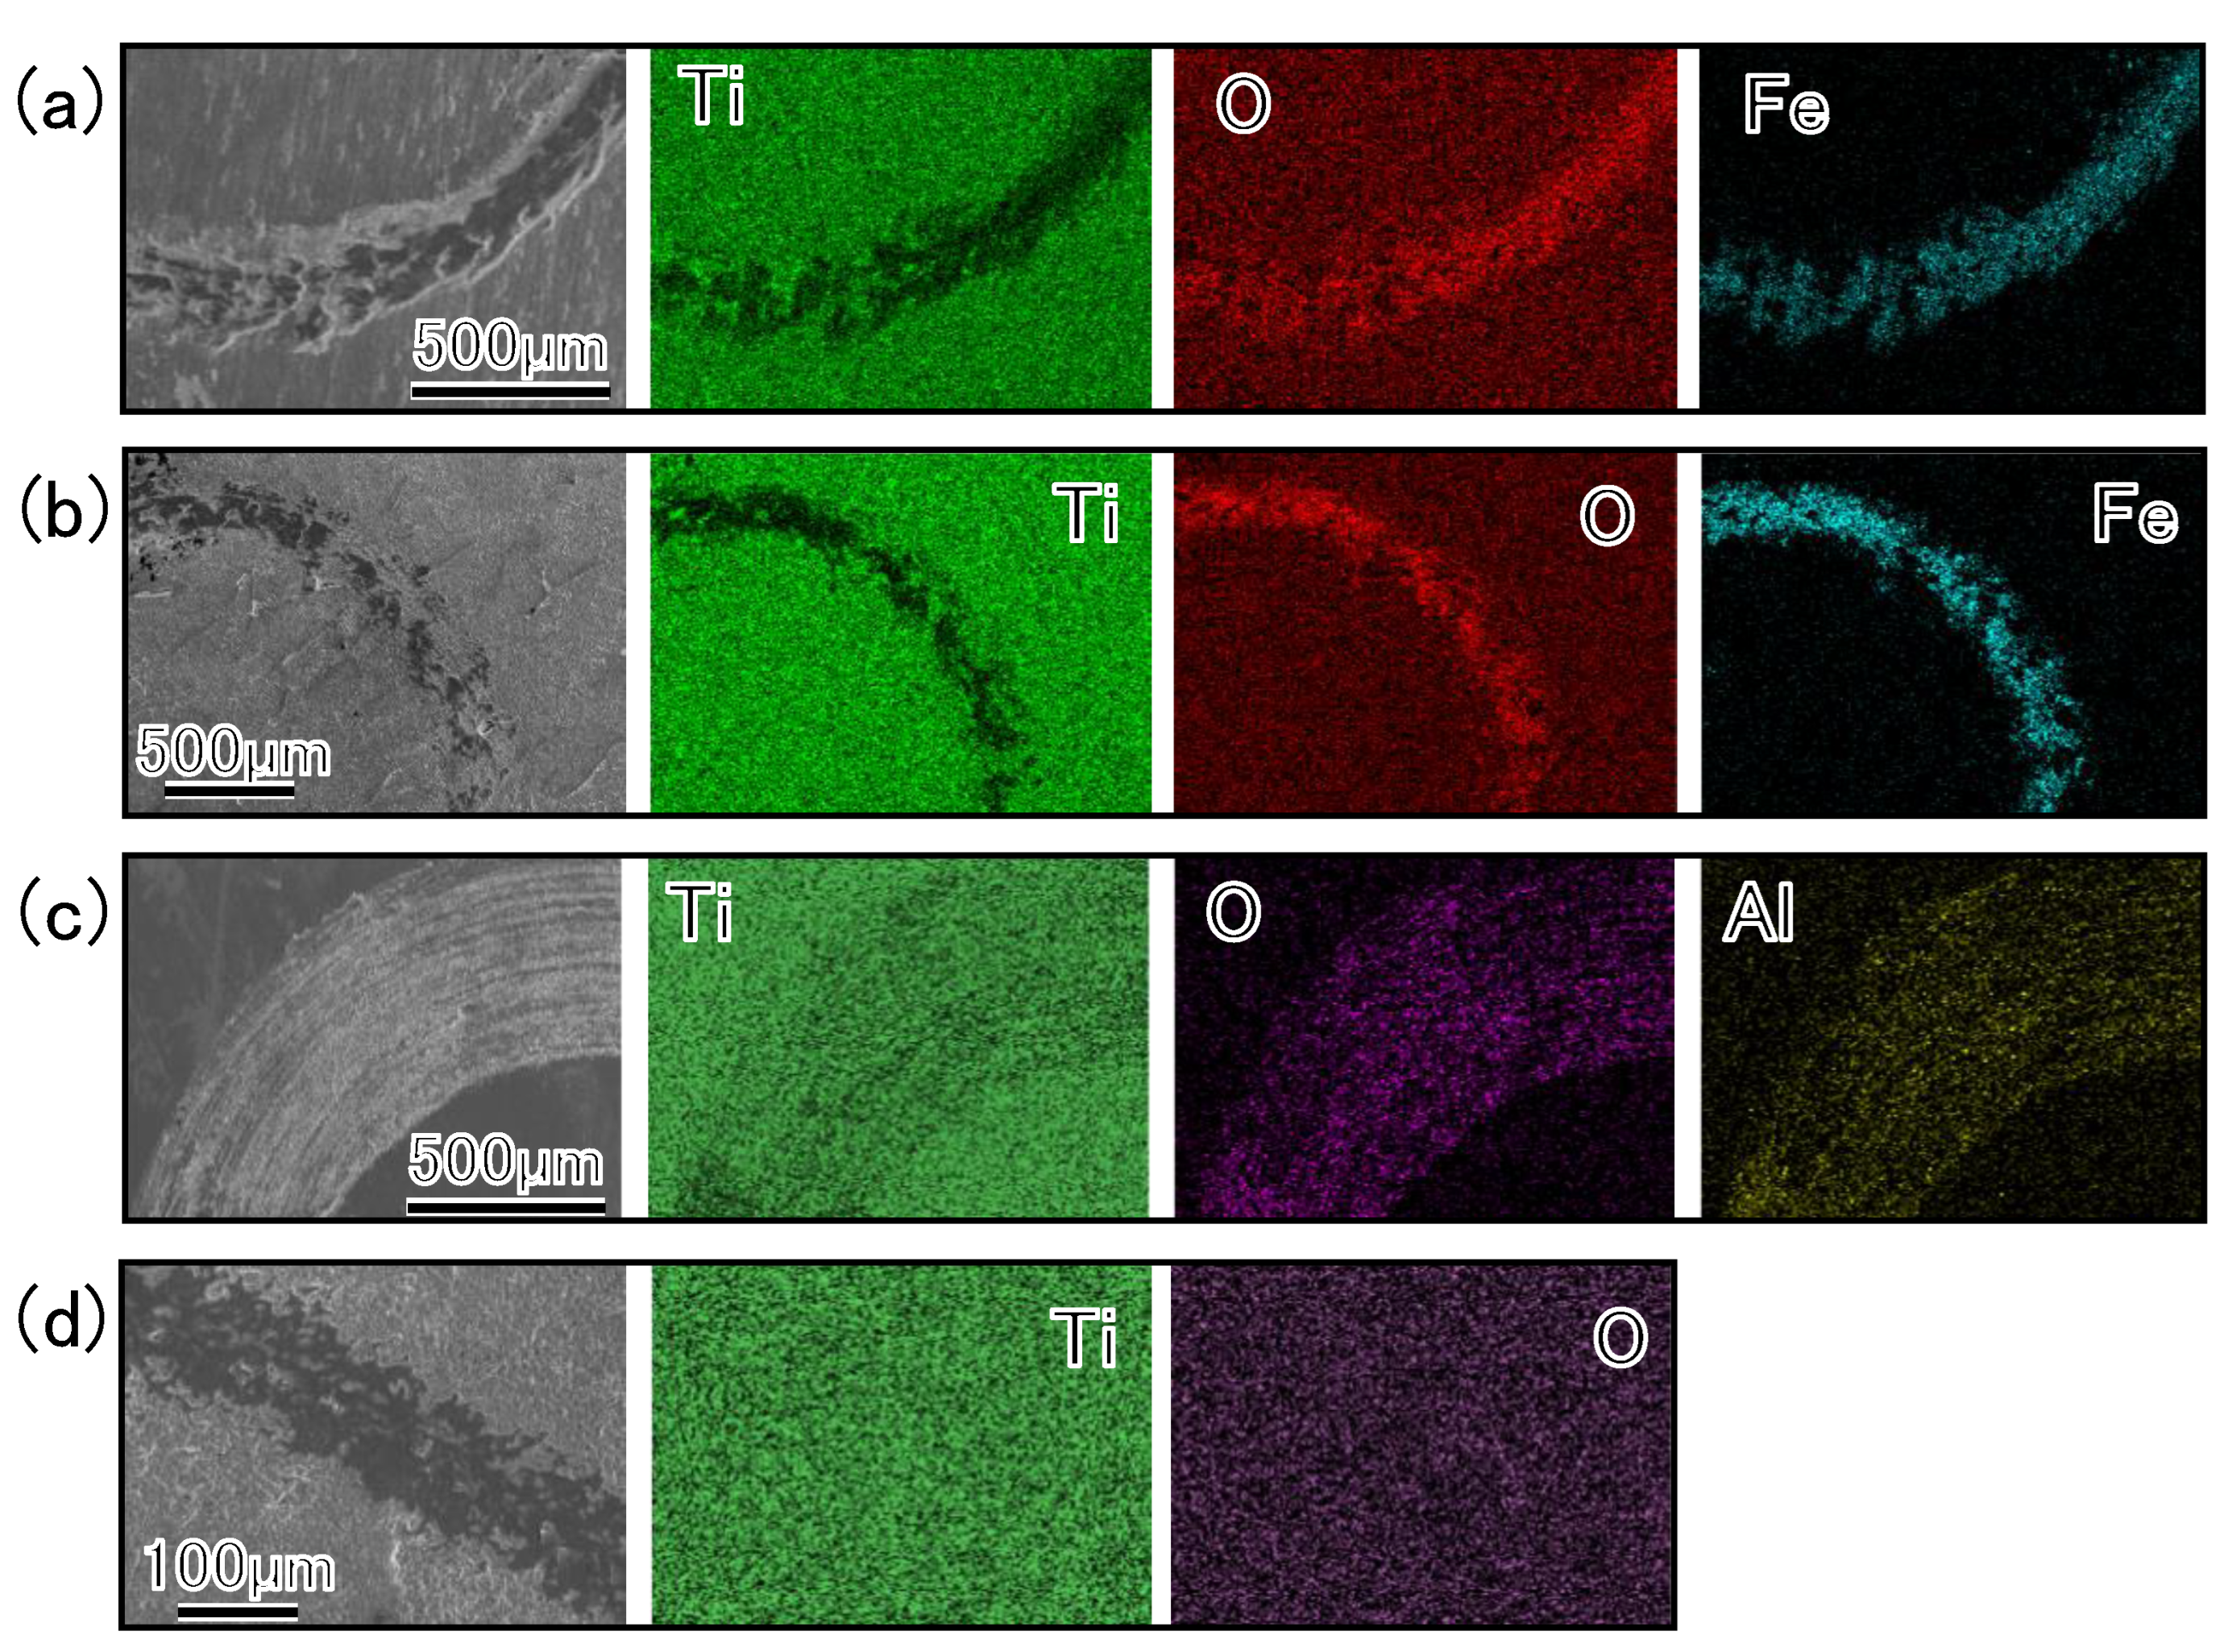
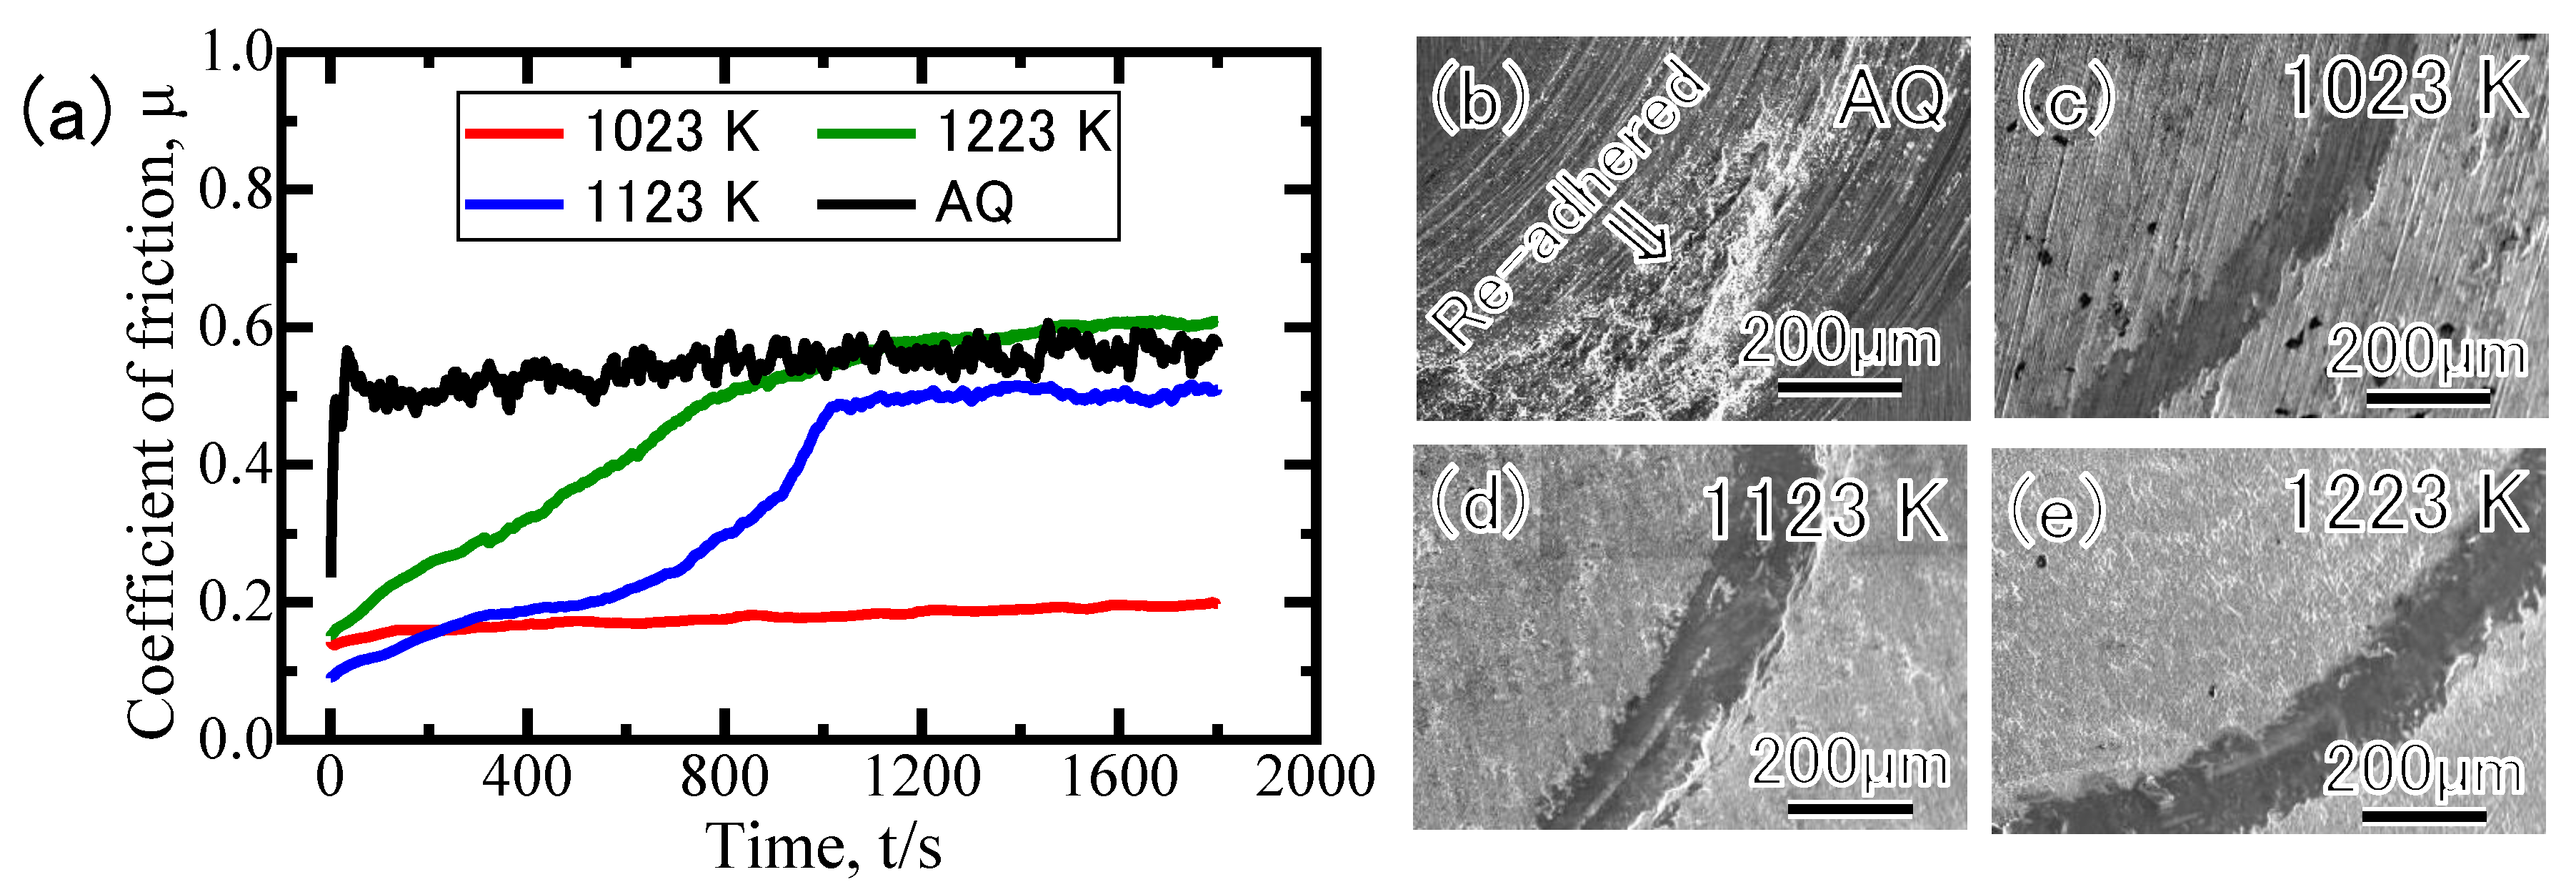
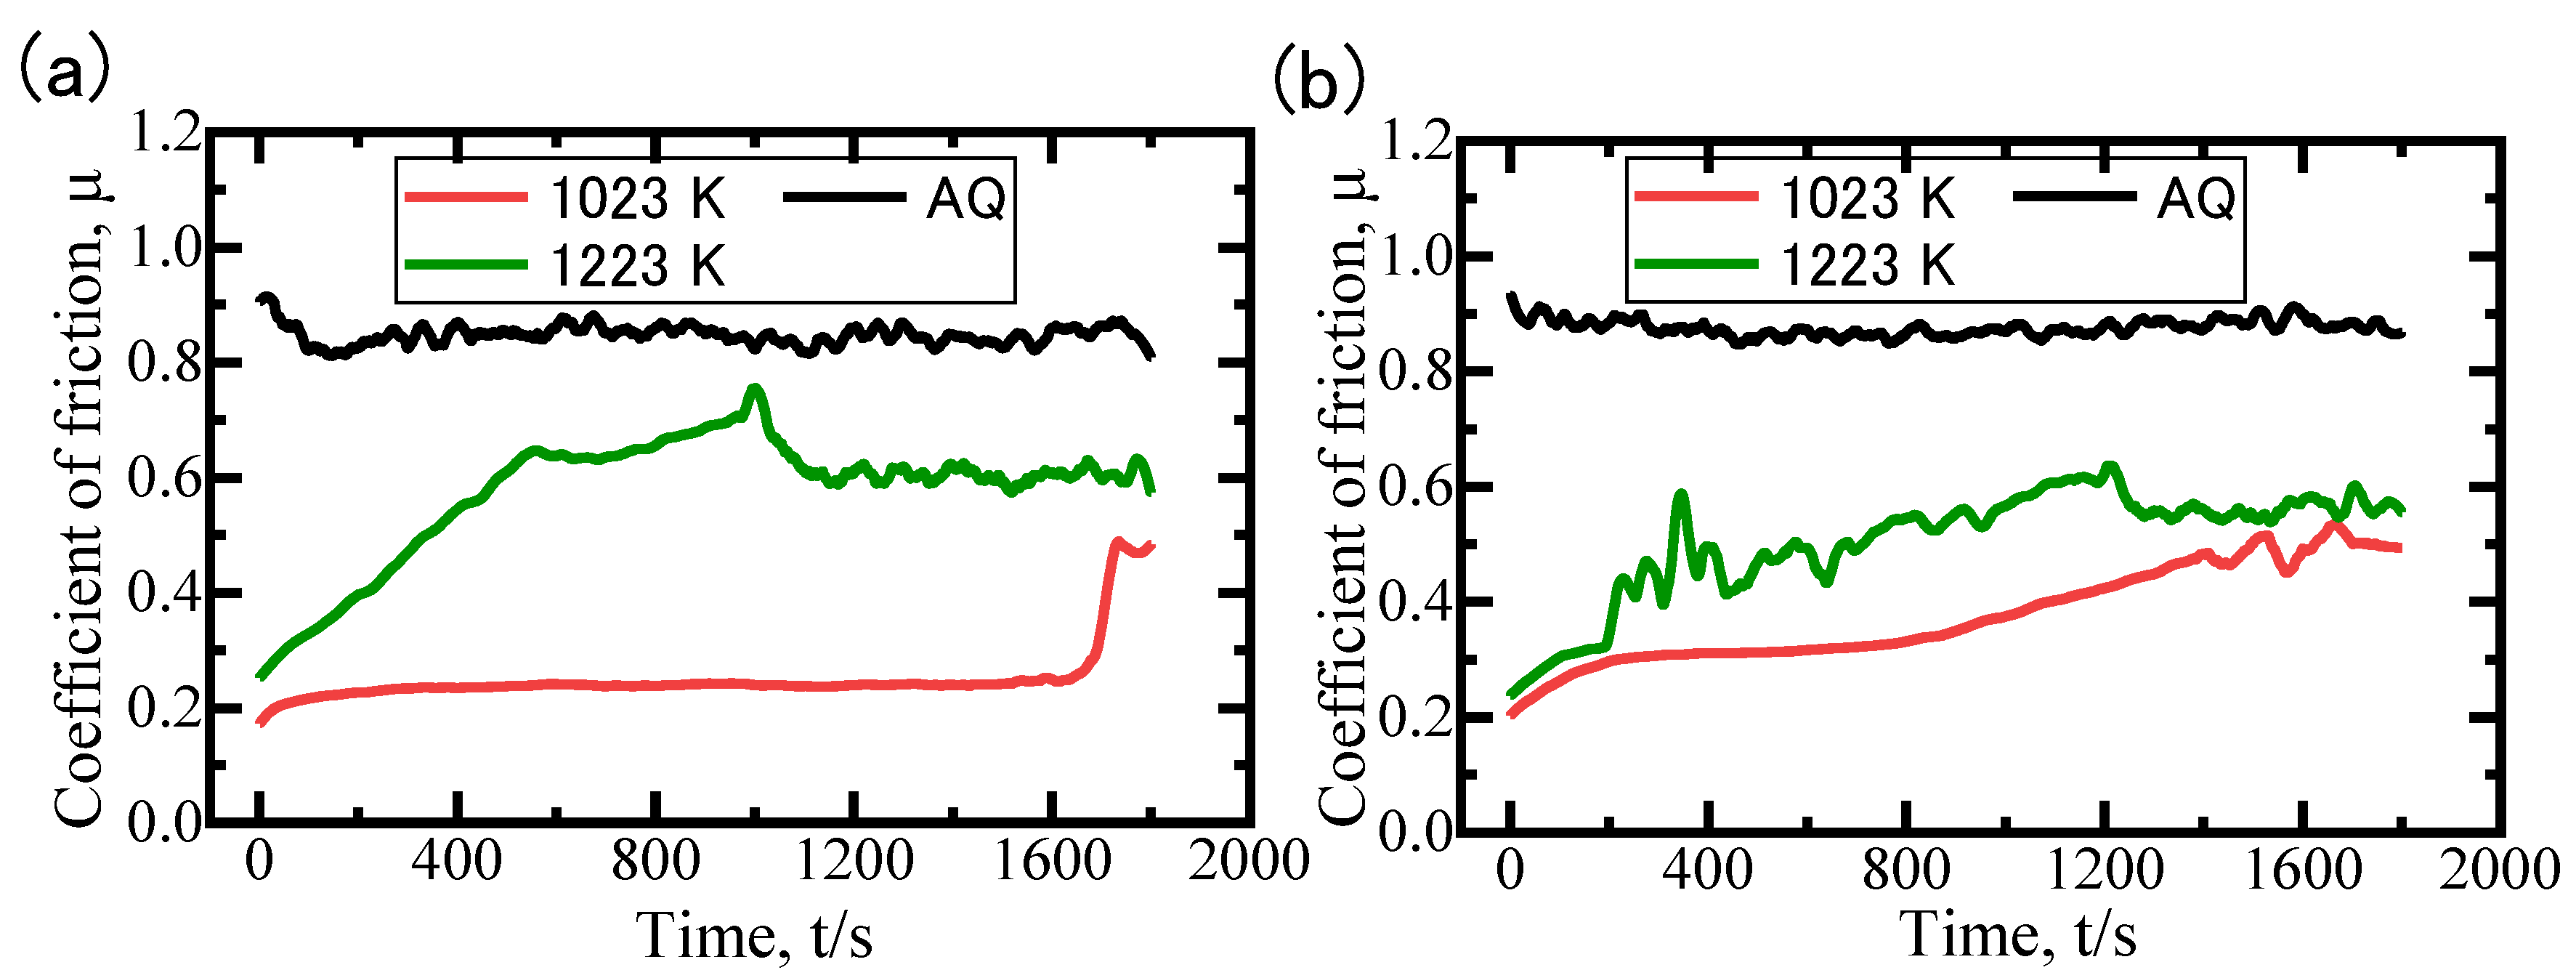
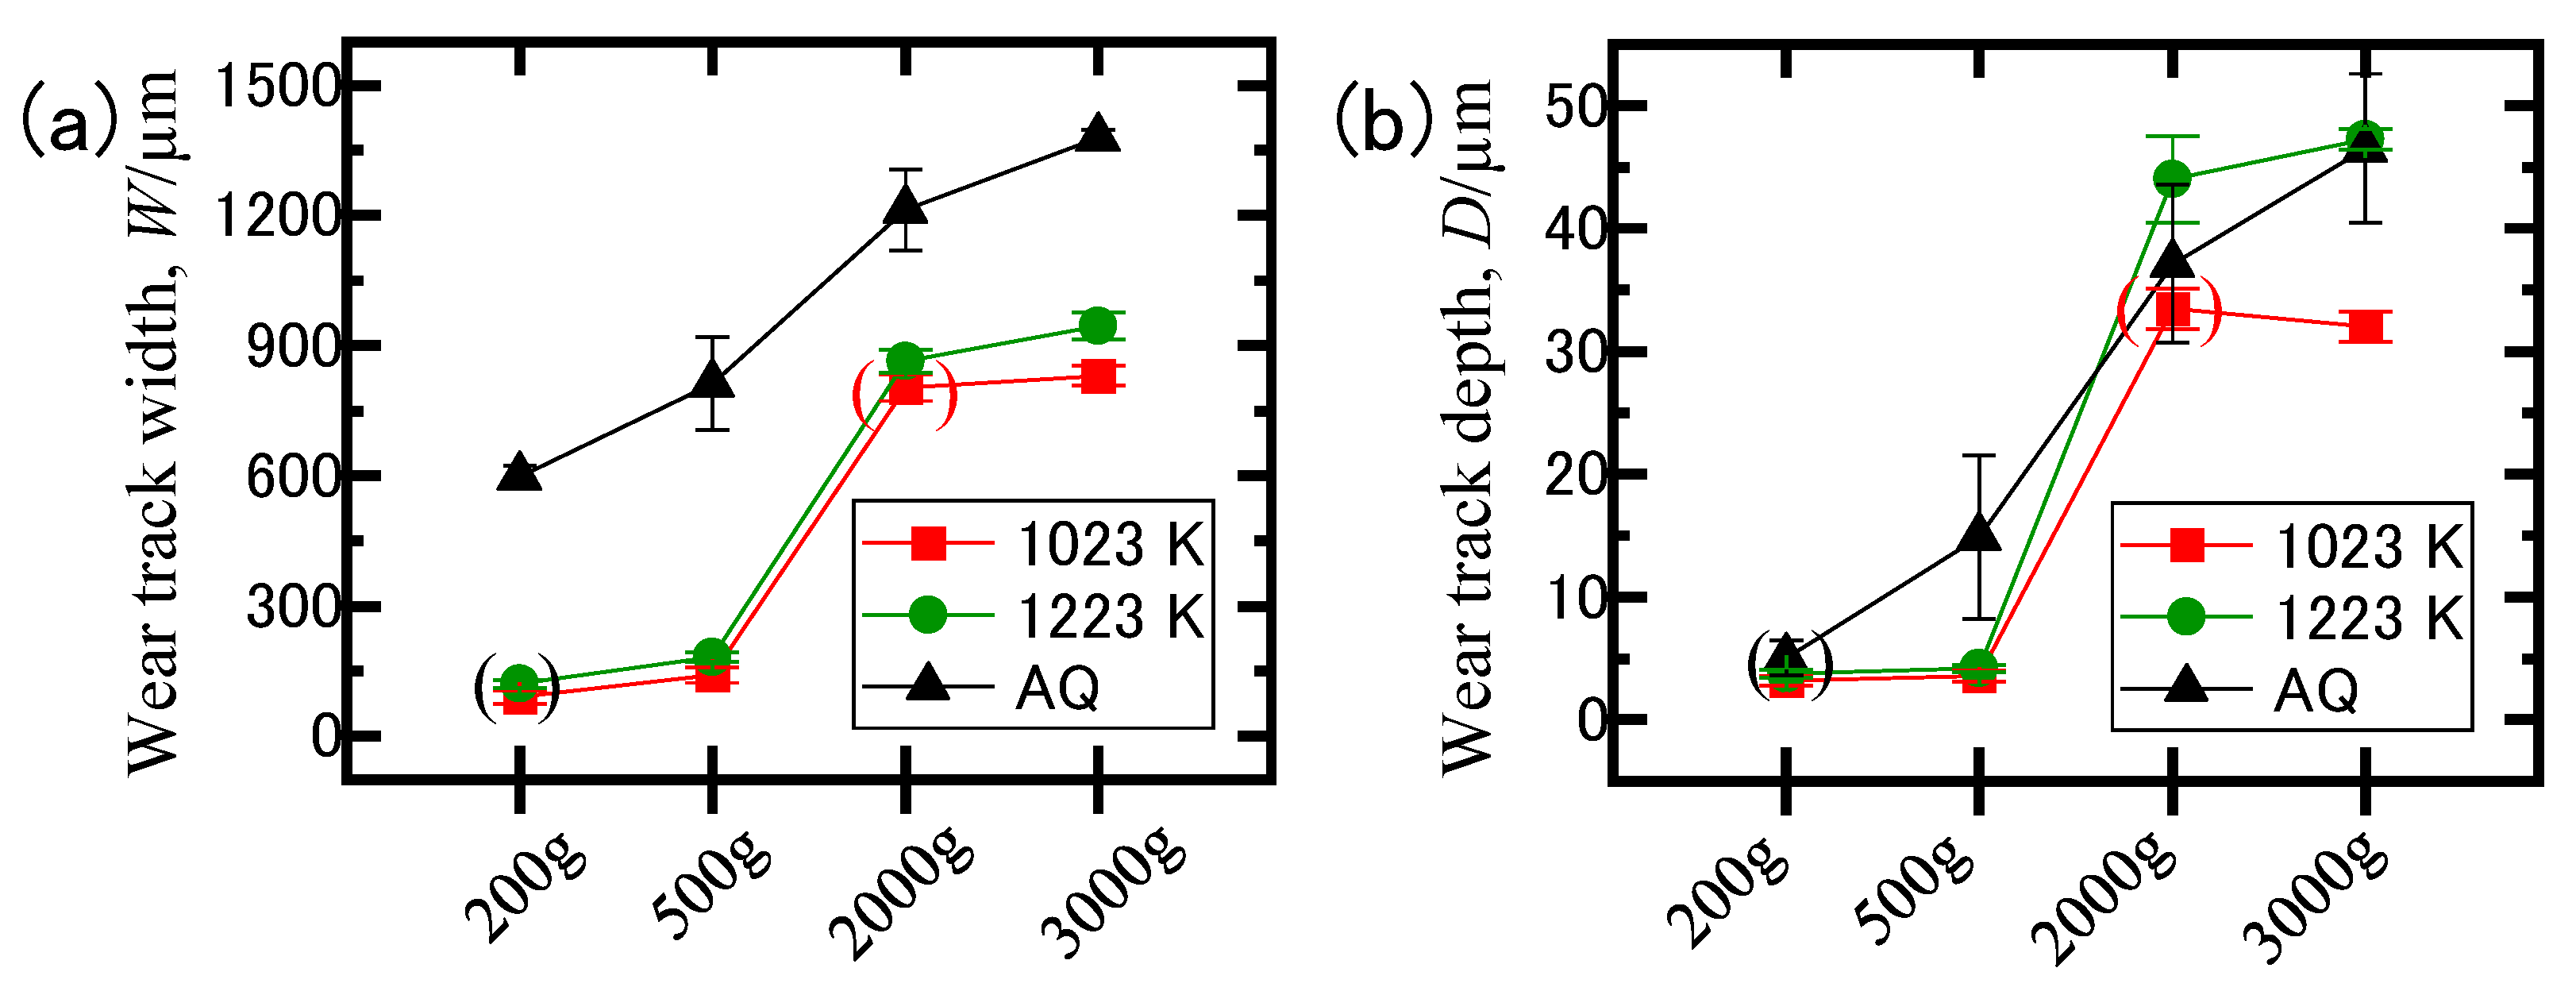
Compared with AQ, the amount of wear decreased for all GNQP specimens obtained at 1023, 1123, and 1223 K. Using different indenter materials, the steel ball adhered to the GNQP surface, whereas the alumina ball adhered to the AQ specimen and not to the GNQP surface. The change in the coefficient of friction differed between the GNQP specimens at 1023 and 1223 K, with a lower value obtained at 1023 K. Furthermore, no difference in the amount of wear was observed under a load of 500 g, whereas the GNQP specimen obtained at 1023 K exhibited less wear under a load of 3000 g.
(3)
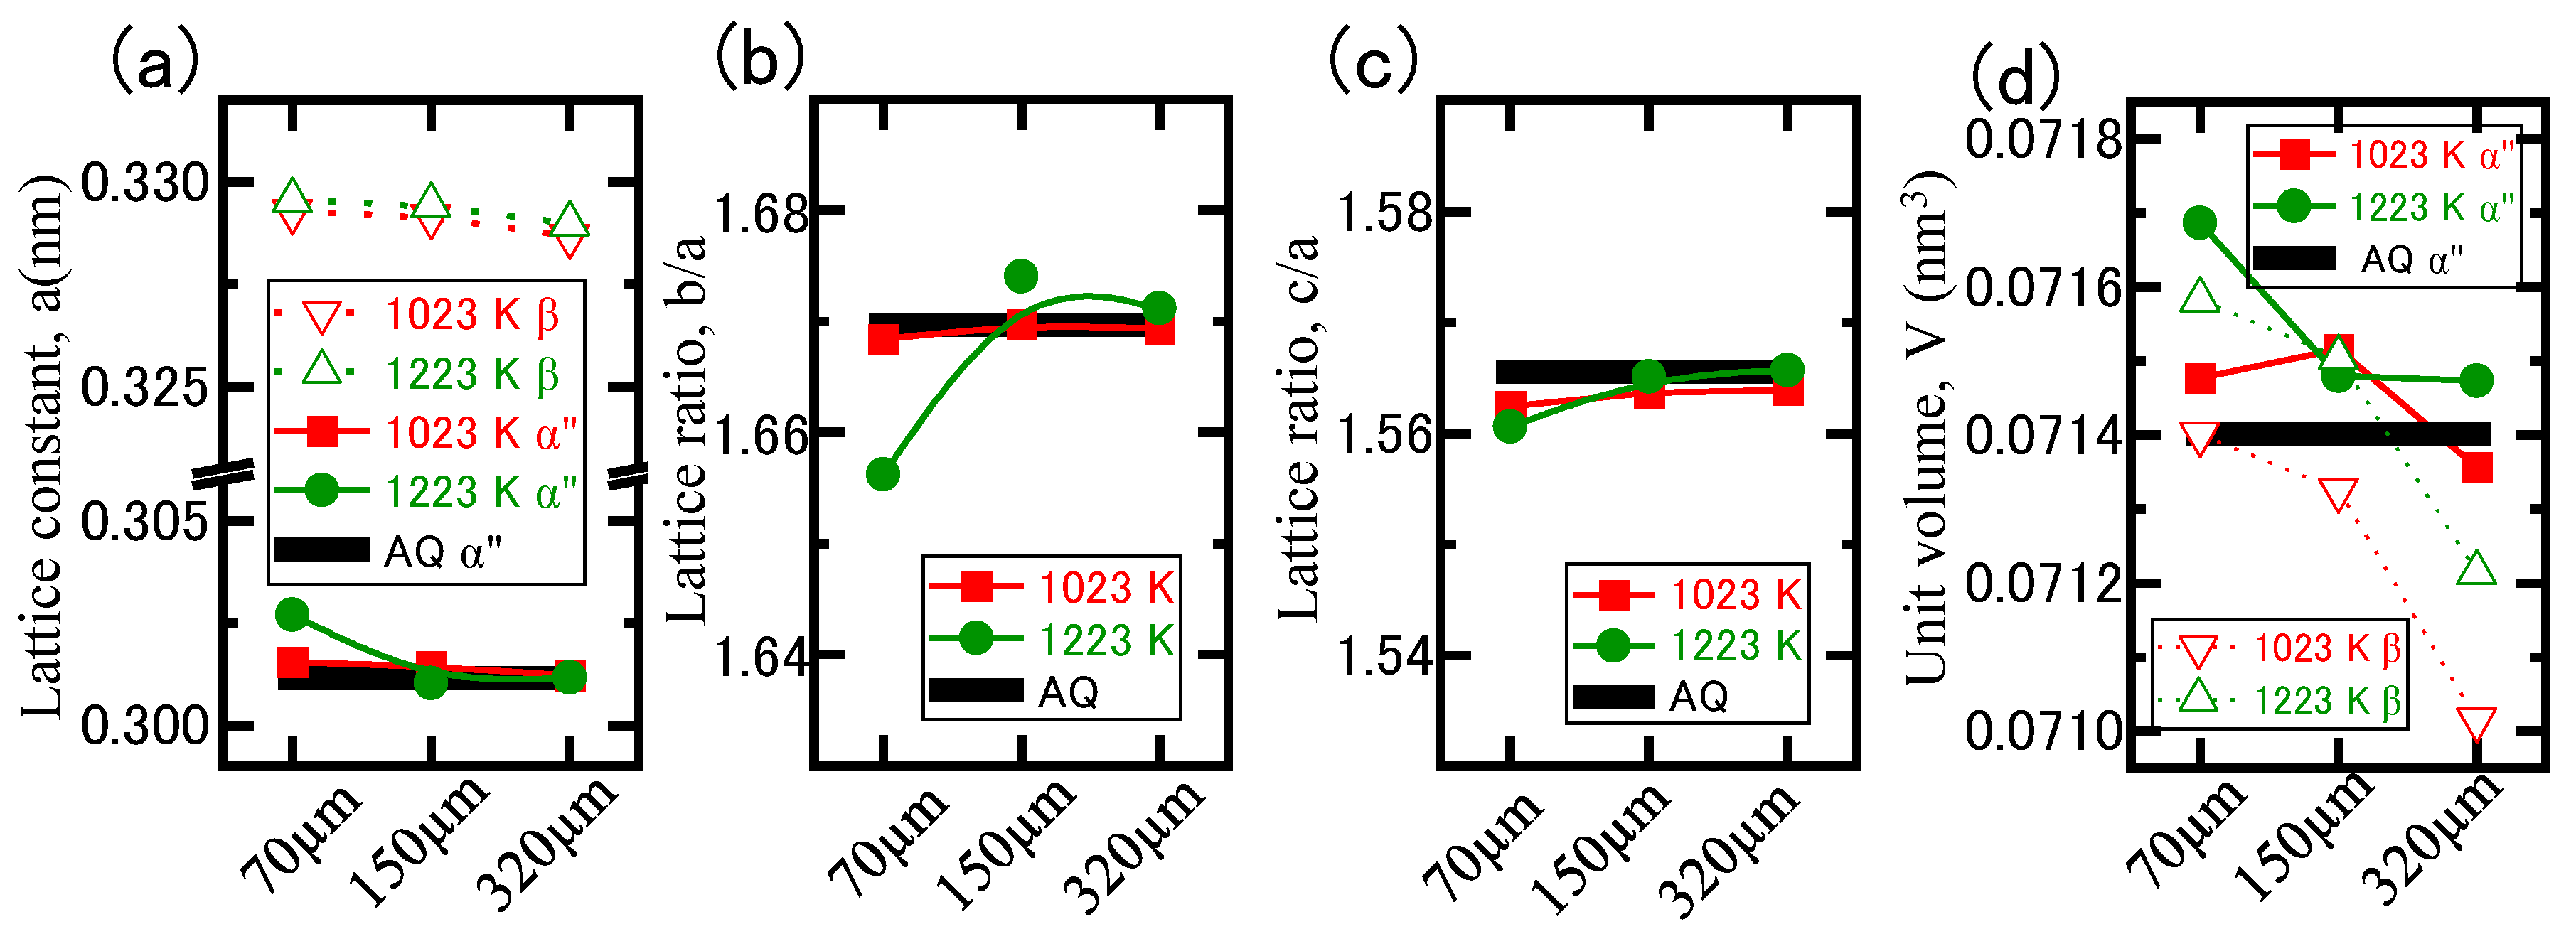
The change in the internal structure after GNQP treatment was evaluated by calculating the lattice constant and unit volume from the XRD profile. The α” martensite phase at a depth of 70 μm from the surface is thought to have expanded because of the N solid solution at 1023 and 1223 K. At a depth of 320 μm, the α” martensite phase of the GNQP specimen obtained at 1023 K was equivalent to that of the AQ specimen, which expanded at 1223 K.
(4)
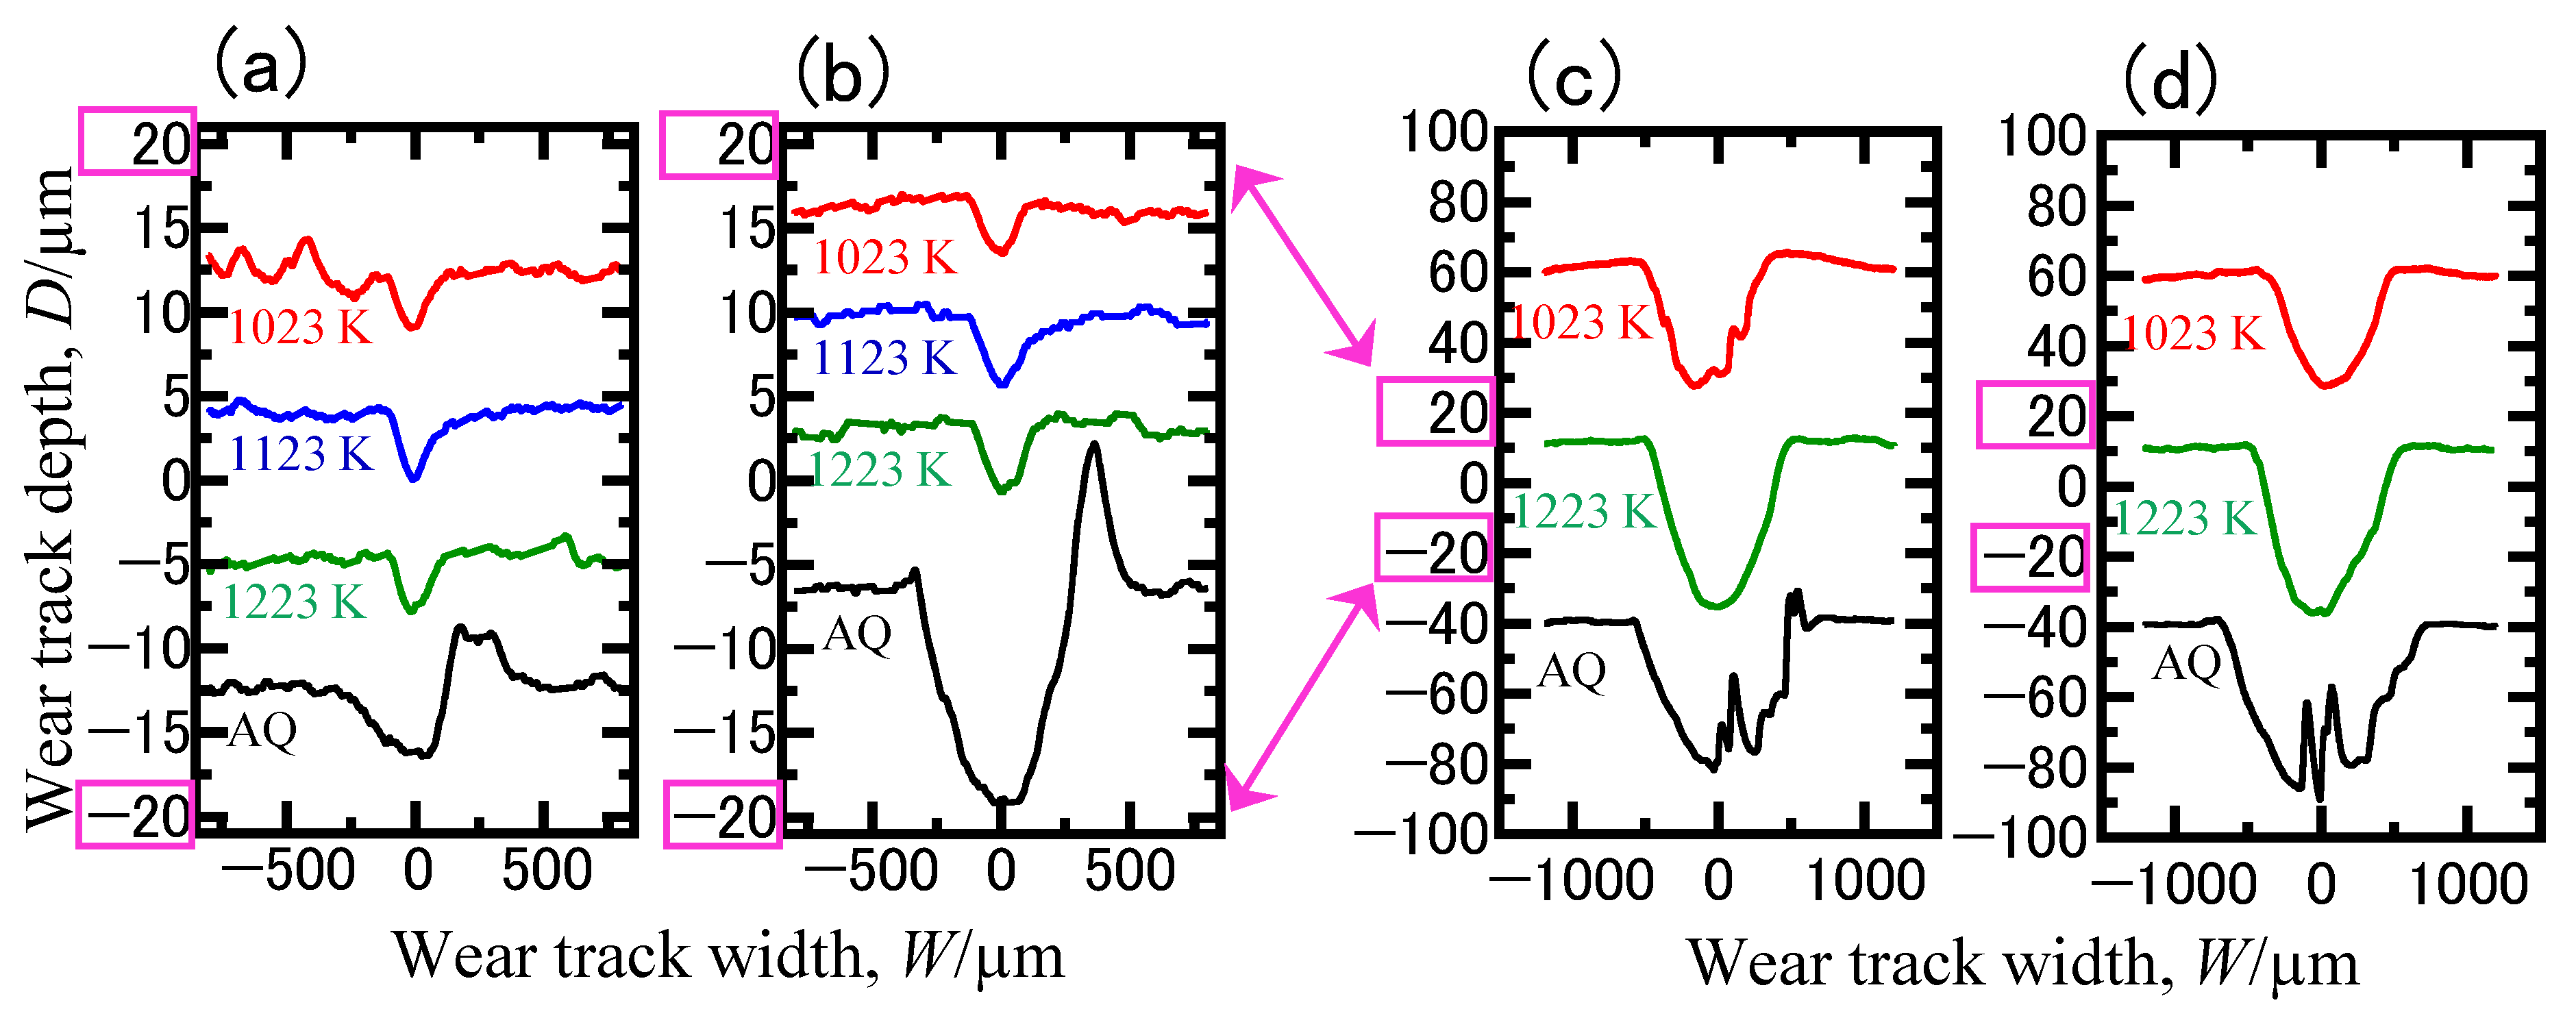
By examining the wear track depth, the surface constituent phase and surface roughness had a significant effect on the wear at a load of 500 g. However, at 3000 g, the wear track depth was smaller at 1023 K, which can be ascribed to the hardened layer at 1223 K that can be easily peeled off, and the higher damping capacity at 1023 K. From the results of this study, it is considered that GNQP at 1023 K is suitable for improving the damping capacity and wear resistance of Ti–18Nb alloy.

Author Contributions

Conceptualization, Y.M.; Investigation, Y.M., M.T. and E.A.; Methodology, Y.M., M.T., E.A. and T.H.; Validation, Y.M., M.T., E.A. and T.H.; Writing—original draft, Y.M. and M.T.; Writing—review & editing, T.H. and E.A. All authors have read and agreed to the published version of the manuscript.

Funding

This work was supported by JSPS KAKENHI (Grant Number JP21K04726), a Nagaoka University of Technology (NUT) grant for collaborative research with the National Institute of Technology (NIT) and the Light Metal Educational Foundation, Inc., Japan.

Data Availability Statement

The original contributions presented in the study are included in the article, further inquiries can be directed to the corresponding author.

Acknowledgments

The authors are grateful to Mahiro Nakano, Miyu Taniguchi and Ryo Yamada for their great support during the experiments.

Conflicts of Interest

The authors declare no conflicts of interest.

References

  1. Niinomi, M. Elemental strategy of titanium and development of titanium applications. J. JILM 2013, 63, 21–25. [Google Scholar] [CrossRef]
  2. Hagiwara, M. New evolution in titanium research and development in Japan. J. JILM 2005, 55, 532–536. [Google Scholar] [CrossRef]
  3. Oyama, H. Titanium material. J. Surf. Finish. Soc. Jpn. 2022, 73, 2–5. [Google Scholar] [CrossRef]
  4. Niinomi, M.; Akahori, T.; Nakai, M. In situ X-ray analysis of mechanism of nonlinear super elastic behavior of Ti-Nb-Ta-Zr system beta-type titanium alloy for biomedical applications. Mater. Sci. Eng. C 2008, 28, 406–413. [Google Scholar] [CrossRef]
  5. Matsumoto, H.; Watanabe, S.; Hanada, S. α′ martensite Ti-V-Sn alloys with low Young’s modulus and high strength. Mater. Sci. Eng. A 2007, 448, 39–48. [Google Scholar] [CrossRef]
  6. Bönish, M.; Calin, M.; Humbeeck, J.V.; Skrotzki, W.; Eckert, J. Factors influencing the elastic moduli, reversible strains and hysteresis loops in martensitic Ti-Nb alloys. Mater. Sci. Eng. C 2015, 48, 511–520. [Google Scholar] [CrossRef] [PubMed]
  7. Sakaguchi, N.; Niinomi, M.; Akahori, T.; Toda, H. Analysis of tensile deformation behaviors of Ti-XNb-10Ta-5Zr alloys for biomedical applications. J. Jpn Inst. Met. 2006, 70, 86–95. [Google Scholar]
  8. Inamura, T.; Fukui, Y.; Hosoda, H.; Wakashima, K.; Miyazaki, S. Relationship between texture and macroscopic transdormation strain in severely colled-rolled Ti-Nb-Al superelastic alloy. Mater. Trans. 2004, 45, 1083–1089. [Google Scholar] [CrossRef]
  9. Kuramoto, S.; Nishino, K.; Saitou, S. Multifunctional titanium alloy. J. JILM 2005, 55, 618–623. [Google Scholar] [CrossRef]
  10. Kim, H.Y.; Sasaki, T.; Okutu, K.; Kim, J.I.; Inamura, T.; Hosoda, H.; Miyazaki, S. Texture and shape memory behavior of Ti–22Nb–6Ta alloy. Acta Mater. 2006, 54, 423–433. [Google Scholar] [CrossRef]
  11. Kim, J.I.; Kim, H.Y.; Hosoda, H.; Miyazaki, S. Shape Memory Behavior of Ti-22Nb-(0.5–2.0)O(at%) Biomedical Alloys. Mater. Trans. 2005, 46, 852–857. [Google Scholar] [CrossRef]
  12. Kim, H.Y.; Ikehara, Y.; Kim, J.I.; Hosoda, H.; Miyazaki, S. Martensitic transformation, shape memory effect and superelasticity of Ti–Nb binary alloys. Acta Mater. 2006, 54, 2419–2429. [Google Scholar] [CrossRef]
  13. Kim, H.Y.; Hashimoto, S.; Kim, J.I.; Hosoda, H.; Miyazaki, S. Mechanical Properties and Shape Memory Behavior of Ti-Nb Alloys. Mater. Trans. 2004, 45, 2443–2448. [Google Scholar] [CrossRef]
  14. Sugimoto, K. Towards the development and popularization of new damping alloys. Kinzoku 2001, 71, 142–149. [Google Scholar]
  15. Sugimoto, T.; Ikeda, M.; Komatsu, S.; Kamei, K. Relation between heat treatments and mechanical properties of Ti-6Al-2Sn-4Zr-6Mo alloy. J. Jpn. Soc. Heat Treat. 1989, 29, 191–197. [Google Scholar]
  16. Sugimoto, T.; Ikeda, M.; Komatsu, S. Properties and structure control of α+β titanium alloys. Mater. Jpn. 1998, 37, 27–30. [Google Scholar] [CrossRef]
  17. Mantani, Y.; Takemoto, Y. Change in crystal structure and material properties with deformation of quenched martensite in Ti-Nb alloys. J. Jpn. Inst. Met. Mater. 2015, 79, 461–467. [Google Scholar] [CrossRef]
  18. Mantani, Y.; Takemoto, Y. Structural changes due to heating and stress loading of metastable quenched martensite structures in Ti–(10–20) mass% Nb alloys. Mater. Trans. 2023, 64, 78–85. [Google Scholar] [CrossRef]
  19. Wu, W.; Xie, G.; Sun, L.; Yang, Y.; Hong, H.; Zhang, S.; Li, D. A study on adsorption, dissociation, penetration, and diffusion of nitrogen on and in α-Ti via First-principles calculations. Vacuum 2024, 221, 112856. [Google Scholar] [CrossRef]
  20. Mantani, Y.; Tsumura, T.; Nakata, K. Effect of α’ martensite structure of Ti-15Nb alloy on material properties and its surface hardening treatment by plasma nitriding. J. Jpn. Soc. Heat Treat. 2012, 52, 263–268. [Google Scholar]
  21. Mantani, Y.; Shimada, K.; Eguchi, N. Microstructure and material Properties of Ti-15mass%Nb alloy after gas nitriding and quenching process. Crystals 2020, 10, 1156. [Google Scholar] [CrossRef]
  22. Tisov, O.; Łępicka, M.; Tsybrii, Y.; Yurchuk, A.; Kindrachuk, M.; Dukhota, O. Duplex Aging and Gas Nitriding Process as a Method of Surface Modification of Titanium Alloys for Aircraft Applications. Metals 2022, 12, 100. [Google Scholar] [CrossRef]
  23. Toh, W.Q.; Wang, P.; Tan, X.; Nai, M.L.S.; Liu, E.; Tor, S.B. Microstructure and Wear Properties of Electron Beam Melted Ti-6Al-4V Parts: A Comparison Study against As-Cast Form. Metals 2016, 6, 284. [Google Scholar] [CrossRef]
  24. Zhao, X.; Xue, G.; Liu, Y. Dry Sliding Tribological Behavior of TC11 Titanium Alloy Subjected to the Ultrasonic Impacting and Rolling Process. Metals 2018, 8, 13. [Google Scholar] [CrossRef]
  25. Liu, Z.; Ji, F.; Wang, M.; Zhu, T. Study on the Tribological Properties of Porous Titanium Sliding against Tungsten Carbide YG6. Metals 2017, 7, 28. [Google Scholar] [CrossRef]
  26. Hoja, S.; Birjandi, B.K.; Hasselbruch, H.; Epp, J. An Investigation into the Wear Behavior of Martensitically Transformed Nitrided Layers. Lubricants 2023, 11, 481. [Google Scholar] [CrossRef]
  27. Lavrys, S.; Pohrelyuk, I.; Tkachuk, O.; Padgurskas, J.; Trush, V.; Proskurnyak, R. Comparison of Friction Behaviour of Titanium Grade 2 after Non-Contact Boriding in Oxygen-Containing Medium with Gas Nitriding. Coatings 2023, 13, 282. [Google Scholar] [CrossRef]
  28. Matijosius, T.; Pohrelyuk, I.; Lavrys, S.; Staisiunas, L.; Selskiene, A.; Sticinskaite, A.; Rageliene, L.; Smailys, A.; Andriusis, A.; Padgurskas, J. Wear resistance and antibacterial properties of 3D-printed Ti6Al4V alloy after gas nitriding. Tribol. Int. 2024, 197, 109839. [Google Scholar] [CrossRef]
  29. Nakai, M.; Niinomi, M.; Akahori, T.; Ohtsu, N.; Ogawa, M.; Nishimura, H.; Toda, H.; Fukui, H.; Ogawa, M. Surface hardening of biomedical Ti-29Nb-13Ta-4.6Zr and Ti-6Al-4V ELI by gas nitriding. Mater. Sci. Eng. A 2008, 486, 193–201. [Google Scholar] [CrossRef]
Figure 1. Schematic of the experimental method. (a) Schematic of the GNQP. (b) Wear tracks after friction and wear tests. Yellow arrows in (b) indicate the wear truck radius r = 1 mm.
Metals 14 00944 g001
Figure 2. Cross-sectional SEM microstructure of GNQP under different conditions: (a) at 1023 K for 1 h, (b) at 1023 K for 5 h, (c) at 1223 K for 1 h, and (d) at 1223 K for 5 h.
Metals 14 00944 g002
Figure 3. Cross-sectional SEM–EDS results after GNQP at 1223 K for 5 h: (a) microstructure, and distribution of (b) Nb, (c) O, and (d) N. (e) is enlarged structure of (a).
Metals 14 00944 g003
Figure 4. Micro Vickers hardness distribution with respect to the depth from the GNQP surface.
Metals 14 00944 g004
Figure 5. XRD profile based on polishing depth of the specimen obtained (a) at 1023 K for 5 h and (b) 1223 K for 5 h.
Metals 14 00944 g005
Figure 6. Variations in material properties after GNQP: (a) internal friction Q−1 and (b) surface roughness Ra and Rz.
Metals 14 00944 g006
Figure 7. Change in the coefficient of friction for each specimen with a load of 200 g applied up to 1200 s: (a) steel-ball indenter and (b) alumina-ball indenter.
Metals 14 00944 g007
Figure 8. SEM–EDS observation results of the wear tracks under different conditions: (a) GNQP at 1023 K and using a steel ball, (b) GNQP at 1223 K and using a steel ball, (c) AQ and using an alumina ball, and (d) GNQP at 1223 K using an alumina ball.
Metals 14 00944 g008
Figure 9. Friction wear test results for each specimen up to 1800 s with a load of 500 g. (a) Change in the coefficient of friction. Wear tracks of (b) the AQ specimen, and GNQP specimens obtained at (c) 1023 K, (d) 1123 K, and (e) 1223 K.
Metals 14 00944 g009
Figure 10. Coefficient of friction using an alumina indenter for up to 1800 s with the loads of (a) 2000 g and (b) 3000 g.
Metals 14 00944 g010
Figure 11. Cross-sectional morphology of the wear tracks measured using a laser-displacement meter at the load of (a) 200 g, (b) 500 g, (c) 2000 g, and (d) 3000 g. Pink boxes and arrows indicate the same value position.
Metals 14 00944 g011
Figure 12. Changes in the wear track with the applied load: (a) width and (b) depth.
Metals 14 00944 g012
Figure 13. Changes in the structure of quenched α″ martensite and β phase with the depth after GNQP. (a) Lattice constant a, (b) lattice ratio b/a, (c) lattice ratio c/a, and (d) unit volume of orthorhombic conversion. The thick black lines in each figure indicate the AQ values of the same alloy [19].
Metals 14 00944 g013
Figure 14. Schematic of the changes in the coefficient of friction and wear track depth: coefficient of friction and wear track depth at (a) 500 g and (b) 3000 g, and surface condition and SEM microstructure at (c) 1023 K and (d) 1223 K. The numbers 1–5 in (bd) of the same color indicate the same wear truck depth.
Metals 14 00944 g014
Table 1. List of heat-treatment conditions and experiments for each specimen.
AQGas Nitriding and Quenching Process (GNQP)
1023 K_1 h1023 K_5 h1123 K_1 h1223 K_1 h1223 K_5 h
Cross section hardness
Cross section SEM
X-ray diffraction
Internal friction
Suraface roughness
Friction wear test
Table 2. Elemental analysis results of points ①–④ in Figure 3a.
mass%at.%
TiNbNOTiNbNO
84.36.88.10.971.53.023.42.2
71.427.90.781.316.42.3
83.314.22.584.07.48.6
80.020.088.611.4
Disclaimer/Publisher’s Note: The statements, opinions and data contained in all publications are solely those of the individual author(s) and contributor(s) and not of MDPI and/or the editor(s). MDPI and/or the editor(s) disclaim responsibility for any injury to people or property resulting from any ideas, methods, instructions or products referred to in the content.

