Article

Influence of Non-Metallic Inclusions on Very High-Cycle Fatigue Performance of High-Strength Steels and Interpretation via Crystal Plasticity Finite Element Method

1
Standards & Metrology Research Institute, China Academy of Railway Sciences Corporation Limited, Beijing 100010, China
2
College of Civil Engineering, Yancheng Institute of Technology, Yancheng 224051, China
3
College of Civil Engineering, Nanjing Tech University, Nanjing 211816, China
*
Author to whom correspondence should be addressed.
Metals 2024, 14(8), 948; https://doi.org/10.3390/met14080948 (registering DOI)
Submission received: 6 June 2024 / Revised: 12 August 2024 / Accepted: 13 August 2024 / Published: 21 August 2024

Abstract

:
The fatigue behaviors of high-strength bearing steel were investigated with rotating bending fatigue loading with a frequency of 52.5 Hz. It was revealed that the high-strength steel tended to initiate at interior non-metallic inclusions in a very high-cycle fatigue regime. During fractography observation, it was also seen that the inclusion acting as a failure-originating site was seldom smaller than 10 μm. Moreover, prior austenite grains could also act as the originating source of failure when inclusion was absent. The crystal plasticity finite element method (CPFEM) was adopted to simulate the residual stress distribution around non-metallic inclusions of different sizes under different loading amplitudes. The accumulated plastic strain around the inclusion suggested that the existence of inclusion may reduce material strength and lead to more fatigue damage. The value of accumulated plastic strain around different inclusion sizes also resembled the crack nucleation or propagation of the materials. The simulation results also indicated that inclusions smaller than 5 μm had little influence on fatigue lifetimes, while inclusions larger than 10 μm had a significant influence on fatigue lifetimes.

1. Introduction

For many industrial engineering structures, such as railway wheels, gearboxes, crankshafts, and pipelines, the fatigue strength of material rather than the yield strength is a much more important consideration factor during design. The fatigue lifetimes of metallic materials could be affected by many factors, such as the surface treatment, residual stresses, environments, and defects, while the predominating detrimental factor is attributed to inclusions, which are also the main reason accounting for the great range of fatigue lifetimes in experimental studies and industrial failures [1,2,3]. During deoxidation and solidification processes, calcium aluminate, silicate, titanium nitride, and manganese sulphone are the most common inclusion defects. The inclusions introduced during metallurgical processes can change the local microstructure and cause premature cracks in the matrix, which decreases the fatigue lifetimes significantly [4,5]. Thus, to ensure the structural integrity assessment and reliability evaluation of engineering components, it is crucial to decrease the inclusion sizes and understand the damage mechanism around inclusions.
To clarify the influences of inclusion on fatigue performances, numerous studies have been conducted. In the early 1990s, a model was proposed by Murakami et al. [6] to predict fatigue limits by correlating them with inclusion sizes and matrix hardness. Through many case studies, an empirical formula was established wherein the fatigue limits were inversely proportional to the inclusion sizes to the −1/6th power [7], which was confirmed by Furuya et al. [8] in very high-cycle fatigue regimes. Lu et al. [9] investigated the influence factors of non-metallic inclusion on S-N curve characteristics for GCr15 bearing steels with a very high-cycle fatigue regime and explained the range of fatigue lifetimes from the aspect of inclusion sizes. Zhao et al. [10,11] investigated the fatigue strength of bearing steel (GCr15) with four different heat treatment conditions, indicating that specimens with higher strength would continue to break beyond 107 cycles, and interior inclusions mainly account for the crack-initiation source.
Many studies have been performed to find the maximum inclusion size of specimens. Fan et al. [12] studied the fatigue failures of carburized 12Cr2Ni alloy steel and estimated the maximum inclusion sizes with the generalized extreme values distribution. Xing et al. [13] investigated the three-point bending fatigue performance of 20Cr2Ni4 gear steel with different inclusion properties, and quantitative analysis was proposed to accurately predict the relationship between fatigue lifetimes and stress amplitude around the inclusions. An et al. [14] studied the effect of maximum inclusion on the rotating bending fatigue behavior of SAE52100 bearing steel processed using two different melting methods. Fan et al. [15] investigated the high-cycle fatigue performances of medium-carbon bainitic steels (0.42C-2.2Mn-1.72Si-0.47Cr) with three different microstructures and inclusion sizes, where both inclusion-induced crack initiation and microfacet-induced crack initiation were spotted. Michael et al. [16] assessed the fatigue strength of defect-afflicted cast steel components with a novel fatigue assessment methodology based on the projected planar defect shape. Benedetti et al. [17] proposed a new multi-axial fatigue criterion based on critical distances theory, which could predict the fatigue lifetimes and fatigue strength more accurately. In VHCF regimes, fatigue lifetimes are mostly consumed by the crack-nucleation process within an FGA, and much work has been performed to disclose the fatigue crack-nucleation mechanism of an FGA around inclusions. Tanaka et al. [18] and Chapetti et al. [19] proposed a crack-propagation model to predict the fatigue lifetimes for FGA formation. Paolino et al. [20] proposed P-S-N curves in very high-cycle fatigue based on a general crack-growth-rate model. Based on the cumulative damage method, Deng et al. [21] proposed a fatigue life prediction model of inclusion–FGA–fish-eye failure under different stress ratios.
Apart from inclusion sizes, the depth of inclusions and the inclusion bonding/debonding state also play important roles in fatigue failure. Murakami et al. [22,23] discovered that inclusions closer to the specimen surface result in smaller fatigue lifetimes. The Murakami model was modified by Zhu et al. [24] by adding the information of inclusion locations. Al-Tameemi et al. [25] observed the debonding of MnS inclusion from the steel matrix, indicating the occurrence of local shear or tensile stresses. With digital image correlation, Vegter et al. [26] proved that the debonding Al2O3 inclusions acted as the crack-initiation source during the rolling contact fatigue of bearing steel. Nikolic et al. [27] collected a failed bearing made of AISI 52100 martensitic steel from a wind turbine gearbox and cataloged the inclusions according to depths, types, bonding or debonding states, etc. The results indicated that the initial stage of bonding of the non-metallic inclusions to the steel matrix plays an essential role in fatigue crack initiation. Yves et al. [28] concluded that except for inclusion size, inclusion type, inclusion depth, morphology, and loading were the four other major parameters affecting fatigue behaviors.
Except for using purifying materials to minimize inclusion sizes during material production, some thermomechanical treatment (TMT) methods after production have also been explored [29,30]. Suitable TMT might introduce a more stable dislocation structure around the non-metallic inclusions, which could improve the matrix microstructure around the inclusions and lead to a higher fatigue strength by delaying crack initiation. A similar effect was also discovered by Moshtaghi et al. [31] where work hardening methods could improve the fatigue strength of metastable austenitic stainless steel.
To interpret the effects of inclusion for fatigue performances of metallic materials quantitatively, fracture mechanics theory was adopted by many researchers. Spriestersbach et al. [32] studied the influences of inclusion types on the fatigue fracture of a bainitic high-strength steel 100Cr6 (SAE52100), suggesting that the threshold values of the stress intensity factor (ΔKth) were dependent on the characteristics of inclusion and the interaction between inclusion and the surrounding matrix in the VHCF regime. Zhao et al. [33] revealed that the very high-cycle fatigue performances of a dual phase steel were correlated with inclusion sizes, distances from the specimen surface, and curvatures. Shi et al. [34] investigated the influences of inclusion on the high-temperature fatigue performance of a nickel-based superalloy FGH96, indicating that inclusions with smaller ΔK will consume greater fatigue lifetimes in small crack propagation and lead to larger fatigue lifetimes. Khoukhi et al. [35] studied the influences of defect porosity population, average pore size, and pore spatial density on the fatigue properties of two cast aluminum alloys with different defect characteristics. Shi et al. [36] studied the rotating bending fatigue behaviors of SAE52100, where inclusions for crack initiation were mainly CaO/Al2O3 and TiN inclusions. It was also shown that the number and size of TiN inclusions were much smaller than those of CaO/Al2O3 inclusions; yet, TiN inclusions lead to a much lower fatigue strength. Through the analysis of ΔK and stress concentration around the inclusions, the sharp angle characteristic of TiN inclusions was the main reason for the significant deterioration of fatigue strength.
To facilitate the understanding of the inclusion initiation fatigue mechanism, some microstructure-based numerical models were developed. Guerchais et al. [37] numerically studied the effects of matrix microstructure and voids on the VHCF behavior of 316L stainless steel with finite element analyses, indicating that an elliptical hole would lead to larger fatigue damage than that of a circular hole under the same loading conditions. Przybyla et al. [38,39] introduced a microstructure-sensitive extreme-value model to depict the coupled crystallographic microstructure and the fatigue indicator parameters (FIPs). With the crystal plasticity finite element method (CPFEM), Musinski et al. [40] investigated the fatigue crack initiation and earlier propagation behavior of notched specimens. Castelluccio et al. [41] proposed a microstructural model to characterize the 3D small fatigue crack growth behavior for smooth and through-hole specimens. Gu et al. [42,43,44] established a microstructure-based model for a high-carbon chromium bearing steel (GCr15) by introducing residual stresses around inclusions (Al2O3), suggesting a great predictive capability of S-N curves for different inclusion sizes when considering residual stresses, while the models without residual stresses presented much larger deviations.
In this paper, the fatigue behaviors of GCr15 were studied using rotating bending fatigue loading with a frequency of 52.5 Hz, wherein fractography and S-N curves were obtained first. Then, a 2D crystal plasticity finite element method was adopted to calculate the residual stress distribution around non-metallic inclusions of different sizes under different applied loads. The simulation results showed that the maximum residual local stress was much smaller around large inclusions. It was also revealed that the maximum local stress increases with the applied load. The accumulated plastic strain was adopted as a fatigue indicator parameter to characterize the size effect of inclusions, which was several orders smaller than that obtained around the largest inclusions when the applied load was fixed.

2. Materials and Methods

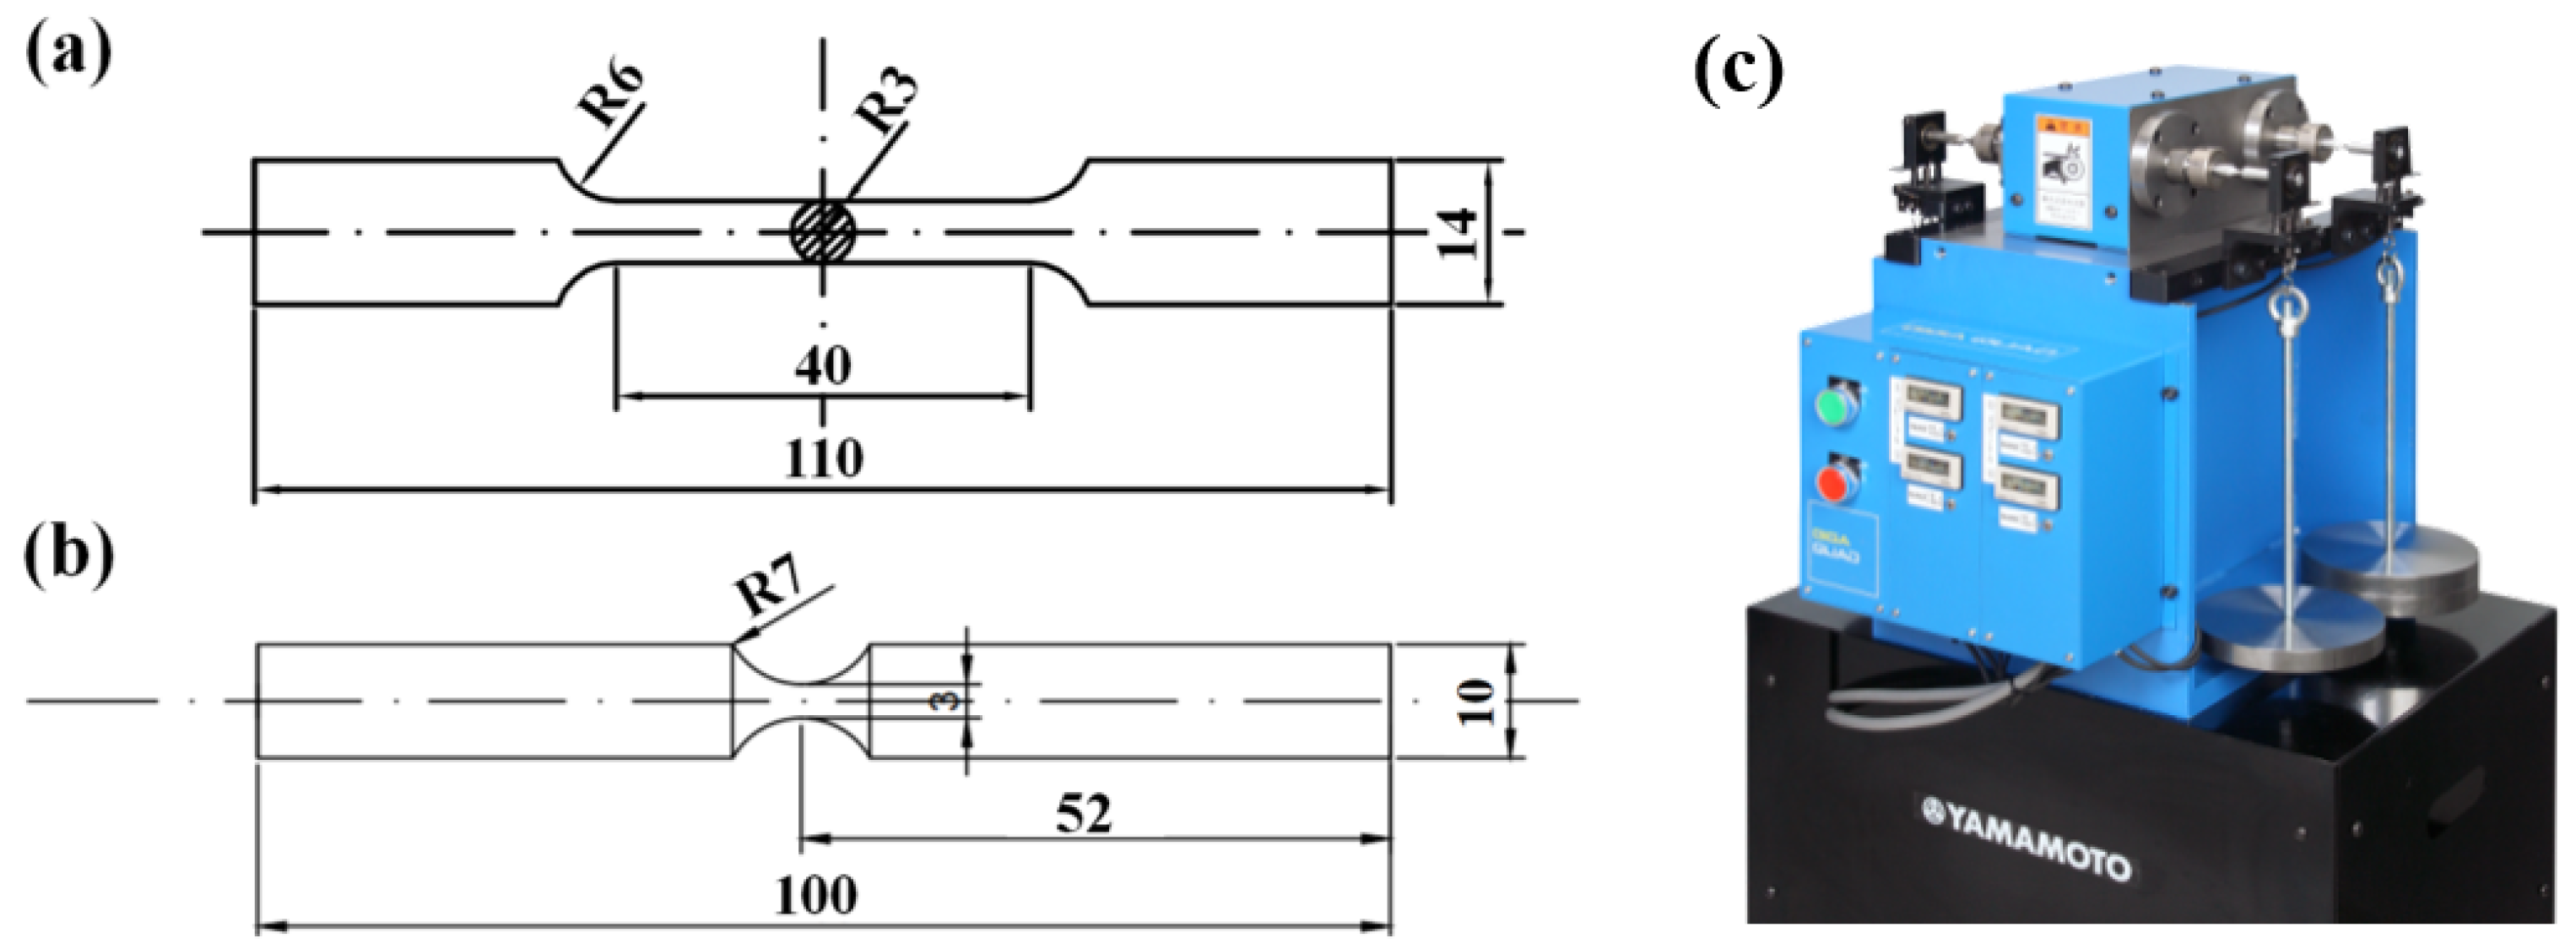
2.1. Materials and Specimens

The material used in this study was a high-carbon chromium bearing steel (Chinese Brand GCr15, similar with SAE52100 of USA), whose chemical composition is shown in Table 1. Cylinder bars received were heat treatment in a furnace. The specimens were heated at 845 °C in vacuum for 120 min, and then oil-quenched and tempered in vacuum at 200 °C for 150 min with furnace-cooling. The microstructures of the materials are shown in Figure 1. Acicular martensite and small spheroidal carbides are clearly observed from the SEM images shown in Figure 1a, which are also evident from the AFM images shown in Figure 1b.

2.2. Experimental Methods

Cylindrical dog-bone specimens were adopted in this study for the evaluation of the mechanical properties of specimens, while the dimensions of specimens for tensile and fatigue experiments are presented in Figure 2a,b. The surface of specimens was polished by grade 600, 1000, 1500, and 2000 abrasive papers, successively. The tensile experiments were carried out on an MTS 810 testing machine, where the adopted strain rate was 10−4 s−1. Rotating bending fatigue testing was conducted on a YAMAMOTO (Osaka, Japan) rotating bending machine, as shown in Figure 2c, with a fixed frequency of 52.5 Hz and a stress ratio of −1. During rotating bending fatigue testing, one end of the specimen is fixed on the bearing while the other end is loaded with weights. The loading amplitude ( σ (MPa)) is adjusted by different weights (P(N)):
σ = P × 32 α L π D 3
where α = 1.05 is the stress concentration coefficient, D (mm) is the diameter of the minimum cross-section, L = 52 (mm) is the distance from the minimum cross-section to the loading end, and P (N) is the total weight. For each specimen, the parameter D was measured five times before fatigue testing and the average value was adopted for loading amplitude calculation.

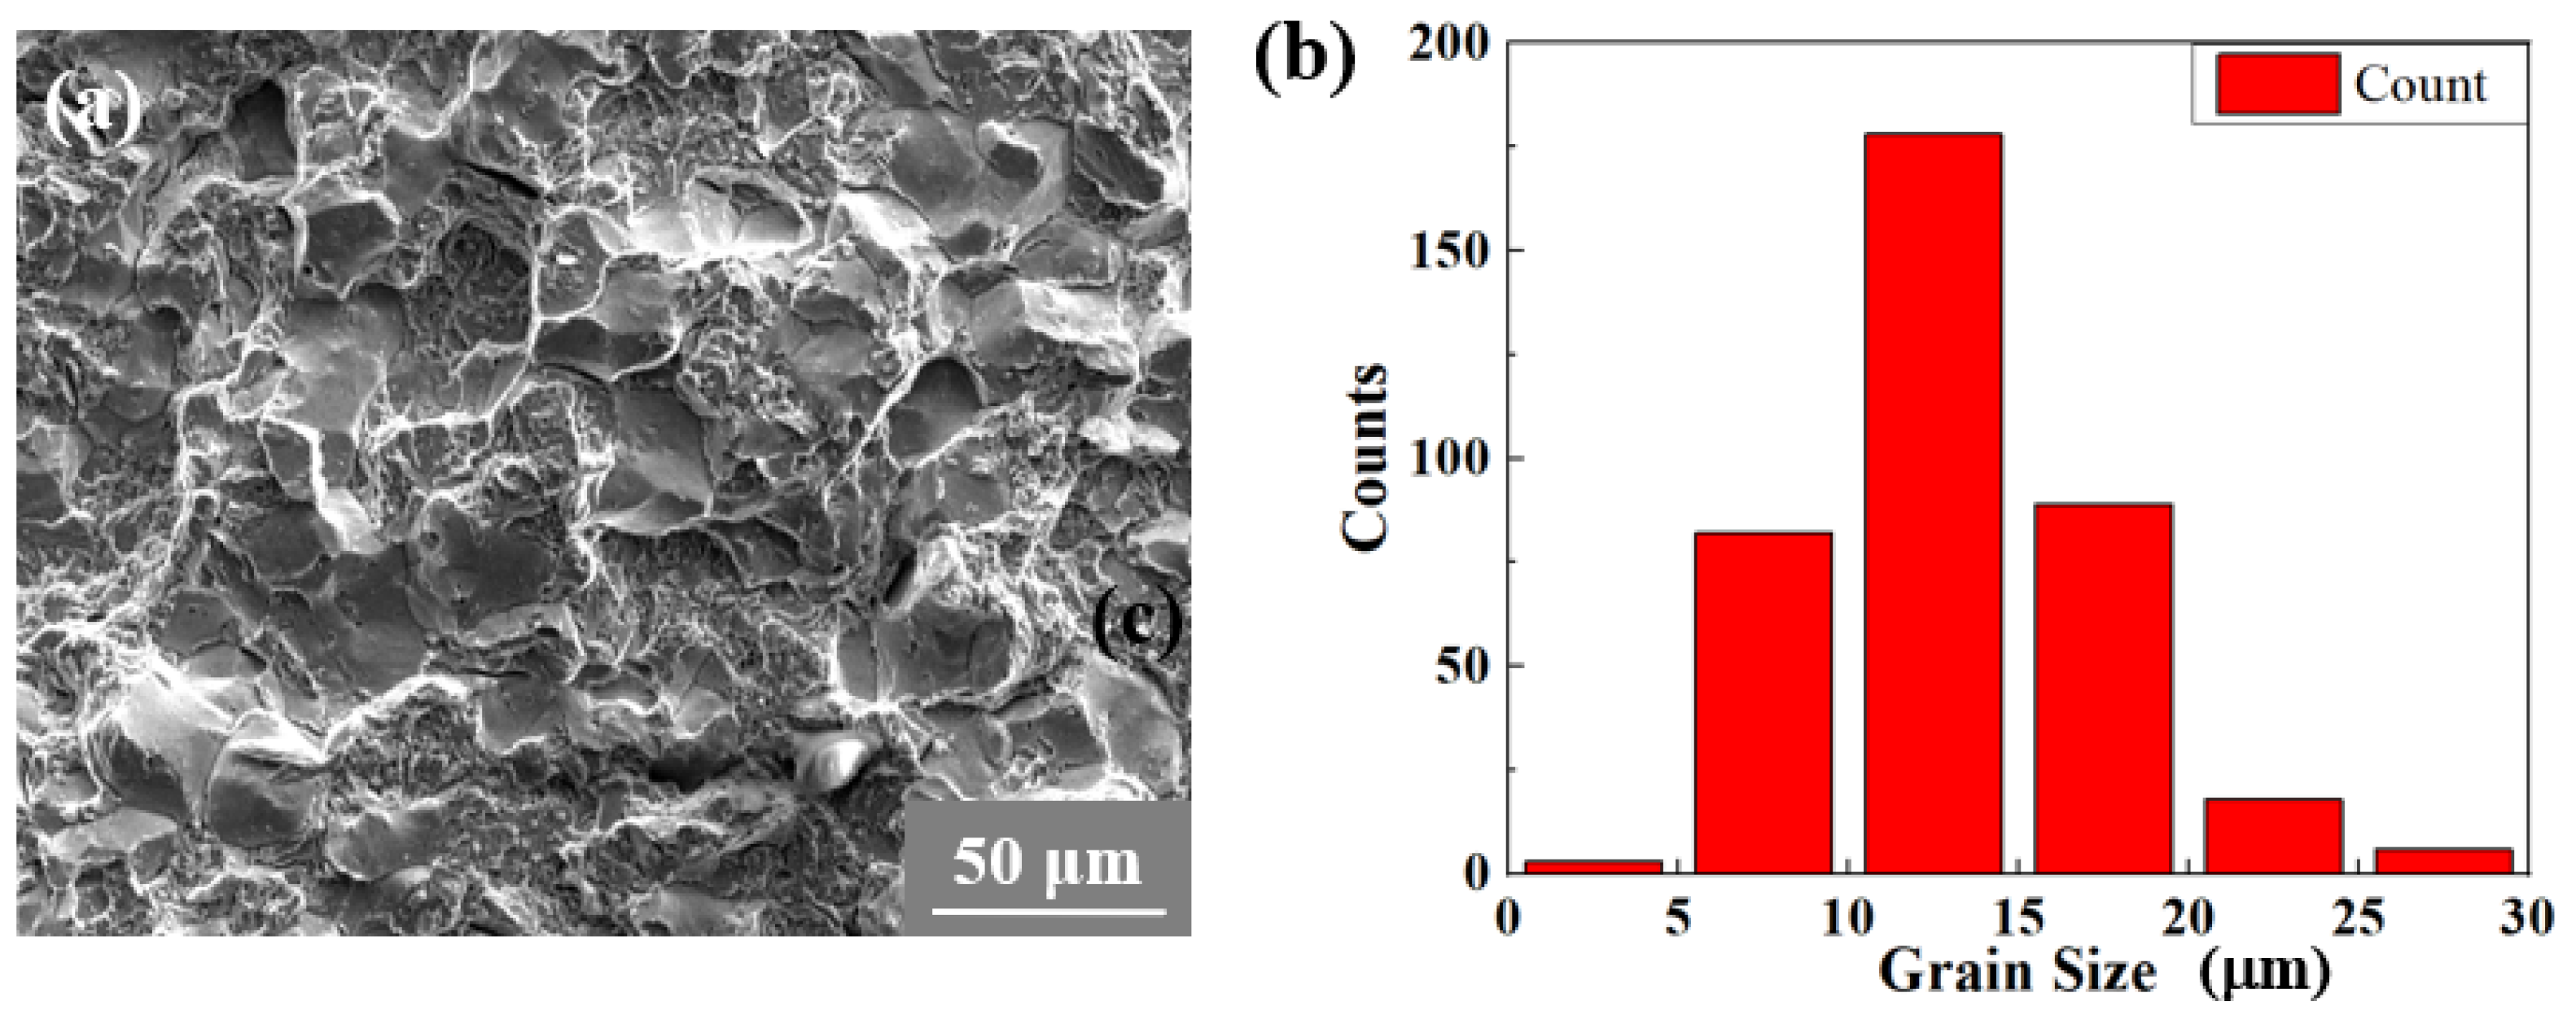
2.3. Microstructure Characterization

Samples for microstructure characterization were polished by 800#, 1500#, and 2000# sandpaper and 5 μm polishing paste, which was subsequently etched with a 0.4% hydrofluoric acid solution. The microstructure of the damaged surface was observed by a field emission scanning electron microscope (SEM, MIRA 3 XMU, TESCAN, Brno, Czech Republic). The chemical analysis of non-metallic inclusions was carried out with energy-dispersive X-ray spectroscopy (EDS) equipped with the SEM. The detailed surface topography of the microstructure and fractured surface was also investigated by an atomic force microscope (AFM, Bruker Dimension® Icon™, Bruker, Karlsruhe, Germany). During AFM observations, the lens was adjusted to the specified zones with low magnification and then zoomed in to the target zones. The surface roughness of three specific zones was observed to show the different fatigue crack propagation mechanisms.

3. Crystal Plasticity Finite Element Simulation

3.1. Crystal Plasticity Theory

The total deformation of single crystal F can be divided into an elastic part and plastic part in a classical crystal plasticity framework, which can be expressed as
F = F e F p
where Fe represents the elastic deformation gradient and Fp represents the plastic deformation gradient. For the GCr15 alloy, the plastic deformation is mainly caused by crystal slip. In this work, two slip systems, {110}<111> and {112}<111>, were implemented in the models of this study. The plastic velocity gradient can be calculated by the plastic deformation gradient Fp, and it can also be expressed as the sum of shear strain in each slip system:
L p = F ˙ p F p   1 = α = 1 N γ ˙ α s α m α
where N represents the number of slip systems; α means the αth slip system; and γ ˙ , s , and m represent the shear strain rate, the unit vector in the slip direction, and the unit normal vector of the slip plane, respectively. The shear strain rate of the αth slip system γ ˙ α is given in power-law form as [40,41]
γ ˙ α = γ ˙ 0 τ α g α n sgn τ α
where τ α represents the resolved shear stress; γ ˙ 0 is the reference strain rate; and n is the rate sensitivity exponent. The slip resistance g α is given as
g ˙ α = β = 1 N h α β γ ˙ β
where h α β is the matrix of the hardening modulus and is given by
h α β = q h ( γ ) + ( 1 q ) h ( γ ) δ α β
h α α = h ( γ ) = h 0 sech 2 h 0 γ τ s τ 0
where q is the ratio of the self-hardening effect to the latent hardening effect, and the value is 1 in this work. τ s , τ 0 , and h 0 represent the saturated flow stress, yield stress, and initial hardening modulus, respectively. The total shear strain can be obtained by
γ = α = 1 N 0 t γ ˙ α dt

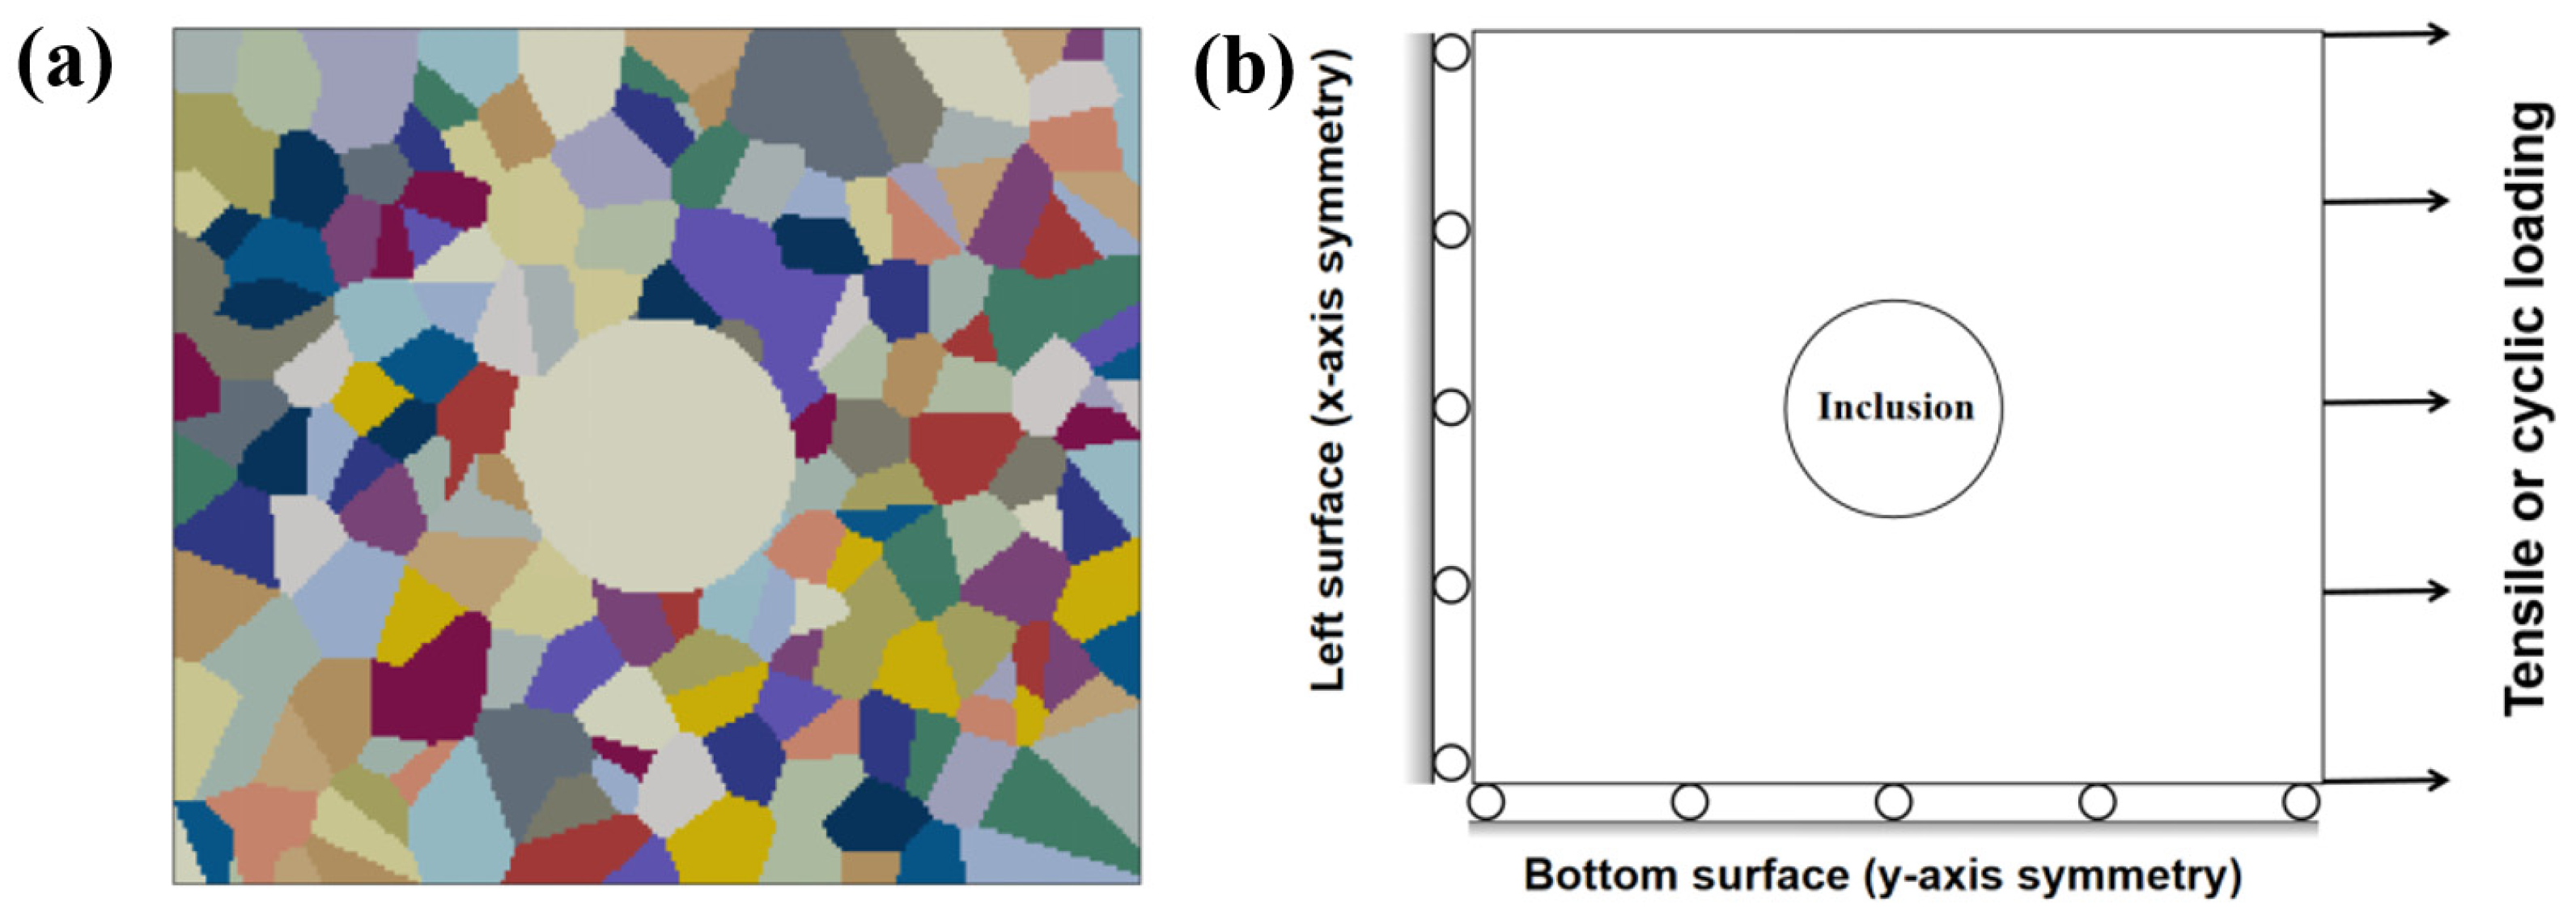
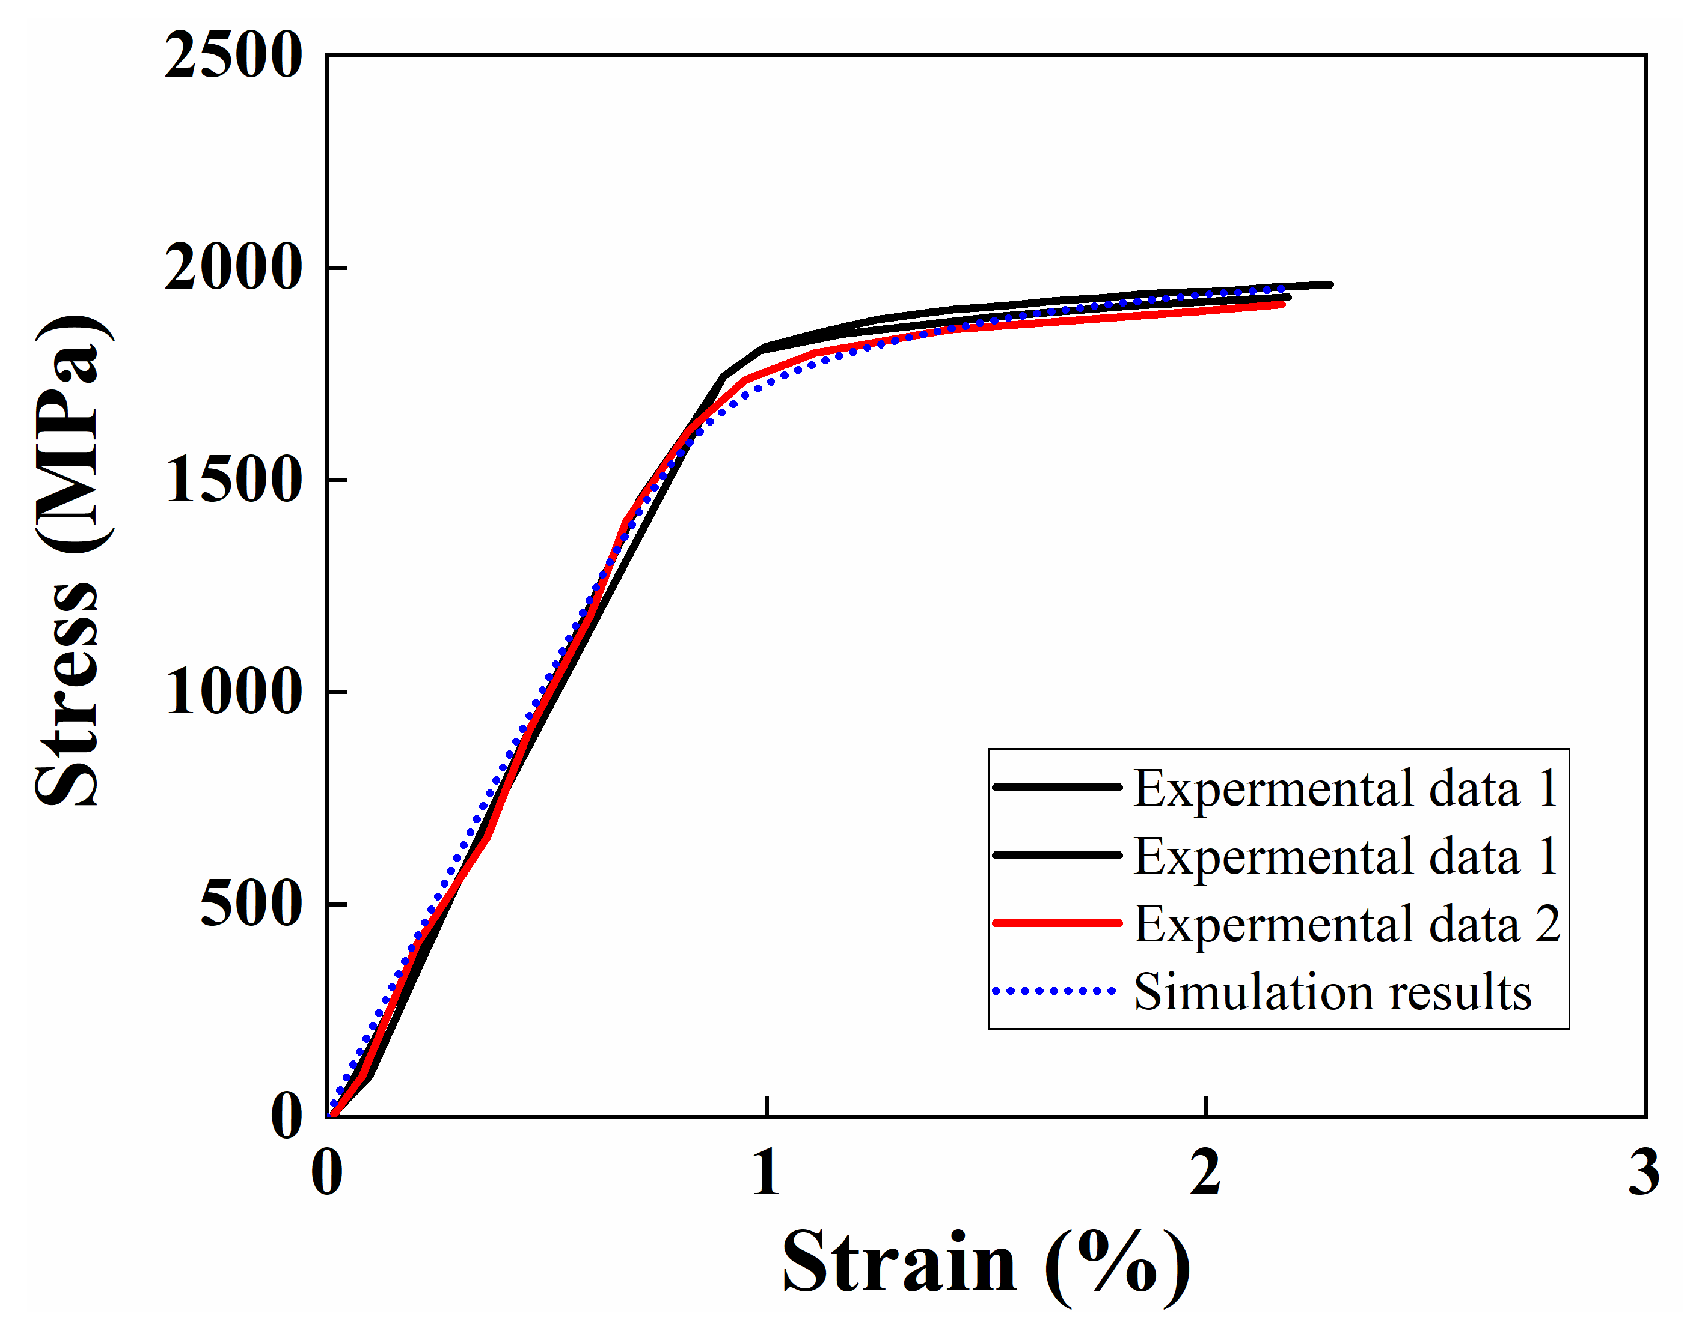
3.2. Finite Element Modeling and Model Parameters Calibration

To numerically assess the influence of inclusion for the fatigue performance of GCr15, a microstructure-sensitive model based on CPFEM was established with ABAQUS UMAT v12.0. The distributions of RVEs are derived based on the size distribution of prior austenite grains, which are displayed in Figure 3a,b. Figure 3a is a typical mixed intergranular and transgranular fractography obtained from the fracture surface. First, about 20 images are captured from the mixed intergranular and transgranular zone. Then, the images are processed by software Image Pro Plus (v5.0), where the original images are turned into gray/white images and the areas of prior austenite grains are counted and measured. The size distribution is presented in Figure 3b, obtained through 378 counted grains with an average of 13.2 µm.
Based on microscopic details, an RVE with 200 grains (210 μm × 185 μm) is established with the Voronoi method and the average grain size is 13.2 μm. To investigate the influences of inclusions on GCr15 alloy under VHCF loading, a circle inclusion is put at the center of the RVE, as shown in Figure 4a. The sizes of most inclusions range from 15 to 35 μm, with some inclusions reaching 55 μm. Therefore, the converted circle inclusion radii range from 5 μm to 40 μm. The inclusion is set with elastic modulus E = 370 MPa and Poisson ratio μ = 0.4 [7]. According to Cong et al. [45] and Zhang et al. [46], it is assumed that there is no interfacial gap between the inclusion and the matrix. In the case of fatigue loading, the y-axis symmetry boundary is only applied to the bottom surface, and the right surface is set to uniaxial tensile or cyclic loading along the x-axis, as shown in Figure 4b. Triangular waves with different stress amplitudes are adopted in the fatigue loading simulations.
It is seen that several model parameters must be obtained before further studying fatigue damage evolution during cyclical loading. The generally adopted method involves calibrating these parameters with the data from uniaxial tensile testing. The stress–strain curves of the materials are obtained with three specimens, which present a great coincidence as shown in Figure 5. For bcc metallic materials, only two slip systems, {110}<111> and {112}<111>, will activate at room temperature. The corresponding parameters are presented in Table 2. The CPFEM results of tensile simulation also present great consistency with the experimental results, indicating the accuracy of the CPFEM simulation method.

4. Results and Discussions

4.1. S-N Curves

The S-N plot of experimental data of GCr15 bearing steel under rotating bending fatigue loading with a loading frequency of 52.5 Hz is presented in Figure 6, where the solid circular symbols “●” represent the fatigue data of interior crack initiation and the triangle symbols “△” represent the fatigue data of surface crack initiation. The data with an arrow “→” indicate unbroken specimens. It is seen that specimens continue to break beyond 107, and the fatigue strength corresponding to fatigue lives of 109 is about 100 MPa lower than those of 107, which is already beyond the scope of the data scatter. Although scatters of fatigue lifetimes in experiments are very common, for materials which have obvious fatigue limits such as low-strength steels, 3s (s = 10 MPa) is generally taken as the maximum scatter of fatigue strength. In this study, the fatigue strength corresponding to fatigue lives of 107 is about 850 MPa, while the fatigue strength corresponding to fatigue lives of 109 is about 750 MPa. The fatigue strength decreases by 100 MPa, which suggests that the failure at 109 is no more than the scatters of fatigue lifetimes, and new failure mechanisms appear. It is clearly seen that the surface failure mode tends to occur at higher stress amplitudes and lower fatigue lifetimes, while the interior failure mode generally occurs at lower stress amplitudes and longer fatigue lifetimes.

4.2. Fractography

The typical patterns of the subsurface defect-initiated fracture surface are displayed in Figure 7a, where failure generally originates from inclusions, accompanied by a rough surface called an FGA (Fine Granular Area) and a fish-eye pattern zone. The fracture surface morphology and roughness curve of the FGA, fish-eye zone, and outer perimeter of the fish-eye zone are observed by AFM and presented in Figure 7b–d. It is seen that the FGA zone has a relatively higher surface roughness, which is 3 times that of the fish-eye zone, while the surface roughness of the outer perimeter of the fish-eye zone is about 10 times that of the fish-eye zone. This difference in surface roughness between different zones suggests different crack propagation mechanisms.
The morphologies of crack initiation sites at different loading amplitudes and fatigue lifetimes are investigated and presented in Figure 8. When the loading amplitude is high, the crack initiates from the specimen surface as shown in Figure 8a. At lower stress amplitudes, the fatigue lifetimes are higher and a fish-eye pattern appears as shown in Figure 8b,c, where the outer perimeter of the fish-eye is generally close to the specimen surface. When the stress amplitude is lower, FGA zones appear around the inclusions, as shown in Figure 8d,e. There are some special fracture modes where the crack initiates from microfacet debonding as shown in Figure 8f, which is also reported by several studies.

4.3. Fracture Mechanics Analysis of Inclusions and FGA

The chemical compositions of most spotted inclusions by EDX are presented in Figure 9, indicating that the inclusions mainly consist of Al2O3, CaO, MgO, SiO2, etc. The sizes of inclusions and the FGA are obtained from the fracture surface and presented in Figure 10a, where the values of sizes are measured as (area)1/2. It is shown from Figure 10 that the inclusion size is randomly distributed in the range from 10 μm to 55 μm, while that of the FGA is in the range from 30 μm to 50 μm. In addition, FGAs do not occur in the presence of very large inclusions. On the contrary, an FGA still occurs around large prior austenite grains even if there are no inclusions.
It is also noticed that an FGA only appears when the fatigue lifetimes are relatively higher. The range of the stress intensity factor (SIF) around the inclusion and FGA, ΔKini, is computed and presented in Figure 10b. It is shown that the values of ΔK for inclusions have a random distribution, while they tend to decrease as fatigue life increases, suggesting that smaller inclusions lead to higher fatigue lifetimes. On the contrary, the values of ΔK for an FGA remain almost constant regardless of fatigue life, in the range of 4.5~4.9 MPa·m1/2. It was suggested by Zhao et al. [10,11] that the values of ΔK for an FGA are almost the same for the same kind of material, which only depends on Young’s Modulus (E) and the Burgers vector (b). The results of this study confirmed this assumption. It is also acknowledged by many researchers [9,18,19,20] that an FGA corresponds to the crack nucleation process, and the formation of an FGA consumes most of the fatigue lifetimes. Thus, the area of an FGA will be the same under the same loading amplitude, and a smaller inclusion size leads to a larger area for crack nucleation and longer fatigue lifetimes.

4.4. Residual Stress Distribution and Accumulated Plastic Strain

The RVEs are loaded at a frequency of 52.5 Hz, which is the same as the experimental conditions. The stress amplitude is set as 800, 900, and 1000 MPa for each type of inclusion size. Details of models are shown in Table 3. Inclusion radii from 5 μm to 40 μm are adopted in the microstructural model simulations.
Figure 11 shows the distributions of local residual stress of each model listed in Table 2. For the models without inclusion, the residual stress mainly exists along the boundaries of grains. In the case of models with inclusion, the residual stress distributes along and at a 45° angle with the loading direction, and the residual stress is much higher than the models without inclusion, about two orders of magnitudes. The position of maximum residual stress is at the edge of inclusion. Moreover, with the increase in inclusion size, the area with relatively high residual stress becomes larger while the value of maximum residual stress does not increase too much. The increase in loading stress leads to no obvious increase in area with relatively high residual stress. These results suggested that the damage process around the inclusion is accumulated layer by layer, regardless of the FGA zone or fish-eye zone.
According to previous studies [7,9,12], the accumulated plastic strain Pac is an important indicator parameter (FIP) that judges crack initiation. Pac can be calculated by
P ac = 2 3 L p : L p dt
The distributions of accumulated plastic strain after fatigue loading of each model are shown in Figure 12. Due to the restriction of computational resources, only 100 cycles of loading are carried out. It can be clearly seen that, in the cases without inclusion (Figure 12A-1,B-1,C-1), the difference in plastic strain is mainly caused by grain orientation, while for the models with a relatively smaller inclusion (Figure 12A-2,B-2,C-2), the position of maximum plastic strain is at the boundary between the inclusion and grains, but the value is almost the same as that of models without inclusion loaded at the same stress amplitude. With the increase in inclusion radius, the influences of inclusion become more and more obvious. The Pac around the inclusion is much higher than that in other grains, which suggests that the existence of inclusion may reduce material strength and lead to higher fatigue damage. Moreover, it is also observed that the plastic shear strain is higher in grains on the straight line of the horizontal symmetry axis of inclusions compared to others when the radius of inclusion R is set to over 10 μm (Figure 12A-4–A-6,B-4–B-6,C-4–C-6), which is very close to the average sizes of prior austenite grains.
The variations in accumulated plastic strain with the increase in loading cycles are shown in Figure 13. The value of accumulated plastic strain around different inclusion sizes also resembles the crack nucleation or propagation of materials. The plastic strain accumulated around smaller inclusions resembles the damage process of the FGA, while that around larger inclusions resembles the crack propagation process of the fish-eye zone. The Pac around smaller inclusions is very small, suggesting that the crack nucleation process is very slow in the FGA zone, while the Pac around large inclusions is very large, suggesting that the crack propagation rate is fast in the fish-eye zone.
The results shown in Figure 13 can also give some suggestions on inclusion processing in materials. During fractography observation, it is seen that the inclusion acting as a failure originating site is seldom smaller than 10 μm. In addition, as shown in Figure 8f and Figure 9, prior austenite grains could also act as the originating source of failure when inclusion is absent. Although super clean steels without inclusion (or all the inclusion sizes are smaller than 1 μm) could benefit with the fatigue strength improvement in materials, the purifying process is not economic, the fatigue strength improvement is not obvious, and there is a balance between the cost and effects. Thus, it is important to determine the critical inclusion size in materials processing. For the case with inclusion radius R = 5 μm, the curve almost coincides with the curve without inclusion. Noting that the hotspots with and without inclusion are different, the conclusion is made that the fatigue life of these two conditions is similar, while the crack initiation is different. For the case with inclusion radius R = 10 μm, it is seen that there is a significant increase in accumulated plastic strain. Beyond this size, although the accumulation rate increases with the increase in inclusion size, the increasing rate is not obvious. When the inclusion radius R is set to 30 μm and 40 μm, the two curves coincide and almost overlap, suggesting that the effect of inclusion size on the fatigue damage accumulation rate is similar when the radius is over 30 μm. This is also evidenced by many studies where the crack propagation rate in the fish-eye zone is the same.

5. Conclusions

In this paper, the fatigue behavior of high-strength bearing steel was investigated by a rotating bending fatigue testing machine with a loading frequency of 52.5 Hz. Fractography and fracture mechanics analysis around crack initiation sites were investigated in detail. Then, the crystal plasticity finite element method (CPFEM) was adopted to explain the effects of inclusions quantitatively. The main results are summarized as follows:
(1)
The specimens continue to break beyond 107, and the fatigue strength corresponding to fatigue lives of 109 is about 100 MPa lower than that of 107, which is already beyond the scope of the fatigue lifetime scatter, and a new failure mechanism appears.
(2)
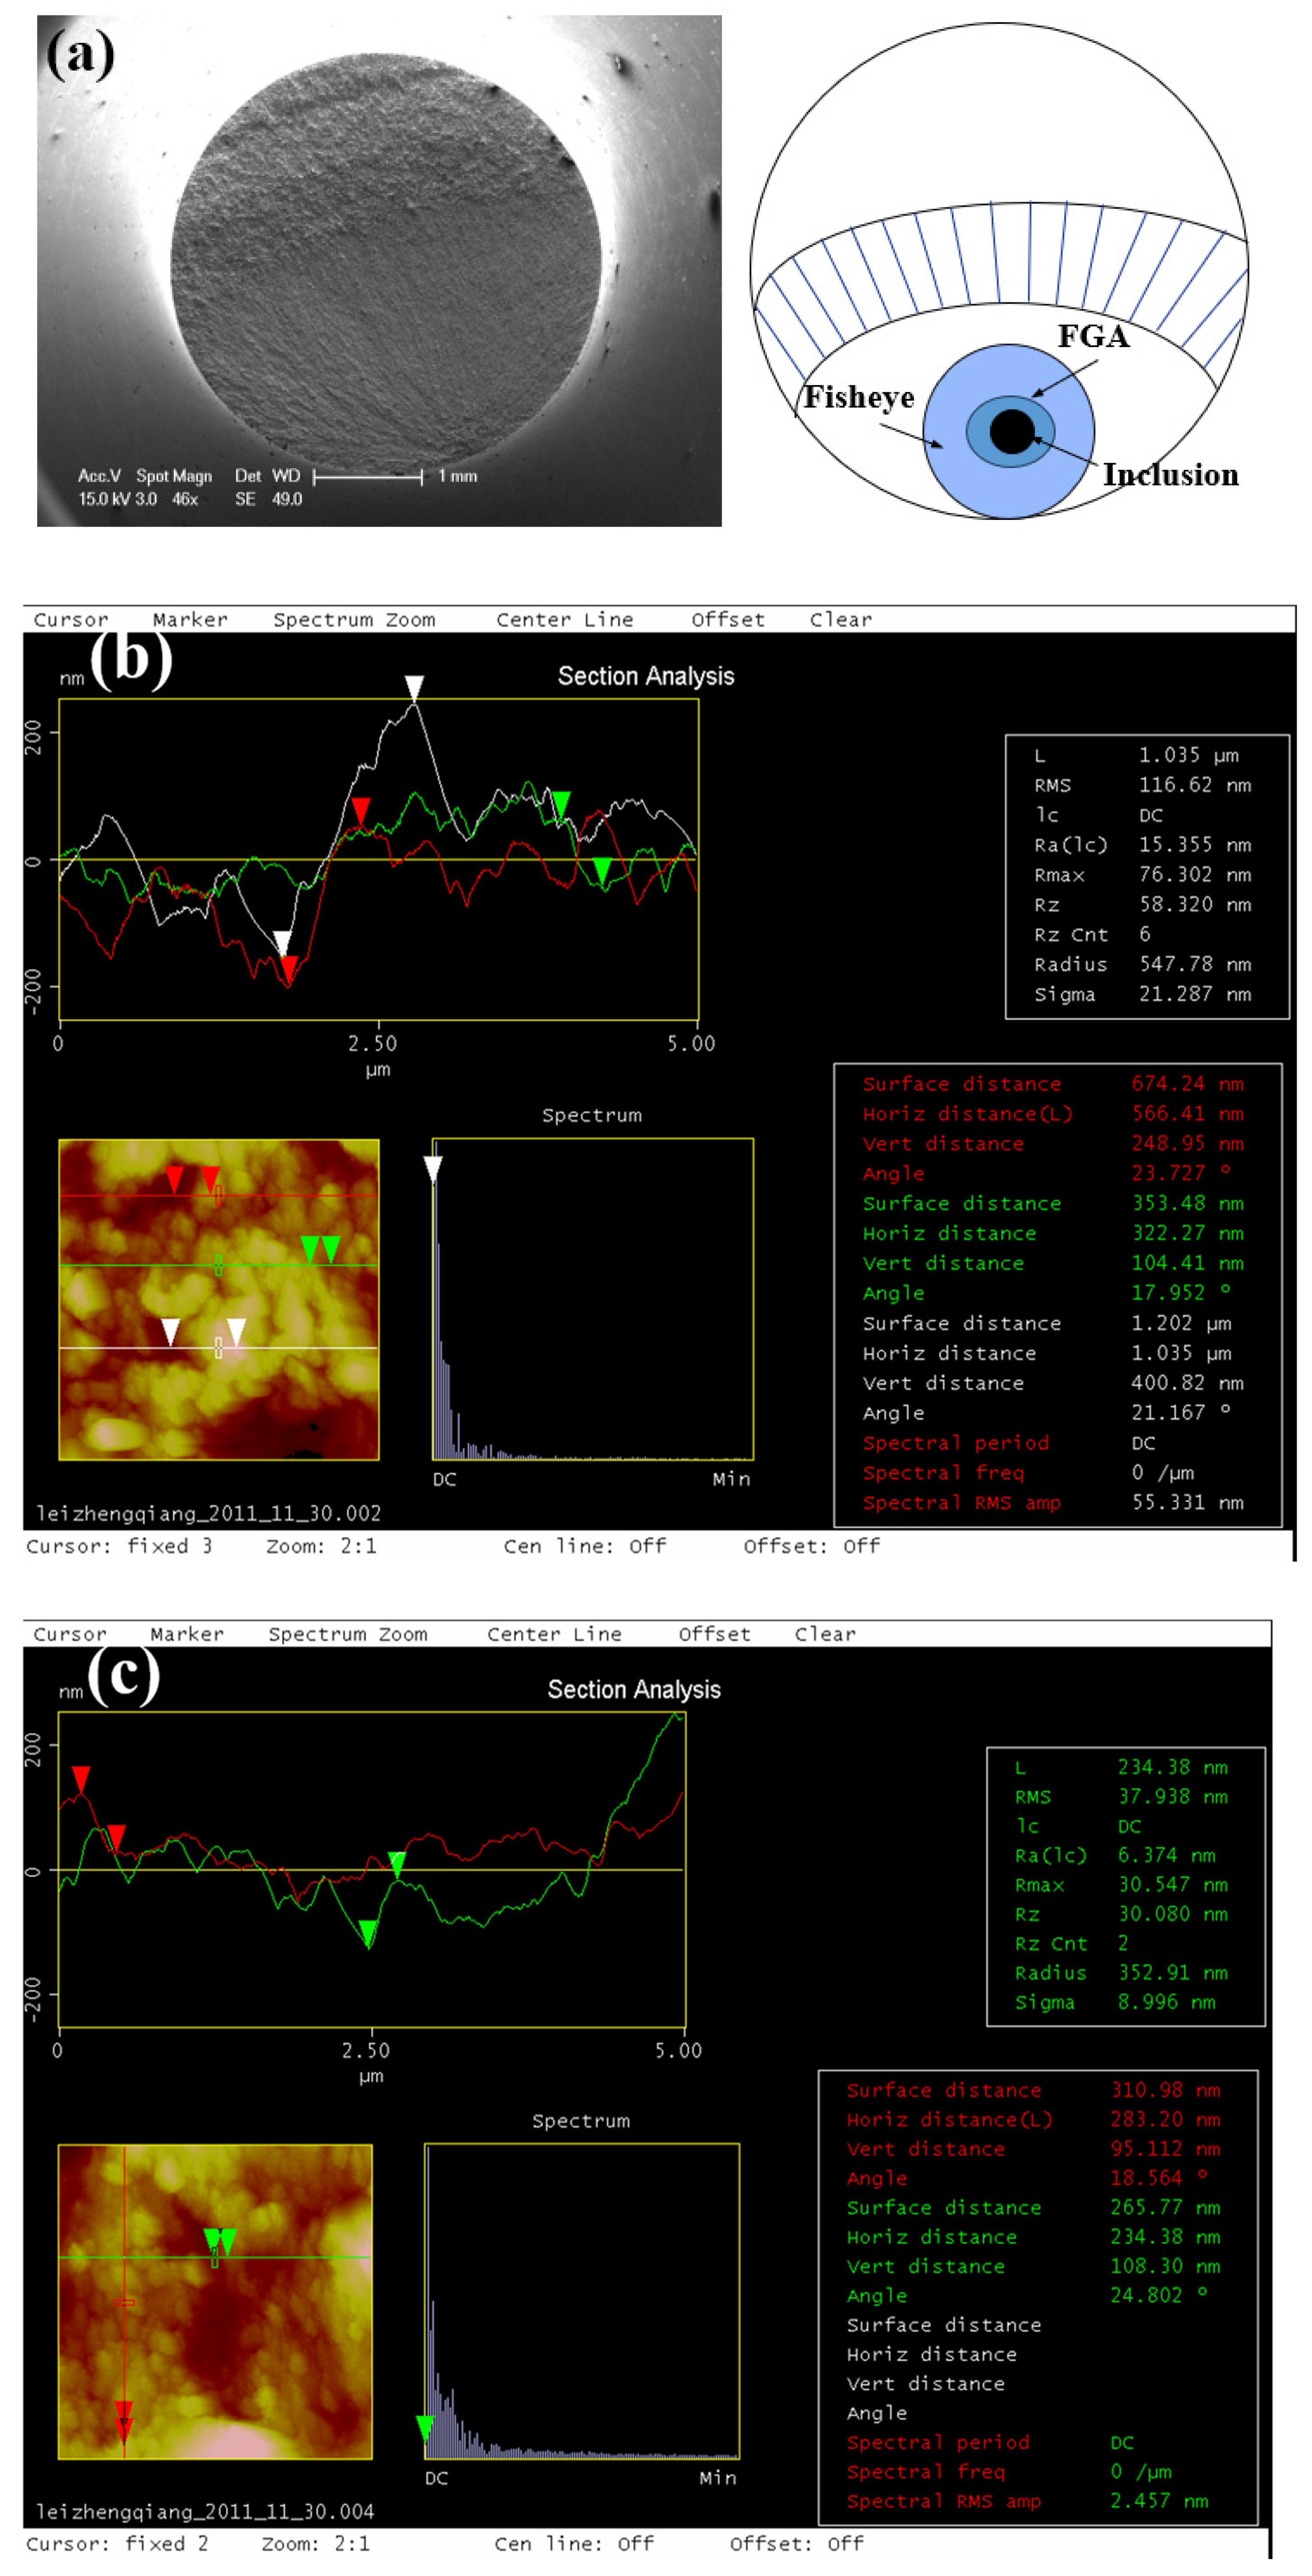
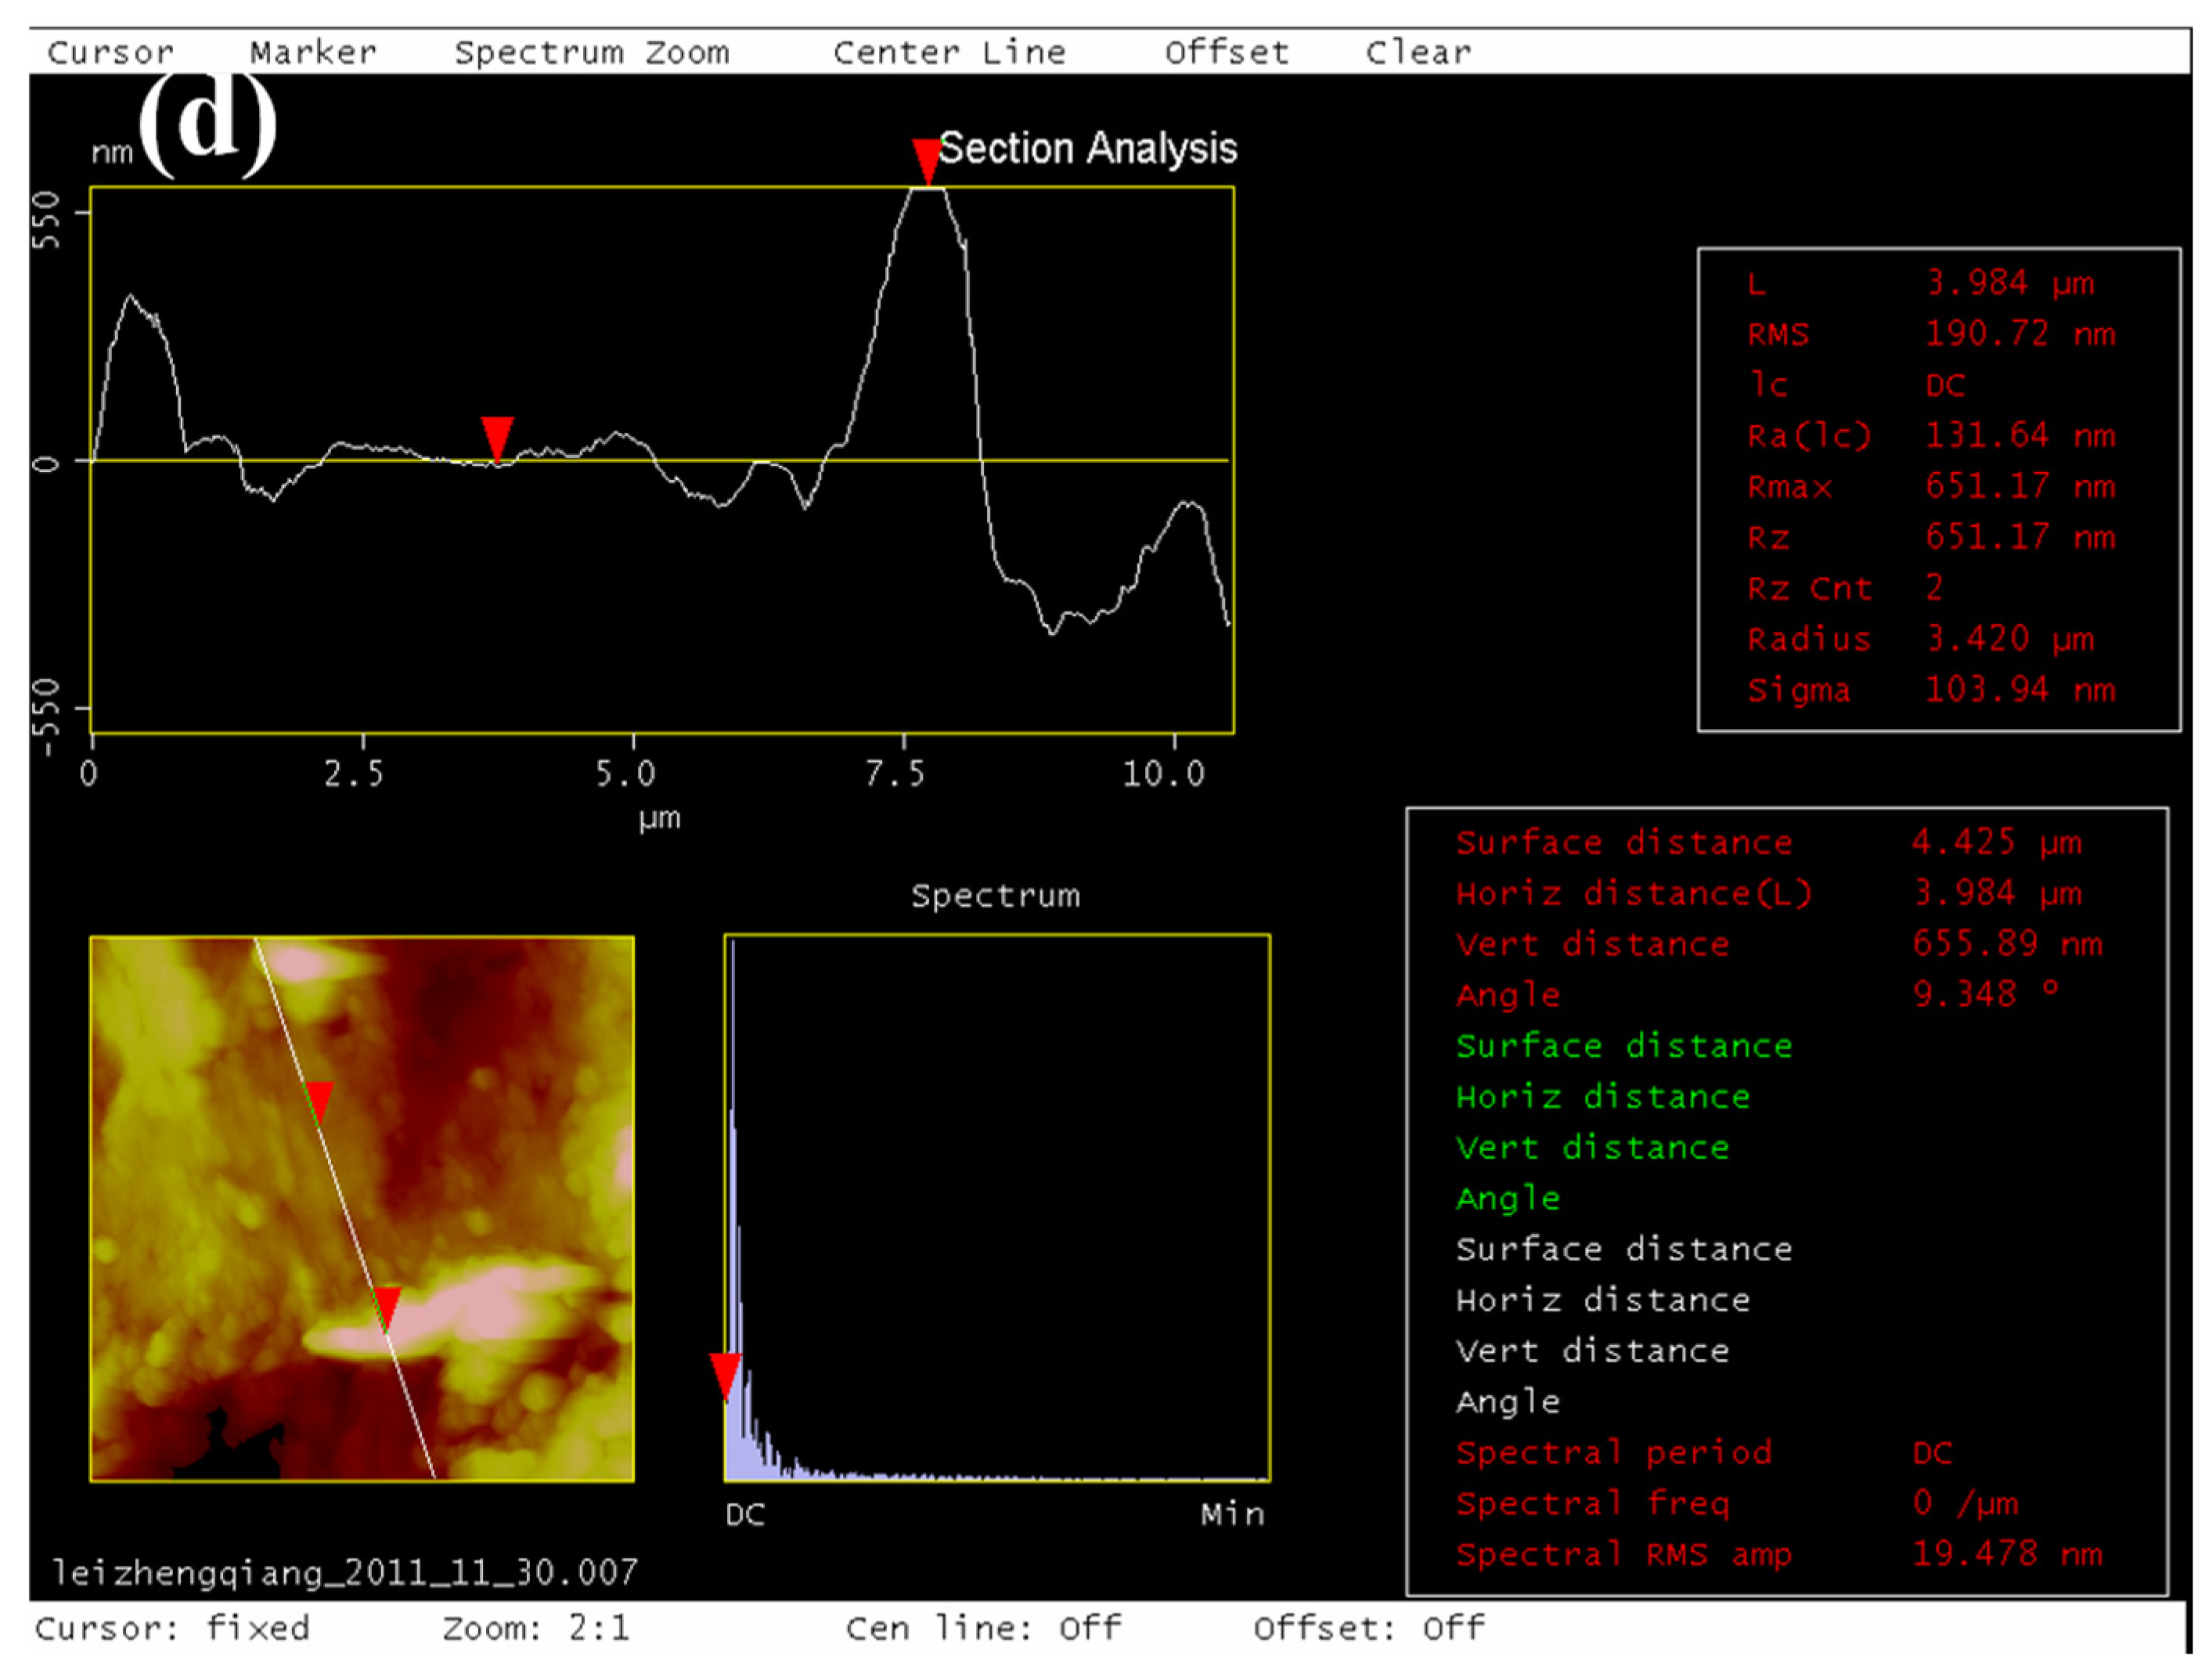
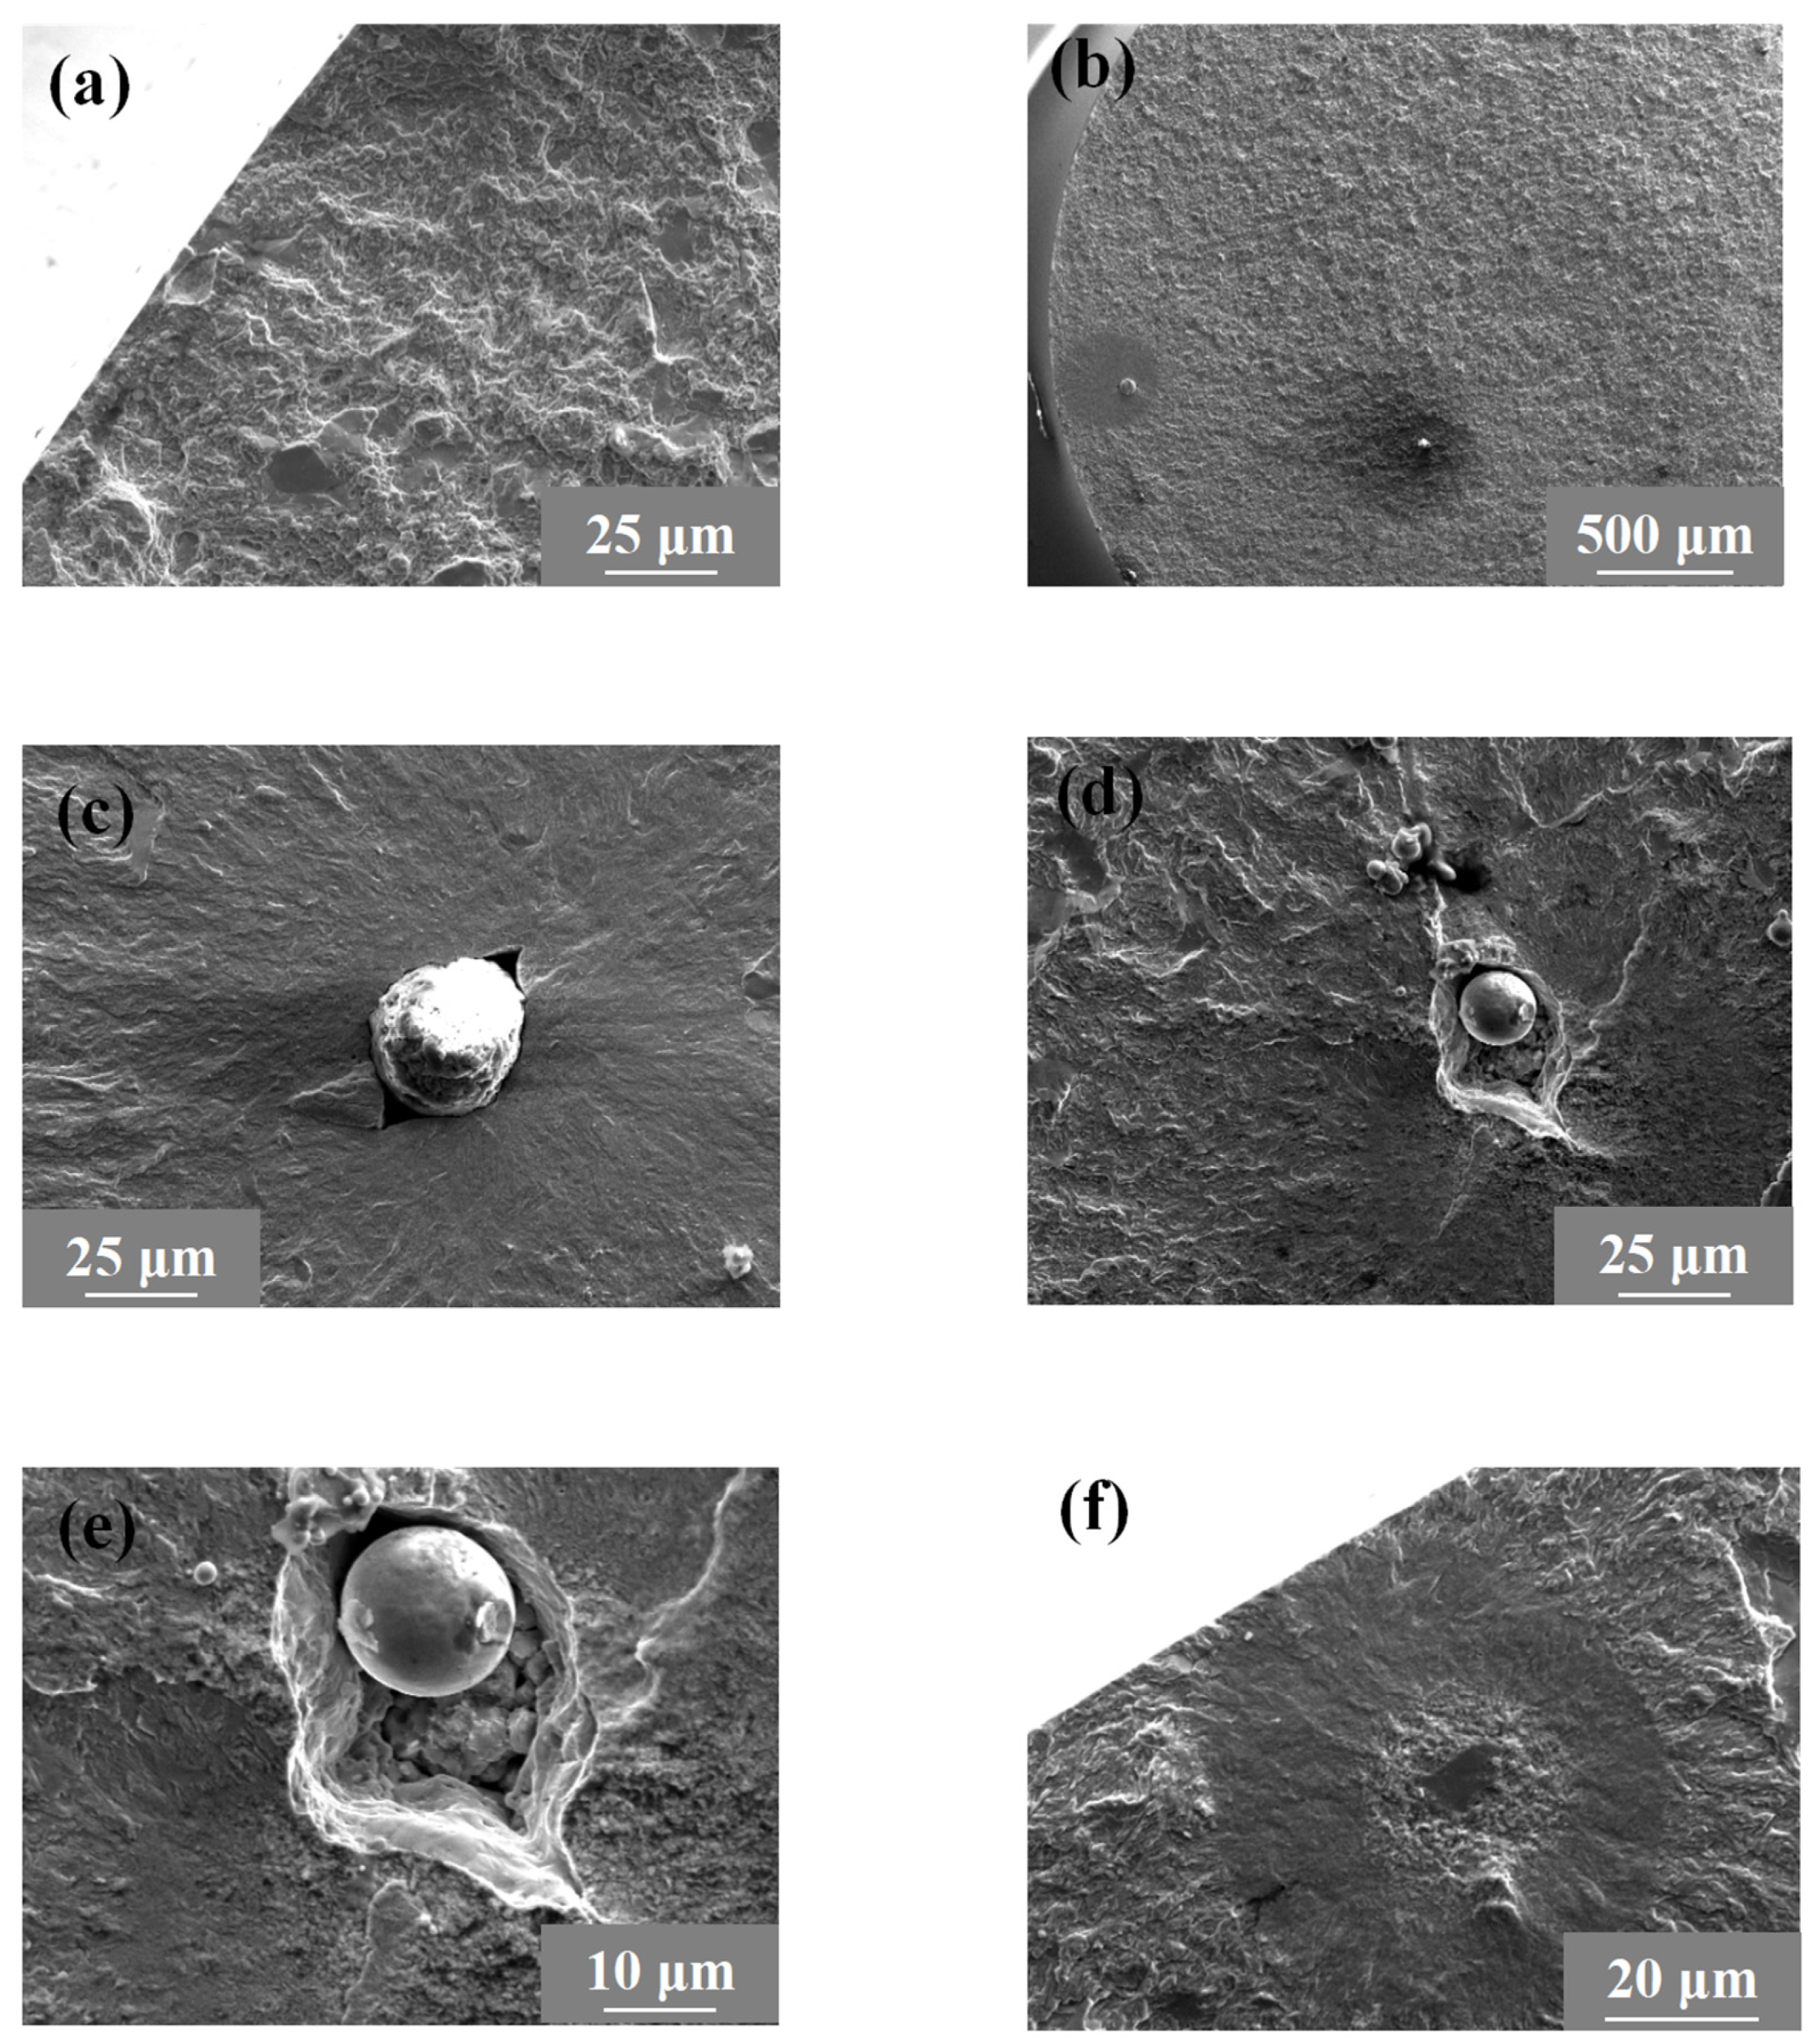
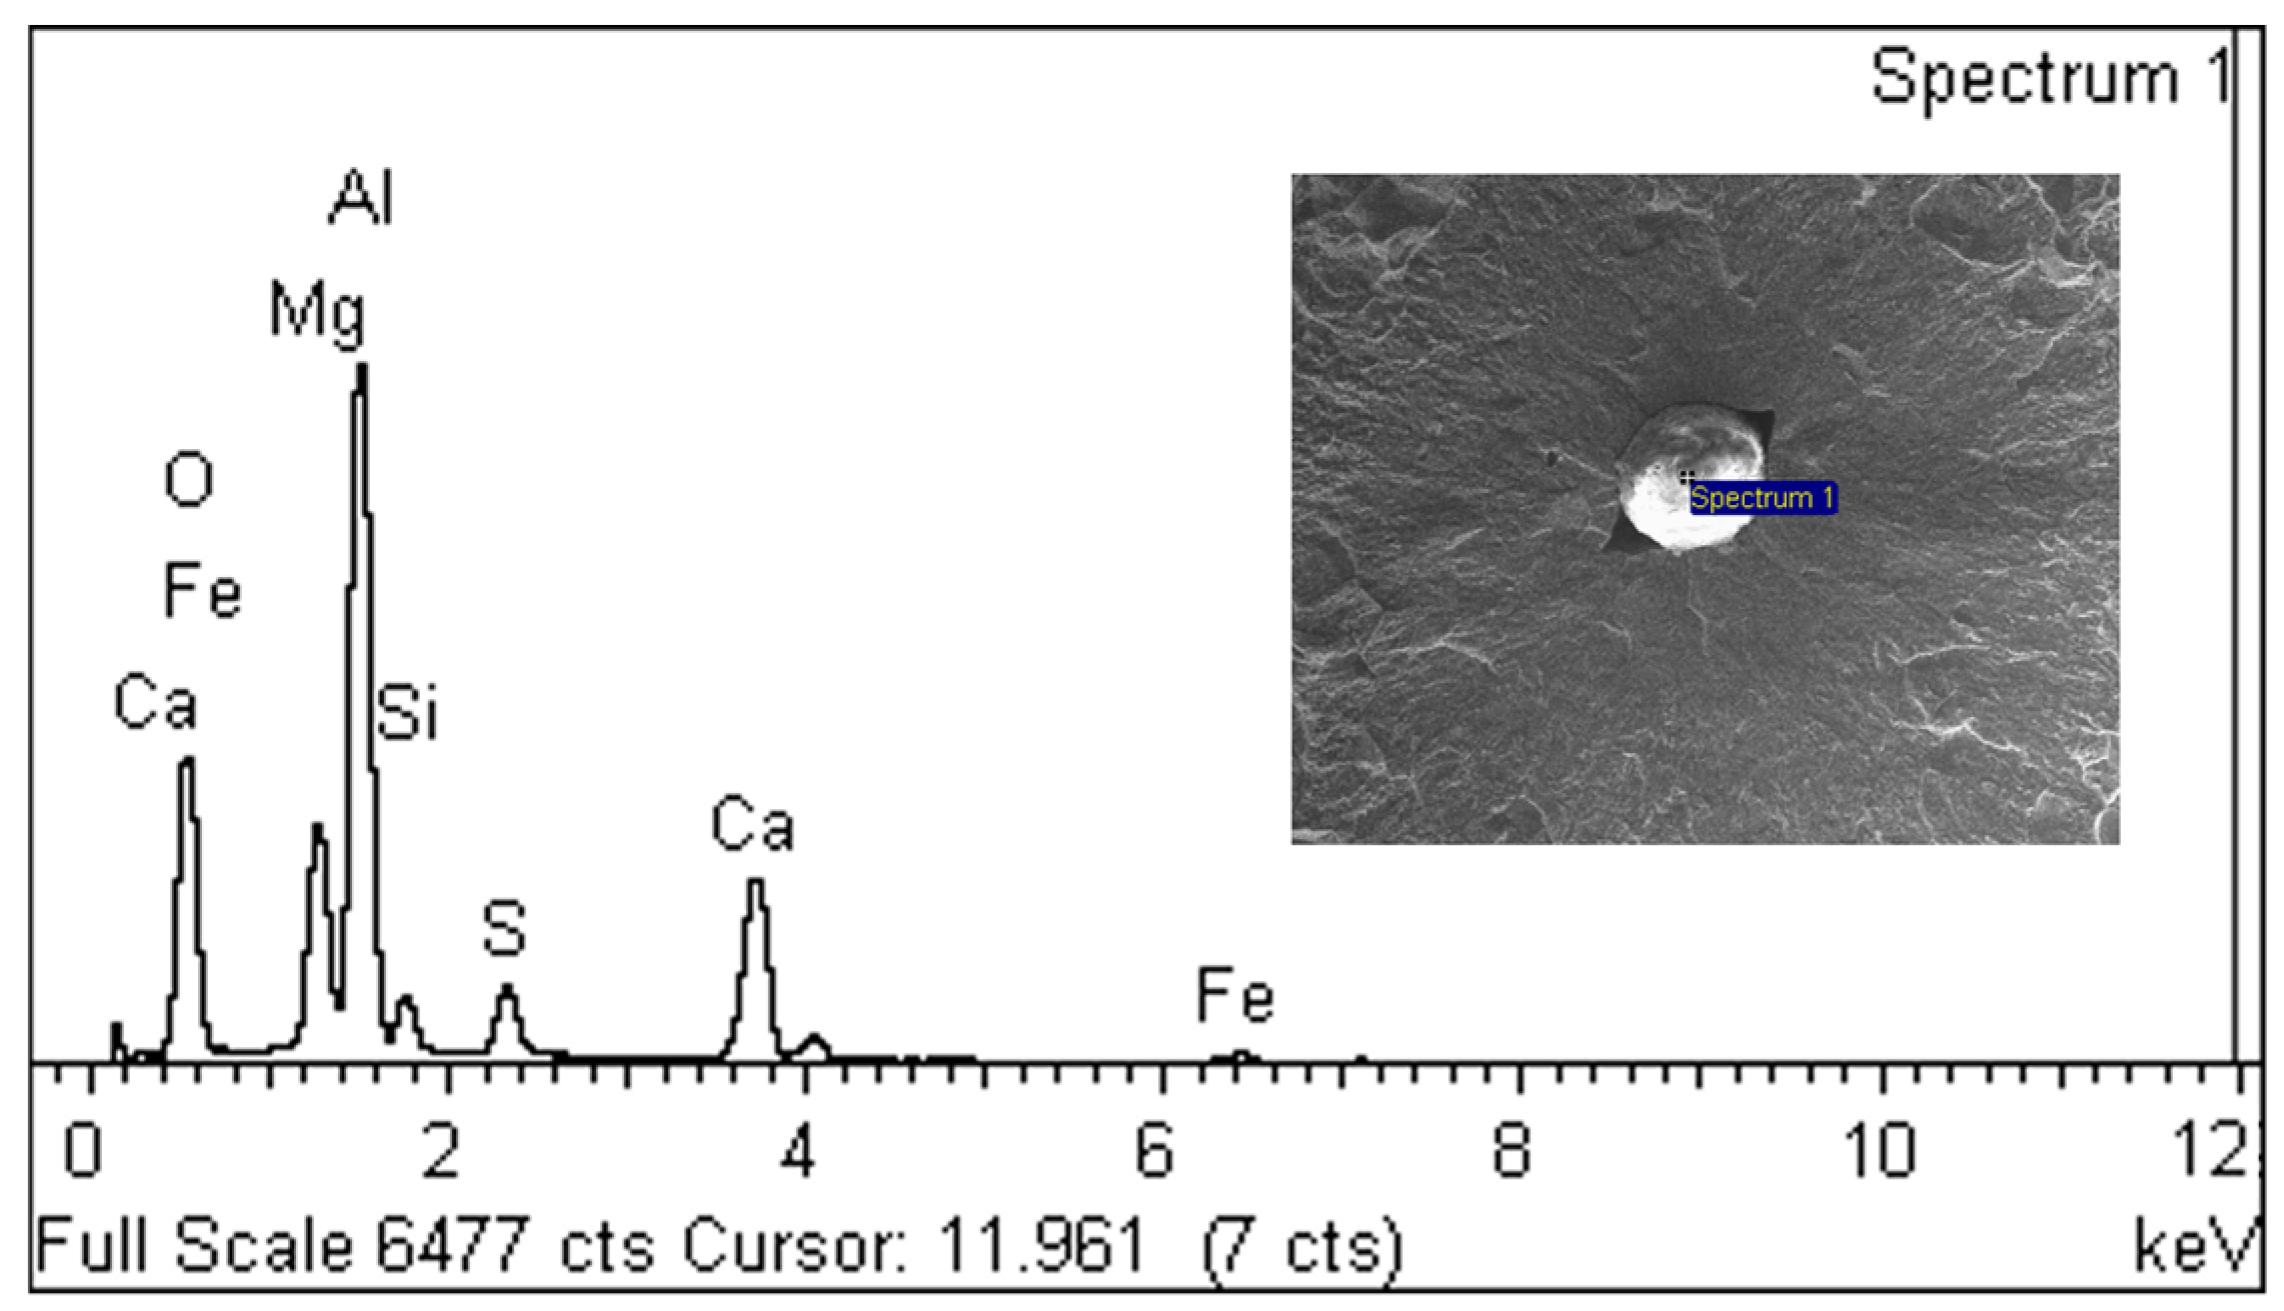
Fractography observation reveals that the failure originates from surface defects at LCF regimes and interior inclusions at HCF/VHCF regimes, showing a typical pattern containing FGA, fish-eye, and outer perimeter zones, which exhibit different surface roughness values as evidenced by both SEM and AFM.
(3)
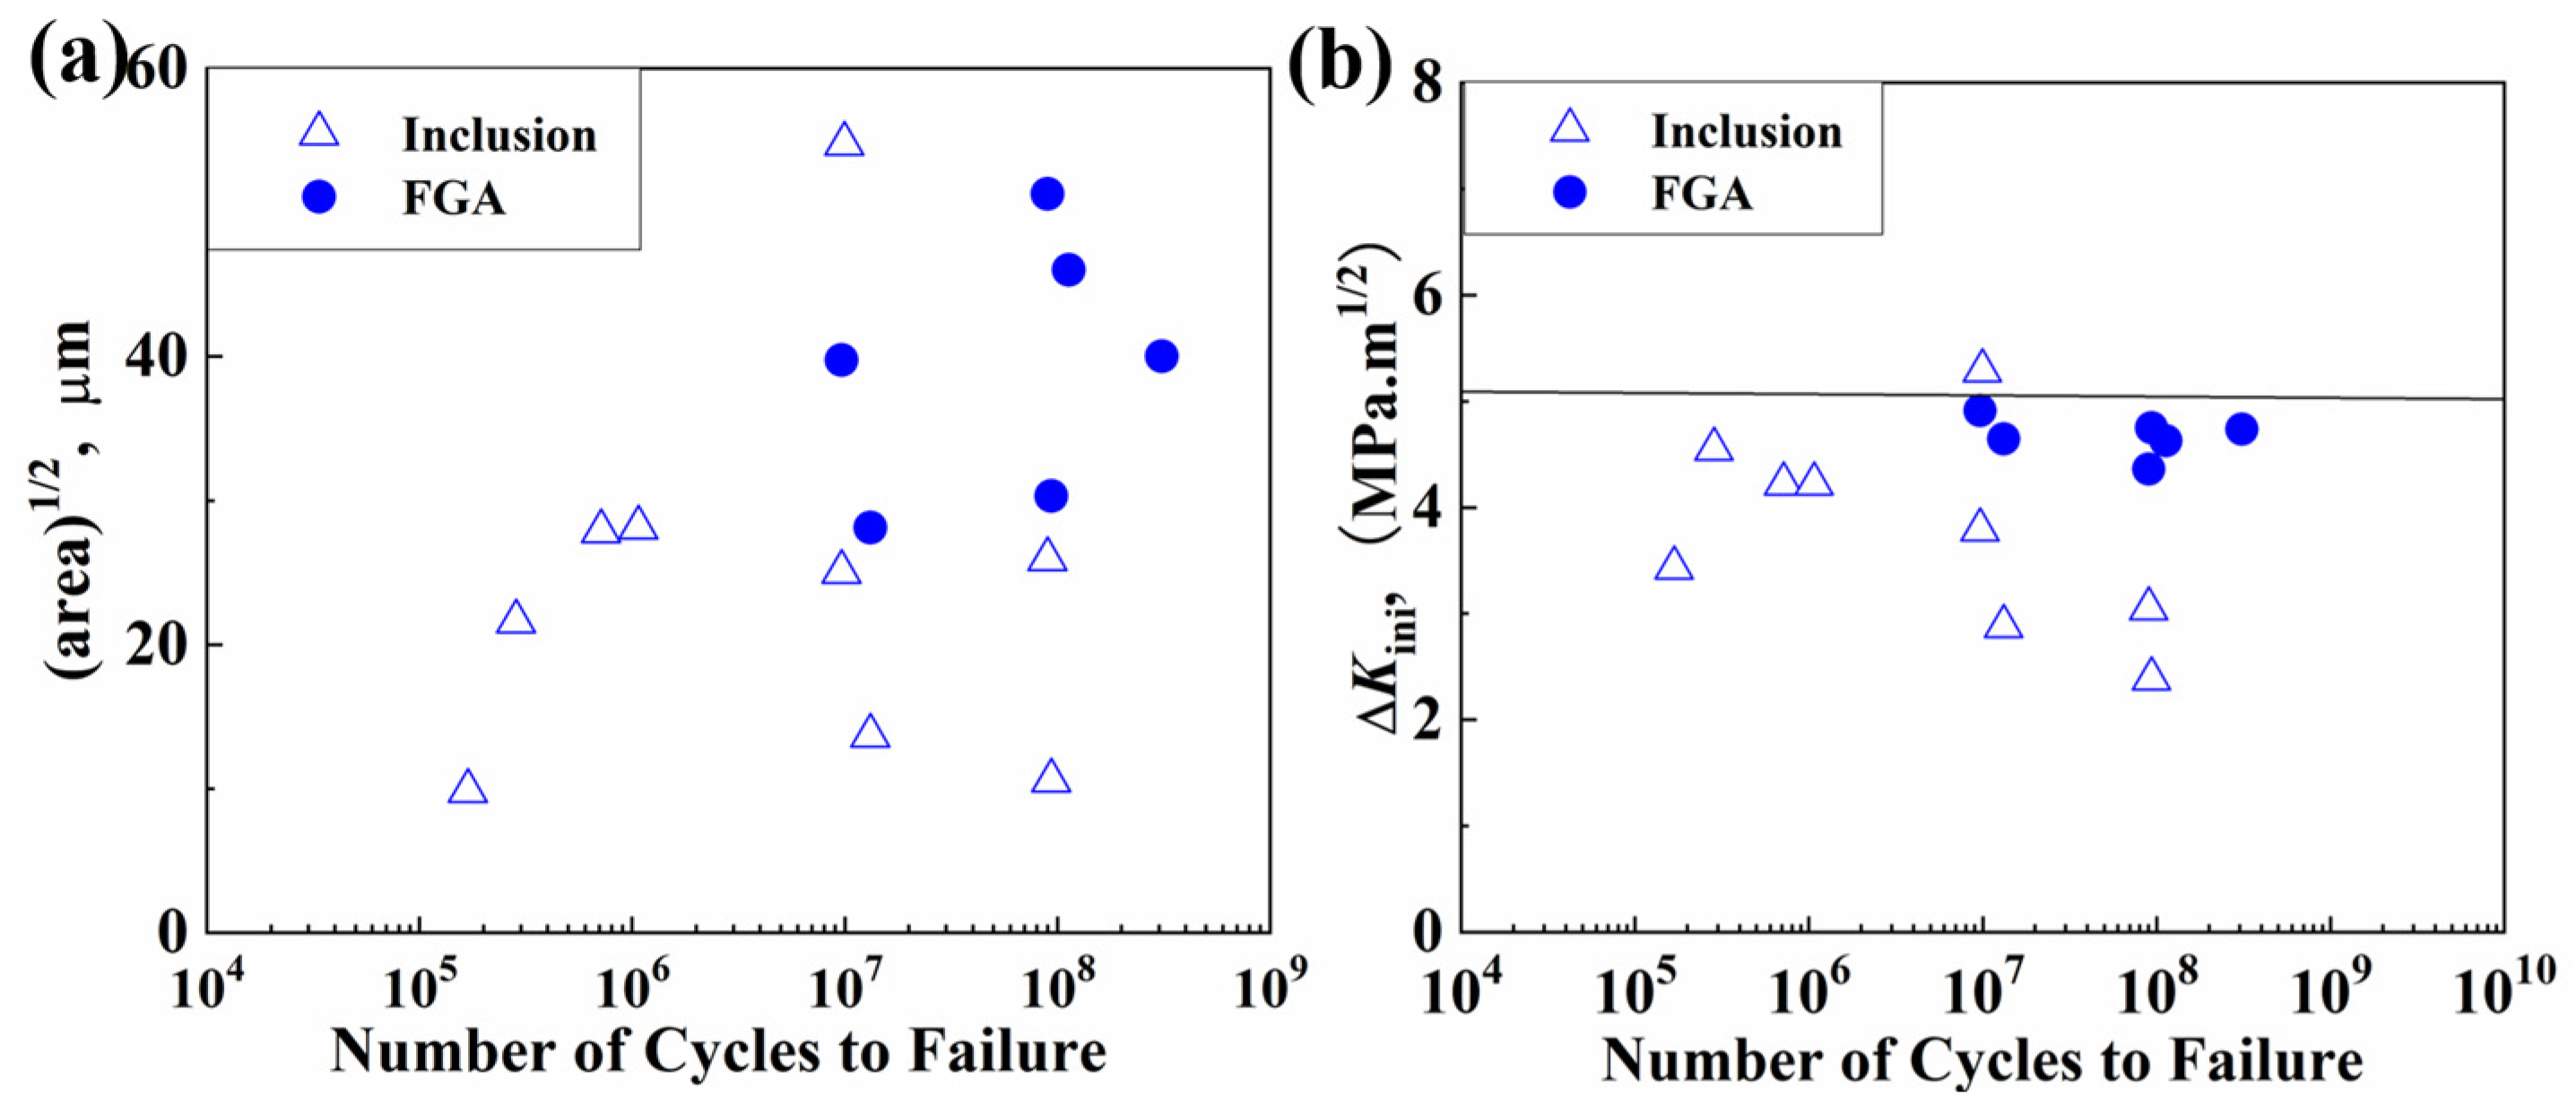
It is shown that the inclusion size is randomly distributed in the range from 10 μm to 55 μm, while that of the FGA is in the range from 30 μm to 50 μm. In addition, an FGA does not occur in the presence of very large inclusions. On the contrary, an FGA still occurs around large prior austenite grains even if there are no inclusions.
(4)
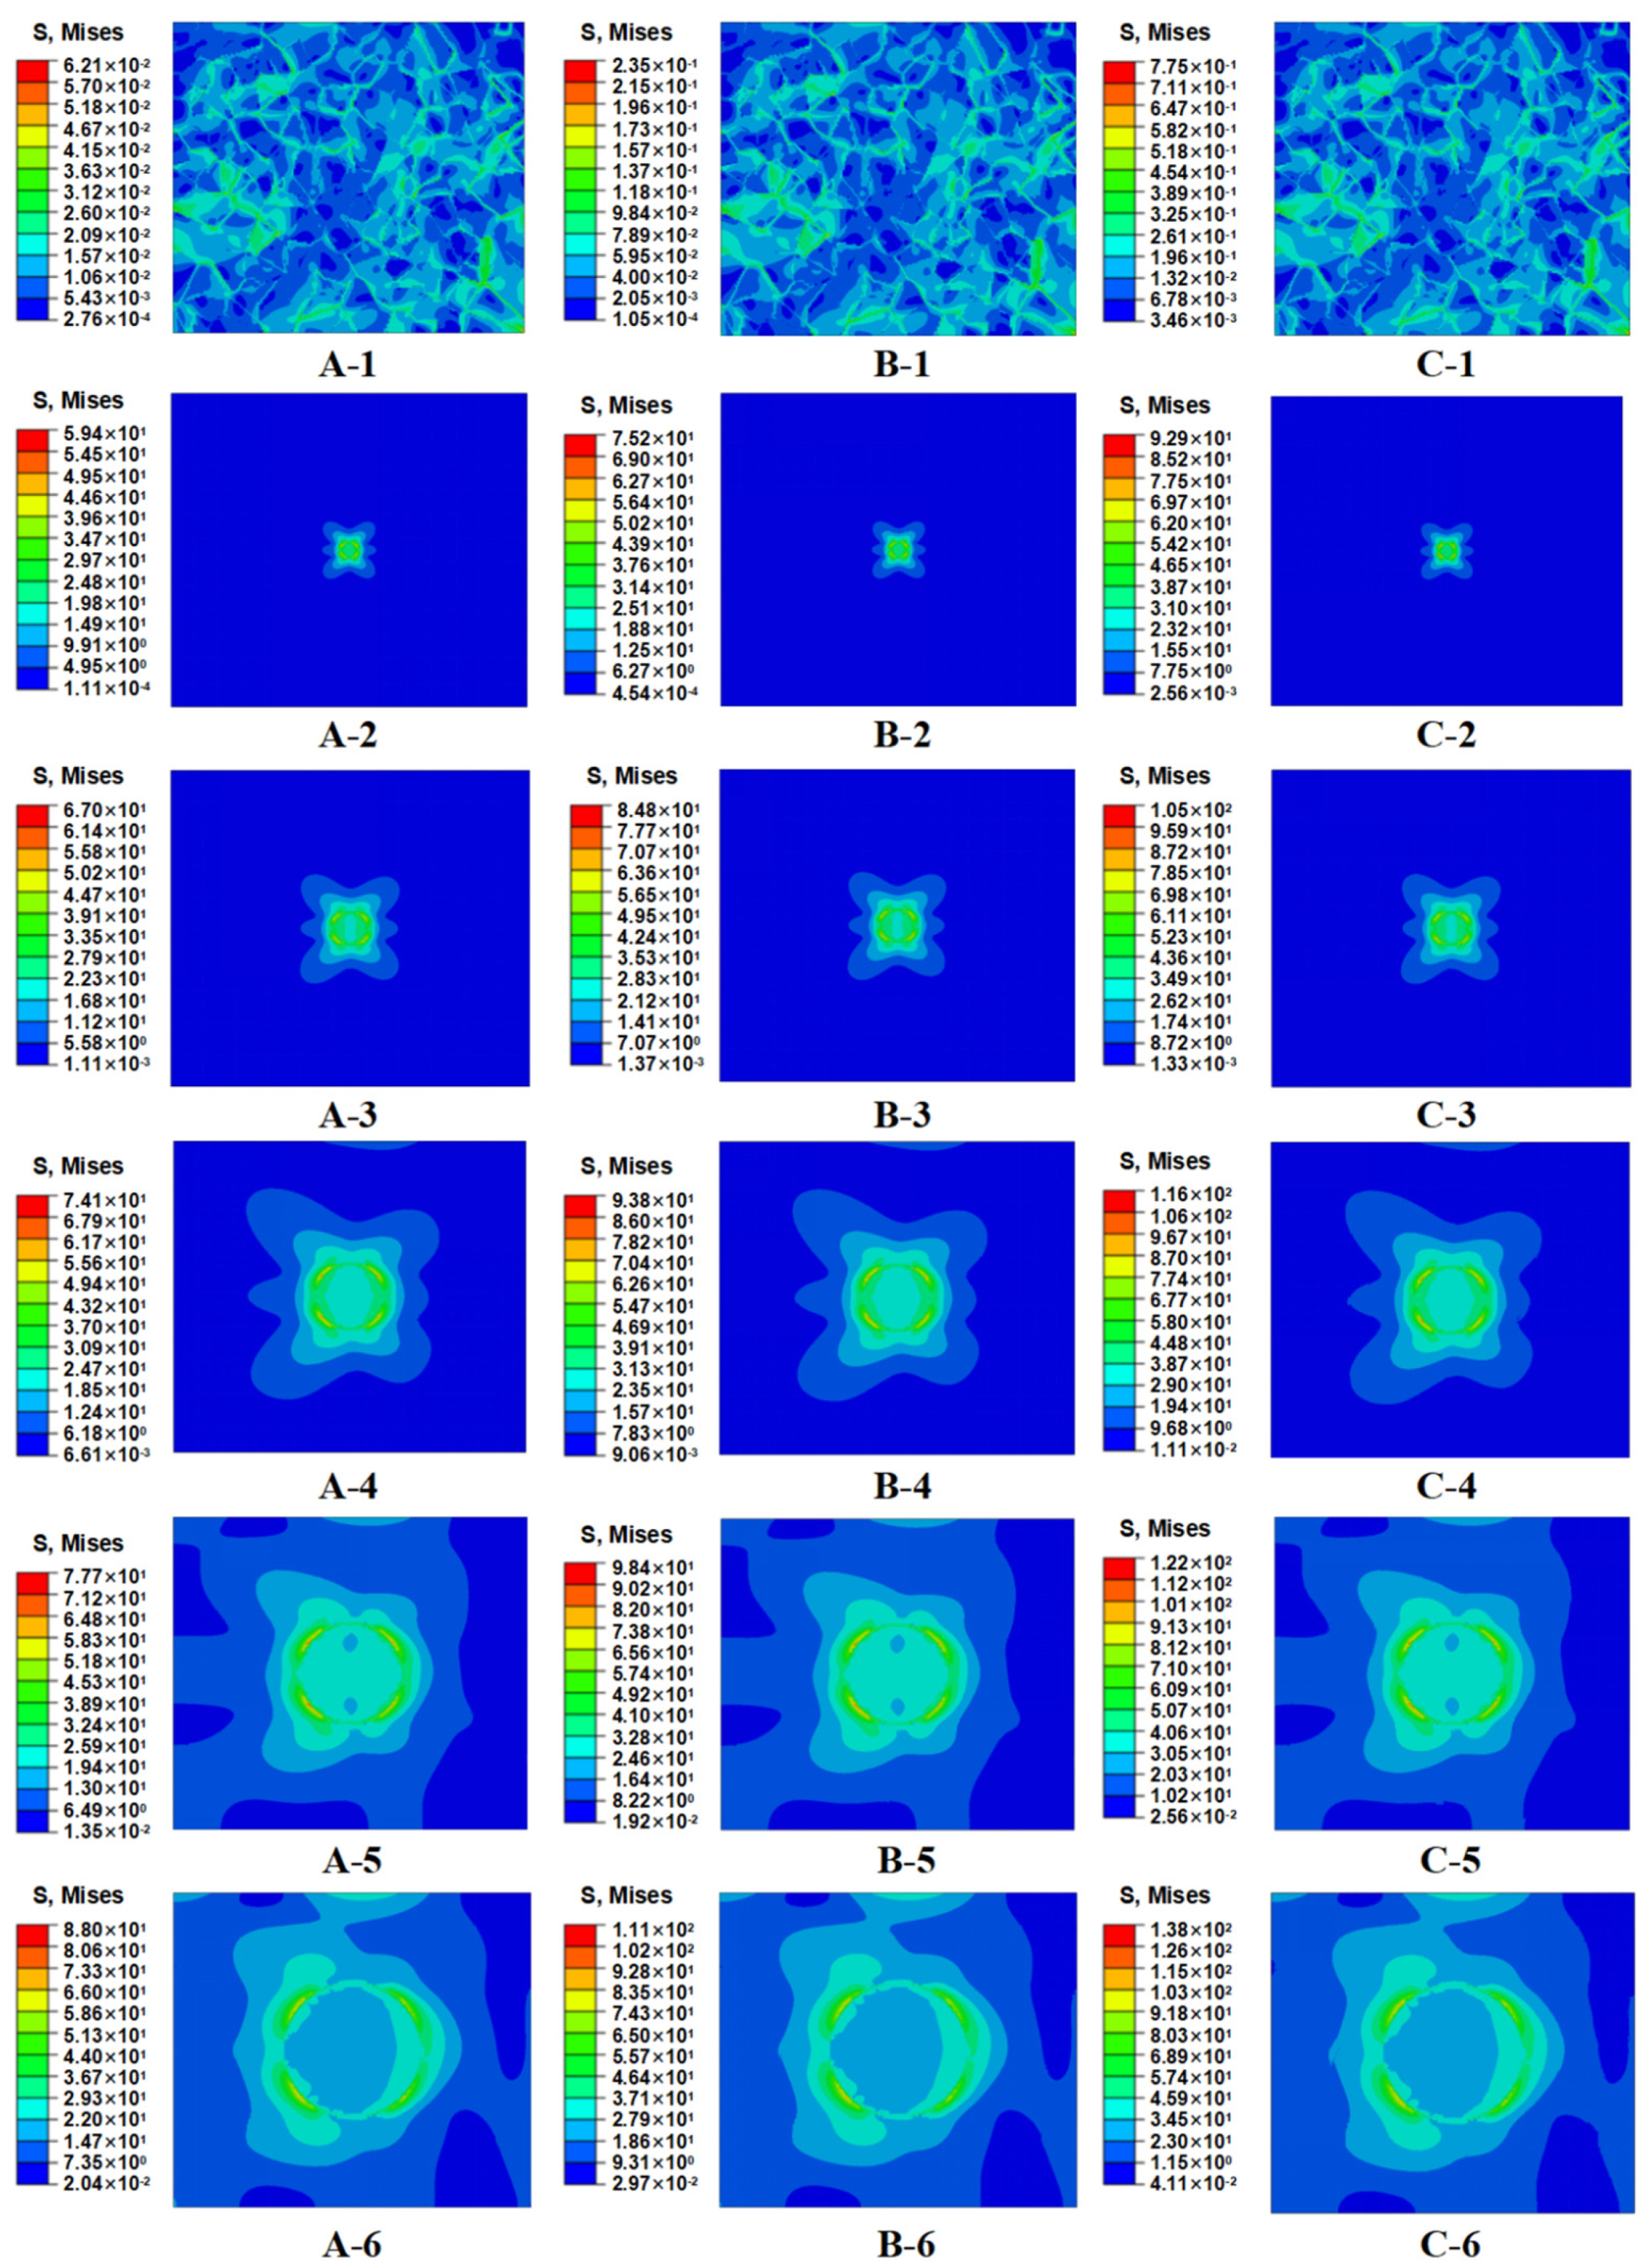
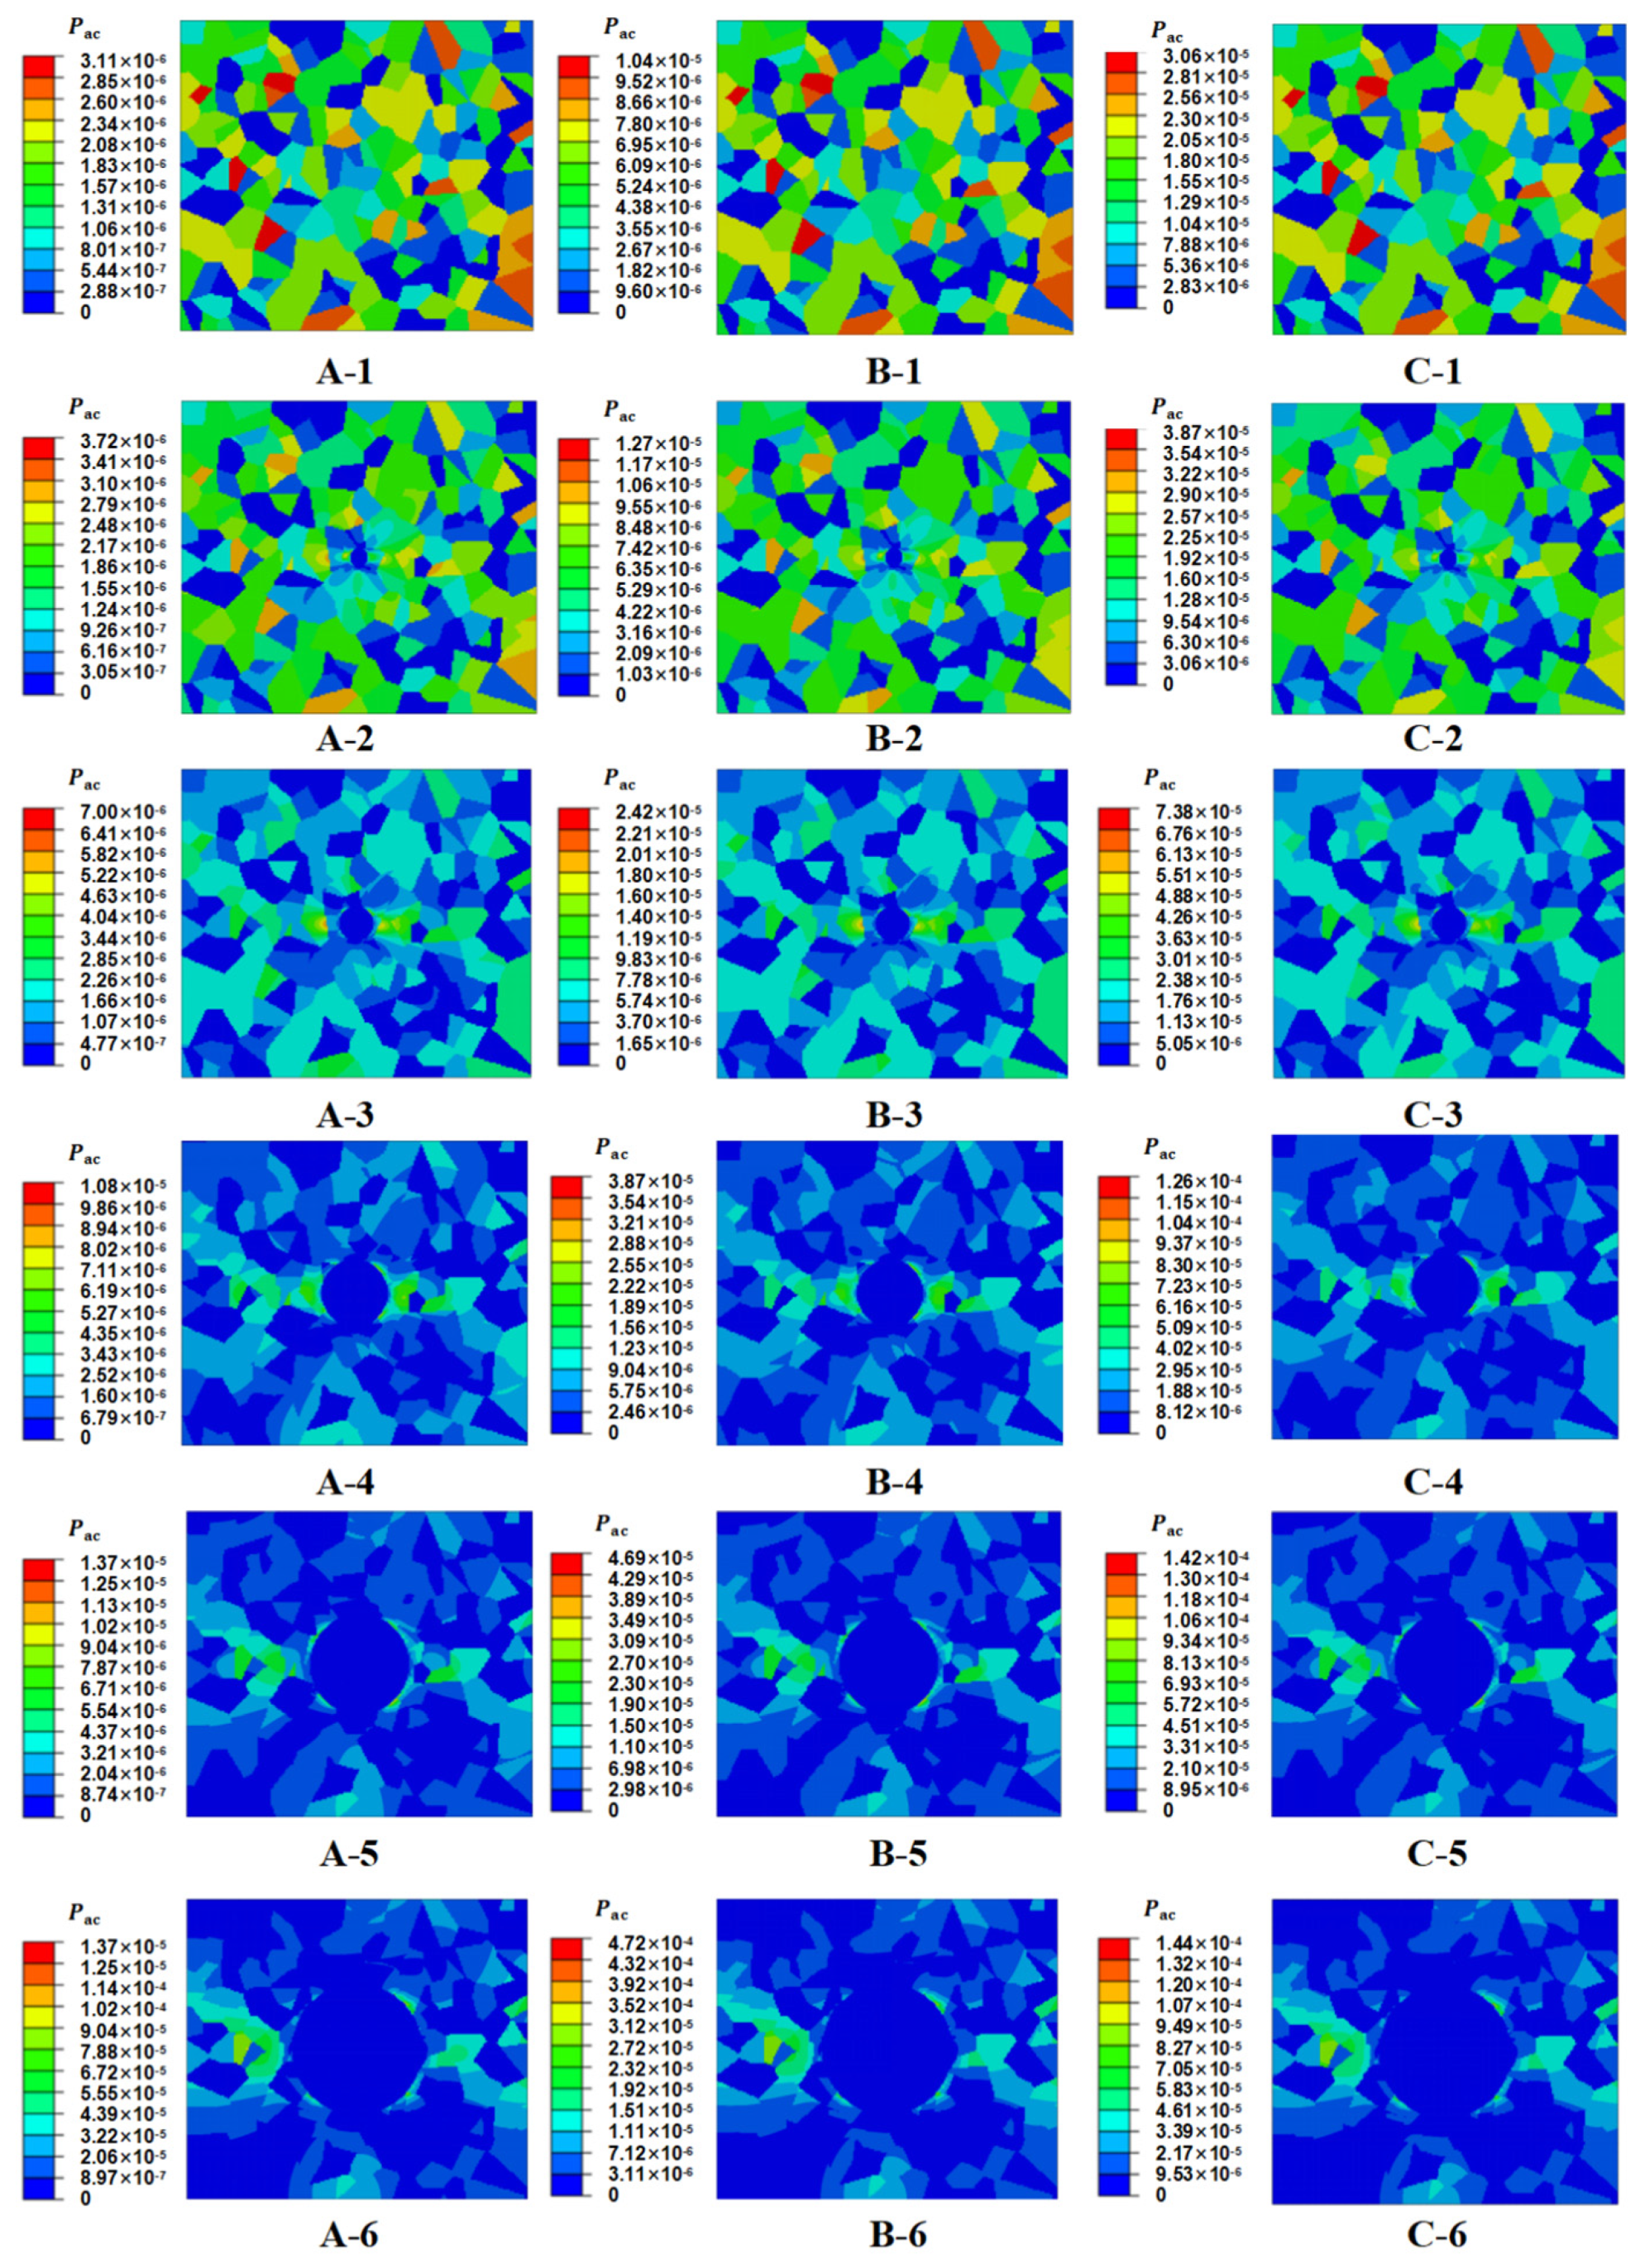
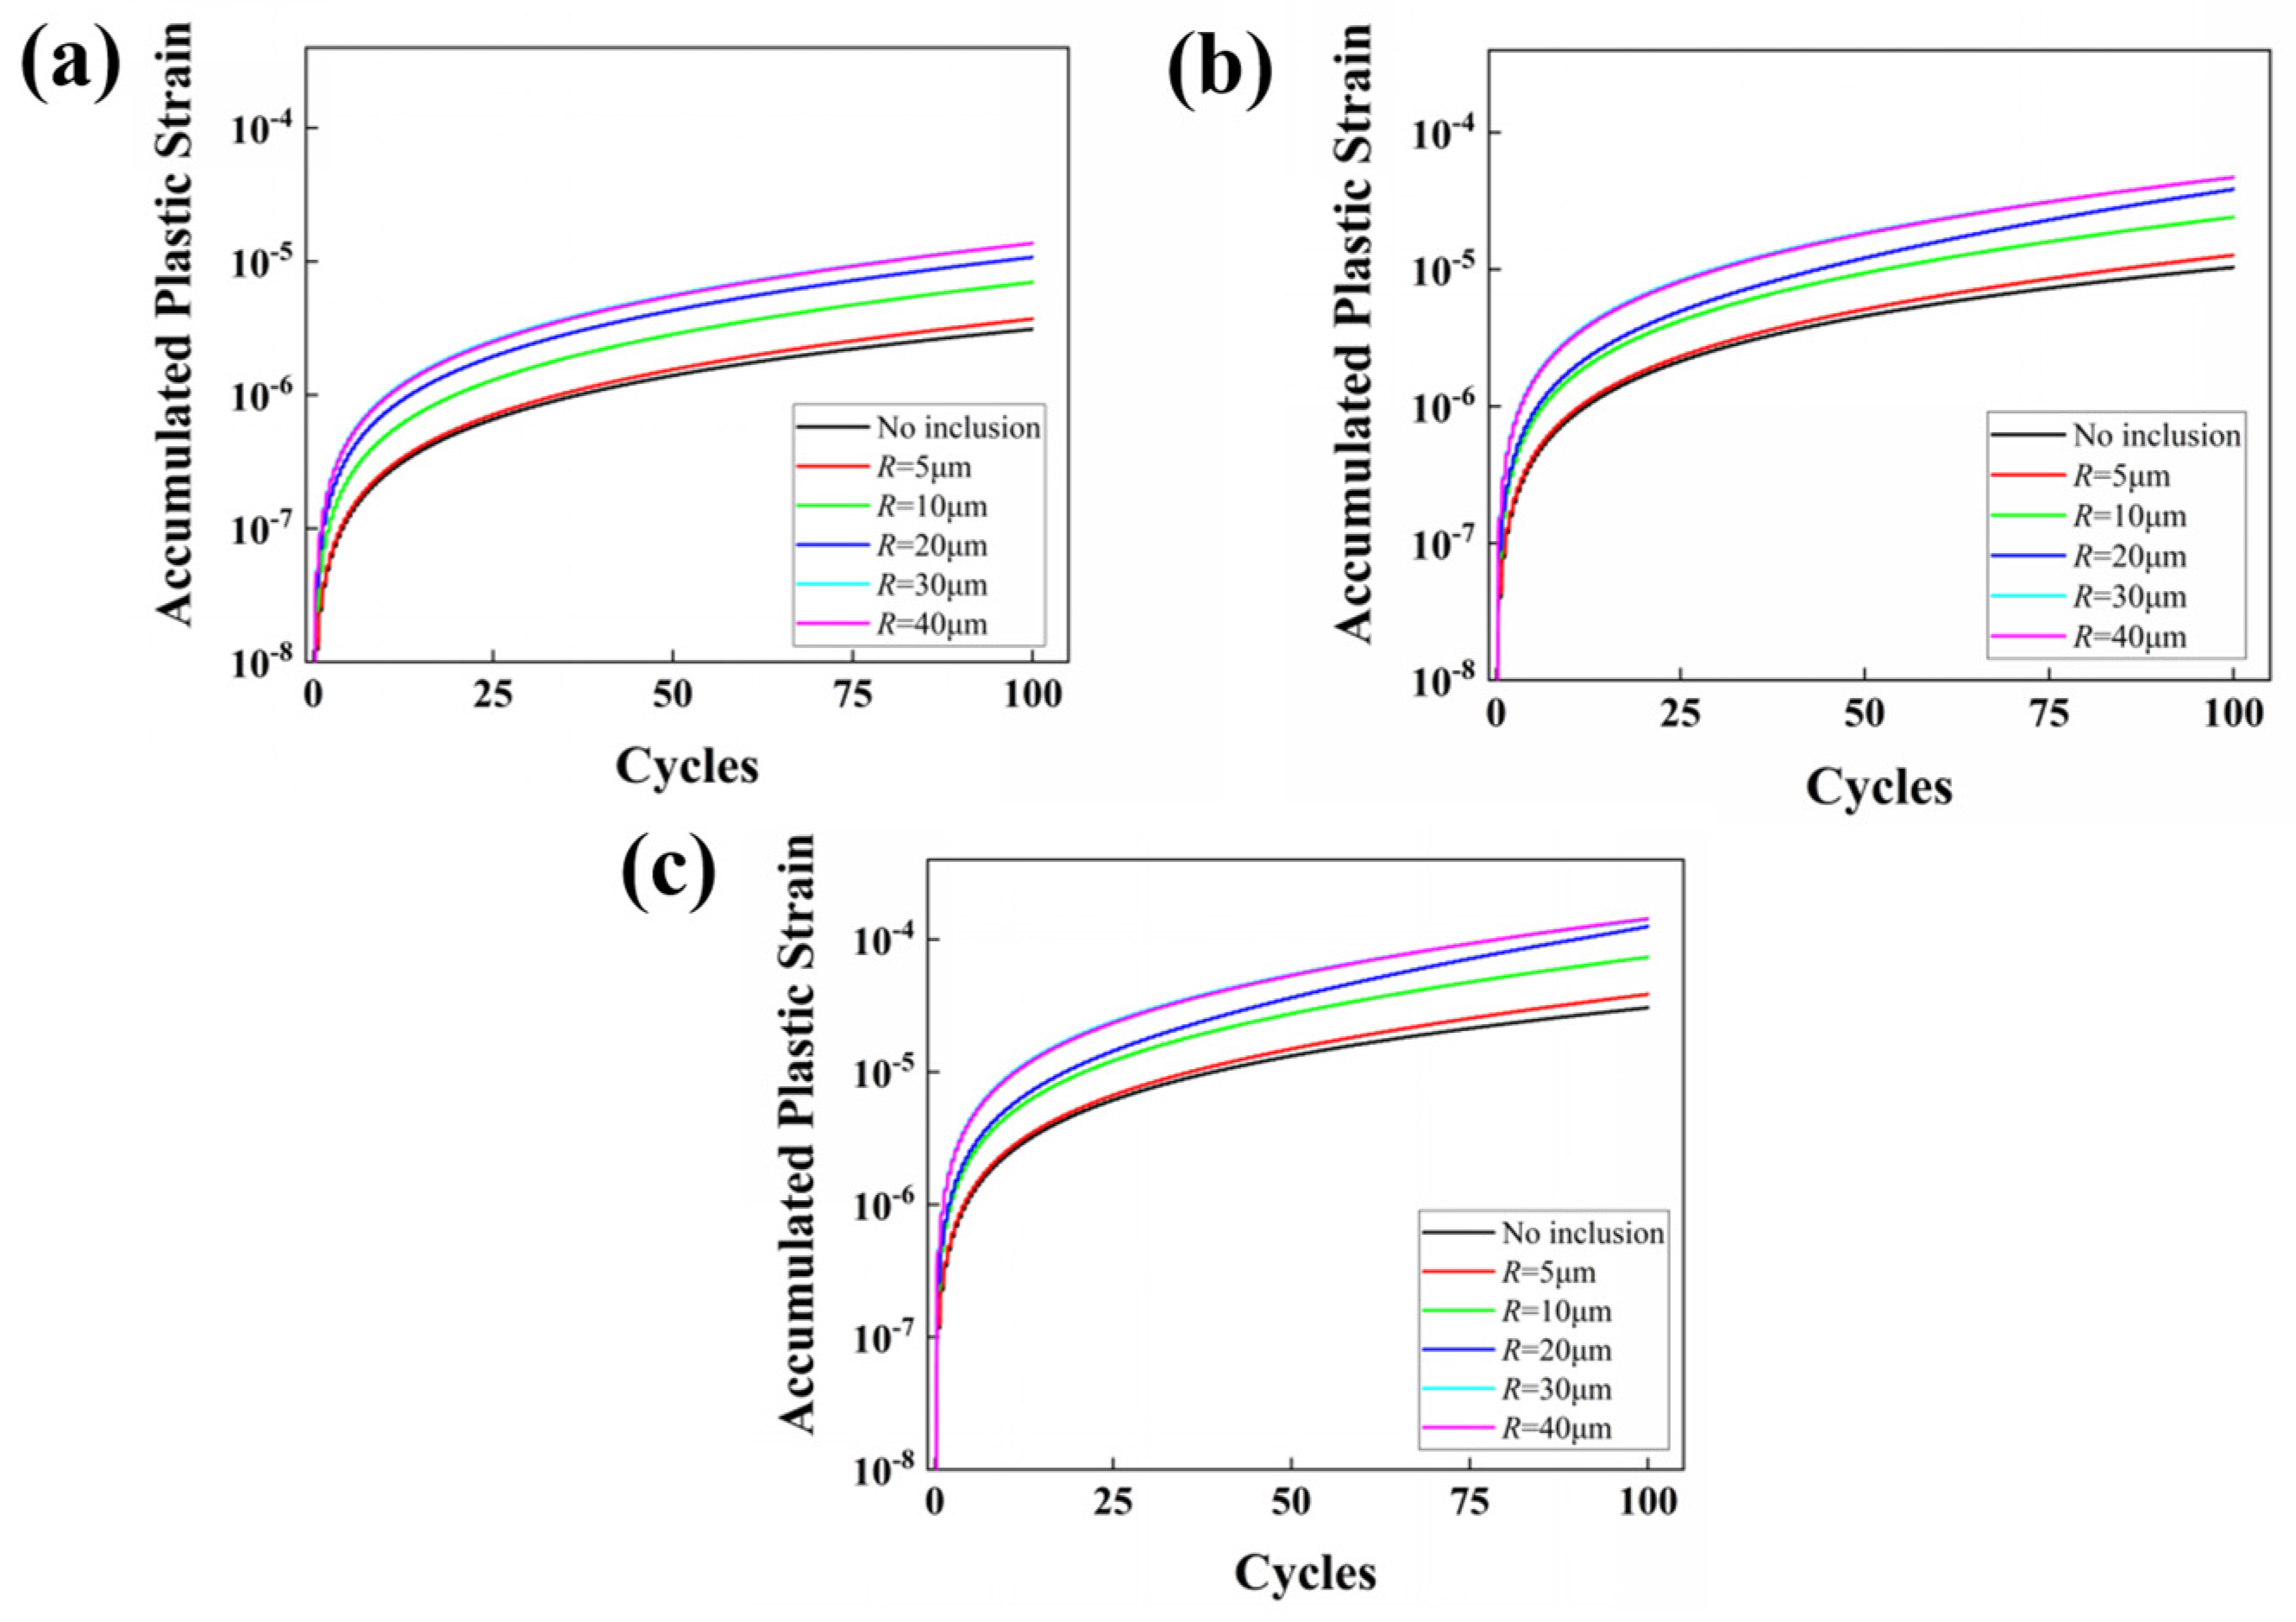
The distribution of local residual stress and accumulated plastic strain after 100 cycles of loading for six different inclusion sizes under three different loading amplitudes is calculated by 2D CPFEM, and the results are adopted to interpret the influences of inclusion size. The value of accumulated plastic strain around different inclusion sizes also resembles the crack nucleation or propagation of materials. The plastic strain accumulated around smaller inclusions resembles the damage process of an FGA, while that around larger inclusion resembles the crack propagation process of a fish-eye zone. The Pac around smaller inclusions are very small, suggesting that the crack nucleation process is very slow in the FGA zone, while the Pac around large inclusions is very large, suggesting that the crack propagation rate is very fast in the fish-eye zone.
(5)
The accumulated plastic strain after 100 cycles of loading calculated by 2D CPFEM reveals that inclusions smaller than 5 μm have little influence on fatigue lifetimes, while inclusions larger than 10 μm have significant influences on fatigue lifetimes. This conclusion can be evidenced by the experimental results. During fractography observation, it is also seen that the inclusion acting as a failure originating site is seldom smaller than 10 μm, while prior austenite grains could also act as the originating source of failure when inclusion is absent. The simulation and experimental results could provide a solid suggestion for critical inclusion size control during the steel formation process.

Author Contributions

Y.Z.: Conceptualization, Methodology, Writing—Original Draft Preparation. G.R.: Experiments, Software. L.C.: Methodology, Funding Acquisition, Writing—Review and Editing. G.G.: Methodology, Writing—Review and Editing. J.Z.: Methodology, Software. A.Z.: Writing—Review and Editing. All authors have read and agreed to the published version of the manuscript.

Funding

The project is supported by the Science and Technology Research Project of China Railway Co. Ltd. (N2023G065) and the Research Project of China Academy of Railway Sciences Corporation Limited (2023YJ271).

Data Availability Statement

The data that support the findings of this study are available from the corresponding author upon reasonable request.

Acknowledgments

The authors would like to thank the editor, associate editor, and the anonymous reviewers for their helpful comments and suggestions that have improved this paper.

Conflicts of Interest

Author Yingxin Zhao, Guoqiang Ren, Liming Chen were employed by the company Standards & Metrology Research Institute, China Academy of Railway Sciences Corporation Limited. The remaining authors declare that the research was conducted in the absence of any commercial or financial relationships that could be construed as a potential conflict of interest. This study received funding from Science and Technology Research Project of China Railway Co. Ltd. (N2023G065) and the Research Project of China Academy of Railway Sciences Corporation Limited (2023YJ271). The funder had the following involvement with the study: Methodology, Funding Acquisition, Writing—Review and Editing.

References

  1. Sabrina, V.; Camilla, R.; Daniela, S.; Andrea, Z.; Lucas, C.A.; José, A.A. Influence of non-metallic inclusions on the high cycle fatigue strength of steels. Int. J. Fatigue 2022, 154, 106553. [Google Scholar]
  2. Yukitaka, M.; Toshio, T.; Kentaro, W.; Hisao, M. Essential structure of S-N curve: Prediction of fatigue life and fatigue limit of defective materials and nature of scatter. Int. J. Fatigue 2021, 146, 106138. [Google Scholar]
  3. Schuller, R.; Fitzka, M.; Irrasch, D.; Tran, D.; Pennings, B.; Mayer, H. VHCF properties of nitrided 18Ni maraging steel thin sheets with different Co and Ti content. Fatigue Fract. Eng. Mater. Struct. 2015, 38, 518–527. [Google Scholar]
  4. Gu, C.; Bao, Y.-P.; Lin, L. Cleanliness distribution of high-carbon chromium bearing steel billets and growth behavior of inclusions during solidification. Rev. Met. 2017, 53, e089. [Google Scholar]
  5. Cai, X.-F.; Bao, Y.-P.; Wang, M.; Lin, L.; Dai, N.-C.; Gu, C. Investigation of precipitation and growth behavior of Ti inclusions in tire cord steel. Metall. Res. Technol. 2015, 112, 407. [Google Scholar]
  6. Murakami, Y.; Endo, M. Effects of defects, inclusions and inhomogeneities on fatigue strength. Int. J. Fatigue 1994, 16, 163–182. [Google Scholar]
  7. Murakami, Y. Metal Fatigue: Effects of Small Defects and Nonmetallic Inclusions; Elsevier: London, UK, 2002. [Google Scholar]
  8. Furuya, Y.; Hirukawa, H.; Kimura, T.; Hayaishi, M. Gigacycle fatigue properties of high strength steels according to inclusion and ODA sizes. Metall. Mater. Trans. A 2007, 38, 1722–1730. [Google Scholar]
  9. Lu, L.T.; Zhang, J.W.; Shiozawa, K. Influence of inclusion size on S-N curve characteristics of high-strength steels in the giga-cycle fatigue regime. Fatigue Fract. Eng. Mater. Struct. 2009, 32, 647–655. [Google Scholar]
  10. Zhao, A.; Xie, J.; Sun, C.; Lei, Z.; Hong, Y. Effects of strength level and loading frequency on very-high-cycle fatigue behavior for a bearing steel. Int. J. Fatigue 2012, 38, 46–56. [Google Scholar]
  11. Zhao, A.G.; Xie, J.J.; Sun, C.Q.; Lei, Z.Q.; Hong, Y.S. Prediction of threshold value for FGA formation. Mater. Sci. Eng. A 2011, 528, 6872–6877. [Google Scholar]
  12. Deng, H.L.; Liu, Q.C.; Liu, H.; Yu, H. Long-Life Fatigue of Carburized 12Cr2Ni Alloy Steel: Evaluation of Failure Characteristic and Prediction of Fatigue Strength. Metals 2018, 8, 1006. [Google Scholar] [CrossRef]
  13. Xing, Z.G.; Wang, Z.Y.; Wang, H.D.; Shan, D.B. Bending Fatigue Behaviors Analysis and Fatigue Life Prediction of 20Cr2Ni4 Gear Steel with Different Stress Concentrations near Non-metallic Inclusions. Materials 2019, 12, 3443. [Google Scholar] [CrossRef]
  14. An, X.; Shi, Z.; Xu, H.; Wang, C.; Wang, Y.; Cao, W.; Yu, J. Quantitative Examination of the Inclusion and the Rotated Bending Fatigue Behavior of SAE52100. Metals 2021, 11, 1502. [Google Scholar] [CrossRef]
  15. Fan, Y.; Gui, X.; Liu, M.; Wang, X.; Feng, C.; Gao, G. High-Cycle Fatigue Life and Strength Prediction for Medium-Carbon Bainitic Steels. Metals 2022, 12, 856. [Google Scholar] [CrossRef]
  16. Michael, H.; Michael, S.; Stefan, F. Fatigue strength study based on geometric shape of bulk defects in cast steel. Int. J. Fatigue 2022, 163, 107082. [Google Scholar]
  17. Benedetti, M.; Santus, C.; Raghavendra, S.; Lusuardi, D.; Zanini, F.; Carmignato, S. Multiaxial plain and notch fatigue strength of thick-walled ductile cast iron EN-GJS-600-3: Combining multiaxial fatigue criteria, theory of critical distances, and defect sensitivity. Int. J. Fatigue 2022, 156, 106703. [Google Scholar]
  18. Tanaka, K.; Akiniwa, Y. Fatigue crack propagation behaviour derived from S-N data in very high cycle regime. Fatigue Fract. Eng. Mater. Struct. 2002, 25, 775–784. [Google Scholar]
  19. Chapetti, M.D.; Tagaw, T.; Miyata, T. Ultra-long cycle fatigue of high-strength carbon steels part II: Estimation of fatigue limit for failure from internal inclusions. Mater. Sci. Eng. A 2003, 356, 236–244. [Google Scholar]
  20. Paolino, D.S.; Tridello, A.; Chiandussi, G.; Rossetto, M. Estimation of P-S-N curves in very-high-cycle fatigue: Statistical procedure based on a general crack growth rate model. Fatigue Fract. Eng. Mater. Struct. 2018, 41, 718–726. [Google Scholar]
  21. Deng, H.L.; Liu, B.; Guo, Y.; Guo, Y.P.; Yu, H. Effect of local equivalent stress on fatigue life prediction of carburized Cr-Ni alloy steel based on evaluation of maximum crack sizes. Eng. Fract. Mech. 2021, 248, 107718. [Google Scholar]
  22. Murakami, Y.; Yokoyama, N.N.; Nagata, J. Mechanism of fatigue failure in ultralong life regime. Fatigue Fract. Eng. Mater. Struct. 2002, 25, 735–746. [Google Scholar]
  23. Murakami, Y.; Nomoto, T.; Ueda, T. Factors influencing the mechanism of superlong fatigue failure in steels. Fatigue Fract. Eng. Mater. Struct. 1999, 22, 581–590. [Google Scholar]
  24. Zhu, M.L.; Jin, L.; Xuan, F.Z. Fatigue life and mechanistic modeling of interior microdefect induced cracking in high cycle and very high cycle regimes. Acta Mater. 2018, 157, 259–275. [Google Scholar]
  25. Al-Tameemi, H.A.; Long, H.; Dwyer-Joyce, R.S. Initiation of sub-surface micro-cracks and white etching areas from debonding at non-metallic inclusions in wind turbine gearbox bearing. Wear 2018, 406–407, 22–32. [Google Scholar]
  26. Vegter, E.; Krock, H.; Kadin, Y.; Ocelík, V. Nonmetallic Inclusion Bonding in Bearing Steel and the Initiation of White-Etching Cracks. In 11th International Symposium on Rolling Bearing Steels: Progress in Bearing Steel Technologies and Bearing Steel Quality Assurance; ASTM International: West Conshohocken, PA, USA, 2017; Volume 11, pp. 519–532. [Google Scholar]
  27. Nikolic, K.; De Wispelaere, J.; Ravi, G.; Hertelé, S.; Depover, T.; Verbeken, K.; Petrov, R.H. Confirming Debonding of Non-Metallic Inclusions as an Important Factor in Damage Initiation in Bearing Steel. Metals 2023, 13, 1113. [Google Scholar] [CrossRef]
  28. Yves, N. Fatigue from Defect: Influence of Size, Type, Position, Morphology and Loading. Int. J. Fatigue 2022, 154, 106531. [Google Scholar]
  29. Kerscher, E.; Lang, K.-H.; Löhe, D. Increasing the Fatigue Limit of a High-Strength Bearing Steel by Thermomechanical Treatment. Mater. Sci. Eng. A 2008, 483–484, 415–417. [Google Scholar]
  30. Guan, J.; Wang, L.; Zhang, C.; Ma, X. Effects of Non-Metallic Inclusions on the Crack Propagation in Bearing Steel. Tribol. Int. 2017, 106, 123–131. [Google Scholar]
  31. Moshtaghi, M.; Safyari, M. Effect of Work-Hardening Mechanisms in Asymmetrically Cyclic-Loaded Austenitic Stainless Steels on Low-Cycle and High-Cycle Fatigue Behavior. Steel Res. Int. 2021, 92, 2000242. [Google Scholar]
  32. Spriestersbach, D.; Grad, P.; Kerscher, E. Influence of different non-metallic inclusion types on the crack initiation in high-strength steels in the VHCF regime. Int. J. Fatigue 2014, 64, 114–120. [Google Scholar]
  33. Zhao, P.; Wang, X.R.; Yan, E.; Misra, R.D.K.; Du, C.M.; Du, F. The influence of inclusion factors on ultra-high cyclic deformation of a dual phase steel. Mater. Sci. Eng. A 2019, 754, 275–281. [Google Scholar]
  34. Shi, Y.; Yang, D.D.; Yang, X.G.; Miao, G.L.; Shi, D.Q.; Li, S.L.; Hu, X.A.; Liu, F.C.; Huang, W.Q. The effect of inclusion factors on fatigue life and fracture-mechanics-based life method for a P/M superalloy at elevated temperature. Int. J. Fatigue 2020, 131, 105365. [Google Scholar]
  35. Driss, E.K.; Franck, M.; Nicolas, S.; Daniel, B.; Pierre, O.; Viet-Duc, L. Probabilistic modeling of the size effect and scatter in High Cycle Fatigue using a Monte-Carlo approach: Role of the defect population in cast aluminum alloys. Int. J. Fatigue 2021, 147, 106177. [Google Scholar]
  36. Shi, Z.; Li, J.; Zhang, X.; Shang, C.; Cao, W. Influence Mechanisms of Inclusion Types on Rotating Bending Fatigue Properties of SAE52100 Bearing Steel. Materials 2022, 15, 5037. [Google Scholar] [CrossRef]
  37. Guerchais, R.; Morel, F.; Saintier, N. Effect of defect size and shape on the high-cycle fatigue behavior. Int. J. Fatigue 2017, 100, 530–539. [Google Scholar]
  38. Przybyla, C.P.; McDowell, D.L. Microstructure-sensitive extreme value probabilities for high cycle fatigue of Ni-base superalloy IN100. Int. J. Plast. 2010, 26, 372–394. [Google Scholar]
  39. Przybyla, C.P.; Musinski, W.D.; Castelluccio, G.M.; McDowell, D.L. Microstructure-sensitive HCF and VHCF simulations. Int. J. Fatigue 2013, 57, 9–27. [Google Scholar]
  40. Musinski, W.D.; McDowell, D.L. Simulating the effect of grain boundaries on microstructurally small fatigue crack growth from a focused ion beam notch through a three-dimensional array of grains. Acta Mater. 2016, 112, 20–39. [Google Scholar]
  41. Castelluccio, G.M.; McDowell, D.L. Microstructure-sensitive small fatigue crack growth assessment: Effect of strain ratio, multiaxial strain state, and geometric discontinuities. Int. J. Fatigue 2016, 82, 521–529. [Google Scholar]
  42. Gu, C.; Lian, J.H.; Bao, Y.P.; Xie, Q.G.; Münstermann, S. Microstructure-based fatigue modelling with residual stresses: Prediction of the fatigue life for various inclusion sizes. Int. J. Fatigue 2019, 129, 105158. [Google Scholar]
  43. Gu, C.; Lian, J.H.; Bao, Y.P.; Münstermann, S. Microstructure-based fatigue modelling with residual stresses: Prediction of the microcrack initiation around inclusions. Mater. Sci. Eng. A 2019, 751, 133–141. [Google Scholar]
  44. Gu, C.; Lian, J.H.; Bao, Y.P.; Xiao, W.; Münstermann, S. Numerical study of the effect of inclusions on the residual stress distribution in high-strength martensitic steels during cooling. Appl. Sci. 2019, 9, 455. [Google Scholar] [CrossRef]
  45. Cong, T.; Li, R.; Zheng, Z.; Ma, X.; Wu, S.; Zhang, R.; Berto, F.; Sun, J.; Qian, G. Experimental and computational investigation of weathering steel Q450NQR1 under high cycle fatigue loading via crystal plasticity finite element method. Int. J. Fatigue 2022, 159, 106772. [Google Scholar]
  46. Zhang, W.; Hu, Y.; Ma, X.; Qian, G.; Berto, F. Very-high-cycle fatigue behavior of AlSi10Mg manufactured by selected laser melting: Crystal plasticity modeling. Int. J. Fatigue 2021, 145, 106109. [Google Scholar]
Figure 1. The microstructures of materials. (a) Scanning electron microscopy micrographs, (b) atomic force microscopy micrographs.
Metals 14 00948 g001
Figure 2. Geometrical dimensions of specimens used for experiments (dimensions in mm). (a) Uniaxial tensile experiment, (b) rotating bending fatigue tests, and (c) rotating bending fatigue testing machine.
Metals 14 00948 g002
Figure 3. The distribution of prior austenite grains of the testing material. (a) Classical intergranular/transgranular facture zone. (b) The statistical size distribution of prior austenite grains.
Metals 14 00948 g003
Figure 4. CPFEM simulation of RVEs adopted in this study. (a) RVEs with inclusions (210 μm × 185 μm), where adjacent grains are labeled with different colors for distinction. (b) Boundary conditions.
Metals 14 00948 g004
Figure 5. Stress–strain curves of GCr15 specimens under uniaxial tensile loading and the corresponding CPFEM simulations.
Metals 14 00948 g005
Figure 6. S-N plot of the experimental data. Int. and Sur. refer to interior crack initiation and surface crack initiation, respectively. The data with an arrow “→” indicate unbroken specimens.
Metals 14 00948 g006
Figure 7. Typical patterns of fracture surface for interior-induced failure. (a) SEM images and schematic pattern; (b) surface roughness of FGA zone scanned by AFM; (c) surface roughness of fish-eye zone scanned by AFM; (d) surface roughness of outer perimeter of fish-eye zone scanned by AFM.
Metals 14 00948 g007aMetals 14 00948 g007b
Figure 8. Typical morphologies of fracture surface at different loading amplitudes. (a) Stress amplitude σ = 950 MPa, number of cycles to fatigue Nf = 1.688 × 10⁵; (b) σ = 806 MPa, Nf = 9.99 × 10⁶; (c) σ = 810 MPa, Nf = 9.96 × 10⁶; (d) σ = 829 MPa, Nf = 9.38 × 10⁷; (e) σ = 829 MPa, Nf = 9.38 × 10⁷; and (f) σ = 771 MPa, Nf = 3.61 × 10⁸.
Metals 14 00948 g008
Figure 9. Chemical composition analysis of crack-induced inclusion by EDX examination, where the inserted image is a typical inclusion found in the fracture surface.
Metals 14 00948 g009
Figure 10. Statistics of failure initiation sites. (a) Sizes of inclusions and FGA, (b) SIF of inclusions and FGA. The black line denotes the theoretical values of ΔK for FGA suggested by Zhao et al.
Metals 14 00948 g010
Figure 11. The distribution of local residual stress after 100 cycles of loading. (A-1A-6): σmax = 800 MPa; (B-1B-6): σmax = 900 MPa; (C-1C-6): σmax = 1000 MPa.
Metals 14 00948 g011
Figure 12. The distribution of plastic accumulated strain after 100 cycles of loading. (A-1A-6): σmax = 800 MPa; (B-1B-6): σmax = 900 MPa; (C-1C-6): σmax = 1000 MPa.
Metals 14 00948 g012
Figure 13. Accumulation of plastic strain with loading cycles. (a) σmax = 800 MPa; (b) σmax = 900 MPa; (c) σmax = 1000 MPa.
Metals 14 00948 g013
Table 1. Chemical composition of the tested GCr15 steel samples (wt.%).
CCrMnSiPSFe
1.011.450.350.280.0150.01Balance
Table 2. Crystal plasticity model parameters of the GCr15 steel tempered at different temperatures.
Slip Systemnh0 (MPa)τs (MPa)τ0 (MPa)
{110}<111>104901200570
{112}<111>103801100540
Table 3. Stress amplitudes and inclusion sizes of models.
NumberStress Amplitude
σmax (MPa)
Radius
R (μm)
Inclusion Size
(μm)
A-180000
A-258.86
A-31017.72
A-42035.44
A-53053.16
A-64070.88
B-190000
B-258.86
B-31017.72
B-42035.44
B-53053.16
B-64070.88
C-1100000
C-258.86
C-31017.72
C-42035.44
C-53053.16
C-64070.88
Disclaimer/Publisher’s Note: The statements, opinions and data contained in all publications are solely those of the individual author(s) and contributor(s) and not of MDPI and/or the editor(s). MDPI and/or the editor(s) disclaim responsibility for any injury to people or property resulting from any ideas, methods, instructions or products referred to in the content.

