Article

Machine-Learning-Assisted Composition Design for High-Yield-Strength TWIP Steel

1
Department of Metallurgical Technology Research, Central Iron and Steel Research Institute, Beijing 100081, China
2
Beijing Advanced Innovation Center for Materials Genome Engineering, University of Science and Technology, Beijing 100083, China
*
Authors to whom correspondence should be addressed.
Metals 2024, 14(8), 952; https://doi.org/10.3390/met14080952 (registering DOI)
Submission received: 30 July 2024 / Revised: 15 August 2024 / Accepted: 19 August 2024 / Published: 21 August 2024
(This article belongs to the Section Computation and Simulation on Metals)

Abstract

:
Twinning-induced plasticity (TWIP) steel is an ideal material for impact-resistant structures and energy absorption because of its high product of strength and elongation. However, compared with other advanced high-strength steels, the relatively low yield strength of TWIP steel is one of the important shortfalls that significantly limits its engineering applications. To enhance the comprehensive properties of TWIP steel, a machine learning design strategy that integrated comparative modelling, SHAP analysis, and multi-objective optimization were adopted in this study. Initially, various machine learning algorithms were compared for their predictive accuracy based on normalized data (273 entries) regarding the microstructure and properties of TWIP steel. Then, performance prediction models for yield strength, tensile strength, and elongation were established. SHAP analysis was subsequently employed to assess the significance and explicit laws of composition and microstructures in these three target properties, identifying key elements that enhance the overall performance. Furthermore, two new TWIP steels with high yield strengths and high products of strength and elongation were developed via multi-objective optimization. Under conventional hot forging + hot rolling + cold rolling + annealing processes, the two designed TWIP steels had yield strengths of 585 MPa and 560 MPa, tensile strengths of 1055 MPa and 1101 MPa, elongations of 55% and 58.5%, and products of strength and elongation of 58.0 GPa% and 66.4 GPa%, respectively. The yield strengths of the designed TWIP steels significantly improved while maintaining a reasonable product of strength and elongation. This work provides important references for the rational development of new TWIP steels.

1. Introduction

Twinning-induced plasticity (TWIP) steel exhibits an excellent combination of strength and ductility, along with good formability, high strain hardening capacity, and high energy absorption capability. Its excellent comprehensive performance makes it an ideal choice for impact-resistant structures and energy absorption applications across various sectors, including the automotive, military, power, aviation, and oil extraction industries [1,2,3]. However, compared with other advanced high-strength steels, such as dual-phase (DP) steel and quenching and partitioning (QP) steel [4], TWIP steel has a relatively lower yield strength (generally below 500 MPa) at a similar tensile strength level, which significantly limits its engineering applications.
To enhance the yield strength of TWIP steel, researchers have employed strategies such as prestraining, grain refinement, and precipitation hardening. Processes such as prestraining, prestraining followed by recovery, and prestraining combined with partial recrystallization annealing can increase the yield strength of TWIP steel through work-hardening effects, significantly reducing its ductility [5]. Grain refinement is an effective method to increase the yield strength of TWIP steel without significantly compromising its ductility. According to previous research, compared with a grain size of approximately 100 μm, when the grain size is refined to below 3 μm, the yield strengths of Fe-31Mn-3Al-3Si, Fe-18Mn-1.5Al-0.6C, and Fe-22Mn-0.6C TWIP steels can be increased by approximately 200 MPa [6,7,8]. However, in practical industrial production, achieving grain sizes less than 3 μm in TWIP steel through cold rolling and recrystallization annealing processes is an enormous challenge [9]. In contrast, the most effective approach for achieving TWIP steel with a high yield strength, high tensile strength, and elongation is through alloying to refine austenite grains, enhancing solid solution strengthening, and introducing precipitation hardening mechanisms.
In addition to major alloying elements such as Mn, Si, Al, and C, TWIP steels typically incorporate trace elements, including Nb, Cu, Cr, Ni, N, V, Ti, Mo, and B, to enhance their mechanical properties [10,11,12,13,14,15]. Therefore, in the composition design of TWIP steel, comprehensively considering the types, amounts, and interactions of these alloying elements is essential. By optimizing composition, TWIP steels with excellent mechanical properties can be developed. However, owing to the vast composition design space of TWIP steel, general studies have focused predominantly on the effects of a single, or a few, alloying elements on TWIP steel performance [16,17,18,19,20]. The intrinsic relationships among the alloying elements, their interactions, and the mechanical properties of complex multicomponent TWIP steels remain obscure. This results in a lack of effective guidance for the composition design of multicomponent TWIP steels, hindering the rational development of new high-performance TWIP steels.
In recent years, with the rapid development of material genome engineering, data-driven machine learning methods have been successfully applied to the alloy design, process optimization, and performance prediction of various materials, such as steel [21,22,23,24,25], aluminium alloys [26,27], copper alloys [28,29], superalloys [30], and amorphous materials [31]. These methods have significantly shortened the material development cycle and improved research and development efficiency. Therefore, in this study, data on the composition, microstructure, and mechanical properties of TWIP steel were collected from the literature. A machine learning method was employed to accurately predict the mechanical properties of TWIP steel and to identify the key intrinsic factors influencing yield strength, tensile strength, and elongation. A multi-objective optimization design was subsequently conducted within the target composition space via genetic algorithms, and typical composition design schemes were selected for experimental verification. The reliability and optimization effects of the prediction model were analyzed. The results can provide valuable references for the composition design and process optimization of TWIP steels.

2. Materials and Methods

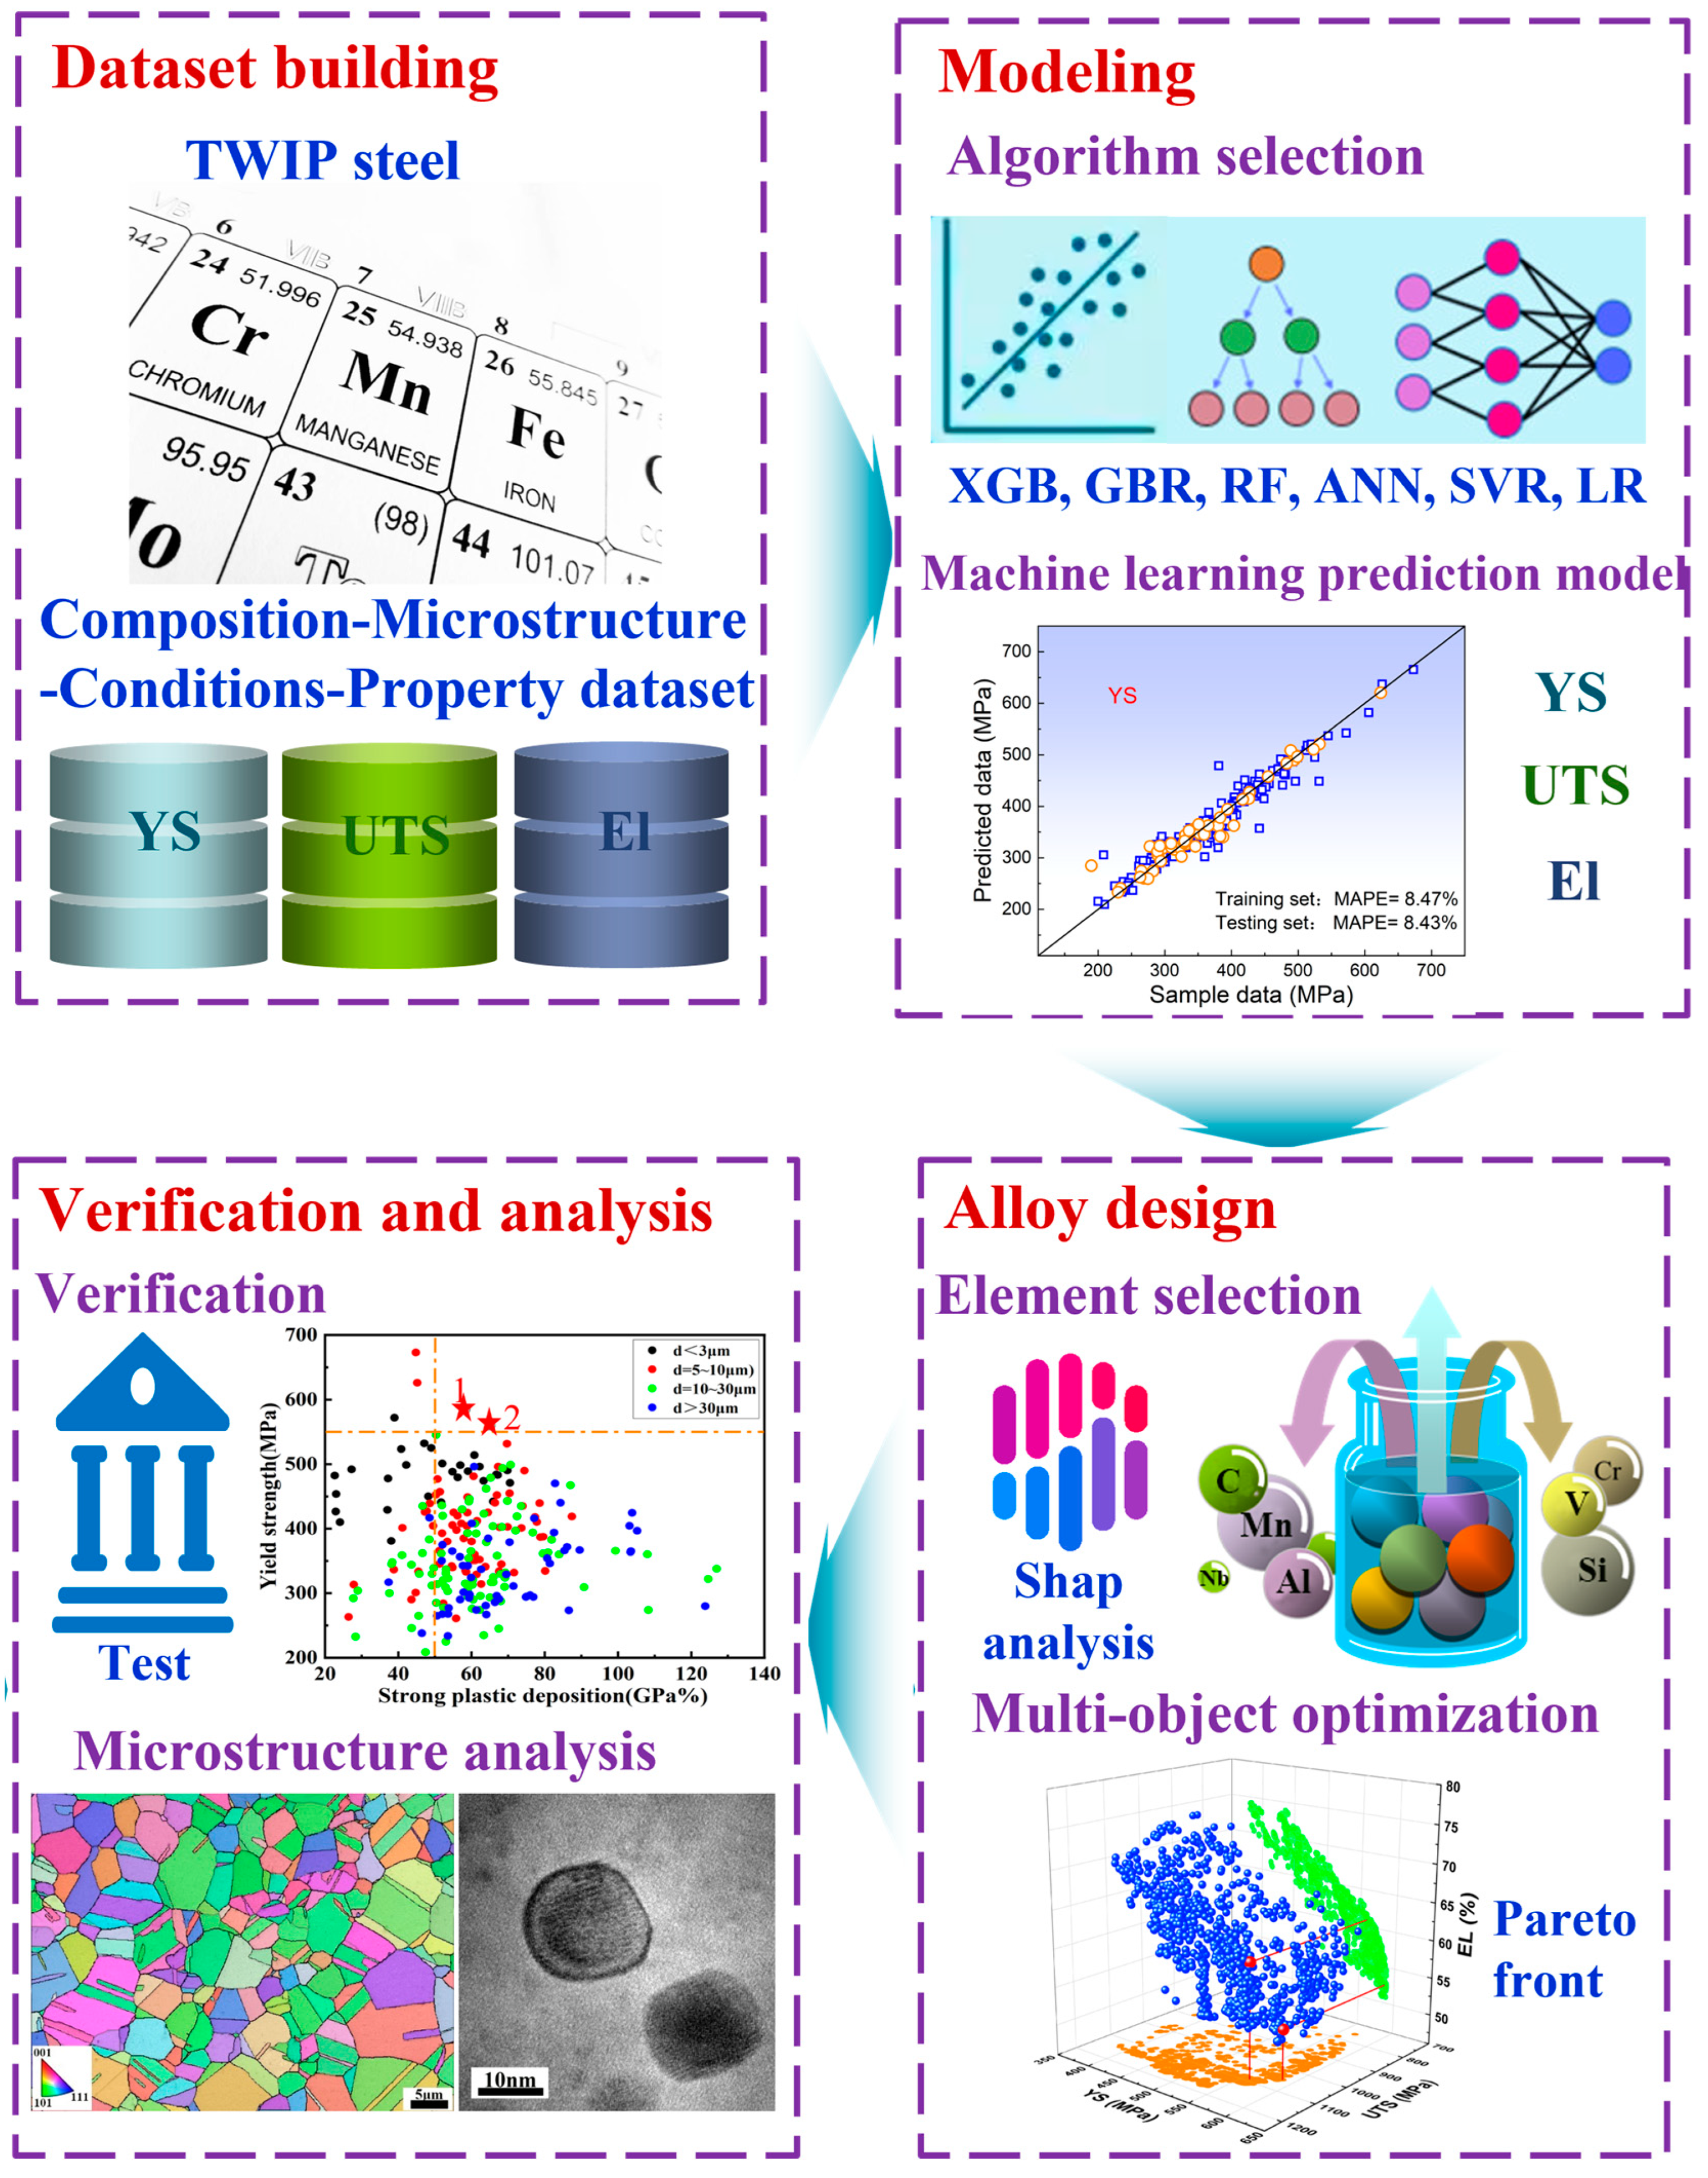
2.1. Machine Learning Strategy for High-Yield-Strength TWIP Steel

The machine learning design strategy for the high-yield-strength TWIP steel proposed in this work is shown in Figure 1. It consists of four steps: data preparation, machine learning modelling, alloy design, and experimental verification and analysis. First of all, TWIP steel data were collected from the relevant literature and standardized to create a machine learning dataset. In the second step, various machine learning algorithms were evaluated for their prediction accuracy, and high-precision models for yield strength, ultimate tensile strength, and elongation were developed. In the third step, the SHAP algorithm was used to analyze the significance and explicit laws of composition and microstructures in three target properties, identifying candidate elements for alloy design. A multi-objective optimization method using machine learning was subsequently employed to optimize the element content, leading to the recommendation of two new TWIP steel compositions, both with high yield strength and high products of strength and elongation. Finally, in the fourth step, the properties of the alloys were verified to confirm the effectiveness of the strategy, and the microstructures of the alloys were analyzed.

2.2. Data Preparation and Processing

A total of 273 data points on the composition, microstructure, and performance of TWIP steel were collected from the relevant literature, as detailed in Supplementary Table S1. The criteria for data collection were as follows: First, all the data needed to exhibit a single austenite matrix before and after deformation. Second, all the data needed to simultaneously include the chemical composition of TWIP steel, microstructural characteristics (grain size), testing conditions (strain rate of tensile tests) [32,33], and target properties (yield strength (YS), ultimate tensile strength (UTS), and elongation (EL)). Importantly, owing to the variety of processing methods reported in the literature, such as hot forging + hot rolling + annealing, hot forging + cold rolling + annealing, hot rolling + cold rolling + cold rolling + annealing, and hot forging + hot rolling + cold rolling + annealing, the use of processing parameters as input variables significantly increased their dimensionality. Additionally, there were instances of missing data for hot forging and hot rolling processes. Therefore, considering the microstructural characteristics of TWIP steel, the grain size after full recrystallization annealing was selected as the input variable instead of the processing method.
After the dataset was constructed, the input variables of the data were standardized to eliminate the effects of different dimensions and units between different input variables, and to increase the prediction accuracy of the machine learning model. The features were normalized to the range of [−1, 1]. The dataset was randomly divided into a training set and a testing set at a 4:1 ratio. The training set was used to optimize the model parameters via 10-fold cross-validation, whereas the testing set was used to evaluate the performance of the trained model. For establishing the machine learning model, six classic algorithms were selected: linear regression (LR), support vector regression (SVR), artificial neural network (ANN), extreme gradient boosting (XGBoost), gradient boosting regression (GBR), and random forest regression (RF). To eliminate the impact of data partitioning, the training and testing sets were repeatedly divided 100 times, and the average of the 100 prediction results was taken as the final prediction result.
The accuracy of the machine learning model was evaluated via the mean absolute percentage error (MAPE) [34], which is calculated via Equation (1).
M A P E = 100 n t = 1 n P r e t E x p t E x p t
where Expt represents the experimental data, and Pret represents the machine learning model prediction data. Through the above processing, an accurate TWIP steel mechanical property prediction model was established.

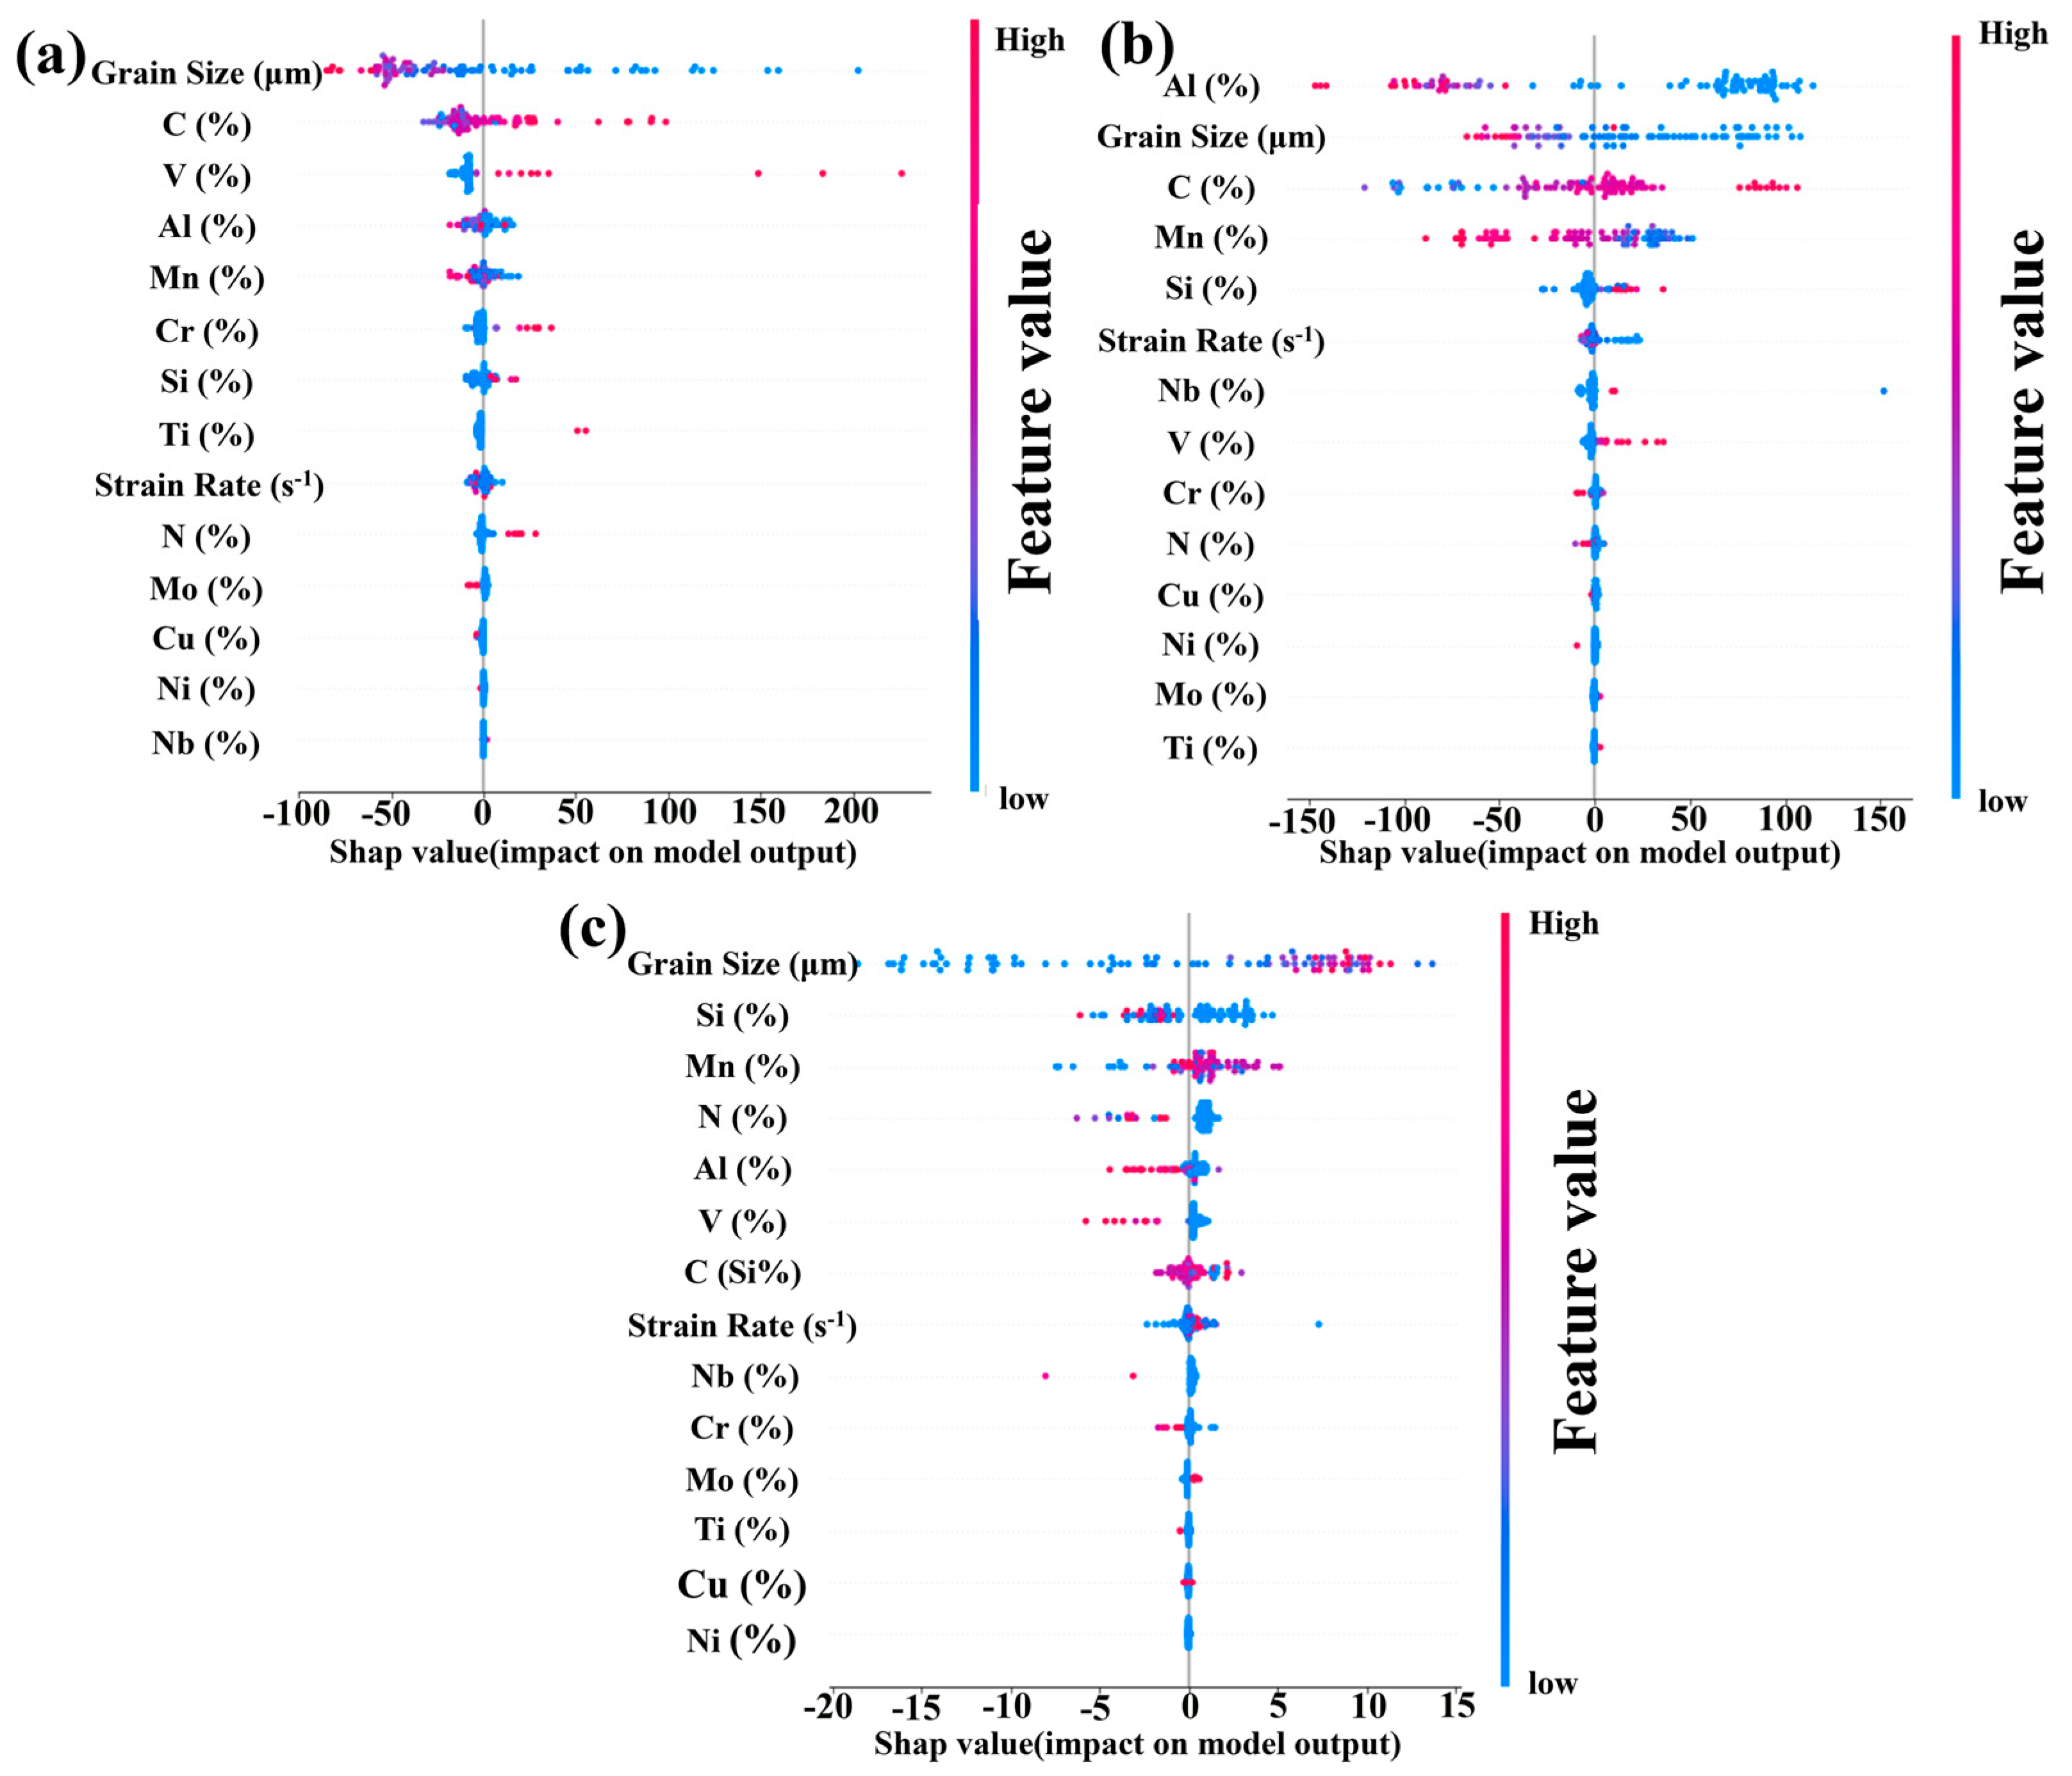
2.3. SHAP Analytical and Element Selection

To investigate the effects of composition, microstructures, and testing conditions on yield strength, ultimate tensile strength, and elongation, and identify suitable candidate alloying elements for alloy design, we employed the SHAP algorithm based on game theory [35] to interpret the YS, UTS, and EL models.
The SHAP algorithm employs a contribution accumulation interpretation strategy, approximating the output of the “black box” model as a linear combination of input variable functions, and interpreting each sample, as shown in Equation (2).
f x = 0 + i = 1 M i j ( x )
In this framework, where f(x) represents the predicted value of the output variable, 0 is a constant term related to the base metal properties, M is the number of input variables or key feature factors, and the SHAP values i j ( x ) denote the contribution of the i-th key feature factor to the alloy property in the j-th sample derived by weighting and summing its contributions across different combinations of key feature factors. The contribution of this key feature factor to the properties is weighted and summed in different combinations of key feature factors, as shown in Equation (3).
i j ( x ) = S F \ i S ! F S 1 ! F ! g S i x g S x
where F represents the set containing all key features, |F| is the total number of key features, and |F| = M. SF\{i} denotes a subset of all nonzero subsets excluding the i-th key feature, and |S| is the number of key features in the subset. g S x is the predicted value of the performance model built on the S subset, g S i x is the predicted value of the performance model built after adding the i-th key feature to the S subset, and g S i x g S x represents the contribution of the i-th key feature to the predicted performance. S ! F S 1 ! F ! is the weight coefficient related to the number of key features.
Using Equations (2) and (3), the influence of each input variable on the yield strength, tensile strength, and elongation can be systematically investigated, providing valuable insights for alloy design.

2.4. Multi-Objective Optimization

Using the nondominated sorting genetic algorithm II (NSGA-II) [36,37], a Pareto front for yield strength, ultimate tensile strength, and elongation was established for optimization. The initial population size for the Pareto front search was set to 5000, and the maximum number of generations was 5000, with no more than 50 candidate solutions on the front. The Pareto front represents the highest achievable boundaries for yield strength, ultimate tensile strength, and elongation in TWIP steel. Each point on the front corresponds to an alloy design scheme optimized through multi-objective optimization. On the basis of the desired performance requirements of the alloy, suitable points on the Pareto front were selected to determine the corresponding optimized alloy compositions.

2.5. Experimental Methods

To verify the performance of the high-yield-strength TWIP steel designed via machine learning methods, alloy smelting was conducted in a 40 kg vacuum induction furnace according to the recommended alloy composition. The alloy was subsequently homogenized at 1200 °C for 5 h and then forged into 30 mm thick plates at temperatures ranging from 1100 °C to 960 °C. The forged TWIP steel plates were hot rolled to 6 mm at temperatures above 1000 °C and then cold rolled to 2 mm. Finally, the samples were annealed at 950 °C for different durations and air cooled to room temperature after annealing.
The chemical composition of the TWIP steel was determined via inductively coupled plasma atomic emission spectroscopy (ICP-AES). The room-temperature mechanical properties of the TWIP steel were tested via a CMT6000 testing machine with a tensile strain rate of 0.001 s−1 and a gauge length of 15 mm. The average value of the three samples was taken as the final result. A Zeiss Ultra 55 scanning electron microscope (SEM) was used to observe and analyze the high-magnification microstructure of the TWIP steel, and electron backscatter diffraction (EBSD) was employed to statistically analyze the grain structure of the TWIP steel. The electrolyte used for etching was a mixture of 10 vol% HClO4 and 90 vol% CH3COOH. The precipitate phase structure in the TWIP steel was identified via transmission electron microscopy (TEM) on a Tecnai G220 instrument, with the electrolyte used for sample preparation being a mixture of 20 vol% HClO4 and 80 vol% C2H5OH.

3. Results

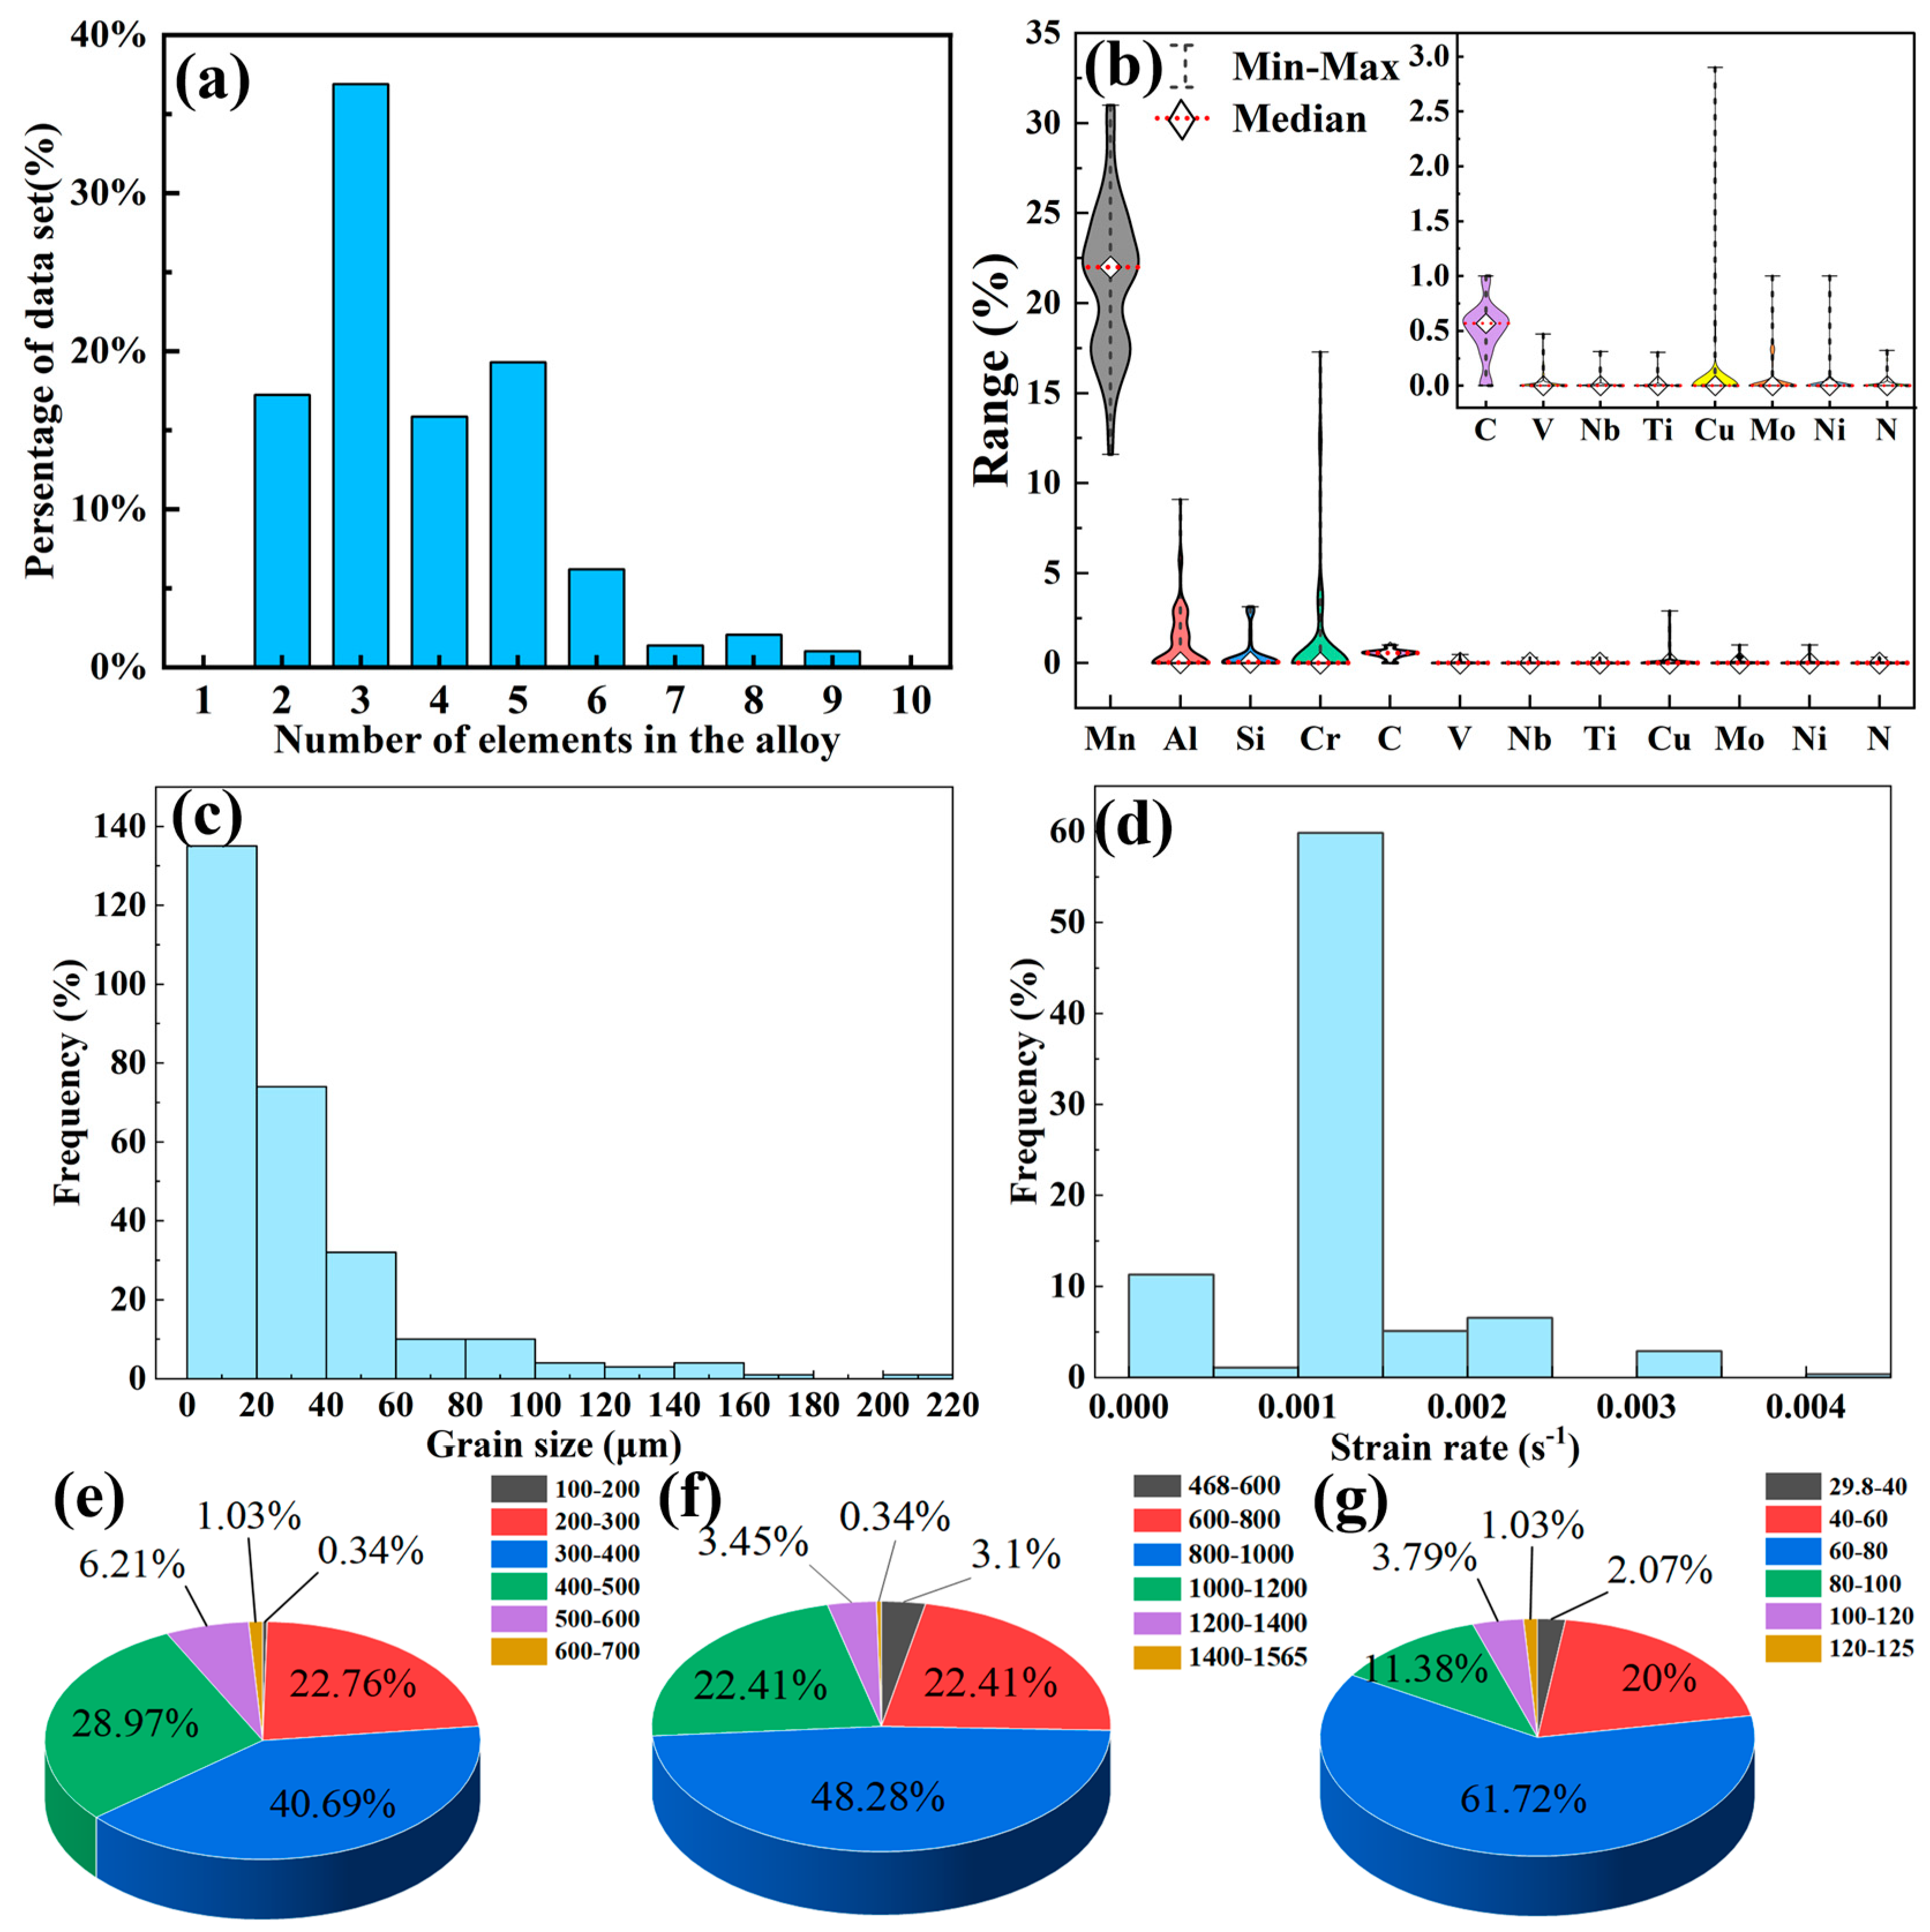
3.1. Dataset Distribution Analysis

The numerical range and feature statistics of the composition, microstructure, testing conditions, and performance in the TWIP steel dataset are illustrated in Figure 2. Figure 2a shows the number of elements in the different samples within the TWIP steel dataset, revealing that more than 90% of the TWIP steel samples contained fewer than six alloying elements; this was due to the composition characteristics of the first-generation Fe-Mn-Al-Si TWIP steel and the second-generation Fe-Mn-C TWIP steel. Current third-generation TWIP steels incorporate elements such as Al, Cr, V, Nb, Ti, Mo, Cu, and Ni into the Fe-Mn-C base but typically focus on one or a few alloying elements. Therefore, the aim of this study was to use complex alloy compositions to improve the performance of TWIP steel, although this also increased the difficulty of alloy design.
Figure 2b shows the statistical distribution of the element contents among the input variables. The Mn content is concentrated between 15 wt.% and 30 wt.%, whereas the C content is concentrated between 0 wt.% and 1 wt.%, with medians of 22.05 wt.% and 0.56 wt.%, respectively. The distributions of the Mn and C contents are relatively concentrated and symmetrical. The medians for the Al, Si, and Cr datasets were close to 0, indicating that the contents of these elements were relatively low in most samples. However, the outlines of the violin plots indicate that these elements had higher contents in some samples. Therefore, Mn, C, Al, Si, and Cr were considered the primary alloying elements in the TWIP steel. The medians for elements such as V, Nb, Ti, and Cu were close to 0, and their violin plot outlines also showed that these elements were mainly concentrated near 0, indicating that the contents of these elements were very low in most samples, with higher contents in only a few samples. Figure 2c,d show the distribution histograms of the grain size and tensile strain rate among the input variables. For the TWIP steel dataset, most grain sizes were less than 40 μm, and the tensile strain rate for most samples was 0.001 s−1, which was why we selected this strain rate for tensile tests.
Figure 2e–g present the statistical distributions of the properties of the TWIP steel. The performance distribution indicated that the yield strength of the common TWIP steel was predominantly in the range of 300 to 500 MPa, accounting for 69.66% of the samples; the ultimate tensile strength was mainly between 1000 and 1200 MPa, accounting for 48.28%; and the elongation was primarily between 60% and 80%, accounting for 61.72% of the samples.

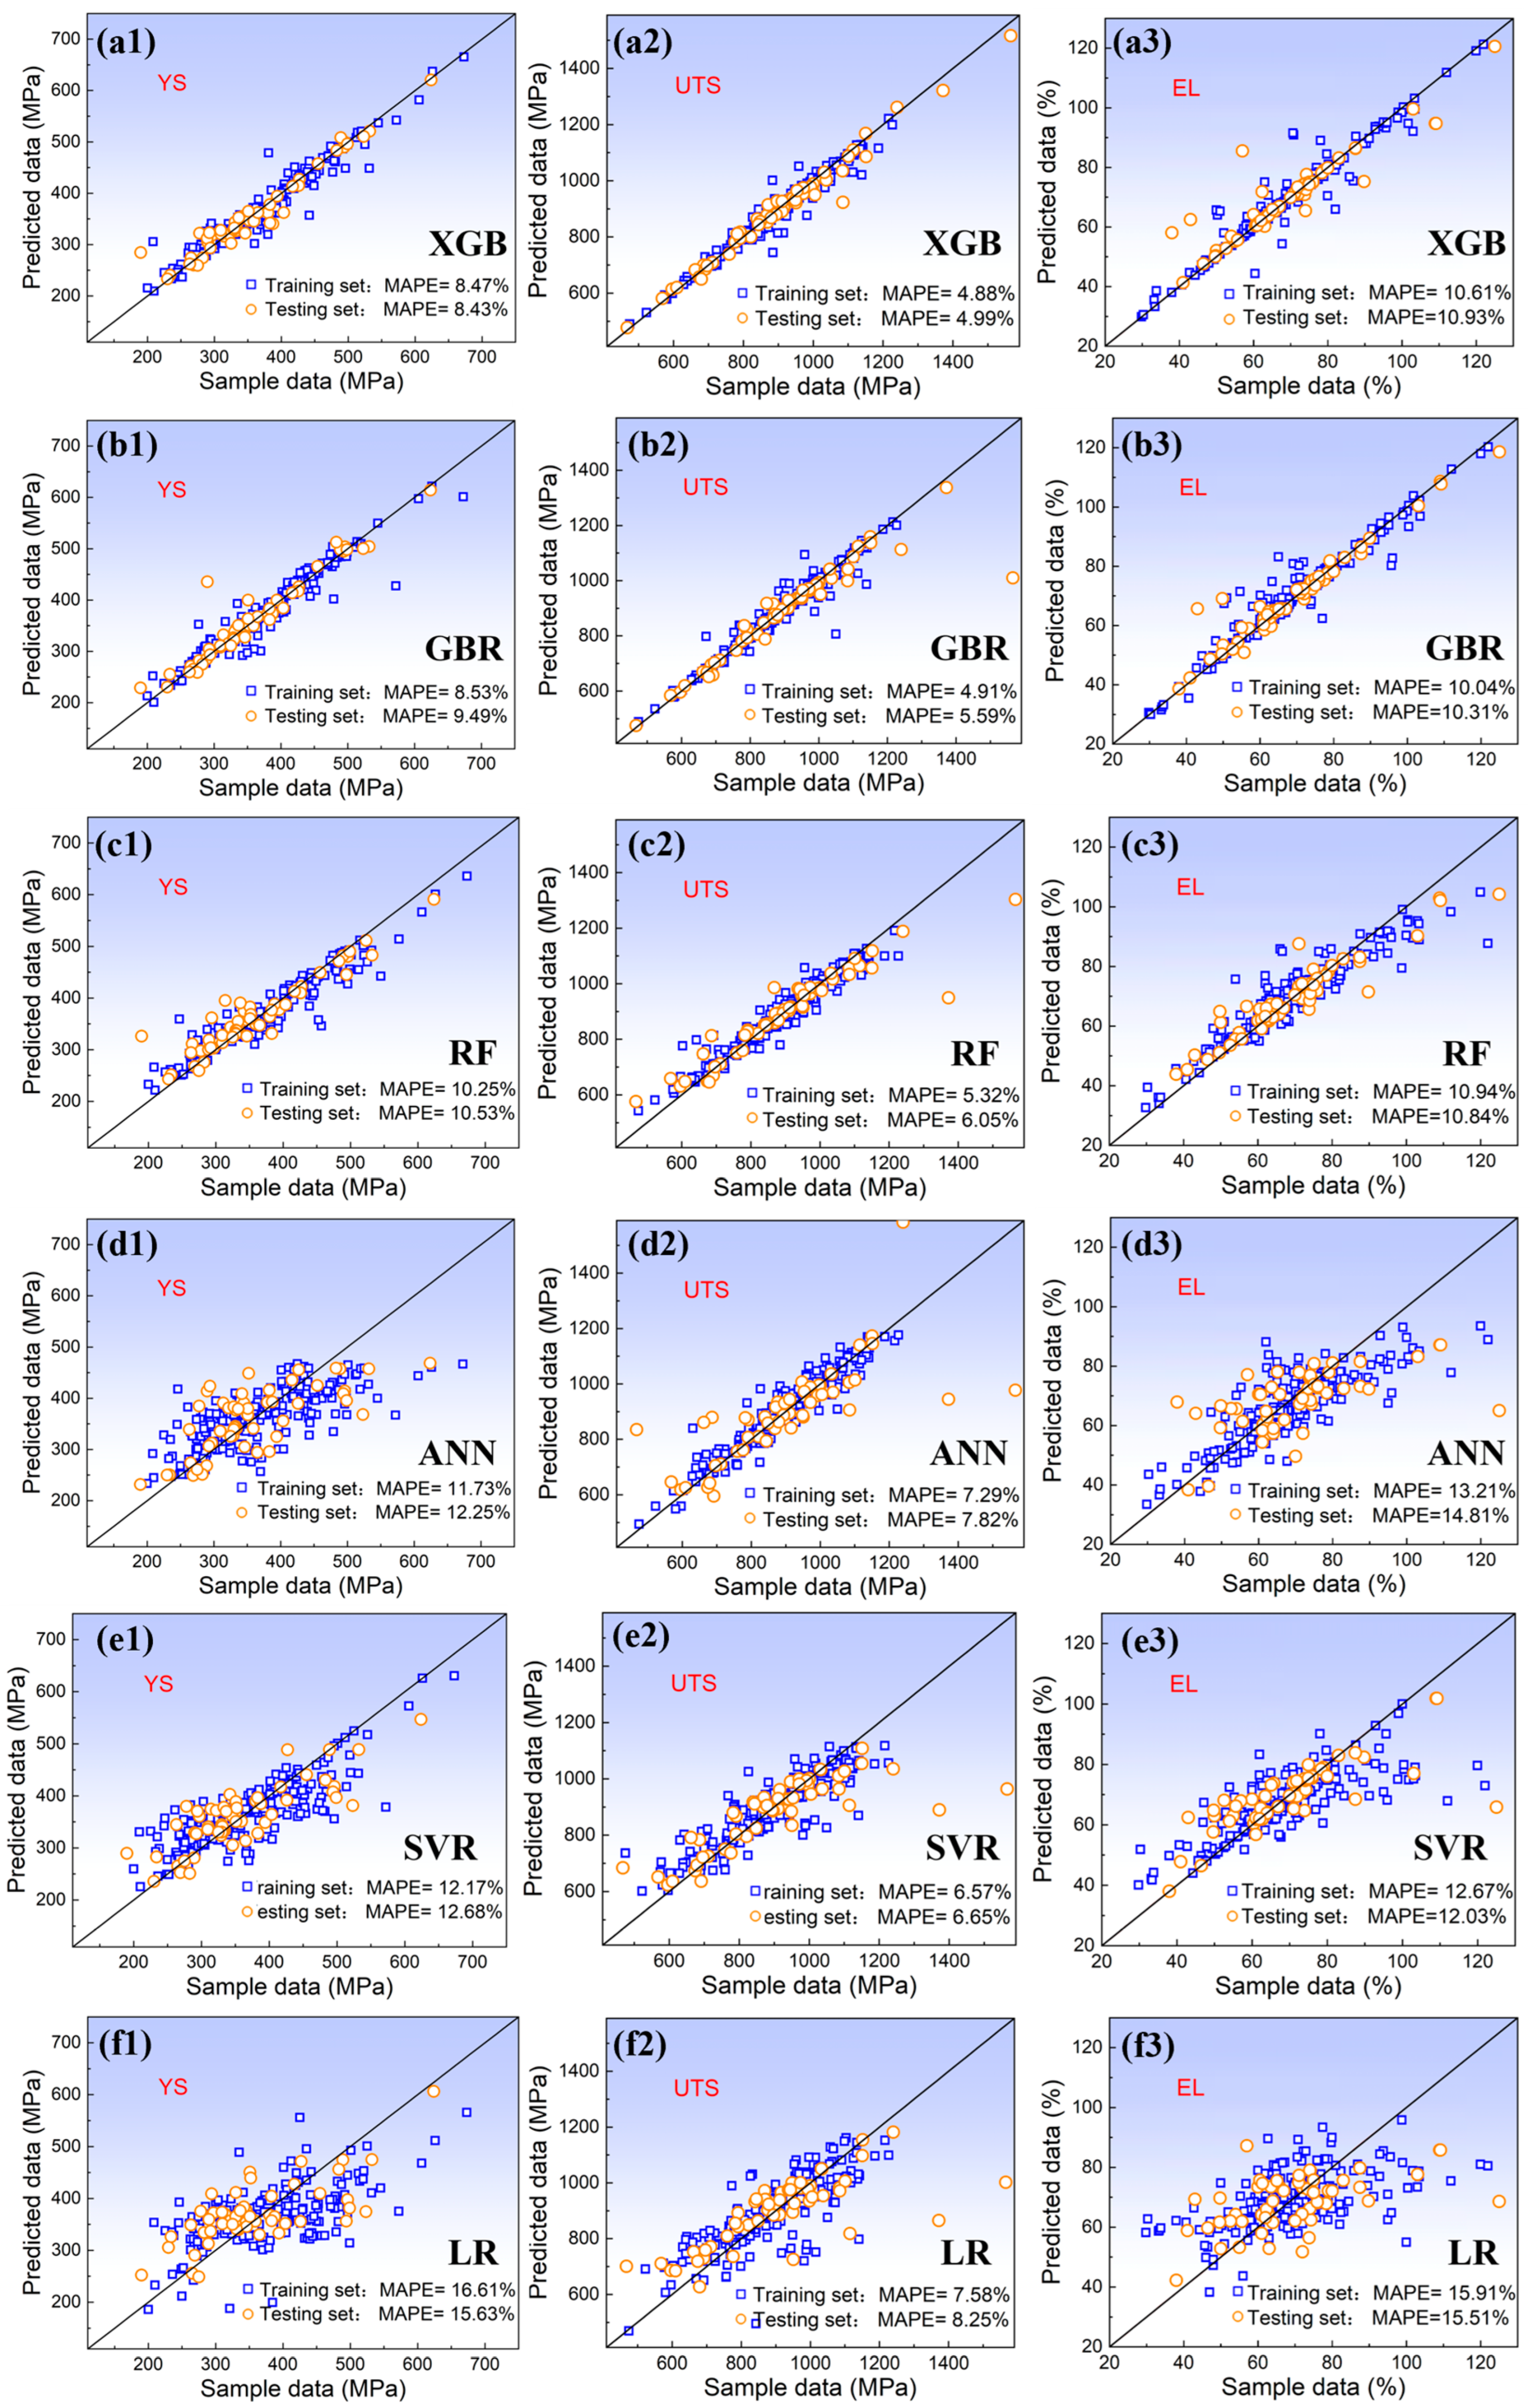
3.2. Machine Learning Algorithm Selection

In this study, six classical machine learning regression models were used to train the yield strength, ultimate tensile strength, and elongation data of TWIP steel. These models included linear regression (LR), support vector machine (SVR), artificial neural network (ANN), extreme gradient boosting (XGBoost), gradient boosting regression (GBR), and random forest regression (RF). To minimize the prediction error, Bayesian optimization was used to find the optimal parameters for each model, and the best model for each type was selected for comparison. The prediction results of each model are shown in Figure 3. The black solid line indicates where the actual performance matched the predicted performance; the closer the points are to the black solid line, the higher the prediction accuracy of the model. As shown in the figure, compared with other machine learning algorithms, ensemble algorithms improved overall performance by combining the predictions of multiple models, proving better in handling high-dimensional data and complex relationships, and thus offering better modelling performance and higher accuracy. Among them, the XGB model had the highest prediction accuracy for ultimate tensile strength and yield strength, with a MAPE of 4.88% and 8.47%, respectively; the GBR model had the highest prediction accuracy for elongation, with a MAPE of 10.04%. The models with the highest prediction accuracy for yield strength, ultimate tensile strength, and elongation were chosen for subsequent design optimization.

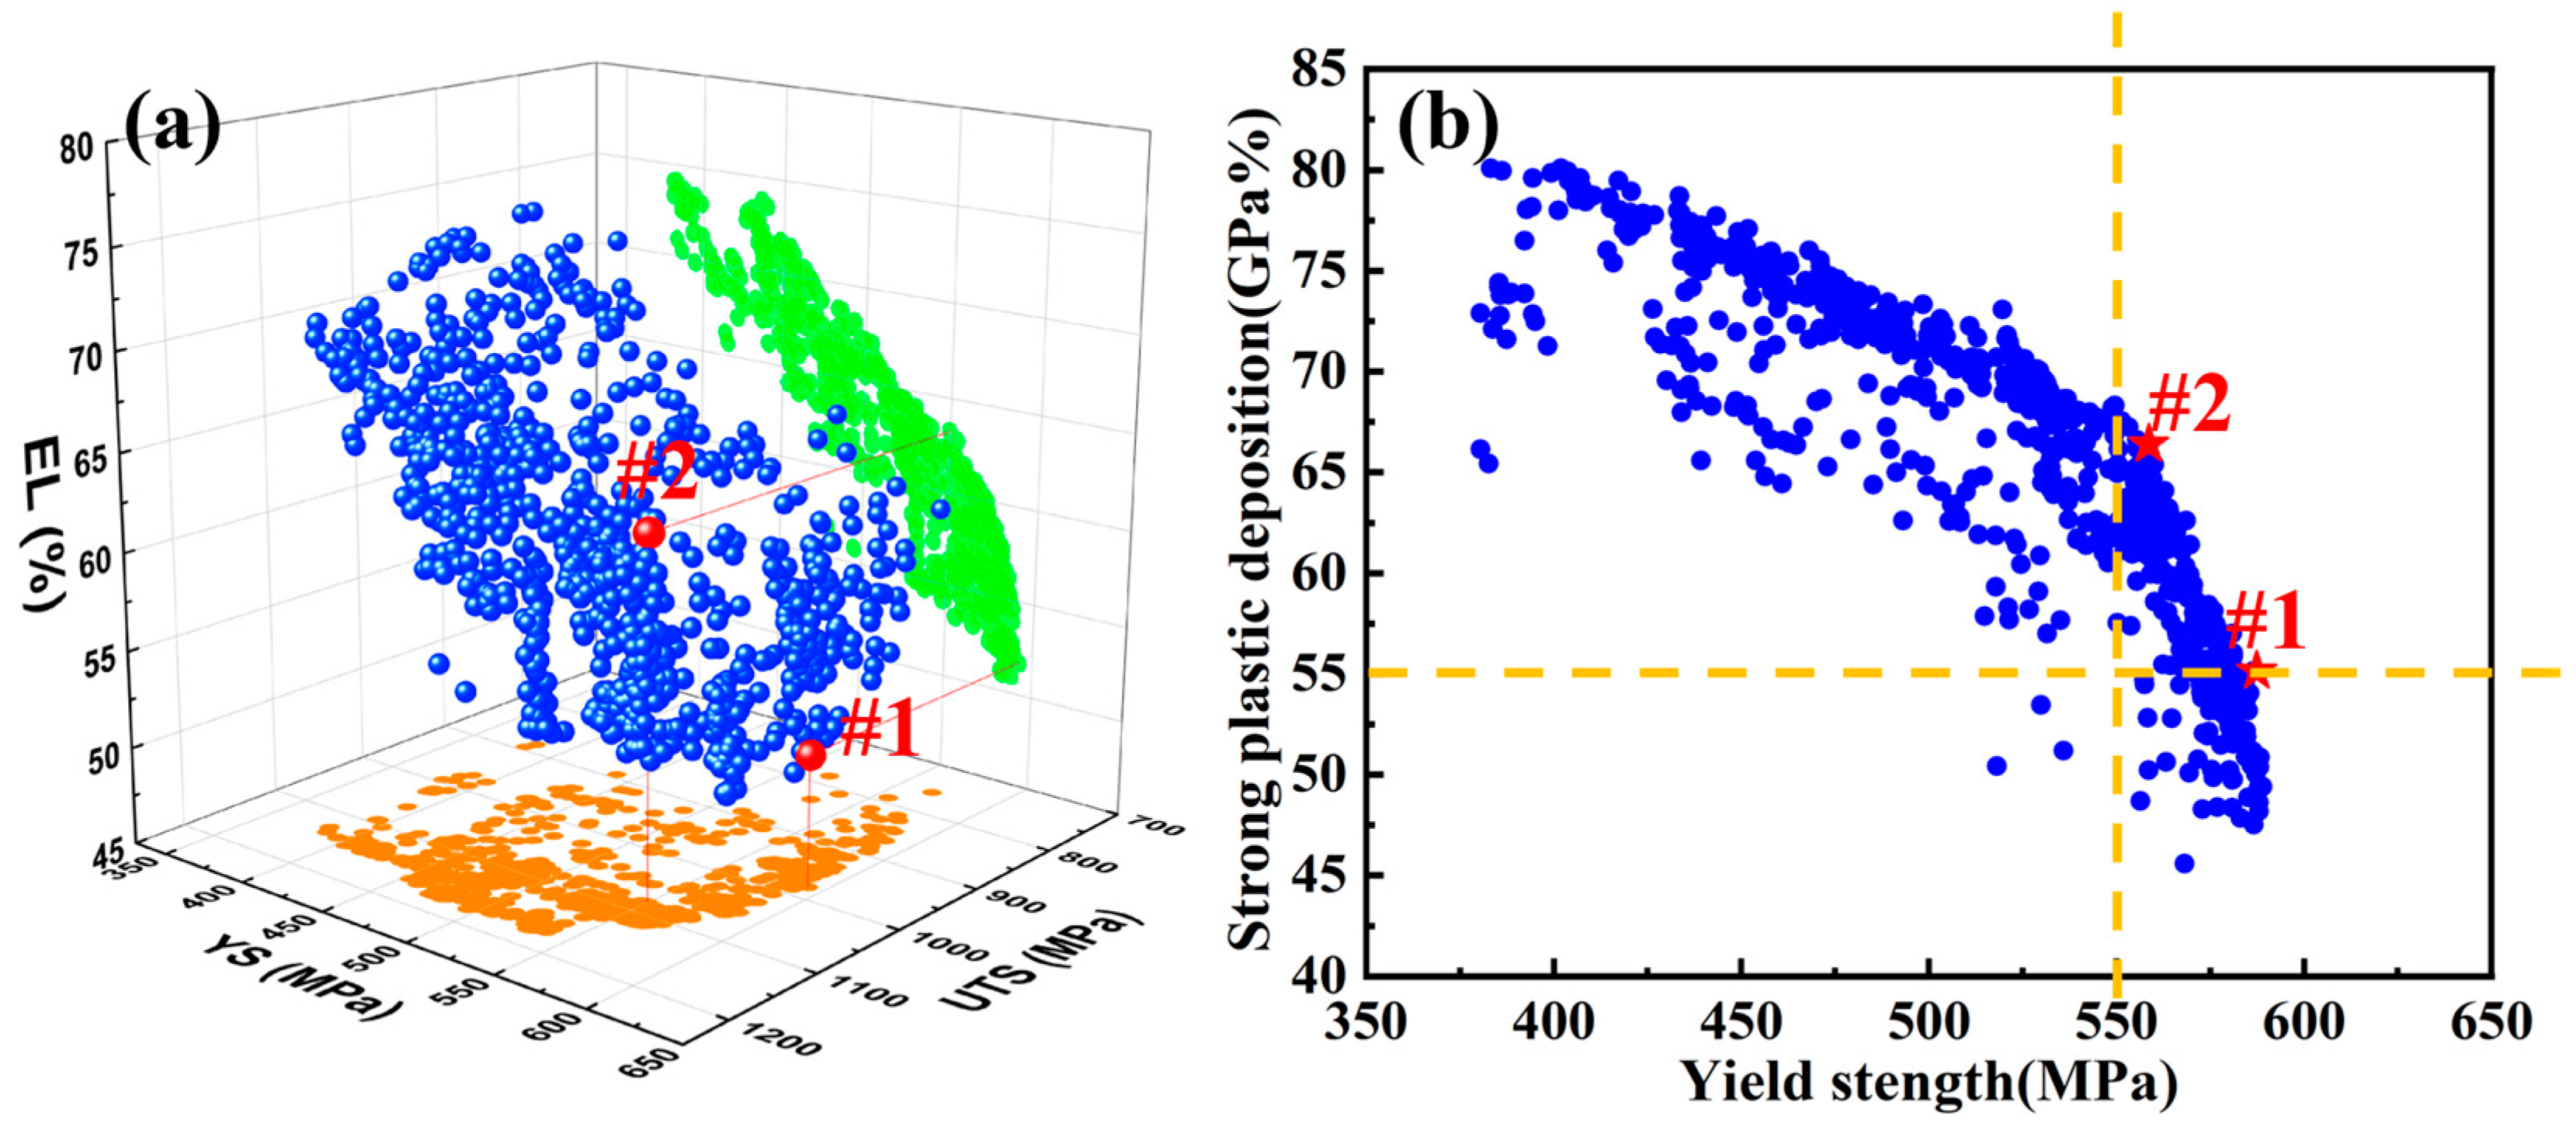
3.3. Design of High-Yield-Strength TWIP Steel

Based on the constructed performance prediction models for yield strength, ultimate tensile strength, and elongation, a multi-objective optimization method was used for the alloy design. However, to improve the efficiency of the composition design, and reduce the search space, an SHAP analysis was initially employed to study the influence of composition, microstructure, and testing conditions on yield strength, ultimate tensile strength, and elongation, thereby achieving the efficient screening of alloying elements. The results are shown in Figure 4. The grain size, C, and V had a significant effect on the yield strength of the TWIP steel. The grain size and Mn content were inversely related to the yield strength of the TWIP steel, whereas the C content was directly proportional to the yield strength. The addition of V, Ti, Cr, and N could significantly improve the yield strength of TWIP steel, whereas the contents of Cu, Nb, Ni, and Mo had a smaller effect on the yield strength.
For the ultimate tensile strength model, the Al, C, Mn, and Si contents and the grain size significantly affected the ultimate tensile strength of the TWIP steel. The Al and Mn contents were inversely related to the ultimate tensile strength, whereas the C and Si contents were directly proportional. Adding trace amounts of V could significantly increase the ultimate tensile strength of the TWIP steel, but the trace elements Ti, Nb, Mo, and N had a smaller impact on the ultimate tensile strength. For the elongation model, the grain size and Si, Mn, N, and Al contents had significant impacts on elongation. Excessive amounts of Al, V, and Cr could lead to a decrease in the elongation of TWIP steel, whereas Cu, Ni, and Ti had little effect on elongation. Based on the mechanism of the above elements on alloy performance, we selected Mn, C, Al, Si, Cr, V, Nb, and Ti as the candidate alloying elements for multi-objective optimization design.
Based on the performance prediction models of TWIP steel established by machine learning, and the candidate elements selected through SHAP analysis, the Pareto fronts for YS, UTS, and EL were searched. The specific search space is shown in Table 1. Since Cu, Mo, and Ni had minimal impacts on the performance of the TWIP steel, and the addition of N required stringent smelting process conditions, their contents were set to 0. Since a Ti content greater than 0.1 wt.% deteriorates TWIP steel performance [38], its range was set between 0 and 0.1 wt.%. The grain size and tensile test strain rate were fixed at 10 μm and 0.001 s−1, respectively, based on the data distribution within the dataset.
The recommended alloy compositions at the Pareto front are shown as blue dots in Figure 5a. The orange dots represent the two-dimensional plane projection of yield strength and ultimate tensile strength, whereas the green dots represent the two-dimensional plane projection of yield strength and elongation. Figure 5b shows the search results where the ultimate tensile strength and elongation are converted into the product of strength and elongation (PSE). At the Pareto front, the highest yield strength points with a product of strength and elongation greater than 55 GPa% and the highest product of strength and elongation point with a yield strength greater than 550 MPa were selected for performance verification. These two recommended design schemes are referred to as #1 and #2, respectively. For the two TWIP steels, using the experimental methods in Section 2.5, the grain sizes after melting, homogenization, hot forging, hot rolling, and cold rolling, followed by holding at 950 °C for 50 min and 30 min, respectively, were approximately 10 μm. The predicted and actual compositions and properties of the #1 and #2 alloys are shown in Table 2. A comparison reveals that the experimental results closely matched the predicted results, with errors of less than 7%. Furthermore, a comparison of the performance of the TWIP steels designed in this study with those in the literature (as shown in Figure 6) revealed that the performance of the designed alloys significantly improved, demonstrating the effectiveness of the machine-learning-based alloy design strategy used in this study.

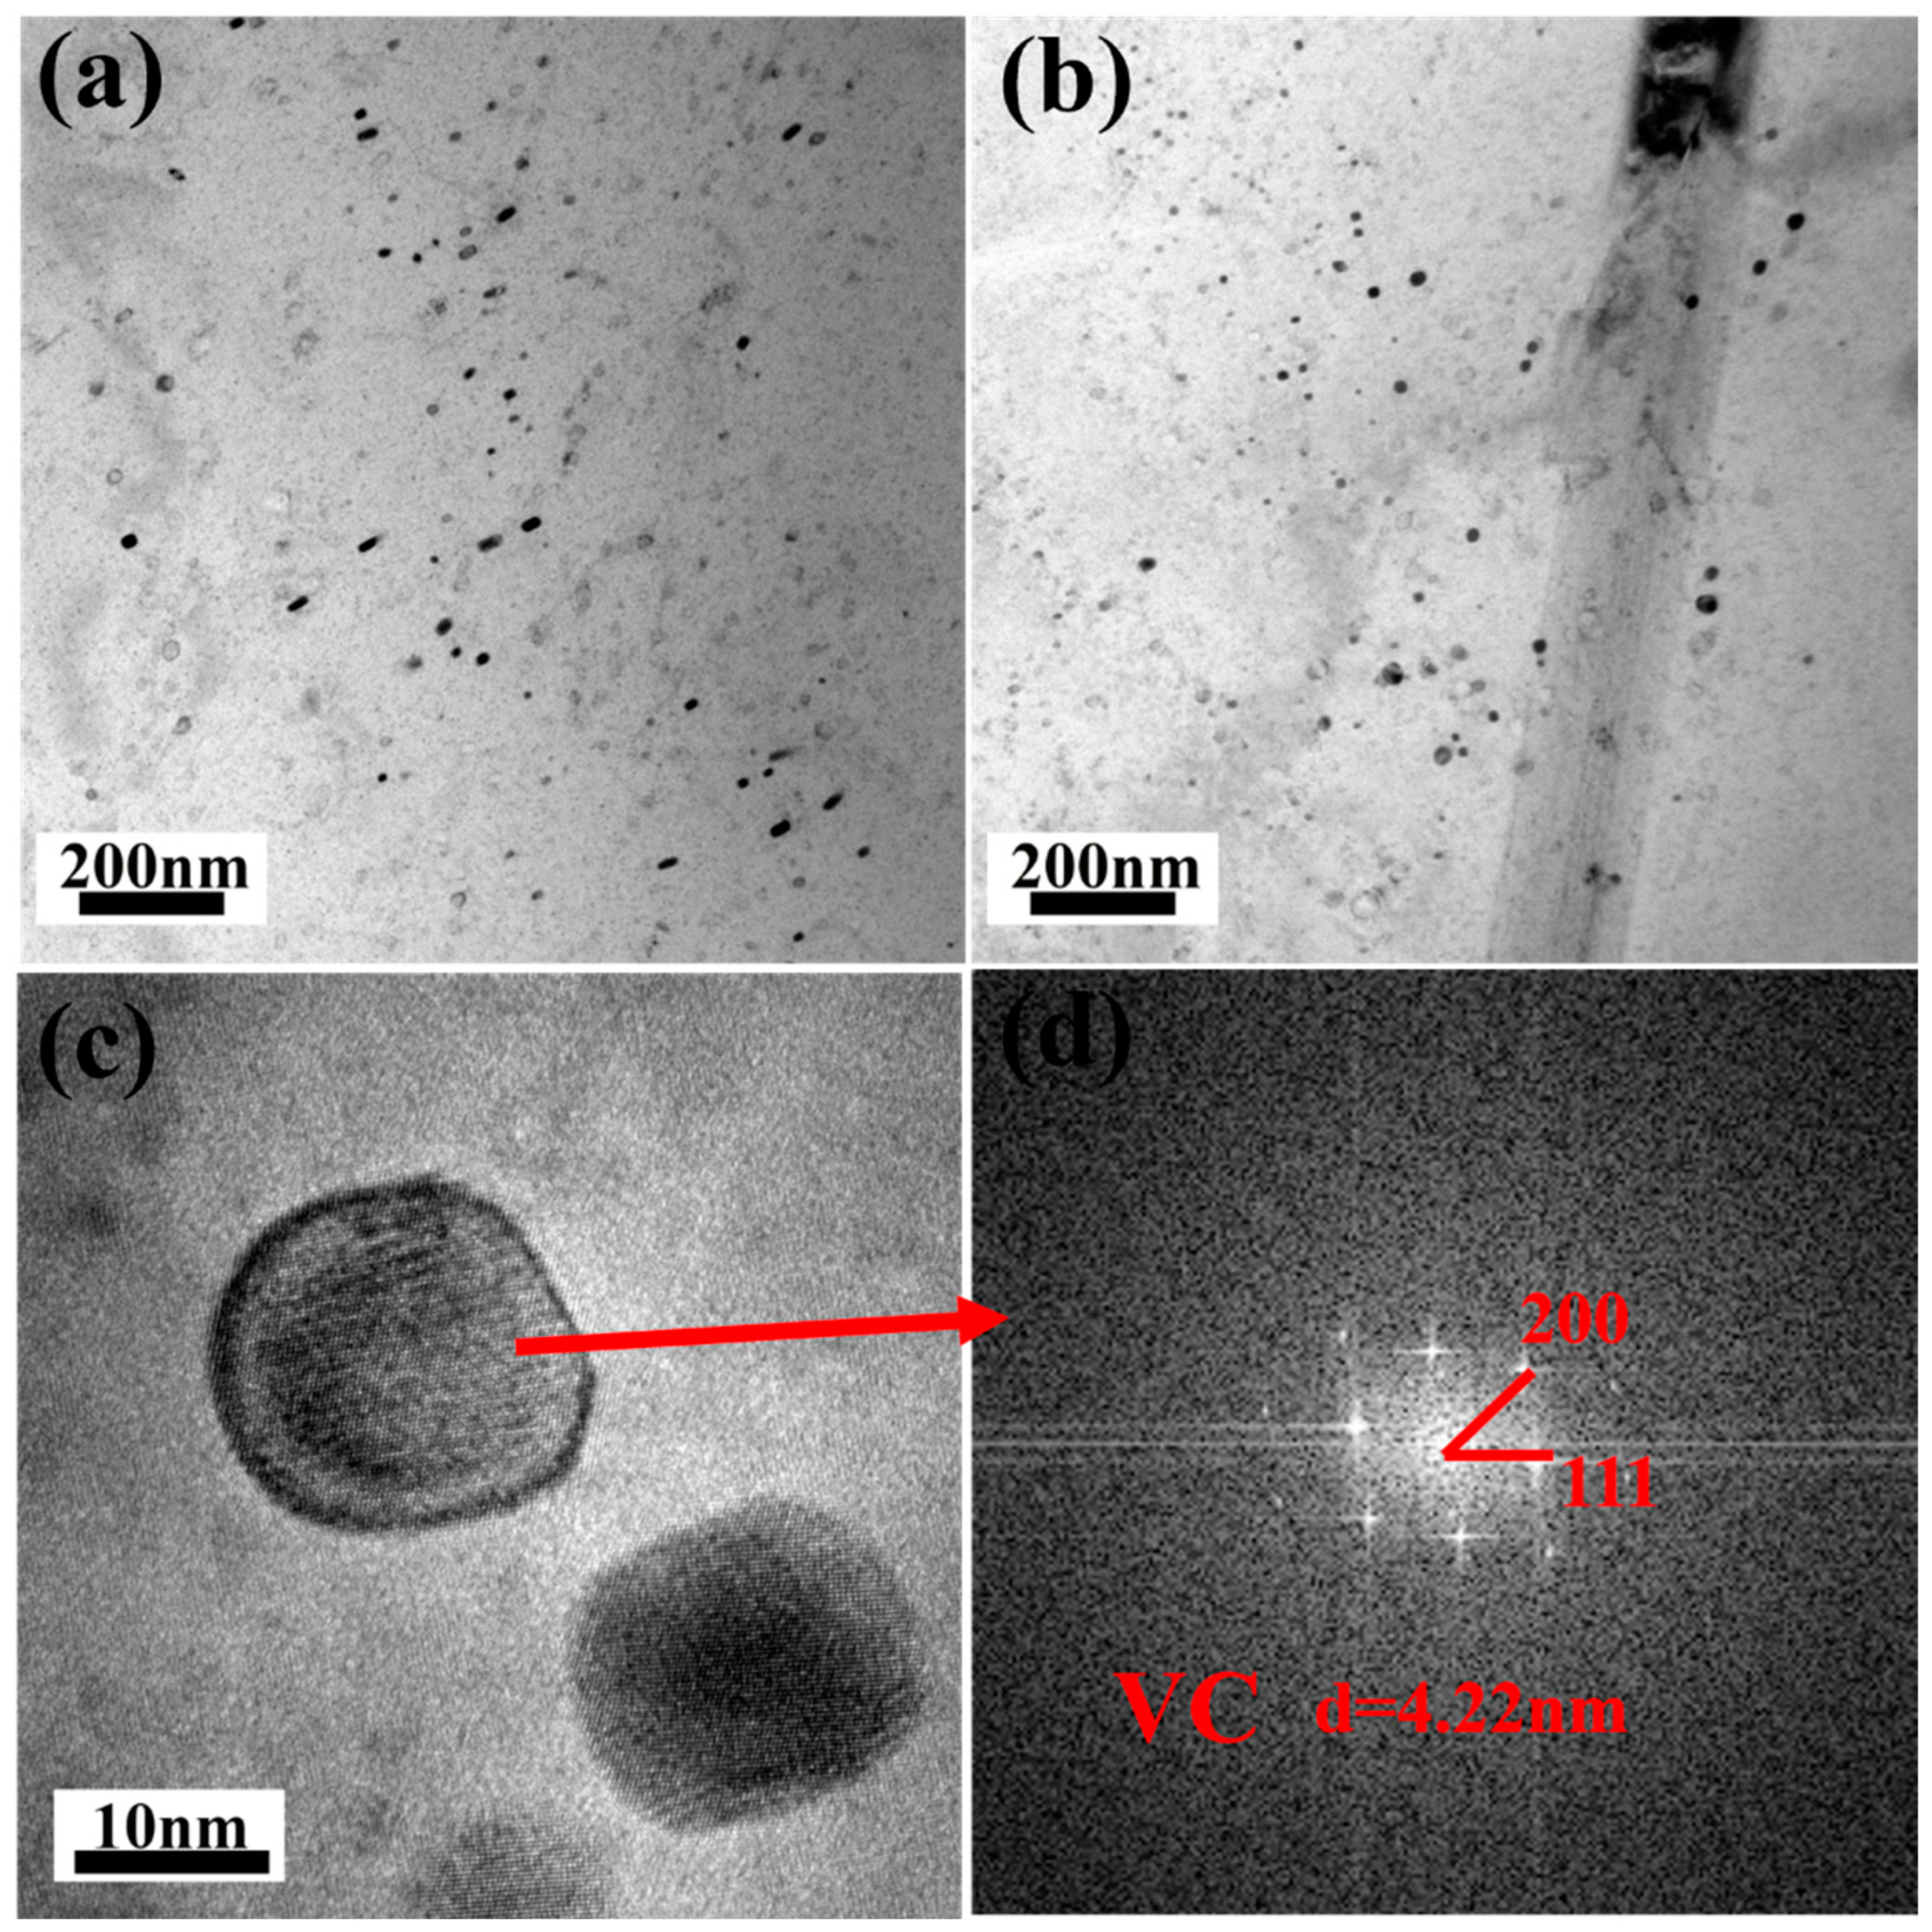
3.4. Microstructure Analysis

To reveal the mechanism of the excellent comprehensive performance of the alloys, the microstructures of steels #1 and #2 were analyzed, as shown in Figure 7 and Figure 8. Figure 7a,b are EBSD images of the two TWIP steels along the RD direction, showing that both alloys exhibited fine, uniform equiaxed grains with partial annealing twins within the grains. Both alloys contained two types of second phases: a micrometer-sized white blocky second phase distributed in a chain along the rolling direction, and a spherical nanoscale second phase uniformly distributed in the matrix. According to the EDS analysis results, the micrometer-sized precipitates were (Ti, Nb)C, whereas the nanoscale precipitates were rich in V. Combining high-resolution TEM images and the corresponding fast Fourier transform (FFT) diffraction patterns, the nanoscale precipitates were found to have a face-centered cubic structure with a lattice constant of 0.422 nm, indicating that they were VC (VC has a lattice constant of 0.416 nm [16]). According to previous research results, coarse micrometer-sized (Ti, Nb)C precipitates can refine grains during hot rolling. In addition to providing precipitation strengthening, the fine nanoscale VC can inhibit grain growth during processing and heat treatment. Therefore, compared with steel #2, the high V content in steel #1 requires a longer annealing time to achieve a grain size of approximately 10 μm.

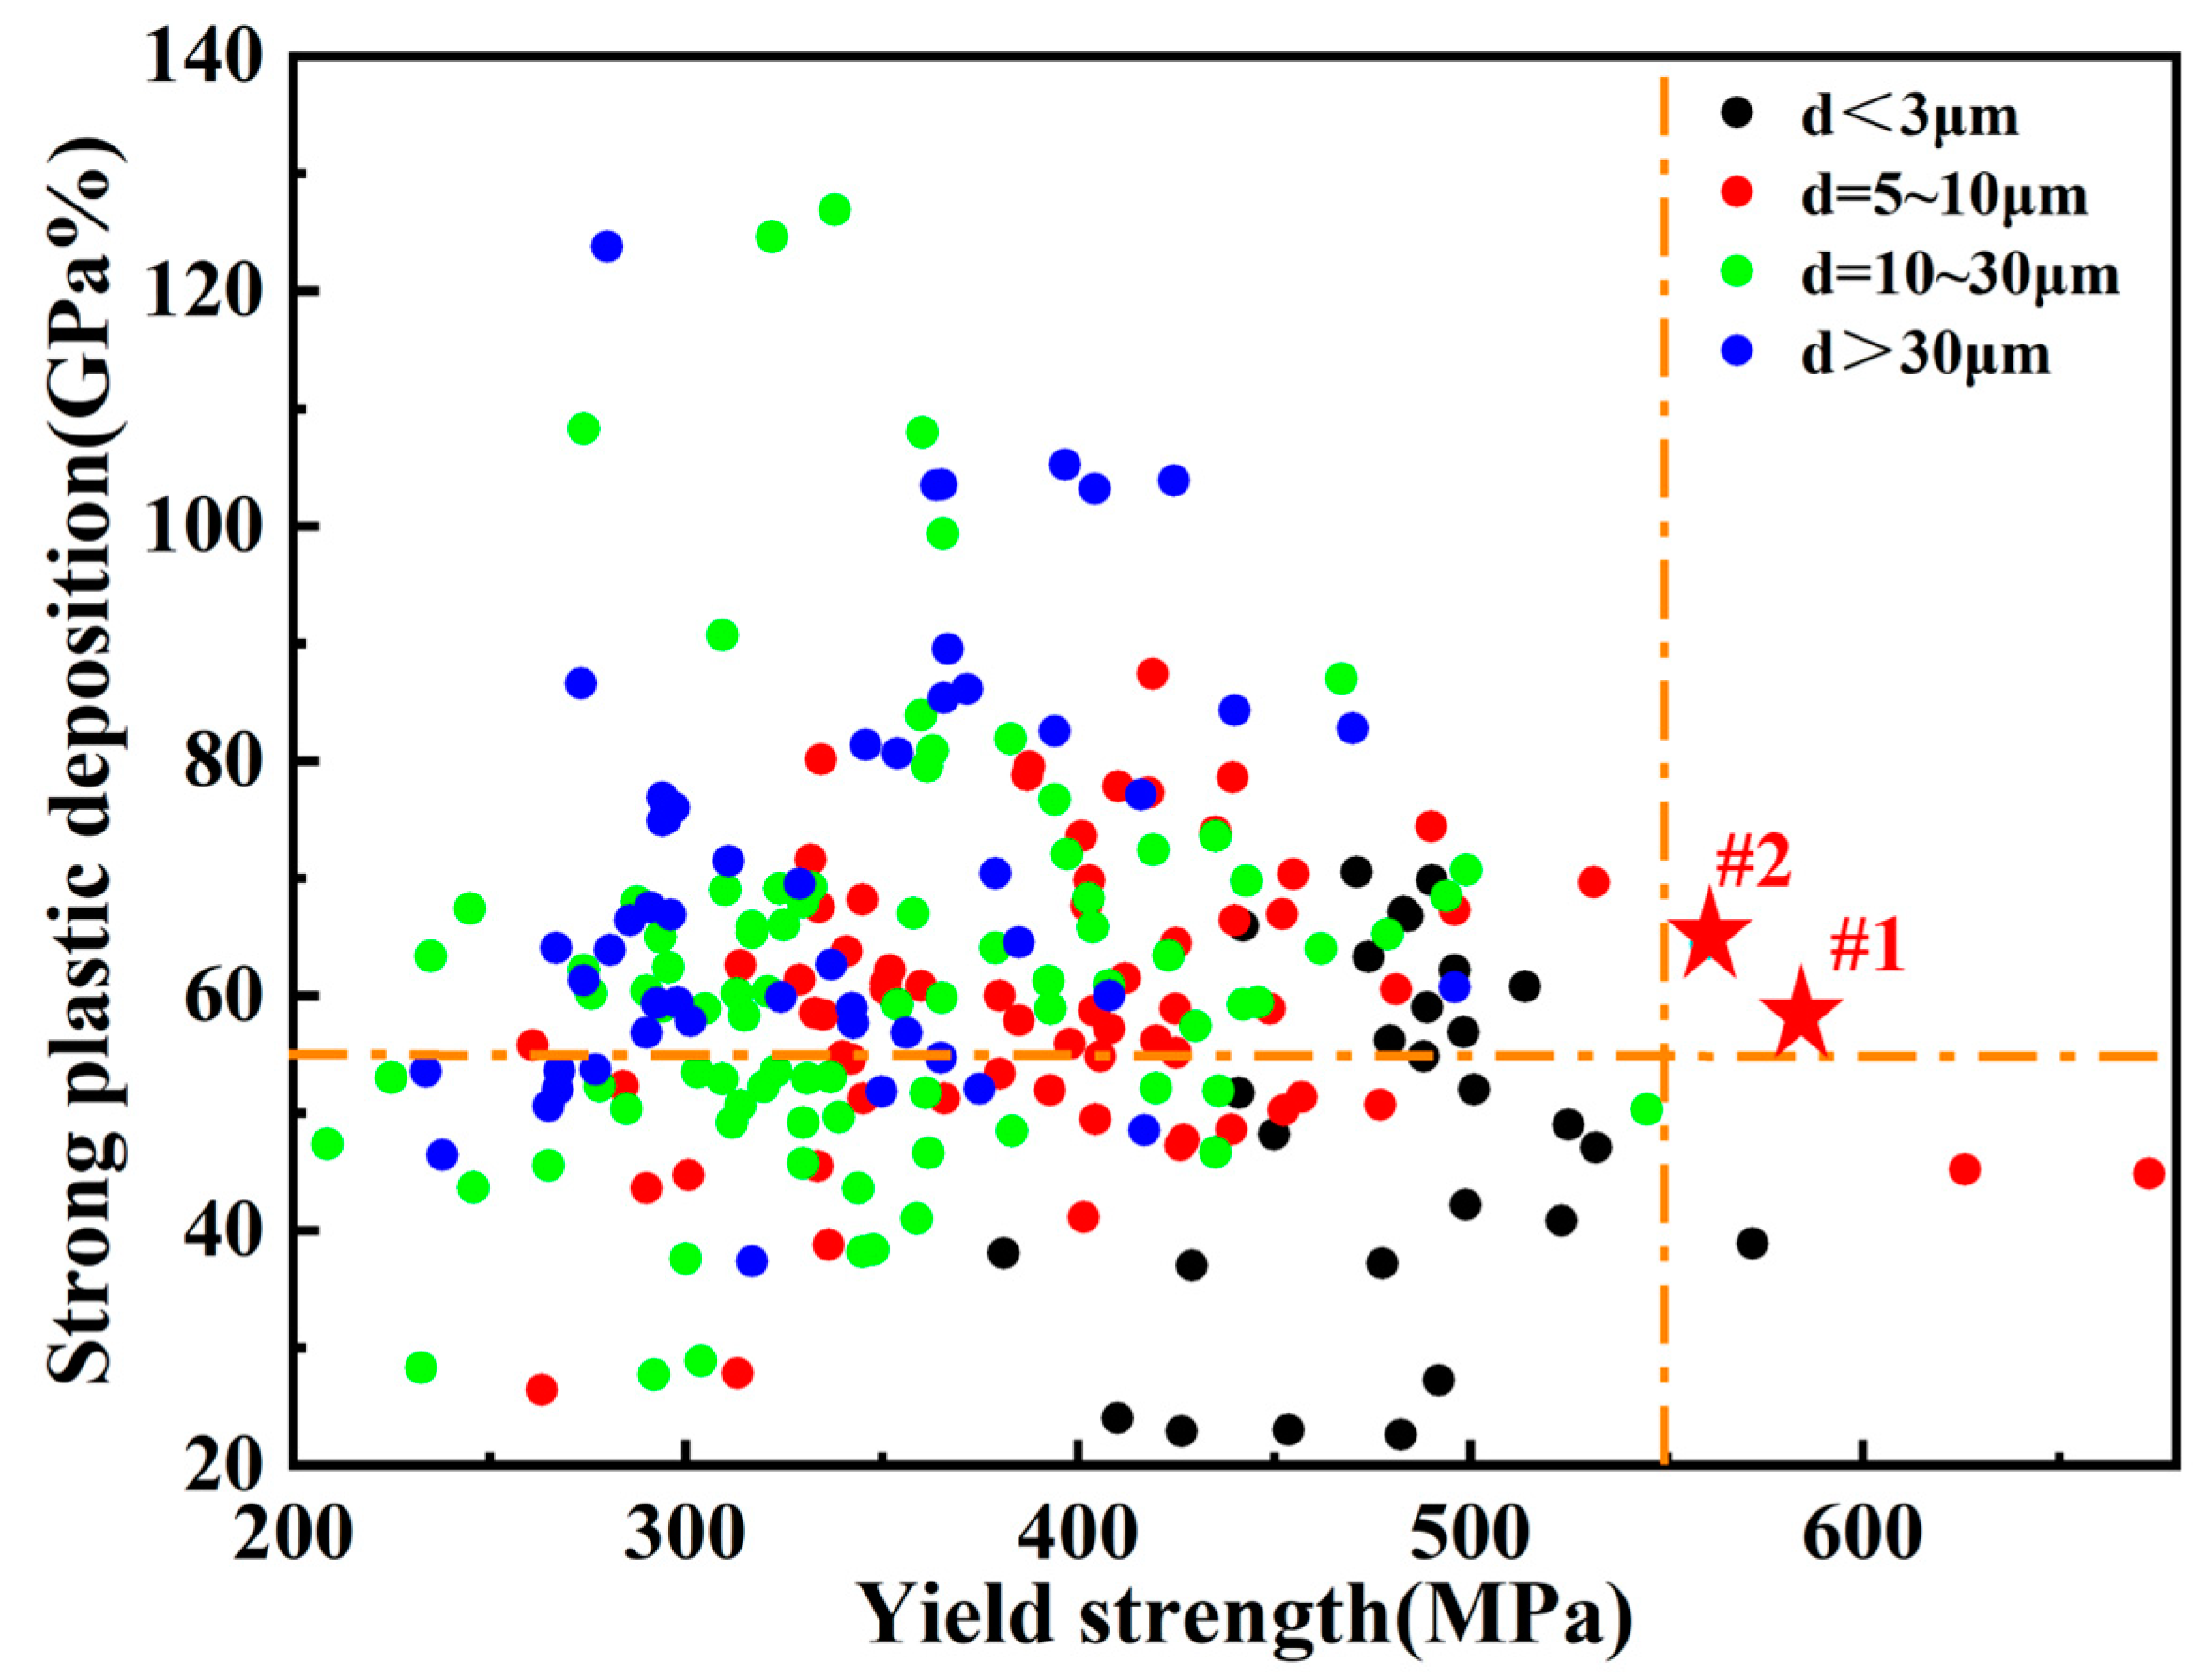
3.5. Analysis of Model Effectiveness

In the data processing of this study, we used the grain size of fully recrystallized TWIP steel after annealing as an input variable instead of the multidimensional processing parameters, thereby ignoring the effect of processing methods on the mechanical properties of TWIP steel. Therefore, after hot forging, #1 steel was cut into 6 mm thick sheets via wire cutting, polished, and then directly cold rolled to 2 mm; it was annealed at 950 °C for 40 min to obtain 1-C steel with an average grain size of ~11 μm. The microstructure after annealing is shown in Figure 9, which also exhibited a fully recrystallized equiaxed grain microstructure. A comparison of their mechanical properties revealed that the mechanical properties of the two TWIP steels with the same grain size were basically consistent and matched well with the predictions from the machine learning model. This finding indicates that using grain size as an input variable, instead of processing methods, does not affect the prediction accuracy of the model.

4. Conclusions

A machine learning design method that combined comparative modelling, an SHAP analysis, and multi-objective optimization was adopted in this study to design two new TWIP steels, both with high yield strengths and high products of strength and elongation. This method achieved simultaneous improvements in yield strength and a high product of strength and elongation. The specific conclusions are as follows:
(1) Through comparative modelling, a precise prediction of the mechanical properties of TWIP steel was achieved. The SHAP algorithm was subsequently used to analyze and select elements that contributed to comprehensive performance improvements. Using machine-learning-based multi-objective optimization, two new TWIP steels with high yield strengths and high products of strength and elongation were developed.
(2) Under conventional hot rolling + cold rolling annealing processes, the two new TWIP steels had yield strengths of 585 MPa and 560 MPa, ultimate tensile strengths of 1055 MPa and 1101 MPa, elongations of 55% and 58.5%, and strength–ductility products of 58.03 GPa% and 66.41 GPa%, respectively. The yield strength of the new TWIP steels significantly improved while maintaining a reasonable product of strength and elongation.
(3) Considering the characteristics of TWIP steel processing and deformation, grain size was used instead of processing methods to reduce the dimensionality of the input variables, thereby constructing a high-quality composition + microstructure + test condition performance dataset, which facilitated effective machine learning modelling. Currently, we have completed the composition design for the room-temperature mechanical properties of TWIP steel. In future research, we will expand the dataset to include additional performance metrics such as impact, fatigue, and corrosion resistance, with the goal of using machine learning methods to develop new TWIP steels with various performance characteristics.

Supplementary Materials

The following supporting information can be downloaded at: https://www.mdpi.com/article/10.3390/met14080952/s1, Table S1: Detailed information on 273 data points related to the composition, microstructure, and performance of the TWIP steel, which were gathered from relevant literature sources.

Author Contributions

Conceptualization, X.Z., L.J. and L.M.; methodology, X.Z., L.M. and N.Z.; software, X.Z. and W.W.; validation, X.Z. and J.X.; formal analysis, X.Z.; investigation, X.Z.; resources, X.Z.; data curation, X.Z.; writing—original draft preparation, X.Z.; writing—review and editing, L.J. and L.M.; visualization, X.Z.; supervision, L.M. and N.Z.; project administration, L.M.; funding acquisition, X.Z. and L.M. All authors have read and agreed to the published version of the manuscript.

Funding

This research was funded by the Program of the Central Iron and Steel Research Institute, Research and Development Special Fund (grant number 21162650B).

Data Availability Statement

The raw data supporting the conclusions of this article will be made available by the authors on request.

Acknowledgments

Thanks to Lei Jiang and Li Meng for their guidance.

Conflicts of Interest

The author Xiaozhou Zhou, Jiangjie Xu, Li Meng, Wenshan Wang and Ning Zhang was employed by the company Central Iron and Steel Research Institute. The remaining authors declare that the research was conducted in the absence of any commercial or financial relationships that could be construed as a potential conflict of interest.

References

  1. De Cooman, B.C.; Estrin, Y.; Kim, S.K. Twinning-induced plasticity (TWIP) steels. Acta Mater. 2018, 142, 283–362. [Google Scholar] [CrossRef]
  2. Yang, G.-H.; Kim, J.-K. An overview of high yield strength twinning-induced plasticity steels. Metals 2021, 11, 124. [Google Scholar] [CrossRef]
  3. Bastidas, D.M.; Ress, J.; Bosch, J.; Martin, U. Corrosion Mechanisms of High-Mn Twinning-Induced Plasticity (TWIP) Steels: A Critical Review. Metals 2021, 11, 287. [Google Scholar] [CrossRef]
  4. Sugimoto, K.; Hojo, T.; Srivastava, A.K. Low and Medium Carbon Advanced High-Strength Forging Steels for Automotive Applications. Metals 2019, 9, 1263. [Google Scholar] [CrossRef]
  5. Dini, G.; Najafizadeh, A.; Ueji, R.; Monir-Vaghefi, S.M. Improved tensile properties of partially recrystallized submicron grained TWIP steel. Mater. Lett. 2010, 64, 15–18. [Google Scholar] [CrossRef]
  6. Dini, G.; Najafizadeh, A.; Ueji, R.; Monir-Vaghefi, S.M. Tensile deformation behavior of high manganese austenitic steel: The role of grain size. Mater. Des. 2010, 31, 3395–3402. [Google Scholar] [CrossRef]
  7. Kang, S.; Jung, J.-G.; Kang, M.-H.; Woo, W.; Lee, Y.-K. The effects of grain size on yielding, strain hardening, and mechanical twinning in Fe-18Mn-0.6C-1.5Al twinning-induced plasticity steel. Mater. Sci. Eng. A 2016, 652, 212–220. [Google Scholar] [CrossRef]
  8. Gutierrez-Urrutia, I.; Raabe, D. Grain size effect on strain hardening in twinning-induced plasticity steels. Scr. Mater. 2012, 66, 992–996. [Google Scholar] [CrossRef]
  9. Li, D.-D.; Qian, L.-H.; Wei, C.-Z.; Liu, S.; Zhang, F.-C.; Meng, J.-Y. The tensile properties and microstructure evolution of cold-rolled Fe-Mn-C TWIP steels with different carbon contents. Mater. Sci. Eng. A 2022, 839, 142862. [Google Scholar] [CrossRef]
  10. Li, S.-H.; Wang, X.-L.; Chen, C.-F. Effect of annealing temperature on carbide precipitation, microstructure and mechanical properties of Fe-Mn-C- (Cr, Mo, W, Ni, Nb, Ti, V) multi-alloying TWIP steel. Mater. Today Commun. 2024, 39, 108895. [Google Scholar] [CrossRef]
  11. Hamada, A.; Kömi, J. Effect of microstructure on mechanical properties of a novel high-Mn TWIP stainless steel bearing vanadium. Mater. Sci. Eng. A 2018, 718, 301–304. [Google Scholar] [CrossRef]
  12. Lan, F.; Du, W.; Zhuang, C.; Li, C. Effect of niobium on inclusions in Fe-Mn-C-Al twinning-induced plasticity steel. Metals 2021, 11, 83. [Google Scholar] [CrossRef]
  13. Lee, S.G.; Kim, B.; Jo, M.C. Effects of Cr addition on Charpy impact energy in austenitic 0.45C-24Mn-(0,3,6)Cr steels. J. Mater. Sci. Technol. 2020, 50, 21–30. [Google Scholar] [CrossRef]
  14. Wang, X.-J.; Sun, X.-J.; Song, C.-W. Evolution of microstructures and mechanical properties during solution treatment of a Ti-V-Mo-containing high-manganese cryogenic steel. Mater. Charact. 2018, 135, 287–294. [Google Scholar] [CrossRef]
  15. Kim, B.; Lee, S.G.; Kim, D.W. Effects of Ni and Cu addition on cryogenic-temperature tensile and Charpy impact properties in austenitic 22Mn-0.45C-1Al steels. J. Alloys Compd. 2020, 815, 152407. [Google Scholar] [CrossRef]
  16. Gwon, H.; Kim, J.-K.; Shin, S. The effect of vanadium micro-alloying on the microstructure and the tensile behavior of TWIP steel. Mater. Sci. Eng. A 2017, 696, 416–428. [Google Scholar] [CrossRef]
  17. Li, D.-J.; Feng, Y.-R.; Song, S.-Y. Influences of Nb-microalloying on microstructure and mechanical properties of Fe-25Mn-3Si-3Al TWIP steel. Mater. Des. 2015, 84, 238–244. [Google Scholar] [CrossRef]
  18. Wang, X.-J.; Sun, X.-J.; Song, C. Enhancement of yield strength by chromium/nitrogen alloying in high-manganese cryogenic steel. Mater. Sci. Eng. A 2017, 698, 110–116. [Google Scholar] [CrossRef]
  19. Tang, L.; Jiang, F.-Q.; Liu, H.-B. In situ neutron diffraction reveals the effect of Cu micro-alloying on low-temperature tensile properties of TWIP steels. Mater. Sci. Eng. A 2022, 845, 143211. [Google Scholar] [CrossRef]
  20. Jin, J.-E.; Lee, Y.-K. Effects of Al on microstructure and tensile properties of C-bearing high Mn TWIP steel. Acta Mater. 2012, 60, 1680–1688. [Google Scholar] [CrossRef]
  21. Pattanayak, S.; Dey, S.; Chatterjee, S.; Chowdhury, S.G.; Datta, S.P. Computational intelligence based designing of microalloyed pipeline steel. Comput. Mater. Sci. 2015, 104, 60–68. [Google Scholar] [CrossRef]
  22. Reddy, N.S.; Krishnaiah, J.; Young, H.B. Design of medium carbon steels by computational intelligence techniques. Comput. Mater. Sci. 2015, 101, 120–126. [Google Scholar] [CrossRef]
  23. Lee, J.-Y.; Kim, M.; Lee, Y.-K. Design of high strength medium-Mn steel using machine learning. Mater. Sci. Eng. A 2022, 843, 143148. [Google Scholar] [CrossRef]
  24. Seghier, M.E.A.B.; Gao, X.-Z.; Jafari-Asl, J.; Thai, D.K. Modeling the nonlinear behavior of ACC for SCFST columns using experimental-data and a novel evolutionary-algorithm. Structures 2021, 30, 692–709. [Google Scholar] [CrossRef]
  25. Seghier, M.E.A.B.; Kechtegar, B.; Amar, M.N. Simulation of the ultimate conditions of fibre-reinforced polymer confined concrete using hybrid intelligence models. Eng. Fail. Anal. 2021, 128, 105605. [Google Scholar] [CrossRef]
  26. Jiang, L.; Fu, H.-D.; Zhang, Z.-H.; Zhang, H.-T. Synchronously enhancing the strength, toughness, and stress corrosion resistance of high-end aluminum alloys via interpretable machine learning. Acta Mater. 2024, 270, 119873. [Google Scholar] [CrossRef]
  27. Jiang, L.; Wang, C.-S.; Fu, H.-D. Discovery of aluminum alloys with ultra-strength and high-toughness via a property-oriented design strategy. J. Mater. Sci. Technol. 2022, 98, 33–43. [Google Scholar] [CrossRef]
  28. Zhang, Z.-H.; Fu, H.-D.; Zhu, S.-C.; Yong, W. Machine learning assisted composition effective design for precipitation strengthened copper alloys. Acta Mater. 2021, 215, 117118. [Google Scholar] [CrossRef]
  29. Zhang, Z.-H.; Fu, H.-D.; He, X.-Q. Dramatically enhanced combination of ultimate tensile strength and electric conductivity of alloys via machine learning screening. Acta Mater. 2020, 200, 803–810. [Google Scholar] [CrossRef]
  30. Ruan, J.-J.; Xu, W.-W.; Yang, T.-R. Accelerated design of novel W-free high-strength Co-base superalloys with extremely wide γ/γʹ region by machine learning and CALPHAD methods. Acta Mater. 2020, 186, 425–433. [Google Scholar] [CrossRef]
  31. Xiong, J.; Shi, S.-Q.; Zhang, T.-Y. A machine-learning approach to predicting and understanding the properties of amorphous metallic alloys. Mater. Des. 2020, 187, 108378. [Google Scholar] [CrossRef]
  32. Yang, H.-K.; Zhang, Z.-J.; Dong, F.-Y. Strain rate effects on tensile deformation behaviors for Fe-22Mn-0.6 C-(1.5 Al) twinning-induced plasticity steel. Mater. Sci. Eng. A 2014, 607, 551–558. [Google Scholar] [CrossRef]
  33. Sun, S.-H.; Xue, Z.-Y. Effect of Aging Process on the Strain Rate Sensitivity in V-Containing TWIP Steel. Metals 2021, 11, 126. [Google Scholar] [CrossRef]
  34. Seghier, M.E.A.B.; Plevris, V.; Solorzano, G. Random forest-based algorithms for accurate evaluation of ultimate bending capacity of steel tubes. Structures 2022, 44, 261–273. [Google Scholar] [CrossRef]
  35. Lundberg, S.M.; Lee, S.I. A unified approach to interpreting model predictions. Adv. Neural Inf. Process. Syst. 2017, 30, 4768–4777. [Google Scholar]
  36. Shi, B.F.; Lookman, T.; Xue, D.-Z. Multi-objective optimization and its application in materials science. Mater. Genome Eng. Adv. 2023, 1, e14. [Google Scholar] [CrossRef]
  37. Chen, Y.-F.; Tian, Y.; Zhou, Y.-M. Machine learning assisted multi-objective optimization for materials processing parameters: A case study in Mg alloy. J. Alloys Compd. 2020, 844, 156159. [Google Scholar] [CrossRef]
  38. Scott, C.; Remy, B.; Collet, J.L. Precipitation strengthening in high manganese austenitic TWIP steels. Int. J. Mater. Res. 2011, 102, 538–549. [Google Scholar] [CrossRef]
Figure 1. Machine learning design strategy for high-yield-strength TWIP steel.
Metals 14 00952 g001
Figure 2. Data distribution in the dataset: (a) statistical chart of the element quantity distribution in alloys, (b) distribution map of the element types and contents, (c) histogram of the grain size distribution, and (d) histogram of the strain rate distribution pie chart distribution of the property range: (e) YS, (f) UTS, and (g) EL.
Metals 14 00952 g002
Figure 3. Performance of different machine learning algorithms in modelling yield strength, ultimate tensile strength, and elongation: (a1a3) XGB, (b1b3) GBR, (c1c3) RF, (d1d3) ANN, (e1e3) SVR, (f1f3) LR.
Metals 14 00952 g003
Figure 4. SHAP values of the influencing factors in the models for yield strength, ultimate tensile strength, and elongation: (a) YS, (b) UTS, (c) EL.
Metals 14 00952 g004
Figure 5. Multi-objective optimization results via machine learning: (a) three-dimensional Pareto front search results for the YS, UTS, and EL, and (b) two-dimensional Pareto front search results for the YS and PSE.
Metals 14 00952 g005
Figure 6. Comparison of performance data between the TWIP steel designed in this study and the TWIP steel in the dataset.
Metals 14 00952 g006
Figure 7. Microstructure analysis of TWIP steel: (a) EBSD image of TWIP-1 steel after annealing at 950 °C for 50 min; (b) EBSD image of TWIP-2 steel after annealing at 950 °C for 30 min; (ce) SEM images and Nb and Ti elemental maps of TWIP-1 steel after annealing at 950 °C for 50 min; (f) SEM image of TWIP-2 steel after annealing at 950 °C for 30 min.
Metals 14 00952 g007
Figure 8. TEM analysis of TWIP steel: (a) TEM microstructure image of #1 steel annealed at 950 °C for 50 min, (b) TEM microstructure image of #2 steel annealed at 950 °C for 50 min, (c,d) high-resolution morphology image and diffraction pattern of VC in TWIP-1 steel.
Metals 14 00952 g008
Figure 9. 1-C steel: (a) microstructure and (b) mechanical properties.
Metals 14 00952 g009
Table 1. Search space for alloy composition design.
Mass Fraction of Element/wt.%d
/μm
V
/s−1
MnCAlSiCrVNbTiCuMoNiN
Lower limit000000000000100.001
Upper limit3013340.50.30.10000100.001
Table 2. Predicted and measured compositions and predicted and measured properties of the #1 and #2 alloys.
Mass Fraction of Element/wt.%d
/μm
V
/s−1
YS
/MPa
UTS
/MPa
EL
/%
SPD
(GPa%)
MnCAlSiCrVNbTi
#1Pre15.840.682.382.051.860.490.300.05100.001593105052.555.1
Exp16.020.662.281.981.840.480.280.0610.410.001585 ± 6.31055 ± 5.755.1±58.1
#2Pre16.880.741.711.701.150.470.010.05100.001553109160.966.4
Exp17.050.781.651.681.200.450.010.0610.320.001560 ± 7.31101 ± 8.858.5 ± 2.264.4
Disclaimer/Publisher’s Note: The statements, opinions and data contained in all publications are solely those of the individual author(s) and contributor(s) and not of MDPI and/or the editor(s). MDPI and/or the editor(s) disclaim responsibility for any injury to people or property resulting from any ideas, methods, instructions or products referred to in the content.

