
Extraction of Cobalt and Manganese from Ferromanganese Crusts Using Industrial Metal Waste through Leaching


 , , ,
, , , 
 , ,
, ,  ,
, 
Abstract
:1. Introduction
2. Materials and Methods
2.1. Ferromanganese Crusts
2.2. Iron Residue
2.3. Leaching Test
3. Results and Discussion
3.1. Sample Characterization
3.2. Leaching Ferromanganese Crusts
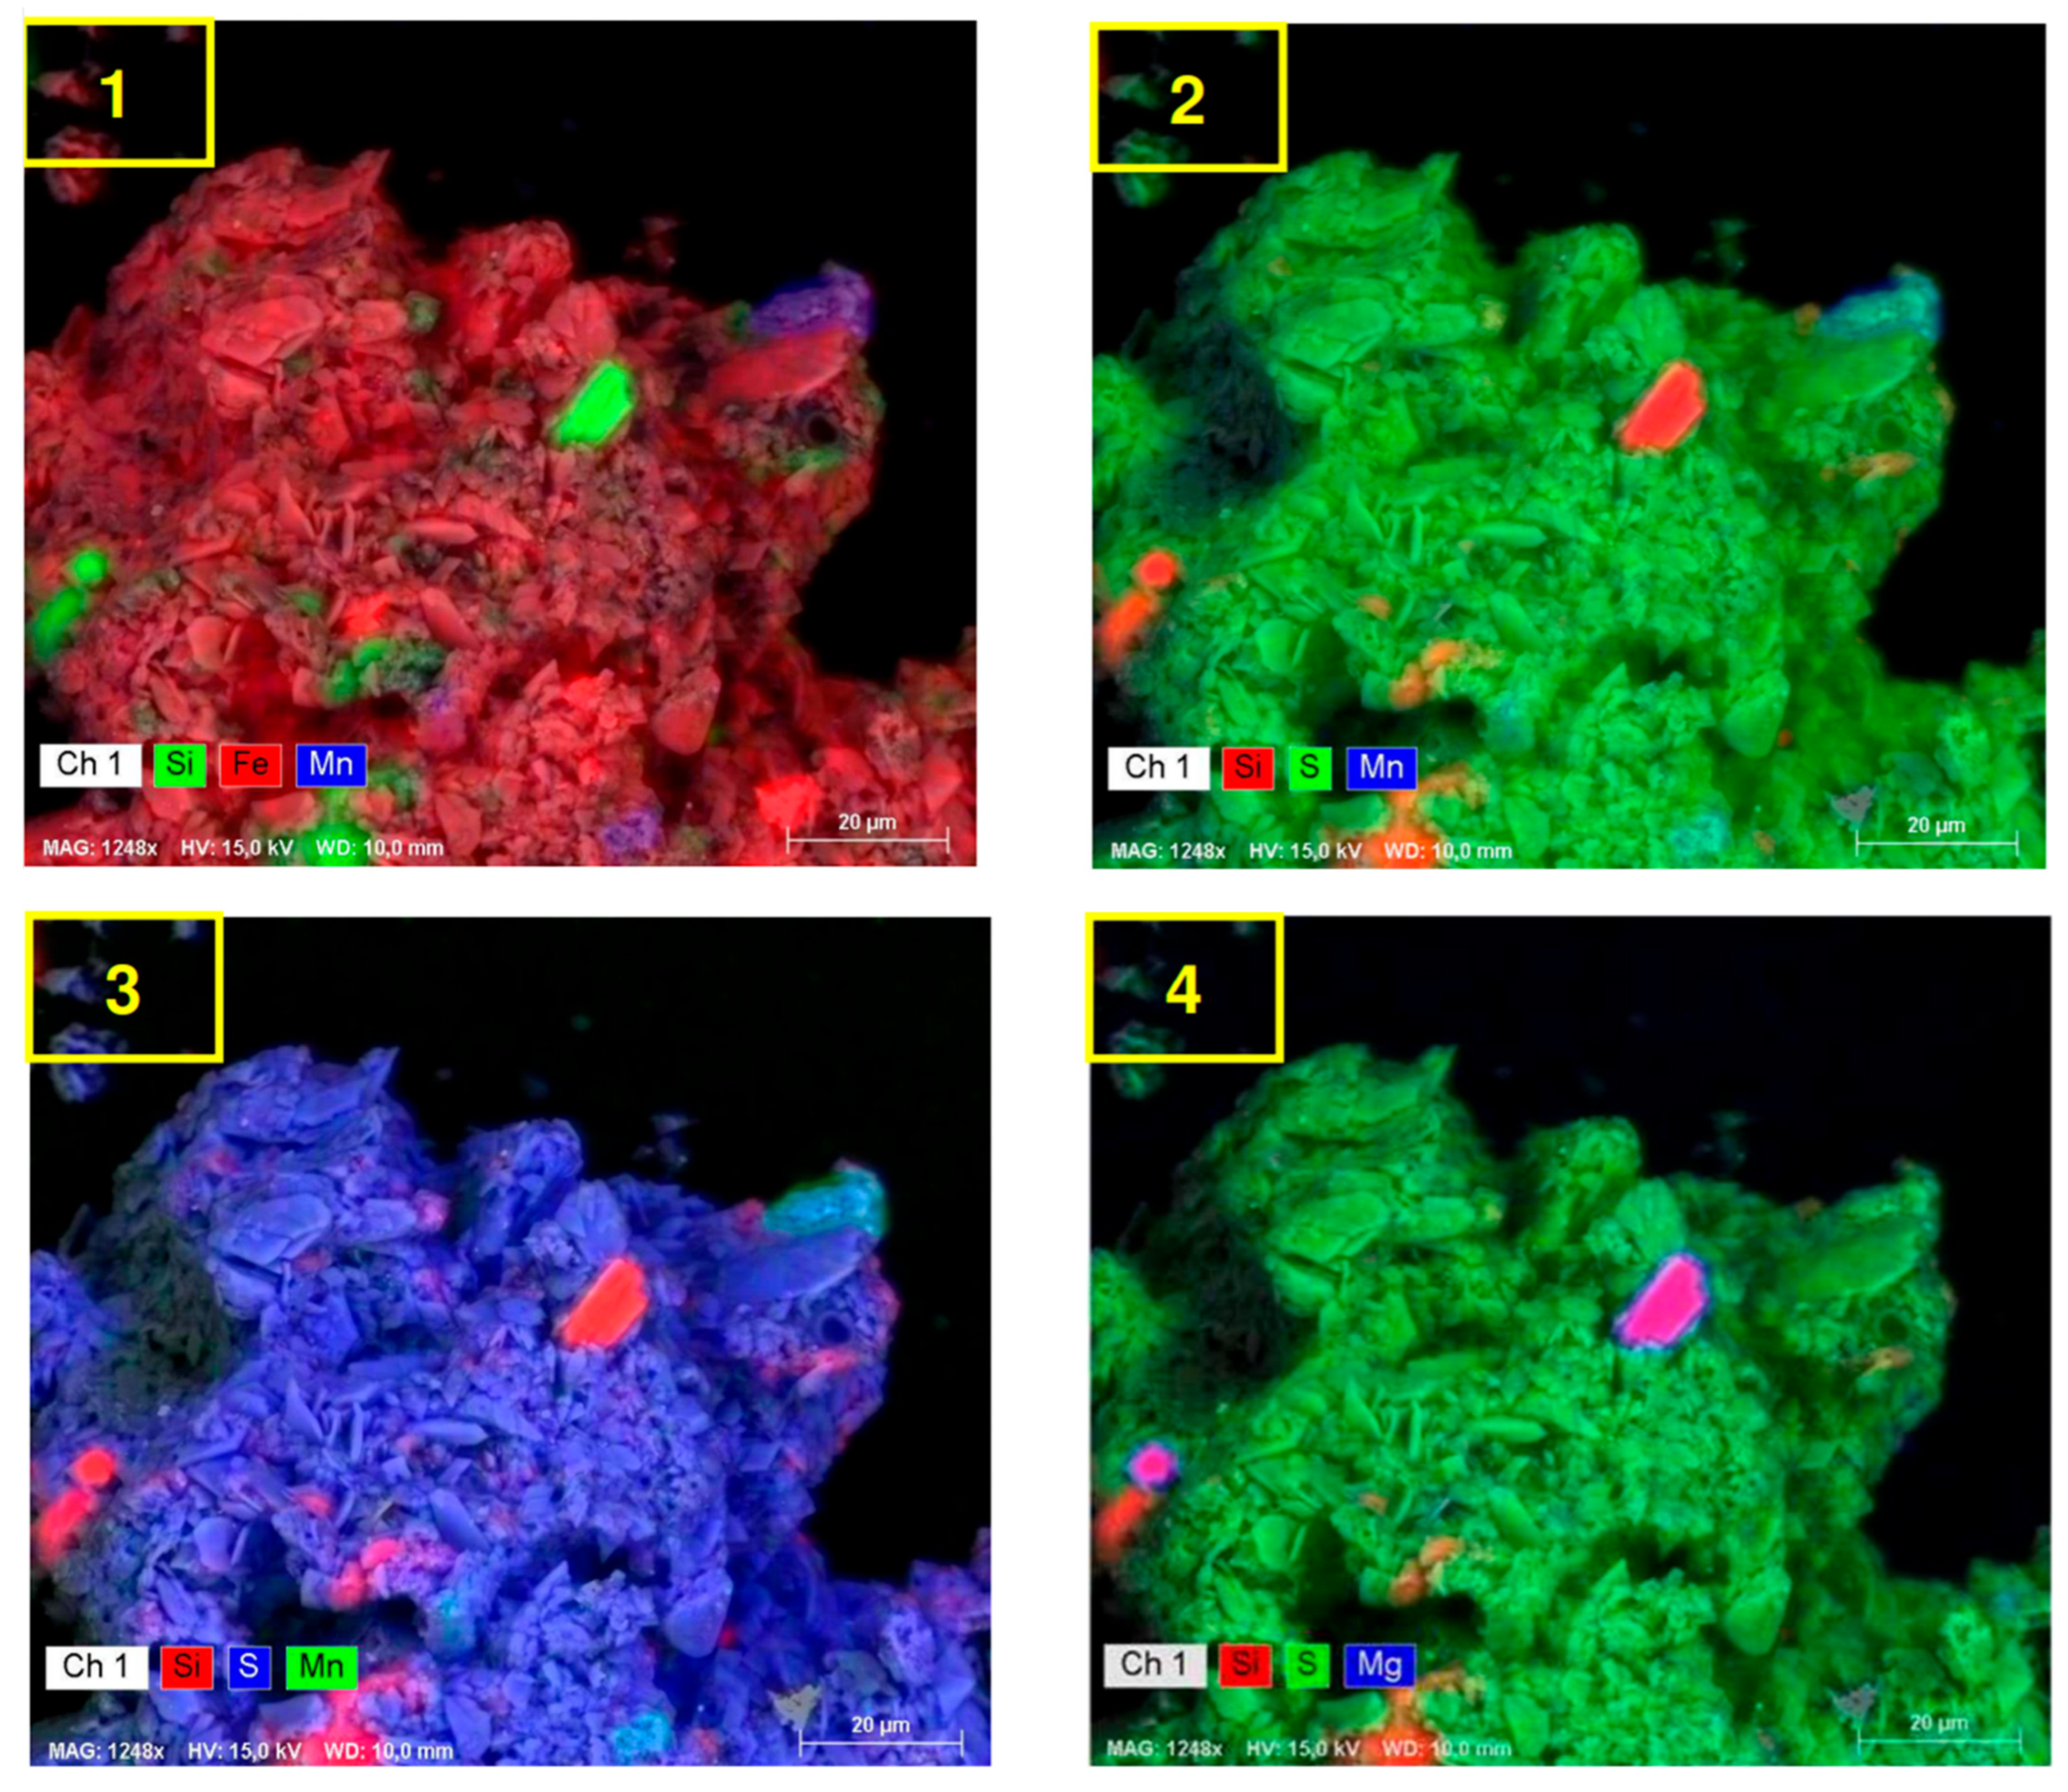
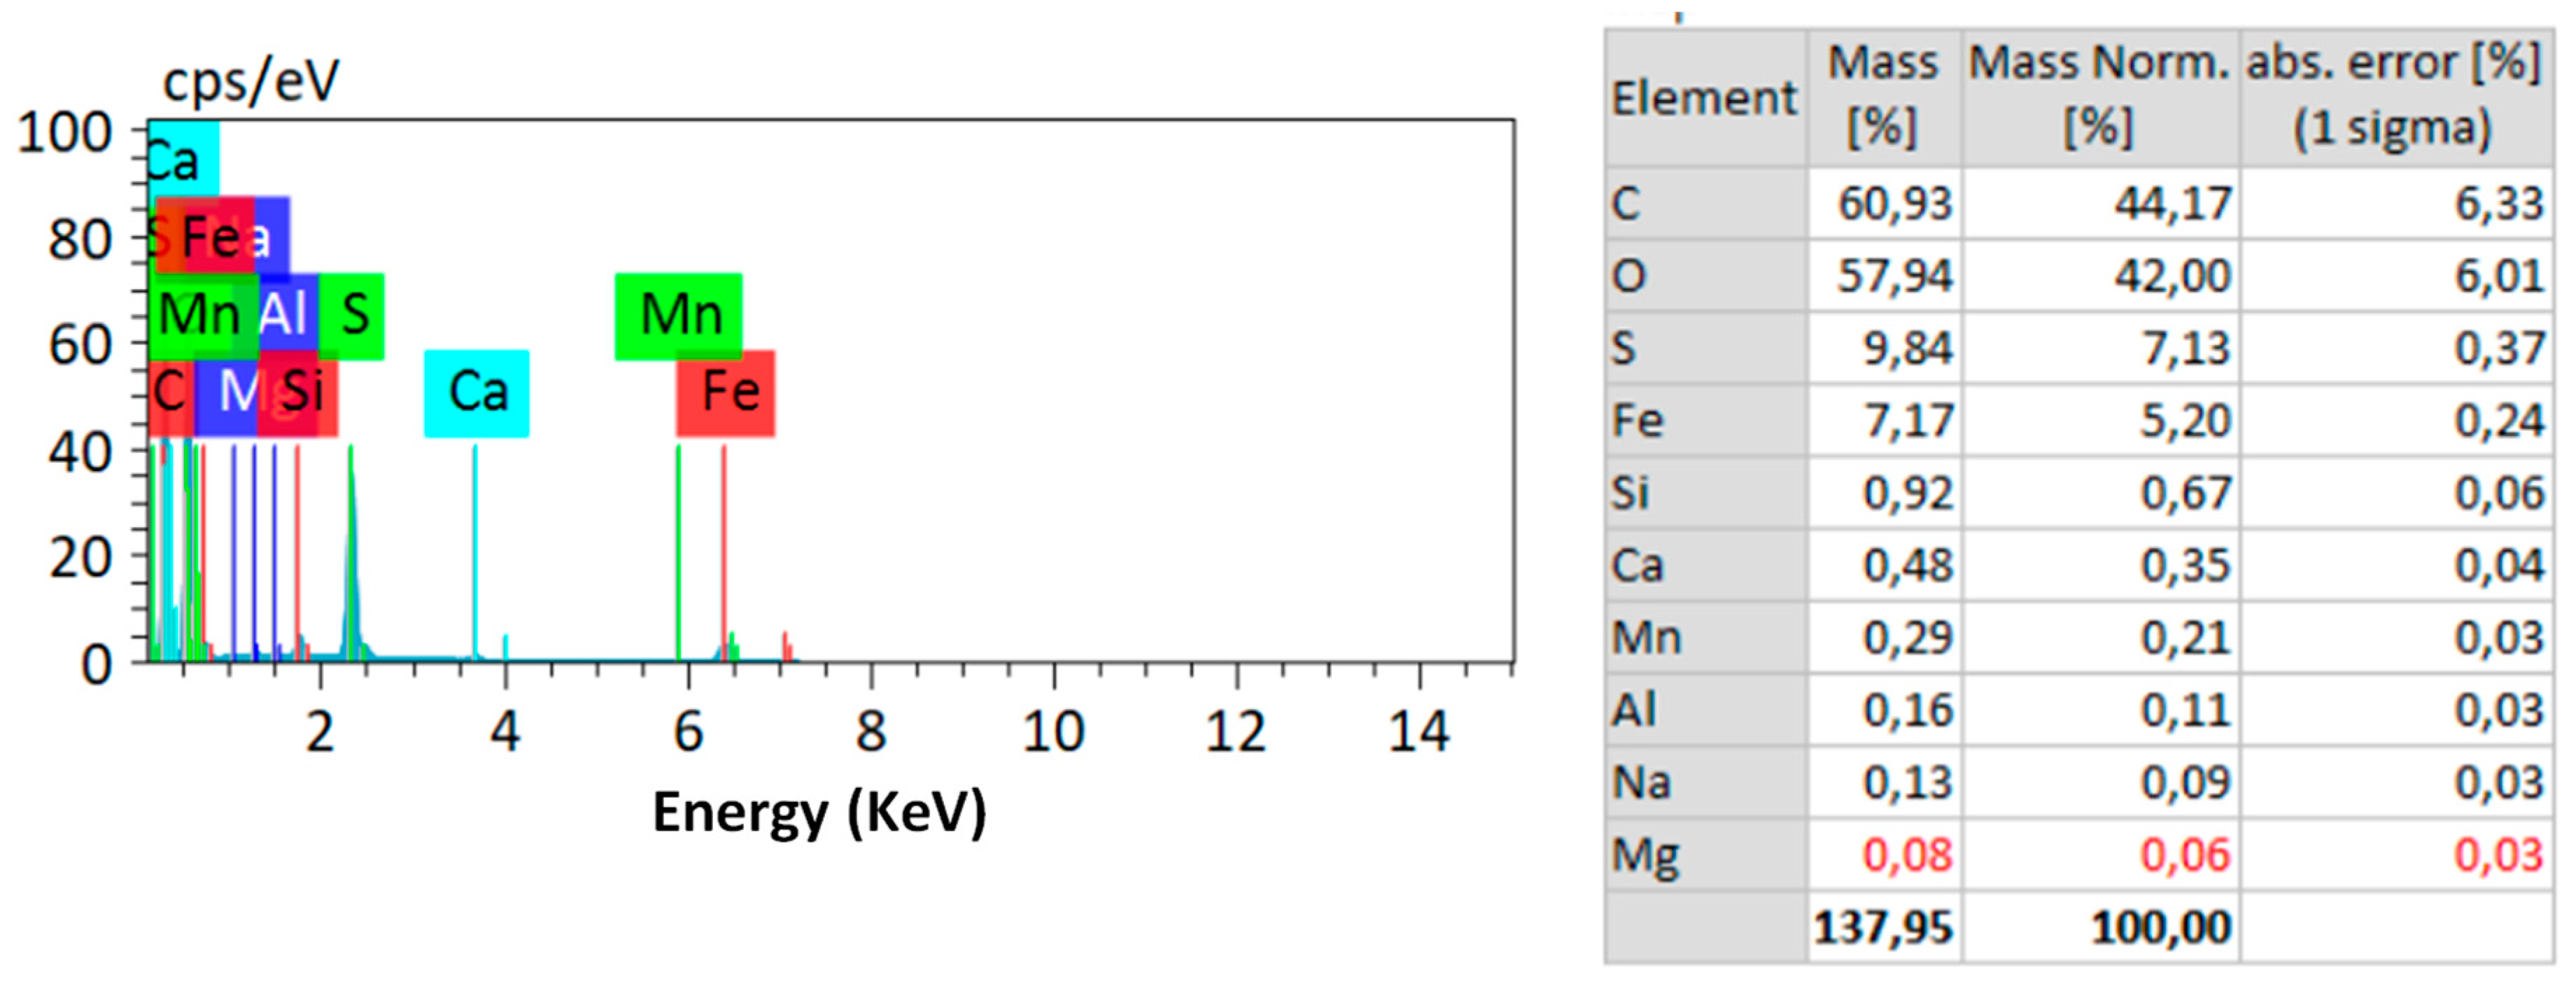
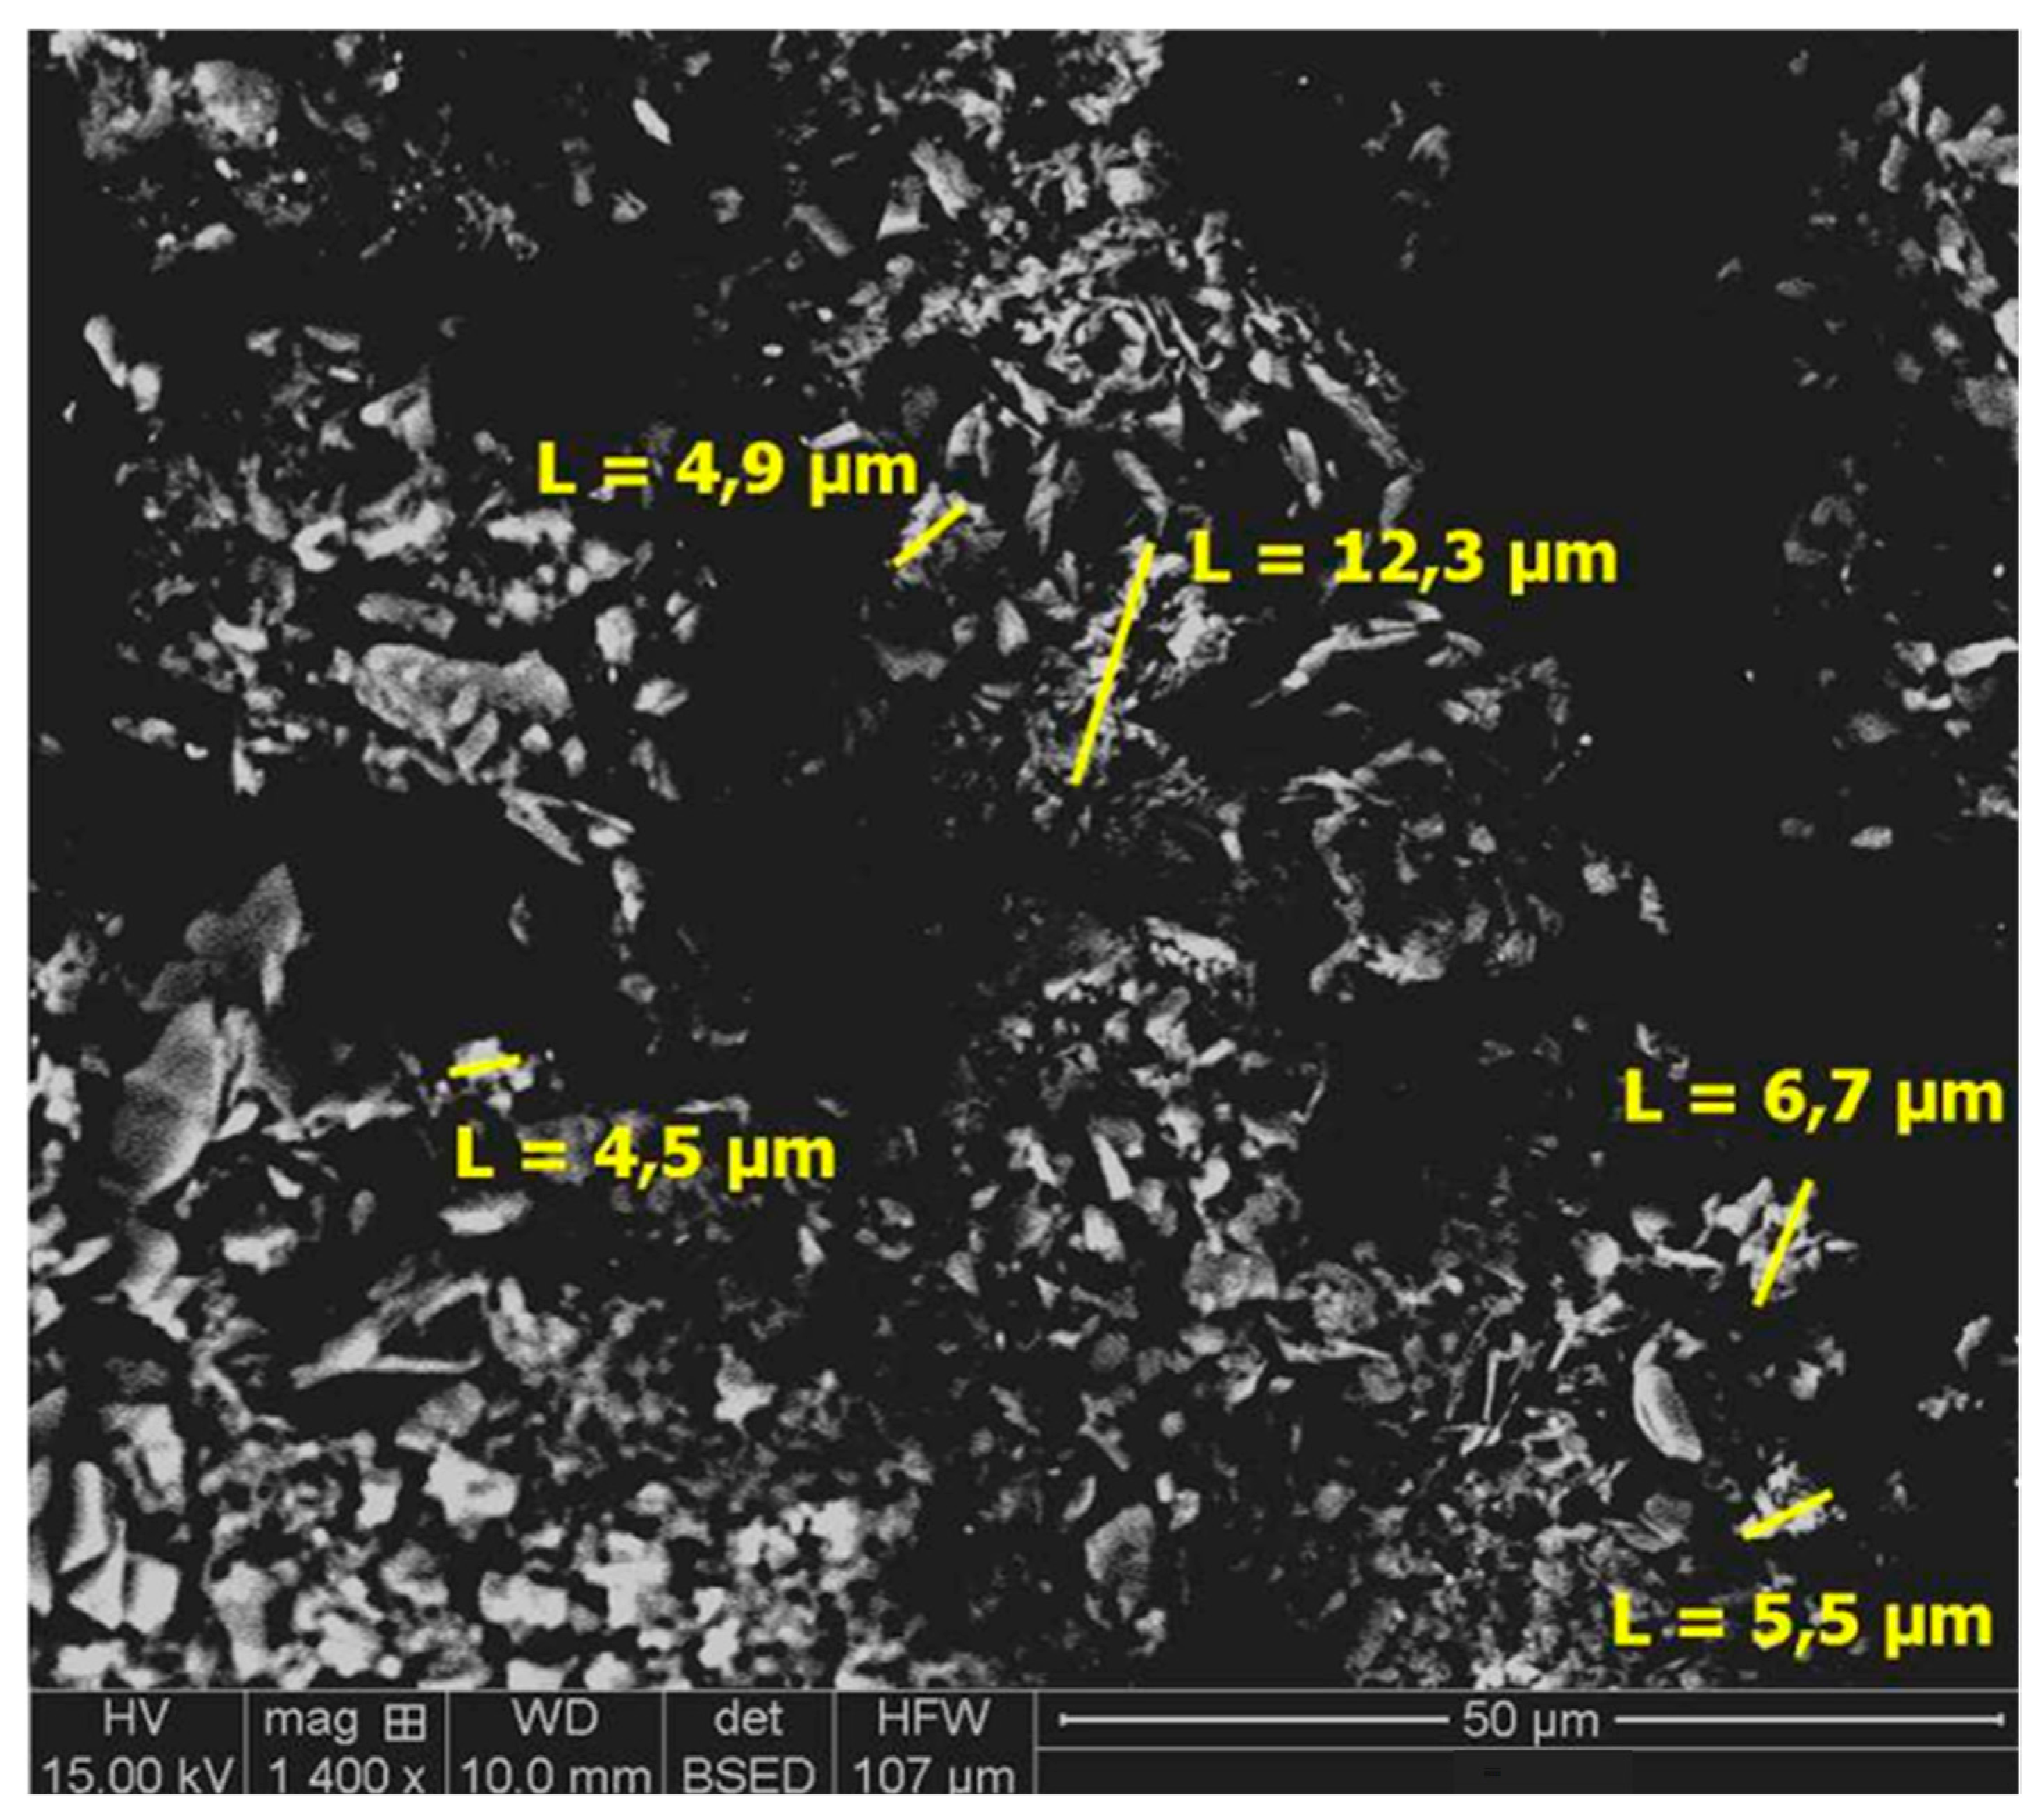
3.3. Residue Analysis
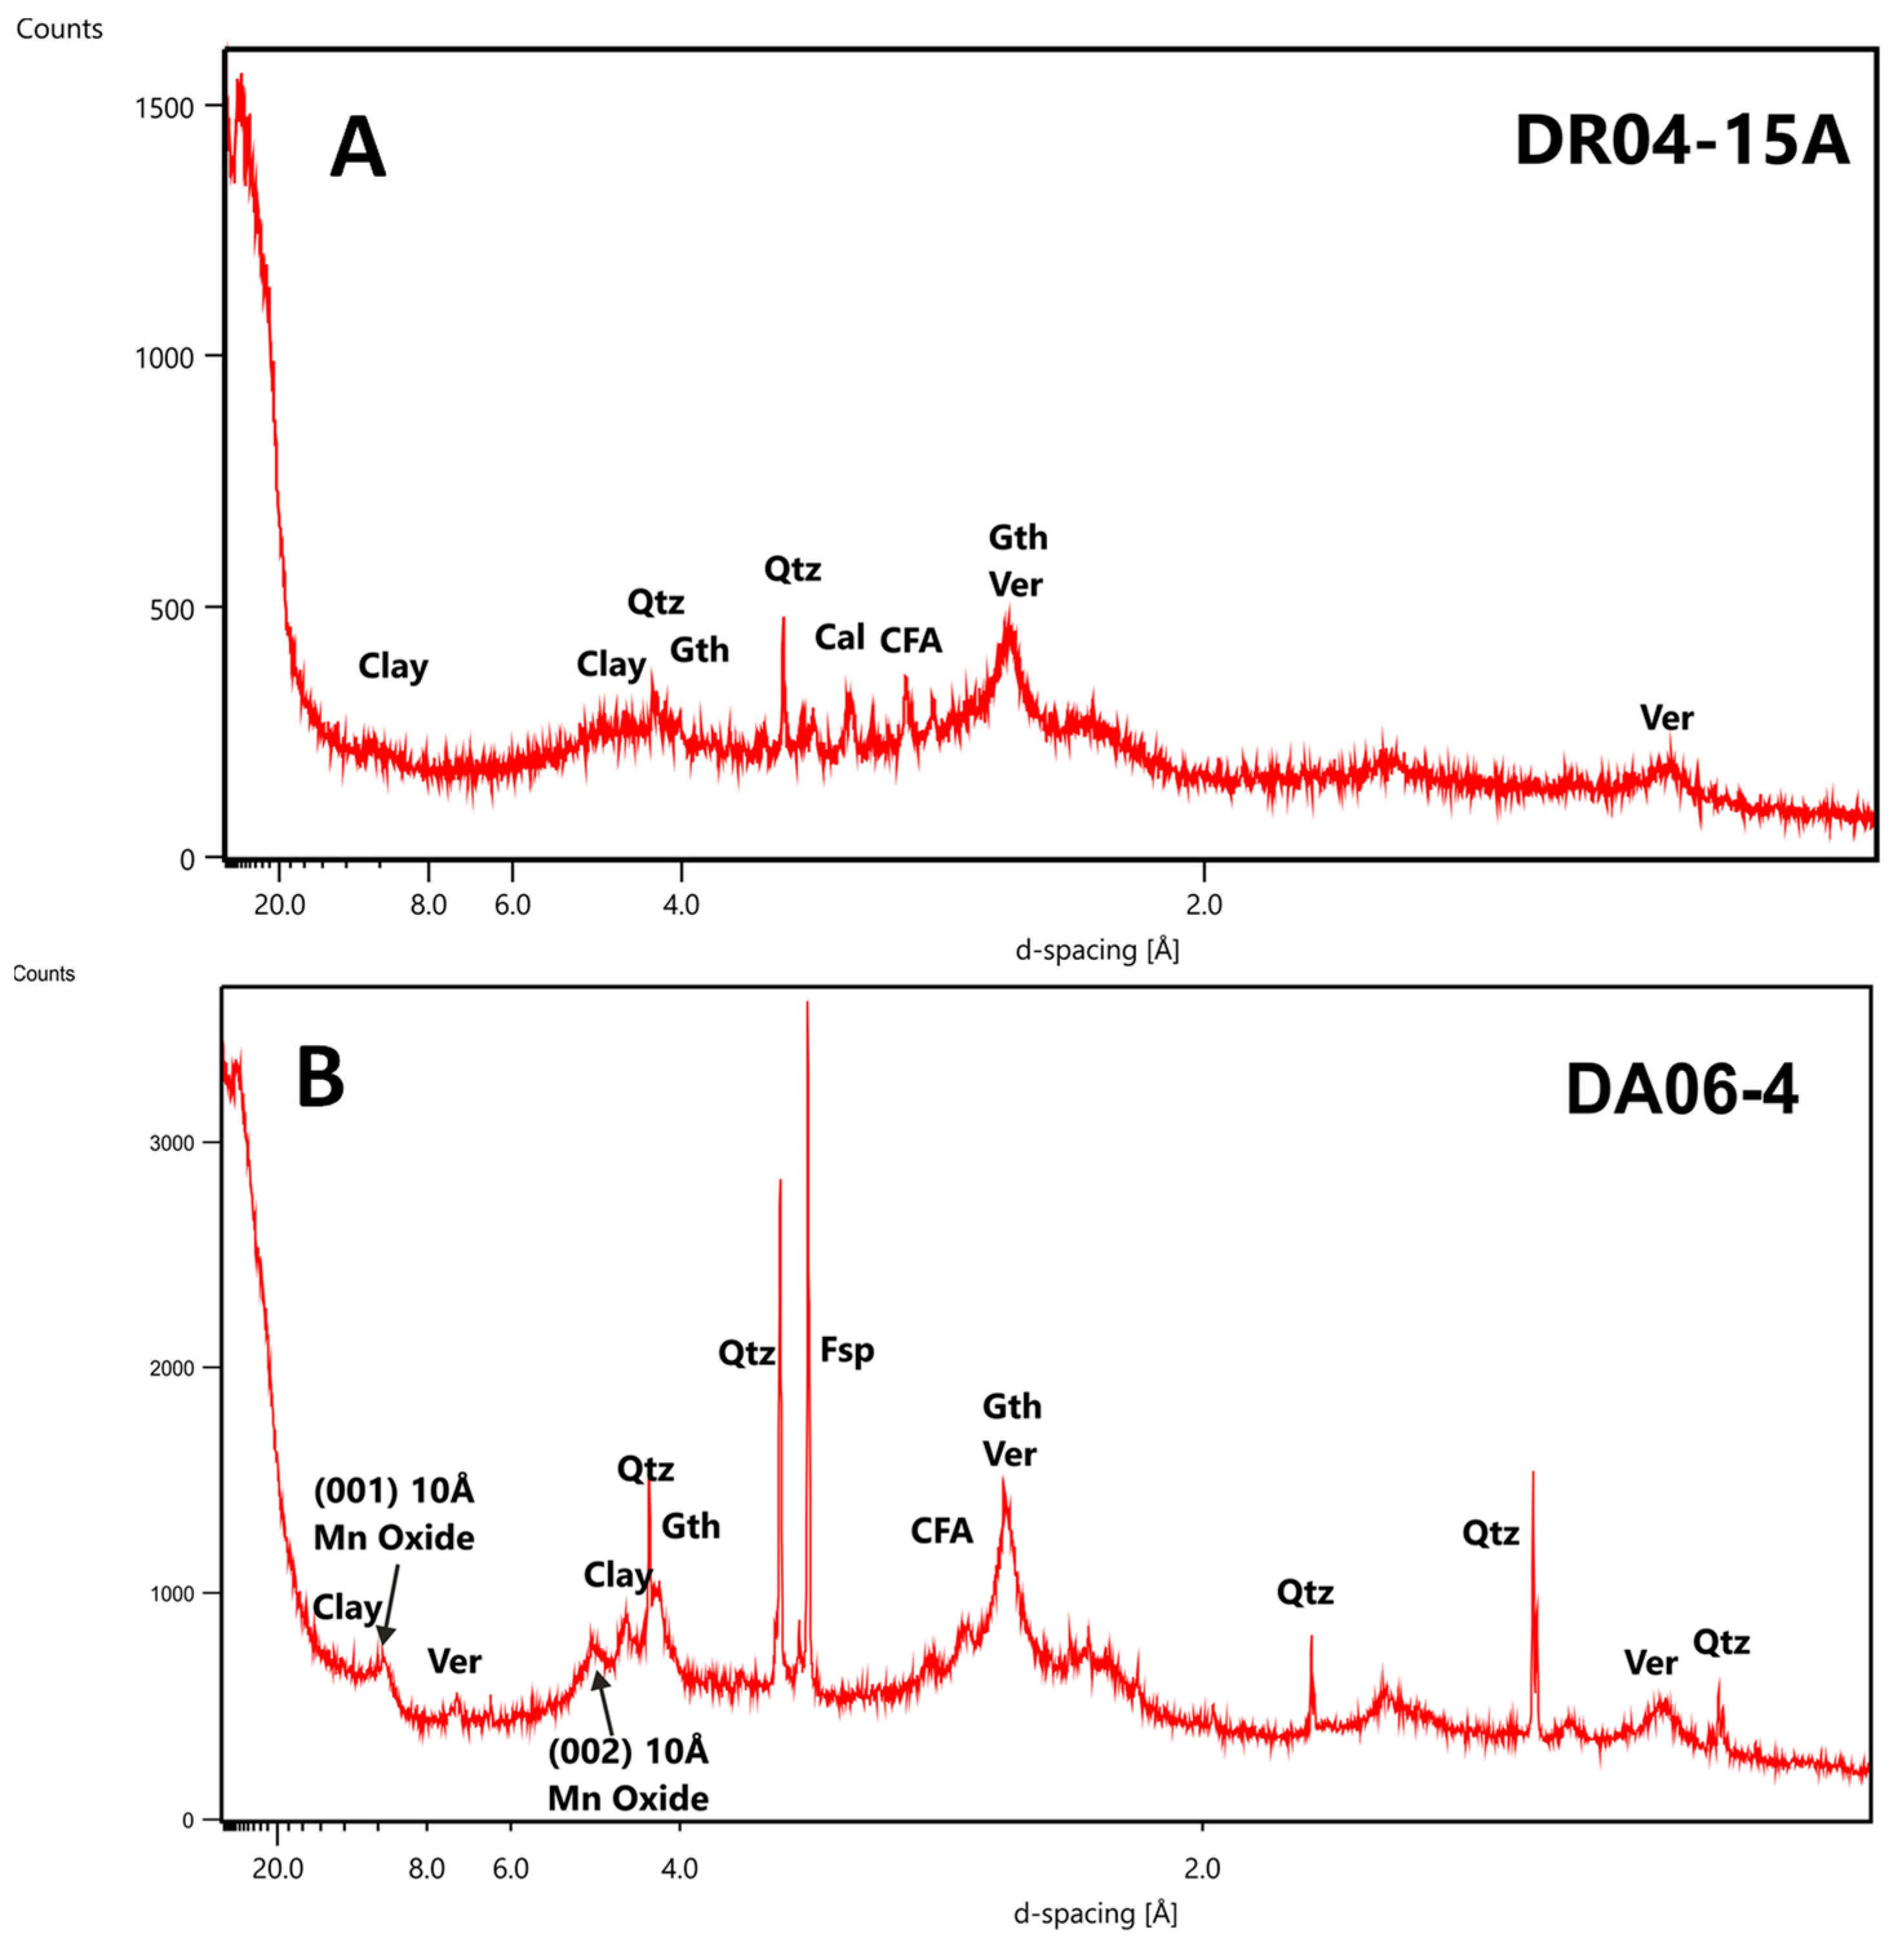
3.3.1. Drago 0511/DR04-15
3.3.2. Subvent 1/DA06-4
4. Conclusions
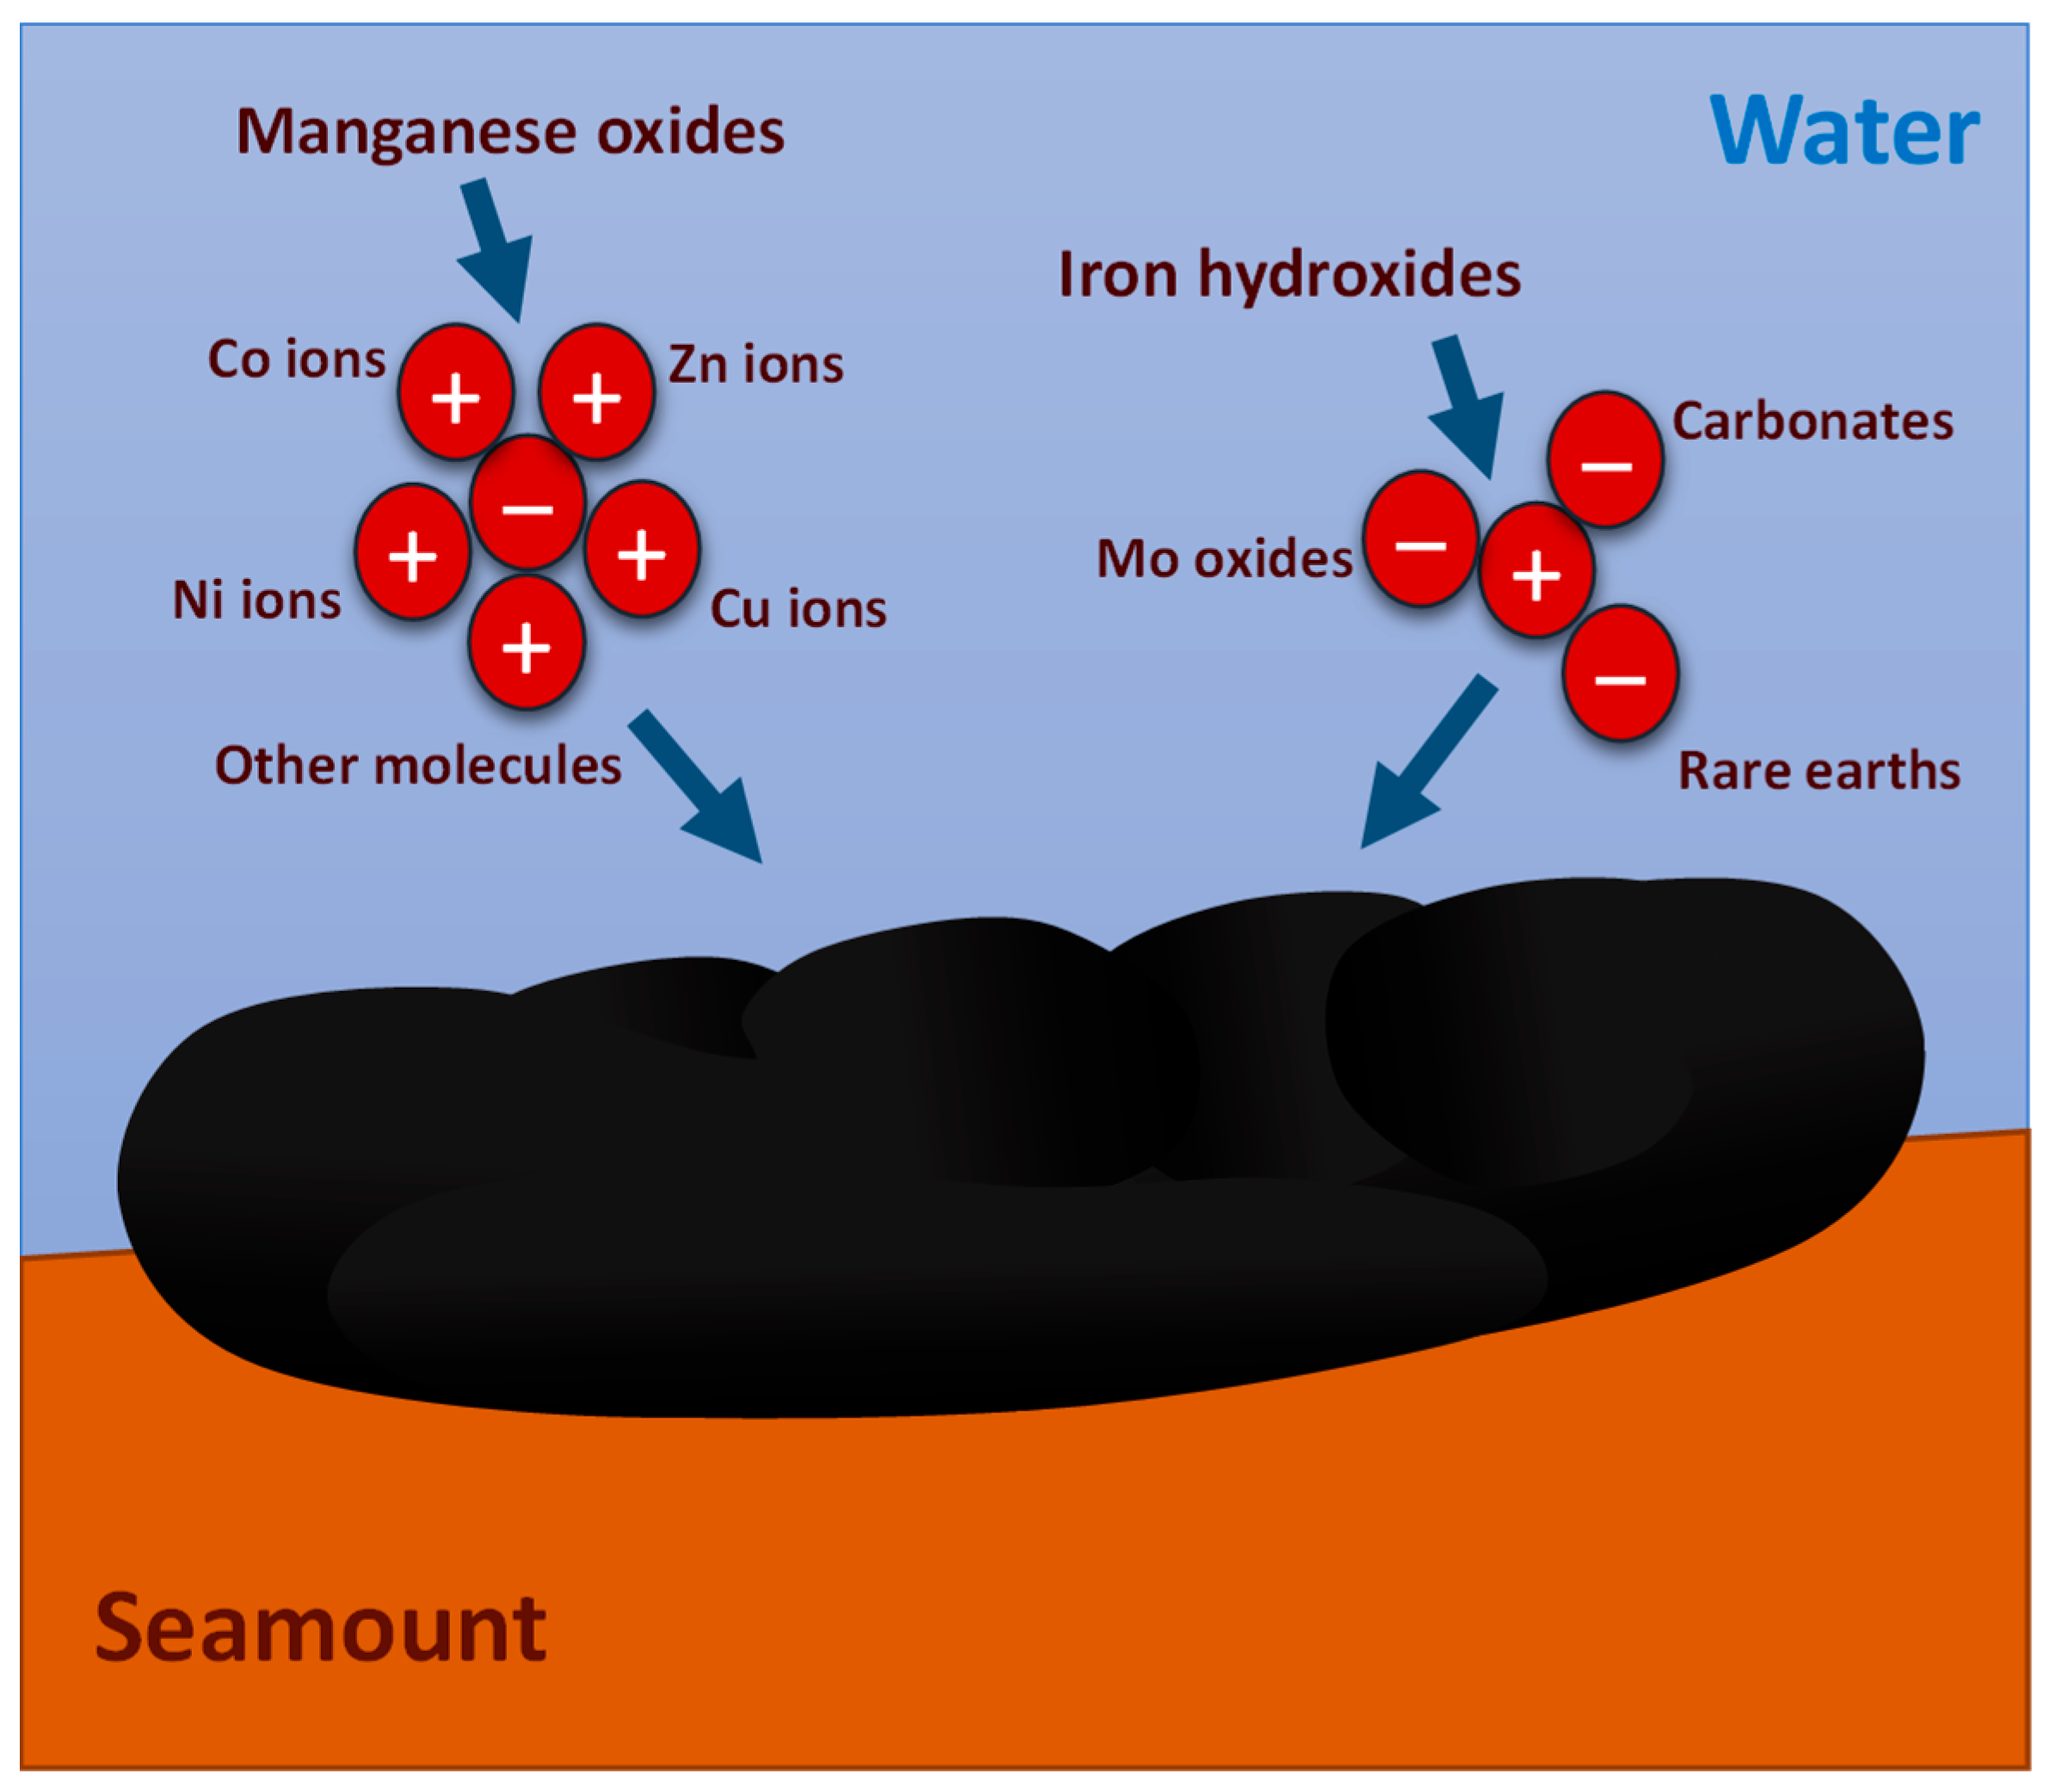
- Studied samples have a general hydrogenic origin formed essentially by Fe-vernadite with some diagenetic influence highlighted by the presence of 10 A Mn oxides (asbolane/buserite). Fe oxyhydroxides are represented essentially by goethite-group minerals. Geochemistry reflects the mineralogy with high contents of Fe and Mn (between 15 and 20 wt. %) and great contents of several CRM as Co, Ni, Cu and REE + Y (average 3300, 2600, 900 and 2300 µg/g, respectively).
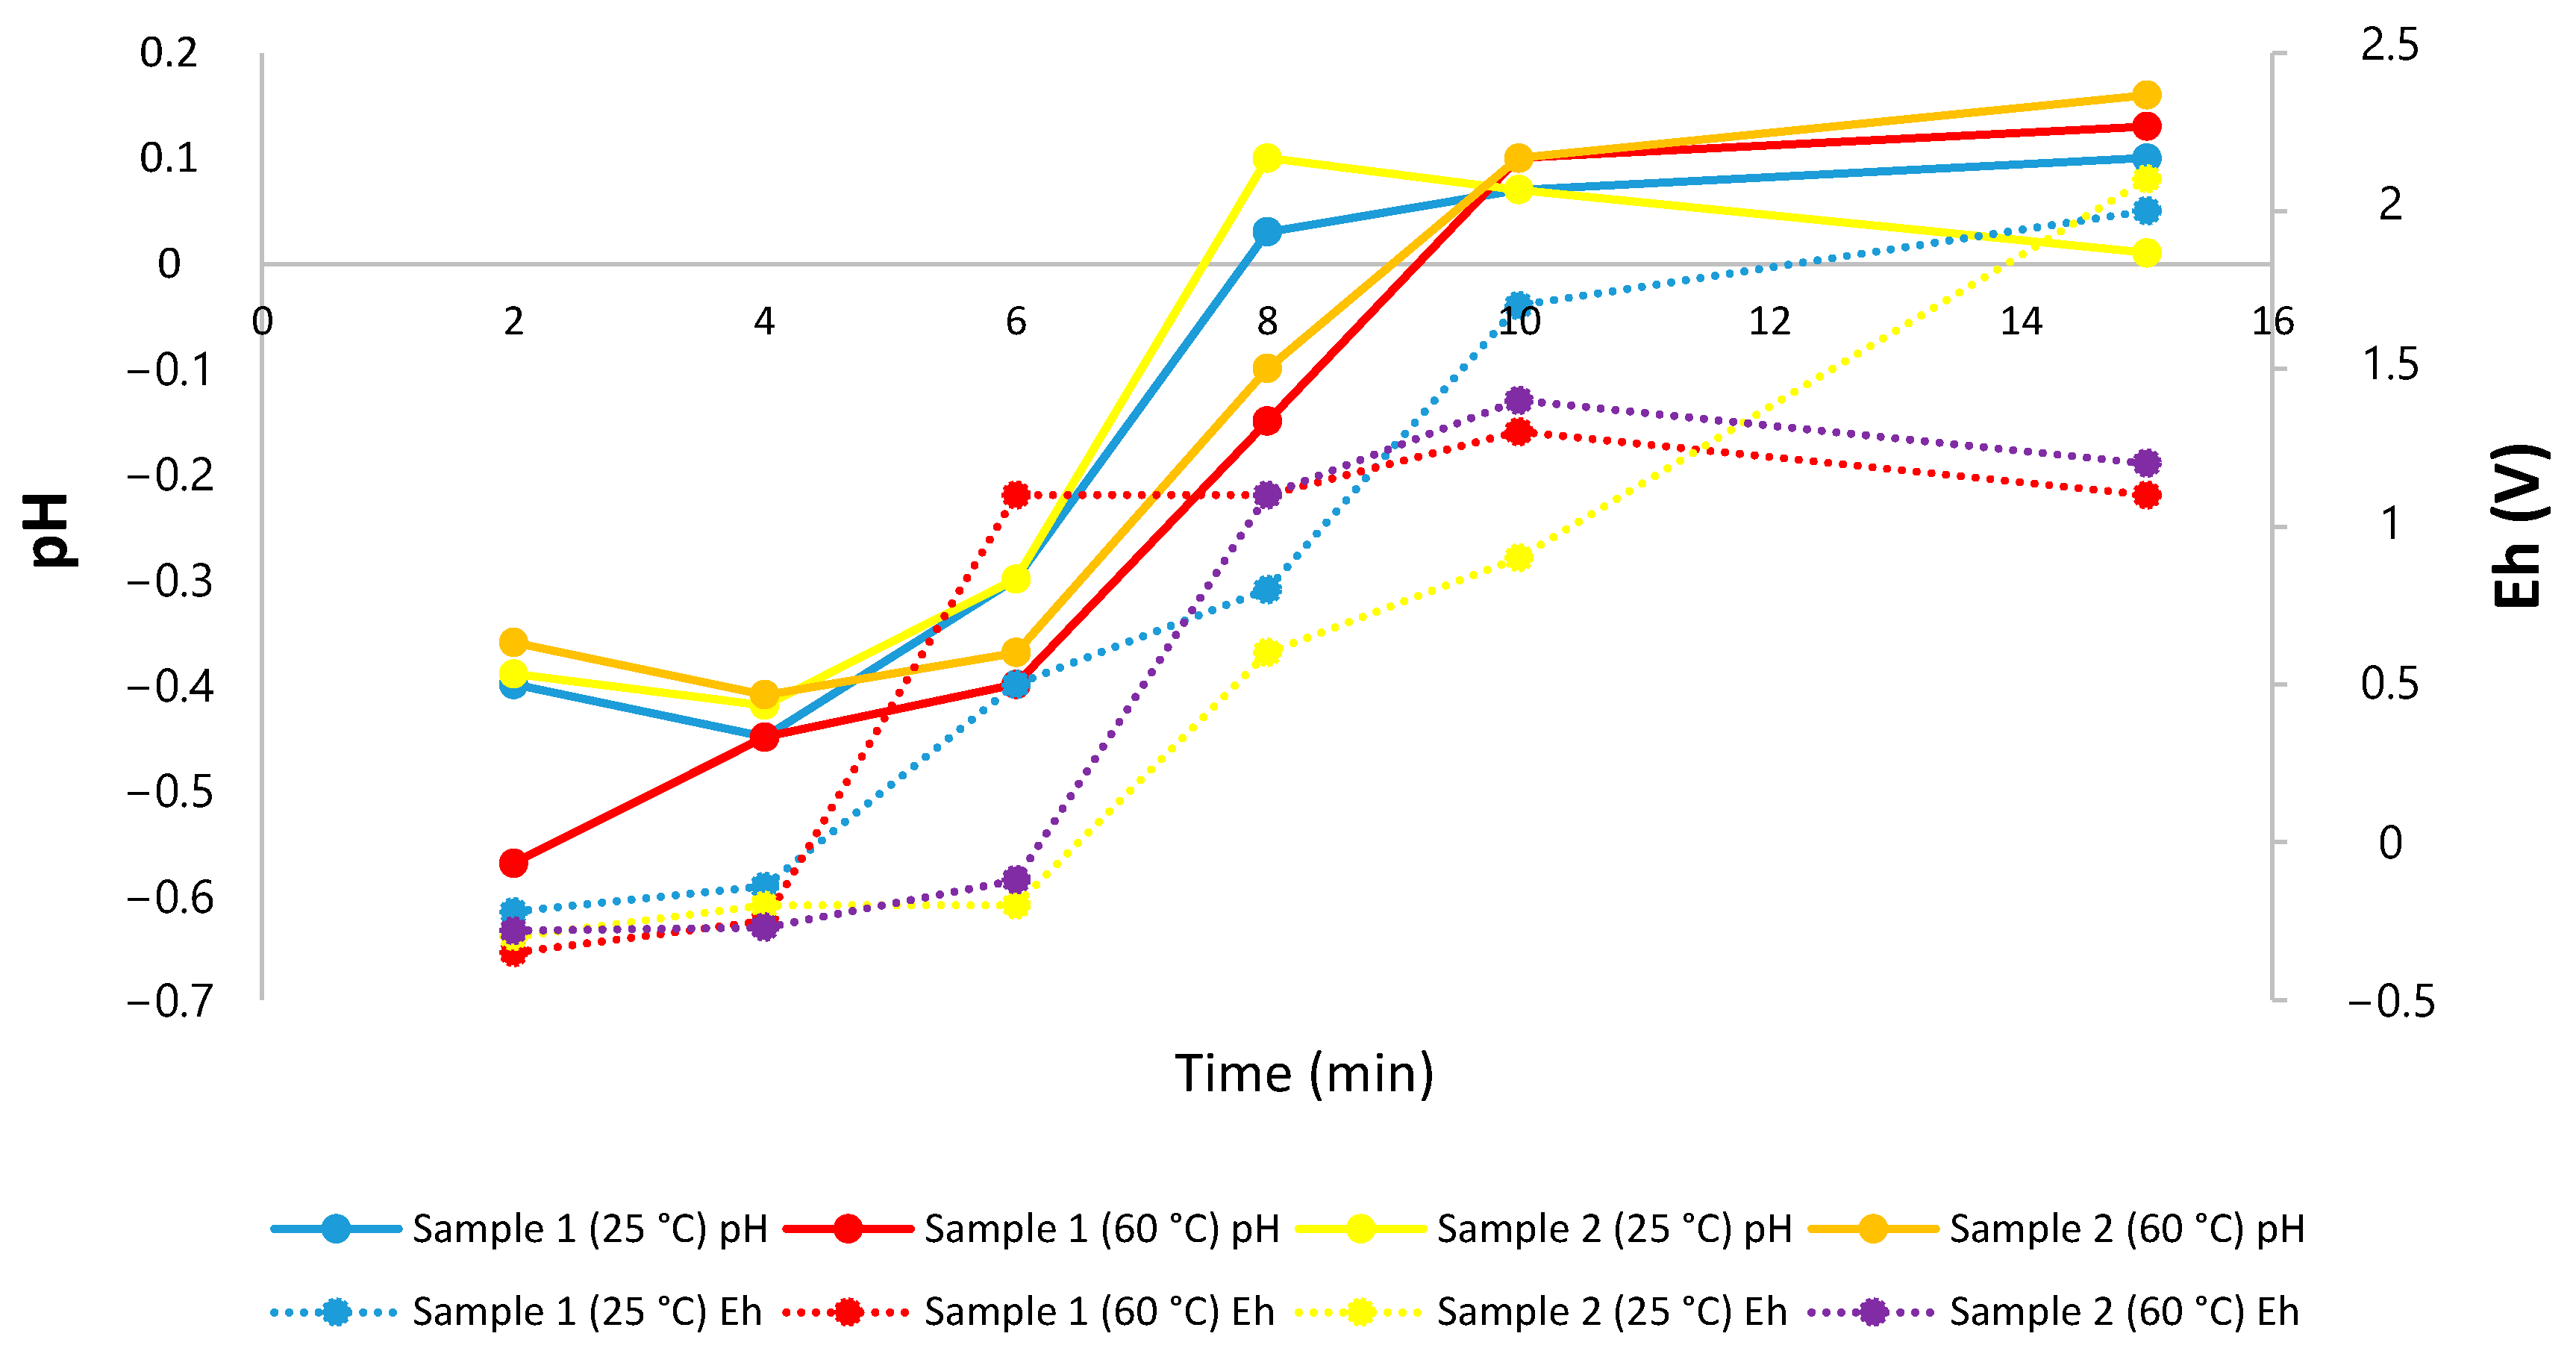
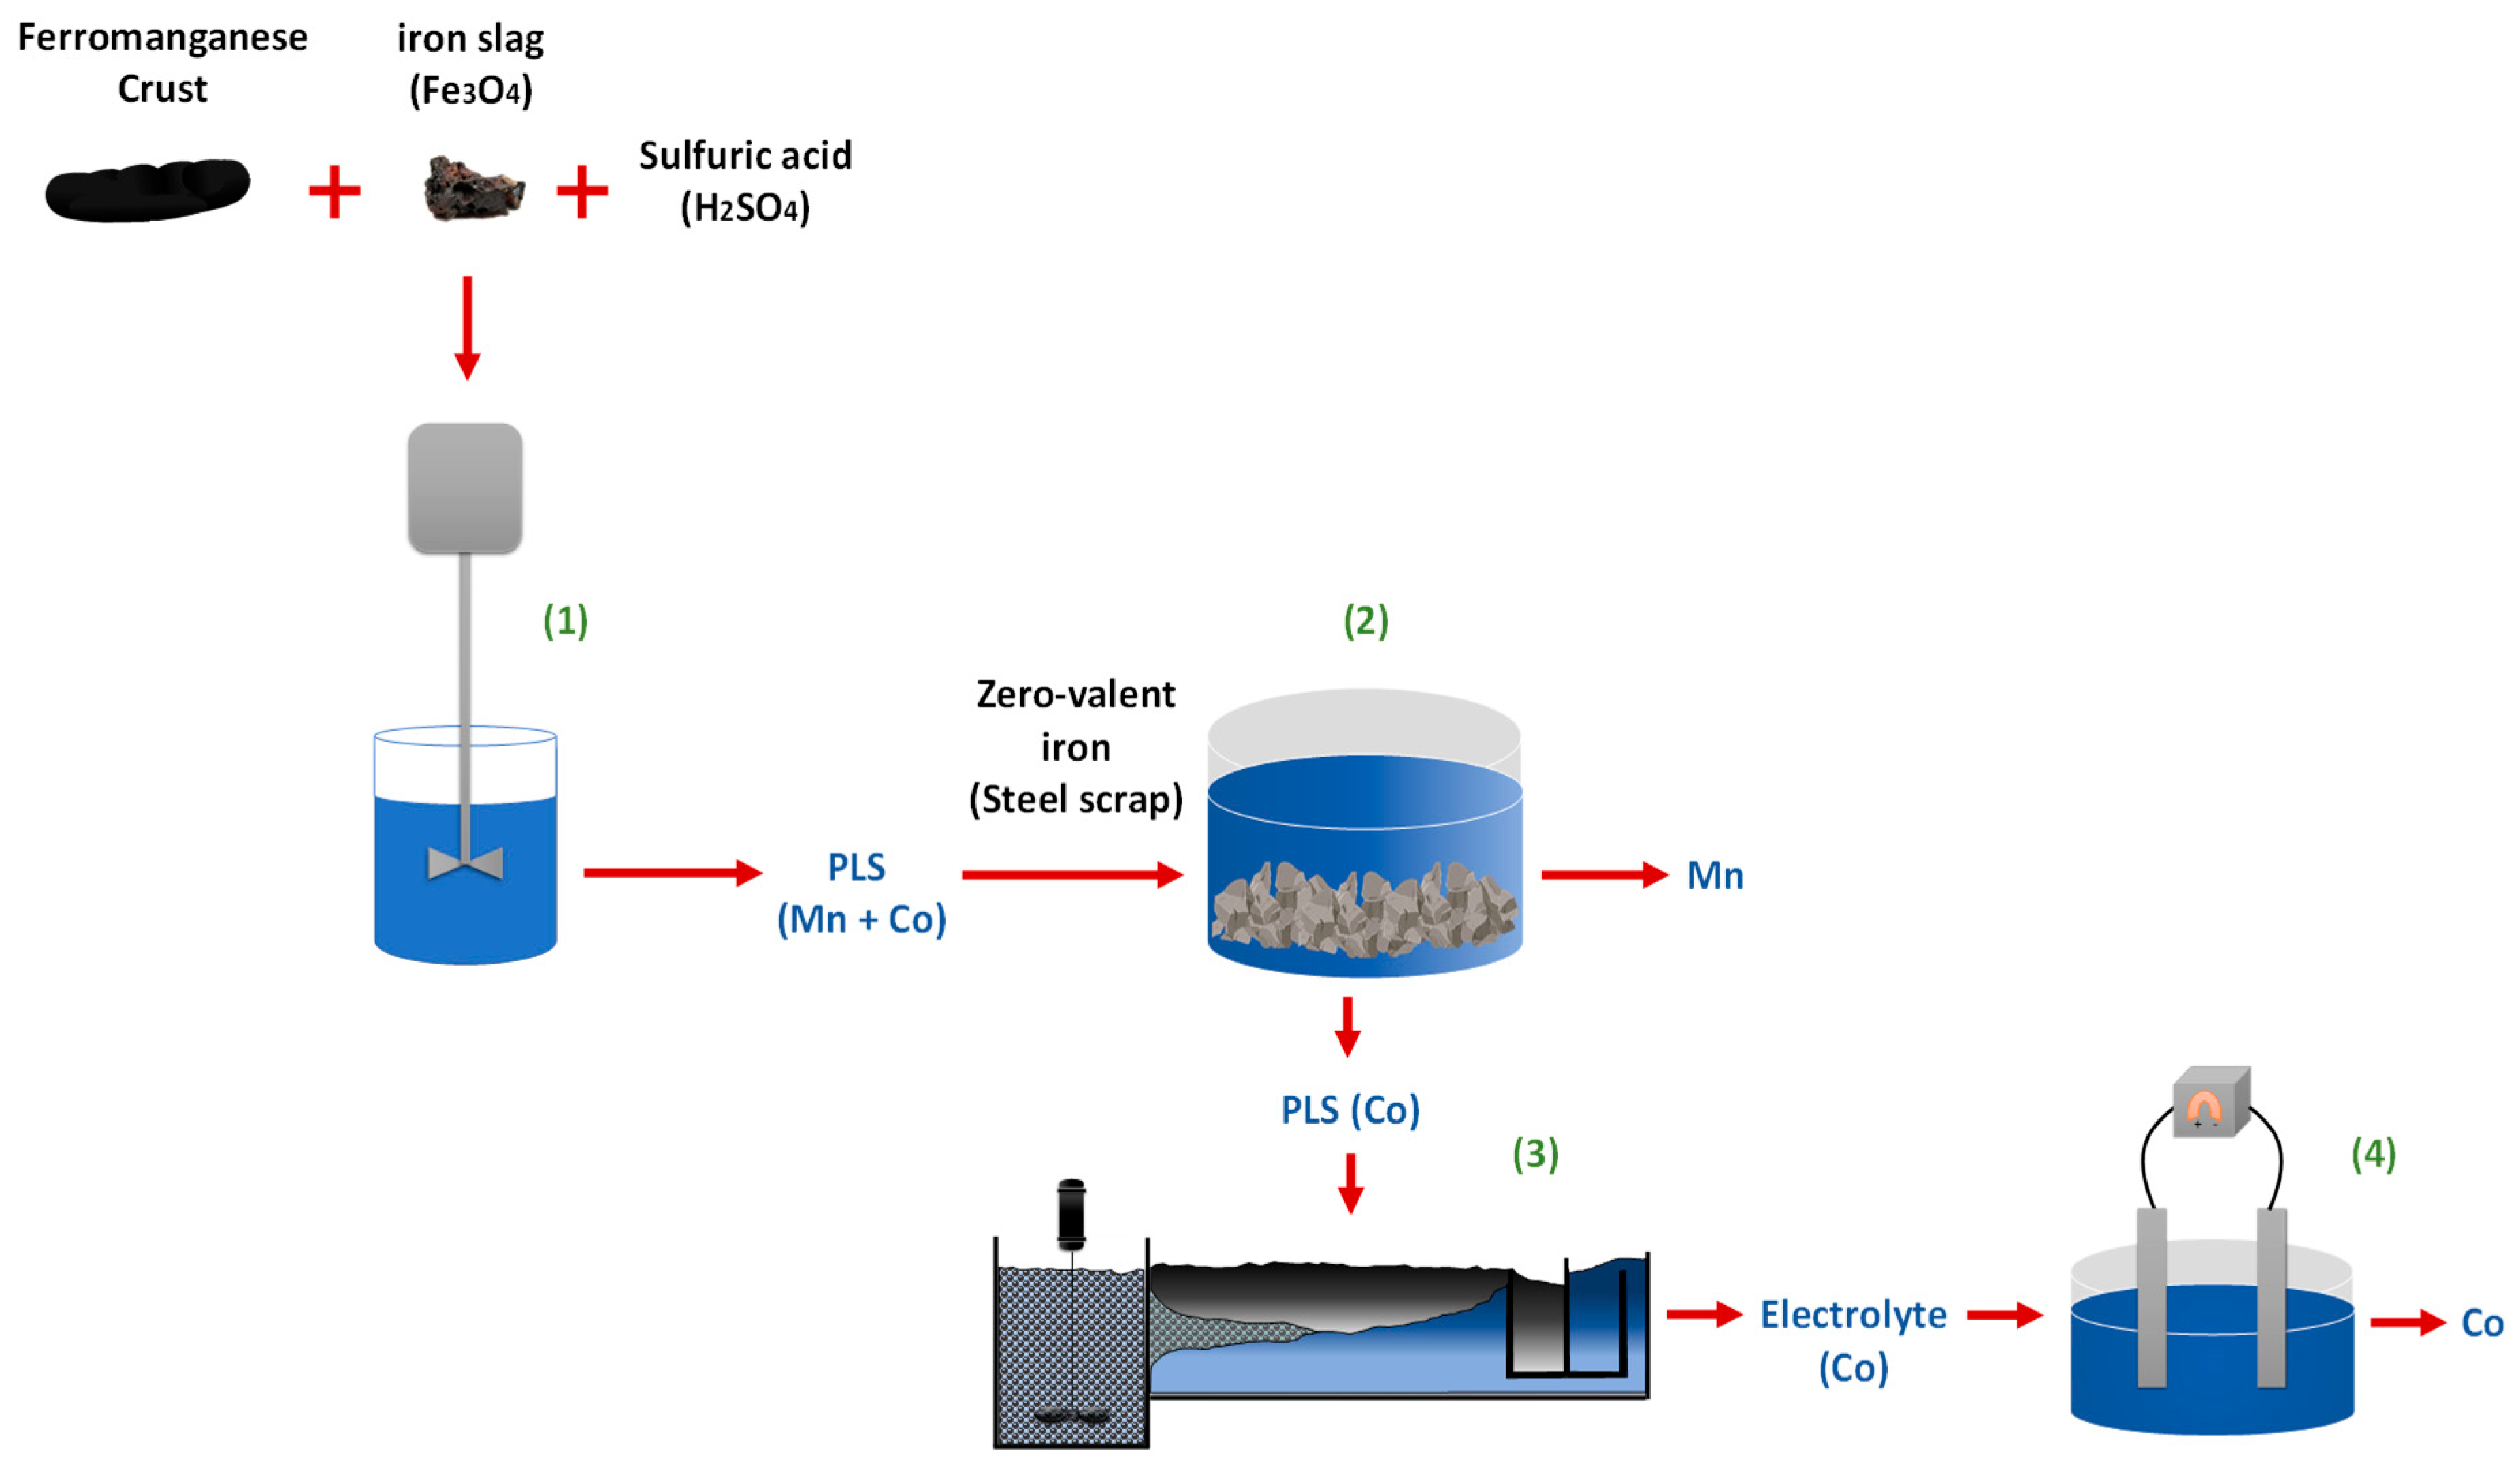
- A slight increase in the potential of the system was observed after 5 min of work at room temperature, which implies a decrease in the cobalt dissolution, because it is not possible to stably maintain the ideal redox potential range (0.8 to −0.25 V).
- The best results of this research were obtained when working at 60 °C, achieving joint extractions of Co and Mn of ~80% and ~40%, respectively, in 10 min.
- Precipitation of cobalt and manganese species is not observed in the residues studied.
Author Contributions
Funding
Data Availability Statement
Acknowledgments
Conflicts of Interest
References
- Hein, J.; Conrad, T.; Staudigel, H. Seamount Mineral Deposits: A Source of Rare Metals for High-Technology Industries. Oceanography 2010, 23, 184–189. [Google Scholar] [CrossRef]
- Cavalcanti, J.A.D.; Santos, R.V. Ferromanganese Crust: Is a Type of Cenozoic Black Stromatolite in Seabed? The Case of the Rio Grande Rise, South Atlantic Ocean. Int. J. Paleobiol. Paleontol. 2022, 5, 000129. [Google Scholar] [CrossRef]
- Hein, J.R.; Conrad, T.A.; Dunham, R.E. Seamount Characteristics and Mine-Site Model Applied to Exploration- and Min-ing-Lease-Block Selection for Cobalt-Rich Ferromanganese Crusts. Mar. Georesources Geotechnol. 2009, 27, 160–176. [Google Scholar] [CrossRef]
- Konstantinova, N.; Son, V.T.; Thang, L.A.; Trung, T.T.; Giang, V.T.; Dung, N.T.T.; Vanshtein, B.; Cherkashov, G. Ferro-manganese Crusts of the Vietnam Margin, Central South China Sea: Composition and Genesis. Mar. Geol. 2022, 453, 106911. [Google Scholar] [CrossRef]
- Cronan, D.S. Handbook of Marine Mineral Deposits; CRC Marine Science Series, 17; CRC Press: Boca Raton, FL, USA, 2000; ISBN 084938429X. [Google Scholar]
- Toro, N.; Gálvez, E.; Saldaña, M.; Jeldres, R.I. Submarine Mineral Resources: A Potential Solution to Political Conflicts and Global Warming. Min. Eng. 2022, 179, 107441. [Google Scholar] [CrossRef]
- Conrad, T.; Hein, J.R.; Paytan, A.; Clague, D.A. Formation of Fe-Mn Crusts within a Continental Margin Environment. Ore Geol. Rev. 2017, 87, 25–40. [Google Scholar] [CrossRef]
- Astakhova, N.V. Ferromanganese crusts of peter the great seamount and the vasylkovsky ridge (sea of japan). Bulletin of Kamchatka Regional Association «Educational-Scientific Center». Earth Sci. 2023, 57, 33–44. [Google Scholar] [CrossRef]
- Sutherland, K.M.; Wankel, S.D.; Hein, J.R.; Hansel, C.M. Spectroscopic Insights Into Ferromanganese Crust Formation and Diagenesis. Geochem. Geophys. Geosystems 2020, 21, e2020GC009074. [Google Scholar] [CrossRef]
- Baturin, G.N.; Dobretsova, I.G.; Dubinchuk, V.T. Hydrothermal Manganese Mineralization in the Peterbourgskoye Ore Field (North Atlantic). Oceanology 2014, 54, 222–230. [Google Scholar] [CrossRef]
- Yeo, I.A.; Howarth, S.A.; Spearman, J.; Cooper, A.; Crossouard, N.; Taylor, J.; Turnbull, M.; Murton, B.J. Distribution of and Hydrographic Controls on Ferromanganese Crusts: Tropic Seamount, Atlantic. Ore Geol. Rev. 2019, 114, 103131. [Google Scholar] [CrossRef]
- Long, B.H.; Thu, P.M.; Trung, N.N. Initial Understanding and Assessment of Role of Oceanographic Features for Ferro-manganese Crusts and Nodules in the East Vietnam Sea. Tạp Chí Khoa Học Và Công Nghệ Biển 2020, 20, 383–397. [Google Scholar] [CrossRef]
- Ingram, B.L.; Hein, J.R.; Farmer, G.L. Age Determinations and Growth Rates of Pacific Ferromanganese Deposits Using Strontium Isotopes. Geochim. Cosmochim. Acta 1990, 54, 1709–1721. [Google Scholar] [CrossRef]
- Toro, N.; Robles, P.; Jeldres, R.I. Seabed Mineral Resources, an Alternative for the Future of Renewable Energy: A Critical Review. Ore Geol. Rev. 2020, 126, 103699. [Google Scholar] [CrossRef]
- Li, D.; Jiang, X.; Wang, S.; Sun, X.; Zhao, F.; Feng, L.; Zhang, D. Research on Recovery of Valuable Metals from Cobalt-Rich Crust Using Carbon as a Reduction Agent during the Acid Baking Process. Minerals 2022, 12, 1215. [Google Scholar] [CrossRef]
- de Matos, C.S.; Benites, M.; Jovane, L.; Ulsen, C. Chemical-Mineralogical Characterization of Critical Elements into Fer-romanganese Crusts. J. Mater. Res. Technol. 2023, 25, 5633–5649. [Google Scholar] [CrossRef]
- Bruland, K.W.; Rue, E.L.; Smith, G.J. Iron and Macronutrients in California Coastal Upwelling Regimes: Implications for Diatom Blooms. Limnol. Oceanogr. 2001, 46, 1661–1674. [Google Scholar] [CrossRef]
- Ito, M.; Hiroyoshi, N. Recent Developments in Mineral Processing of Cobalt-Rich Ferromanganese Crust/Nodules. J. MMIJ 2015, 131, 639–642. [Google Scholar] [CrossRef]
- Konstantinova, N.; Cherkashov, G.; Hein, J.R.; Mirão, J.; Dias, L.; Madureira, P.; Kuznetsov, V.; Maksimov, F. Composition and Characteristics of the Ferromanganese Crusts from the Western Arctic Ocean. Ore Geol. Rev. 2017, 87, 88–99. [Google Scholar] [CrossRef]
- Koschinsky, A.; Halbach, P. Sequential Leaching of Marine Ferromanganese Precipitates: Genetic Implications. Geochim. Cosmochim. Acta 1995, 59, 5113–5132. [Google Scholar] [CrossRef]
- Benites, M.; Hein, J.R.; Mizell, K.; Jovane, L. Miocene Phosphatization of Rocks From the Summit of Rio Grande Rise, Southwest Atlantic Ocean. Paleoceanogr. Paleoclimatol. 2021, 36, e2020PA004197. [Google Scholar] [CrossRef]
- Marino, E.; González, F.J.; Somoza, L.; Lunar, R.; Ortega, L.; Vázquez, J.T.; Reyes, J.; Bellido, E. Strategic and Rare Elements in Cretaceous-Cenozoic Cobalt-Rich Ferromanganese Crusts from Seamounts in the Canary Island Seamount Province (Northeastern Tropical Atlantic). Ore Geol. Rev. 2017, 87, 41–61. [Google Scholar] [CrossRef]
- Toro Villarroel, N.R.; Torres Albornoz, D.A. La Fuerza Del Litio; Universidad Arturo Prat: Victoria, Chile, 2023; ISBN 9789564164717. [Google Scholar]
- Lucibella, M. APS Releases Report on Energy-Critical Elements: Critical Elements Report; American Physical Society: Washington, DC, USA, 2011. [Google Scholar]
- Boldy, R.; Santini, T.; Annandale, M.; Erskine, P.D.; Sonter, L.J. Understanding the Impacts of Mining on Ecosystem Services through a Systematic Review. Extr. Ind. Soc. 2021, 8, 457–466. [Google Scholar] [CrossRef]
- Moore, K.R.; Segura-Salazar, J.; Bridges, L.; Diallo, P.; Doyle, K.; Johnson, C.; Foster, P.; Pollard, N.; Whyte, N.; Wright, O. The Out-of-This-World Hype Cycle: Progression towards Sustainable Terrestrial Resource Production. Resour. Conserv. Recycl. 2022, 186, 106519. [Google Scholar] [CrossRef]
- Bustillo Revuelta, M. Mineral Resources; Springer Textbooks in Earth Sciences, Geography and Environment; Springer International Publishing: Cham, Switzerland, 2018; ISBN 978-3-319-58758-5. [Google Scholar]
- Sharma, R. Deep-Sea Mining: Resource Potential, Technical and Environmental Considerations; Springer: Cham, Switzerland, 2017; pp. 1–535. [Google Scholar] [CrossRef]
- Pérez, K.; Toro, N.; Robles, P.; Gallegos, S.; Gálvez, E.; González, F.J.; Marino, E.; Hernández, P.C. Cobalt and Manganese Extraction from Ocean Nodules by Co-Processing with Steel Metallurgical Slag. Metals 2023, 13, 1079. [Google Scholar] [CrossRef]
- Ju, J.; Feng, Y.; Li, H.; Wu, H.; Liu, S.; Xu, C.; Li, X. Separation of Cu, Co, Ni and Mn from Acid Leaching Solution of Ocean Cobalt-Rich Crust Using Precipitation with Na2S and Solvent Extraction with N235. Korean J. Chem. Eng. 2022, 39, 706–716. [Google Scholar] [CrossRef]
- Inoue, A.; Kawahara, M. Ammoniacal Leaching and Solvent Extraction of Cobalt Crusts Using Sulfur Dioxide Gas. Shigen–Sozai 1998, 114, 195–199. [Google Scholar] [CrossRef]
- Nakazawa, H.; Sato, H. Bacterial Leaching of Cobalt-Rich Ferromanganese Crusts. Int. J. Min. Process 1995, 43, 255–265. [Google Scholar] [CrossRef]
- Shibata, J.; Watari, T.; Niinae, M. Hydrochloric Acid Leaching of Cobalt-Rich Ferromanganese Crust Using Hydrogen Peroxide and Sodium Sulfite as Reducing Agents. Shigen–Sozai 1999, 115, 29–34. [Google Scholar] [CrossRef]
- Niinae, M.; Komatsu, N.; Nakahiro, Y.; Wakamatsu, T.; Shibata, J. Preferential Leaching of Cobalt, Nickel and Copper from Cobalt-Rich Ferromanganese Crusts with Ammoniacal Solutions Using Ammonium Thiosulfate and Ammonium Sulfite as Reducing Agents. Hydrometallurgy 1996, 40, 111–121. [Google Scholar] [CrossRef]
- Torres Albornoz, D.A. Copper and Manganese Extraction through Leaching Processes; Universidad Politécnica de Cartagena: Cartagena, Spain, 2021. [Google Scholar]
- Moraga, C.; Cerecedo-Saenz, E.; González, J.; Robles, P.; Carrillo-Pedroza, F.R.; Toro, N. Comparative Study of MnO2 Dissolution from Black Copper Minerals and Manganese Nodules in an Acid Medium. Metals 2021, 11, 817. [Google Scholar] [CrossRef]
- Zakeri, A. Dissolution Kinetics of Manganese Dioxide Ore in Sulfuric Acid in the Presence of Ferrous Ion. Iran. J. Mater. Sci. Eng. 2007, 4, 22–27. [Google Scholar]
- Bafghi, M.S.; Zakeri, A.; Ghasemi, Z.; Adeli, M. Reductive Dissolution of Manganese Ore in Sulfuric Acid in the Presence of Iron Metal. Hydrometallurgy 2008, 90, 207–212. [Google Scholar] [CrossRef]
- Toro, N.; Rodríguez, F.; Rojas, A.; Robles, P.; Ghorbani, Y. Leaching Manganese Nodules with Iron-Reducing Agents—A Critical Review. Min. Eng. 2021, 163, 106748. [Google Scholar] [CrossRef]


| Echo Seamount | Paps Seamount | Drago Seamount | Tropic Seamount | Atlantic Mean | Pacific Mean | Indian Mean | |||||||||||||||||
|---|---|---|---|---|---|---|---|---|---|---|---|---|---|---|---|---|---|---|---|---|---|---|---|
| Sample | DR2-9 | DR3-1 | DR04-14 | DR7-8 | DR9-10 | DR9-11 | DR10-7 | DR11-2 | DR14-1 | DR13-11 | DR13-12 | DR13-13 | DR15-14A | DR15-15 | DR16-5 | DR16-13 | Mean | Min. | Max. | St. Dev. | n = 25 + 18 + 13 | n = 2339 | n = 14 |
| Fe (wt. %) | 26.48 | 22.72 | 25.99 | 13.55 | 20.27 | 21.49 | 24.72 | 15.58 | 26.58 | 18.91 | 26.06 | 27.58 | 26.51 | 26.99 | 6.98 | 28.33 | 23.45 | 13.55 | 28.33 | 4.56 | 18.84 | 19.27 | 23.6 |
| Mn | 17.53 | 14.18 | 17.66 | 13.04 | 13.82 | 14.48 | 17.69 | 7.72 | 19.01 | 12.05 | 18.22 | 18.84 | 16.94 | 18.77 | 4.92 | 21.74 | 16.11 | 7.72 | 21.74 | 3.53 | 14.68 | 21.37 | 15.6 |
| Mn/Fe | 0.66 | 0.62 | 0.68 | 0.96 | 0.68 | 0.67 | 0.72 | 0.50 | 0.72 | 0.64 | 0.70 | 0.68 | 0.64 | 0.70 | 0.70 | 0.77 | 0.69 | 0.50 | 0.96 | 0.10 | 0.78 | 1.11 | 0.66 |
| SiO2 | 5.45 | 12.47 | 6.39 | 18.48 | 19.32 | 16.33 | 11.68 | 5.70 | 5.11 | 12.18 | 6.80 | 6.57 | 8.14 | 7.50 | 8.00 | 3.65 | 9.72 | 3.65 | 19.32 | 5.07 | 10.42 | 12.81 | 7.78 |
| Al2O3 | 2.60 | 5.13 | 3.23 | 6.60 | 6.21 | 4.94 | 3.97 | 2.65 | 2.75 | 4.51 | 3.11 | 3.11 | 3.04 | 2.99 | 2.52 | 1.29 | 3.74 | 1.29 | 6.60 | 1.46 | 3.87 | 2.91 | 1.34 |
| CaO | 3.37 | 4.00 | 3.11 | 8.19 | 2.65 | 2.98 | 3.22 | 25.25 | 4.45 | 12.20 | 5.04 | 2.99 | 5.59 | 3.58 | 33.03 | 3.49 | 6.01 | 2.65 | 25.25 | 5.89 | 2.53 | 4.28 | 0.75 |
| TiO2 | 1.65 | 2.47 | 1.30 | 1.04 | 1.68 | 1.55 | 1.75 | 1.76 | 1.84 | 1.53 | 1.63 | 1.64 | 1.45 | 1.59 | 0.55 | 1.24 | 1.61 | 1.04 | 2.47 | 0.32 | 1.29 | 1.63 | 1015 |
| K2O | 0.43 | 0.90 | 0.50 | 0.75 | 0.88 | 0.69 | 0.50 | 0.27 | 0.41 | 0.95 | 0.45 | 0.51 | 0.45 | 0.40 | 0.49 | 0.33 | 0.56 | 0.27 | 0.95 | 0.22 | 2.1 | 0.74 | 2.32 |
| MgO | 2.21 | 2.96 | 2.26 | 4.48 | 2.73 | 2.51 | 2.04 | 1.79 | 2.25 | 2.00 | 1.96 | 1.98 | 1.89 | 2.04 | 1.79 | 1.90 | 2.33 | 1.79 | 4.48 | 0.68 | 2.17 | 2.04 | 1.72 |
| P2O5 | 1.32 | 1.71 | 1.25 | 3.78 | 1.17 | 1.28 | 1.20 | 0.84 | 2.01 | 6.40 | 1.15 | 1.12 | 1.19 | 1.21 | 18.08 | 1.09 | 1.78 | 0.84 | 6.40 | 1.46 | 1.43 | 1.56 | 0.38 |
| Na2O | 1.70 | 1.62 | 1.56 | 1.67 | 1.93 | 2.47 | 1.76 | 1.13 | 1.81 | 1.50 | 1.52 | 1.94 | 1.58 | 2.12 | 1.38 | 1.77 | 1.74 | 1.13 | 2.47 | 0.31 | 1.9 | 2.32 | 2.24 |
| H2O | 12.95 | 10.71 | 11.77 | 7.56 | 10.53 | 11.2 | 12.42 | 6.06 | 11.39 | 8.71 | 10.32 | 11.71 | 11.65 | 13.17 | 3.95 | 12.59 | 10.85 | 6.06 | 13.17 | 2.01 | 11.2 | 15.38 | 12.8 |
| LOI | 26.92 | 23.90 | 26.31 | 22.87 | 23.63 | 24.67 | 25.73 | 31.08 | 25.74 | 21.96 | 26.25 | 25.90 | 26.80 | 26.74 | 17.38 | 27.15 | 25.71 | 21.96 | 31.08 | 2.17 | - | 28.73 | - |
| Co (µg/g) | 5157 | 5375 | 4245 | 3560 | 4239 | 3767 | 4502 | 4230 | 6745 | 3359 | 4887 | 5090 | 3834 | 4664 | 1698 | 7169 | 4722 | 3359 | 7169 | 1086 | 3919.5 | 4770.75 | 3126 |
| V | 3072 | 2148 | 3143 | 1326 | 1862 | 2005 | 2465 | 1035 | 2446 | 1527 | 2568 | 2830 | 2643 | 2796 | 432 | 3614 | 2365 | 1035 | 3614 | 716 | 813.37 | 584 | 624 |
| Zn | 754 | 721 | 670 | 672 | 656 | 718 | 709 | 373 | 708 | 489 | 669 | 735 | 625 | 694 | 356 | 899 | 673 | 373 | 899 | 118 | 570.67 | 655.58 | 533 |
| Ni | 2443 | 2737 | 2252 | 6036 | 3238 | 2734 | 2756 | 1502 | 3558 | 1972 | 2420 | 2513 | 1994 | 2405 | 2481 | 2924 | 2766 | 1502 | 6036 | 1038 | 2326.85 | 3777.33 | 2558 |
| Cu | 476 | 539 | 261 | 1573 | 969 | 637 | 771 | 479 | 798 | 555 | 651 | 926 | 395 | 542 | 490 | 387 | 664 | 261 | 1573 | 321 | 798.78 | 892.42 | 1254 |
| Mo | 456 | 354 | 511 | 214 | 282 | 355 | 379 | 103 | 440 | 283 | 454 | 504 | 437 | 457 | 136 | 644 | 392 | 103 | 644 | 133 | 383.89 | 435.92 | 330 |
| W | 100 | 91 | 129 | 38 | 44 | 28 | 90 | 29 | 115 | 50 | 114 | 138 | 95 | 106 | 32 | 84 | 83 | 29 | 138 | 36.62 | 79.63 | 79.44 | 78 |
| Pb | 2284 | 1707 | 2224 | 826 | 1307 | 1486 | 1736 | 828 | 1762 | 1157 | 1658 | 1861 | 1595 | 1819 | 337 | 2106 | 1624 | 826 | 2284 | 445 | 1128.13 | 1502 | 1058 |
| As | 478 | 433 | 479 | 255 | 379 | 389 | 416 | 325 | 470 | 310 | 439 | 458 | 469 | 412 | 99 | 563 | 418 | 255 | 563 | 78 | 316.28 | 329.08 | 181 |
| Tl | 72 | 87 | 137 | 95 | 95 | 61 | 71 | 50 | 116 | 56 | 81 | 112 | 60 | 60 | 31 | 127 | 85 | 50 | 137 | 28 | 106.31 | 100.36 | 89.4 |
| Ba | 4525 | 2893 | 4673 | 1701 | 2474 | 2649 | 3510 | 1031 | 2061 | 3906 | 4601 | 2964 | 3480 | 4086 | 1015 | 5841 | 3360 | 1031 | 5841 | 1286 | 1407 | 1997 | 1668 |
| Nb | 98 | 138 | 97 | 116 | 119 | 100 | 125 | 154 | 122 | 100 | 101 | 123 | 89 | 88 | 27 | 85 | 110 | 85 | 154 | 20 | 52.67 | 36.17 | 74 |
| La | 380 | 343 | 397 | 172 | 222 | 276 | 330 | 189 | 422 | 330 | 390 | 412 | 374 | 402 | 364 | 402.3 | 336 | 172 | 422 | 83 | 265.26 | 292.25 | 286 |
| Ce | 1913 | 1663 | 1859 | 692 | 1329 | 1402 | 1694 | 1190 | 1773 | 1283 | 1834 | 2000 | 1762 | 1942 | 449.77 | 2176 | 1634 | 692 | 2176 | 386 | 1446.34 | 1157.08 | 1481 |
| Pr | 82.71 | 73.36 | 88.18 | 34.40 | 46.27 | 58.45 | 70.34 | 35.87 | 89.27 | 69.45 | 86.31 | 93.22 | 82.97 | 91.21 | 61 | 89.92 | 72.79 | 34.40 | 91.21 | 20 | 64.32 | 60.77 | 68.8 |
| Nd | 335 | 299 | 360 | 150 | 190 | 240 | 287 | 143 | 363 | 285 | 350 | 375 | 341 | 373 | 260.28 | 362 | 297 | 143 | 375 | 81 | 245.62 | 251.67 | 248 |
| Sm | 67.78 | 60.25 | 73.33 | 31.37 | 40.01 | 50.23 | 59.15 | 28.74 | 73.69 | 56.96 | 71.59 | 76.45 | 71.08 | 76.01 | 49.77 | 74.82 | 60.76 | 28.74 | 76.45 | 16.31 | 56.45 | 51.95 | 60.2 |
| Eu | 16.31 | 14.56 | 17.68 | 7.90 | 9.84 | 12.27 | 14.50 | 6.93 | 17.49 | 14.02 | 17.06 | 18.12 | 17.20 | 18.20 | 12.70 | 17.50 | 14.64 | 6.93 | 18.20 | 3.77 | 11.96 | 15.79 | 10.8 |
| Gd | 78.35 | 70.44 | 82.06 | 39.70 | 48.40 | 59.91 | 68.97 | 35.77 | 81.48 | 66.16 | 79.50 | 81.21 | 80.81 | 84.76 | 63.72 | 77.57 | 69.01 | 35.77 | 84.76 | 16.07 | 62.15 | 52.92 | 62 |
| Tb | 10.82 | 9.80 | 11.56 | 5.53 | 6.94 | 8.67 | 9.64 | 5.01 | 11.40 | 9.45 | 11.26 | 11.44 | 11.43 | 12.09 | 8.75 | 10.69 | 9.72 | 5.53 | 12.09 | 2.25 | 9.54 | 8.83 | 9 |
| Dy | 62.26 | 56.33 | 66.30 | 34.40 | 41.58 | 50.90 | 56.63 | 29.27 | 65.23 | 55.43 | 63.45 | 63.43 | 66.33 | 68.87 | 56 | 59.72 | 56.01 | 29.27 | 68.87 | 12.08 | 49.53 | 52.96 | 49.4 |
| Y | 199 | 220 | 239 | 225 | 171 | 209 | 201 | 120 | 264 | 285 | 226 | 219 | 246 | 229 | 557 | 173 | 215 | 120 | 285 | 40.10 | 167.31 | 179.75 | 163 |
| Ho | 11.95 | 11.12 | 12.81 | 7.33 | 8.30 | 10.34 | 11.06 | 5.82 | 12.75 | 11.06 | 12.04 | 11.89 | 12.79 | 12.90 | 12.49 | 11.07 | 10.88 | 5.82 | 12.90 | 2.13 | 9.7 | 9.53 | 9.8 |
| Er | 32.51 | 30.80 | 35.82 | 21.74 | 24.03 | 29.05 | 30.49 | 16.39 | 35.21 | 31.33 | 32.78 | 32.51 | 35.09 | 35.01 | 37.69 | 29.63 | 30.16 | 16.39 | 35.82 | 5.51 | 28.5 | 28.4 | 26 |
| Tm | 4.58 | 4.28 | 4.95 | 3.04 | 3.49 | 4.23 | 4.34 | 2.36 | 4.92 | 4.34 | 4.57 | 4.49 | 4.90 | 4.87 | 5.18 | 4.06 | 4.23 | 2.36 | 4.95 | 0.74 | 3.78 | 4.03 | 3 |
| Yb | 28.37 | 26.65 | 30.83 | 18.93 | 22.24 | 26.91 | 27.63 | 15.33 | 30.47 | 27.71 | 28.55 | 27.98 | 30.45 | 30.17 | 33.63 | 25.05 | 26.49 | 15.33 | 30.83 | 4.46 | 24.08 | 26.24 | 22.7 |
| Lu | 4.06 | 3.93 | 4.43 | 2.94 | 3.38 | 4.00 | 4.11 | 2.30 | 4.59 | 4.10 | 4.13 | 4.02 | 4.37 | 4.23 | 5.28 | 3.48 | 3.87 | 2.30 | 4.59 | 0.61 | 3.8 | 3.54 | 3.46 |
| %REY | 0.32 | 0.29 | 0.33 | 0.14 | 0.22 | 0.24 | 0.29 | 0.18 | 0.32 | 0.25 | 0.32 | 0.34 | 0.31 | 0.34 | 0.20 | 0.35 | 0.28 | 0.18 | 0.35 | 0.06 | 0.24 | 0.22 | 0.25 |
| %HREY | 13.9 | 15.5 | 15.40 | 25.3 | 15.7 | 17.0 | 14.9 | 13.1 | 20.1 | 14.9 | 13.8 | 16.2 | 16.2 | 14.8 | 40.1 | 11.7 | 15.5 | 11.7 | 25.3 | 3.22 | 15.13 | 17.40 | 14.35 |
| CeSN/CeSN | 2.48 | 2.41 | 2.28 | 2.06 | 3.01 | 2.53 | 2.55 | 3.30 | 2.10 | 1.95 | 2.30 | 2.35 | 2.30 | 2.33 | 0.68 | 2.63 | 2.44 | 1.95 | 3.30 | 0.35 | 2.41 | 1.89 | 2.3 |
| Ce * | 0.37 | 0.36 | 0.34 | 0.28 | 0.45 | 0.38 | 0.38 | 0.49 | 0.30 | 0.26 | 0.34 | 0.35 | 0.34 | 0.35 | −0.21 | 0.40 | 0.36 | 0.26 | 0.49 | 0.06 | 0.4 | 0.26 | 0.38 |
| YSN/HoSN | 0.48 | 0.56 | 0.53 | 0.88 | 0.59 | 0.58 | 0.52 | 0.59 | 0.59 | 0.74 | 0.54 | 0.53 | 0.55 | 0.51 | 1.27 | 0.45 | 0.57 | 0.45 | 0.88 | 0.11 | 0.51 | 0.56 | 0.49 |
| Ru ** (ng/g) | 10.09 | 11.42 | 9.07 | 14.93 | 16.09 | 10.44 | 12.90 | 10.86 | 14.22 | 16.43 | 14.83 | 12.69 | 18.68 | 9.72 | - | 11.55 | 12.93 | 9.07 | 18.68 | 2.84 | 17.3 | 10.5 | 13 |
| Rh ** | 10.55 | 15.90 | 8.81 | 16.12 | 17.55 | 9.16 | 12.79 | 18.20 | 17.49 | 19.72 | 21.41 | 13.82 | 12.79 | 9.89 | - | 14.76 | 14.60 | 8.81 | 21.41 | 3.92 | 30.8 | 13 | 24 |
| Pd ** | 5.30 | 1.41 | 6.45 | 1.17 | 1.36 | 12.73 | 1.44 | 21.29 | <DL | <DL | 1.49 | 2.87 | 171 | 2.21 | - | 6.25 | 15.66 | <DL | 171 | 46.31 | 9.9 | 3.67 | 7 |
| Os ** | 1.00 | 1.21 | 0.65 | 0.93 | 1.36 | 0.77 | 1.07 | 1.25 | 1.57 | 1.87 | 1.04 | 0.59 | 1.34 | 0.97 | - | 0.98 | 1.11 | 0.59 | 1.87 | 0.34 | - | - | - |
| Ir ** | 3.19 | 3.80 | 2.74 | 3.99 | 4.27 | 2.65 | 3.59 | 4.27 | 4.33 | 4.94 | 5.45 | 3.78 | 3.66 | 3.09 | - | 3.96 | 3.85 | 2.65 | 5.45 | 0.76 | 5.8 | 4.08 | 8 |
| Pt ** | 291 | 160 | 108 | 222 | 213 | 112 | 146 | 159 | 159 | 173 | 321 | 208 | 222 | 103 | - | 138 | 182 | 103 | 321 | 64 | 425 | 270.17 | 348 |
| Critical Raw Materials | ||||
|---|---|---|---|---|
| Antimony | Cobalt | Germanium | Natural Graphite | Light rare earths |
| Beryllium | Coke | Indium | Niobium | Heavy rare earths |
| Borates | Fluorspar | Magnesite | Platinum group | Silicon metals |
| Chromium | Gallium | Bismuth | Phosphate rocks | Tungsten |
| Lithium | Titanium | Strontium | Bauxite | Hafnium |
| Natural Rubber | Vanadium | Wolfram | Tantalum | Scandium |
| Copper | Manganese | Nickel | ||
| Reaction | ΔG° (kJ) | Equation |
|---|---|---|
| Fe3O4 (s) + 4H2SO4 (l) = FeSO4 (aq) + Fe2(SO4)3 (s) + 4H2O (l) | −264.27 | (1) |
| 2FeSO4 (aq) + 2H2SO4 (aq) + MnO2 (s) = Fe2(SO4)3 (s) + 2H2O (l) + MnSO4 (aq) | −221.44 | (2) |
| CoO + H2SO4 = CoSO4 + H2O | −115.43 | (3) |
| Co3O4 + 4H2SO4 + 2FeSO4 = 3CoSO4 + 4H2O + Fe2(SO4)3 | −354.18 | (4) |
| Sample | Seamount | Sample Location | Latitude | Longitude | Water Depth (m) | Fe-Mn Crust Thickness (mm) |
|---|---|---|---|---|---|---|
| Drago 0511/DR04-15 | Echo | West flank | 25°19.51′ N | 19°18.92′ W | 1832–1593 | 25 |
| Subvent 1/DA06-4 | Gaire | East flank | 26°06.20′ N | 22°09.00′ W | 4823 | 64 |
| Element | Mass (wt. %) |
|---|---|
| Fe3O4 | 82.65 |
| Fe2O3 | 13.03 |
| Fe0 | 0.27 |
| CaO | 0.75 |
| SiO2 | 1.5 |
| Al2O3 | 0.3 |
| MgO | 0.2 |
| SO3 | 0.08 |
| P2O5 | 0.2 |
| K2O | 0.015 |
| MnO | 0.8 |
| C | 0.2 |
| Element | Drago 0511/ DR04-15A | SUBVEMT/ DA06-4 | Element | Drago 0511/ DR04-15A | Subvent/ DA06-4 |
|---|---|---|---|---|---|
| SiO2 (wt. %) | 6.91 | 13.80 | Ag | 0.17 | <0.2 |
| Al2O3 | 2.86 | 5.38 | Cd | 1.49 | 3.45 |
| Fe2O3 | 28.43 | 27.70 | Sb | 46.02 | 31.75 |
| Fe | 19.88 | 19.37 | Te | 37.26 | 18.06 |
| CaO | 6.05 | 1.89 | Ba | 1374 | 1188 |
| TiO2 | 1.03 | 0.96 | Tl | 69.25 | 114.37 |
| MnO | 18.69 | 20.23 | Pb | 1566 | 859 |
| Mn | 14.47 | 16.66 | Th | 31.98 | 108.05 |
| K2O | 0.47 | 0.83 | U | 11.49 | 8.71 |
| MgO | 2.36 | 2.48 | Y | 169 | 134 |
| P2O5 | 2.47 | 0.80 | La | 240 | 209 |
| Na2O | 1.59 | 1.35 | Ce | 1420 | 1476 |
| LOI | 22.81 | 23.20 | Pr | 49.70 | 56.89 |
| SUM | 93.67 | 98.62 | Nd | 205.00 | 224.76 |
| Mn/Fe | 0.73 | 0.81 | Sm | 41.80 | 51.05 |
| Be (µg/g) | 8.87 | 6.48 | Eu | 10.20 | 12.19 |
| V | 940.67 | 674.22 | Gd | 49.50 | 53.57 |
| Cr | 25.03 | 19.78 | Tb | 7.04 | 7.74 |
| Co | 4262 | 2424 | Dy | 42.70 | 43.23 |
| Ni | 2359 | 2844 | Ho | 8.71 | 7.90 |
| Cu | 474 | 1342 | Er | 25.20 | 21.77 |
| Zn | 456 | 430 | Tm | 3.52 | 3.07 |
| As | 341 | 231 | Yb | 22.00 | 20.00 |
| Se | 21.06 | 29.56 | Lu | 3.41 | 3.00 |
| Mo | 383.89 | 376.52 | ΣREY | 2298 | 2323 |
| Manganese | Cobalt | |||
|---|---|---|---|---|
| (A) | 25 °C | 60 °C | 25 °C | 60 °C |
| Time (min) | Concentration (g/L) | Concentration (g/L) | Concentration (g/L) | Concentration (g/L) |
| 2 | 0.01305 | 0,07105 | 0,00038 | 0,00068 |
| 3 | 0.03045 | 0,09860 | 0,00059 | 0,00106 |
| 5 | 0.05655 | 0.10585 | 0.00089 | 0.00127 |
| 7 | 0.06525 | 0.11600 | 0.00093 | 0.00140 |
| 10 | 0.08265 | 0.12325 | 0.00115 | 0.00166 |
| (B) | 25 °C | 60 °C | 25 °C | 60 °C |
| Time (min) | Concentration (g/L) | Concentration (g/L) | Concentration (g/L) | Concentration (g/L) |
| 2 | 0.01099 | 0.07222 | 0.00016 | 0.00033 |
| 3 | 0.02983 | 0.10048 | 0.00031 | 0.00063 |
| 5 | 0.05966 | 0.10990 | 0.00046 | 0.00077 |
| 7 | 0.06751 | 0.12560 | 0.00053 | 0.00087 |
| 10 | 0.08635 | 0.13188 | 0.00067 | 0.00099 |
| Experimental Conditions and Results | Pérez et al. [29] | This Work | ||
|---|---|---|---|---|
| Manganese Nodule | Ferromanganese Crust | |||
| Sample 1 | Sample 2 | Drago 0511/DR04-15 | Subvent 1/DA06-4 | |
| Temperature (°C) | 60 | 60 | 60 | 60 |
| Particle size (µm) | −140 + 100 µm | −140 + 100 µm | −177 + 149 µm | −177 + 149 µm |
| Sulfuric acid concentration (mol/L) | 0.1 | 0.1 | 0.1 | 0.1 |
| Mineral resource/iron scrap ratio | 1/2 | 1/2 | 1/2 | 1/2 |
| Manganese extraction in 10 min (%) | 90 | 87 | 84 | 85 |
| Cobalt extraction in 10 min (%) | 42 | 40 | 41 | 39 |
Disclaimer/Publisher’s Note: The statements, opinions and data contained in all publications are solely those of the individual author(s) and contributor(s) and not of MDPI and/or the editor(s). MDPI and/or the editor(s) disclaim responsibility for any injury to people or property resulting from any ideas, methods, instructions or products referred to in the content. |
© 2024 by the authors. Licensee MDPI, Basel, Switzerland. This article is an open access article distributed under the terms and conditions of the Creative Commons Attribution (CC BY) license (https://creativecommons.org/licenses/by/4.0/).
Share and Cite
Pérez, K.; Toro, N.; Robles, P.; Galleguillos Madrid, F.M.; Gálvez, E.; González, F.J.; Marino, E.; Castillo, J.; Jamett, I.; Hernández, P.C. Extraction of Cobalt and Manganese from Ferromanganese Crusts Using Industrial Metal Waste through Leaching. Metals 2024, 14, 1044. https://doi.org/10.3390/met14091044
Pérez K, Toro N, Robles P, Galleguillos Madrid FM, Gálvez E, González FJ, Marino E, Castillo J, Jamett I, Hernández PC. Extraction of Cobalt and Manganese from Ferromanganese Crusts Using Industrial Metal Waste through Leaching. Metals. 2024; 14(9):1044. https://doi.org/10.3390/met14091044
Chicago/Turabian StylePérez, Kevin, Norman Toro, Pedro Robles, Felipe M. Galleguillos Madrid, Edelmira Gálvez, Francisco Javier González, Egidio Marino, Jonathan Castillo, Ingrid Jamett, and Pía C. Hernández. 2024. "Extraction of Cobalt and Manganese from Ferromanganese Crusts Using Industrial Metal Waste through Leaching" Metals 14, no. 9: 1044. https://doi.org/10.3390/met14091044
APA StylePérez, K., Toro, N., Robles, P., Galleguillos Madrid, F. M., Gálvez, E., González, F. J., Marino, E., Castillo, J., Jamett, I., & Hernández, P. C. (2024). Extraction of Cobalt and Manganese from Ferromanganese Crusts Using Industrial Metal Waste through Leaching. Metals, 14(9), 1044. https://doi.org/10.3390/met14091044