Article

Research on Pre-Compensation and Shape-Control Optimization of Hemming Structures with Dissimilar Materials Based on Forming Process Chain

1
School of Construction Machinery, Shandong Jiaotong University, Jinan 250353, China
2
School of Mechanical Engineering, Tongji University, Shanghai 200070, China
*
Author to whom correspondence should be addressed.
Metals 2024, 14(9), 1063; https://doi.org/10.3390/met14091063
Submission received: 13 July 2024 / Revised: 21 August 2024 / Accepted: 26 August 2024 / Published: 17 September 2024
(This article belongs to the Section Welding and Joining)

Abstract

:
The steel–aluminum hybrid body closure panels can achieve a more balanced and lightweight performance. However, the differences in the physical properties of metal sheets and the complex changes in the properties of the adhesive material result in cumulative deviations in the composite-forming process. This paper proposes a deformation pre-compensation modeling method for the autobody closure panels hemming system oriented towards the process chain, in response to the problem that single-process optimization cannot obtain global optimal results. Taking the car door scaled model as an example, based on surface reconstruction and node compensation, the curing deformation amount is fed back in advance to the gluing and hemming processes. The deformation deviation is corrected through geometric parameter pre-compensation to achieve overall process shape control and optimization. Research shows that this method can significantly reduce the surface differences and gaps of hemming structures with dissimilar materials, and a single iteration can reduce the assembly surface difference by more than 90%. This provides a reference for improving the manufacturing quality of steel–aluminum hybrid body closure panels.

1. Introduction

Whether it is continuously increasing the range of new energy vehicles or traditional fuel vehicles meeting stricter emission regulations, lightweight vehicle body design is a common and key basic technology [1,2]. The combination of steel and aluminum continues to be a strength and cost advantage in steel sheets while also taking into account the weight reduction and energy absorption characteristics of aluminum alloy sheets, which can achieve a more balanced lightweight performance [3,4]. With the continuous updating and iteration of new car models, the forming and manufacturing of steel–aluminum hybrid closure panels [5], such as engine hoods, doors, and decklids, has become a hot topic of attention for the new generation of lightweight vehicles.
The extremely high requirement for geometric accuracy in appearance requires the use of a special composite-forming process in the manufacturing of autobody closure panels, including gluing-, hemming-, and curing-related processes [6,7]. The preliminary research mainly focused on the accurate prediction of forming quality and process optimization [8,9,10]. Manach et al. [11] considered factors such as the Bauschinger effect, the material deformation history, and anisotropy, and studied the influence of material constitutive models on the roller hemming quality of aluminum alloy sheets. Thullier et al. [12] investigated the differences in roll-in/out values and the equivalent plastic strain of curved-edge aluminum alloy sheets using three material constitutive models.
In the gluing and hemming processes, a high-viscosity structural adhesive fills the narrow gap between the inner and outer panels, playing an auxiliary role in sealing and rust prevention. Burka et al. [13] studied the variation in insertion forces with adhesive components and ratios during the compression of adhesives and plates. Li et al. [14] studied the pressure–viscosity effect and simulated the roller hemming process of AA6106-T4 aluminum alloy sheet with an adhesive. The thicknesses of the thin plate and the adhesive layer were on the same order of magnitude, and the fluid–structure coupling effect between the two was significant [15].
In the subsequent high-temperature curing process, the thermosetting adhesive underwent a transition from a viscous and highly elastic state to a glassy state, resulting in a complex deformation process [16,17]. Fuchs et al. [18] pointed out that compared with the linear elastic model, the predicted and measured values of the adhesive viscoelastic model had a better correlation. Priesnitz et al. [19] used a three-stage constitutive model to study the curing process of the thin plate–adhesive–substrate structure.
For structures with dissimilar materials, adhesive curing can easily cause structural mismatch deformation. Zhu et al. [20] found that the peak curing temperature had a significant impact on the deformation and fracture of bonding structures with dissimilar materials. Zhang et al. [21] summarized the factors affecting the curing deformation and several curing deformation control strategies, including reinforcement structure optimization and inverse design strategy before curing. Overall, using geometric and process parameter optimization methods can reduce curing-induced deformation, but the reduction is limited [22,23].
Apart from parameter optimization, it is necessary to propose new high-precision quality adjustment methods. Yoon et al. [24] studied reverse compensation to prevent post-molding dimensional distortion of automobile parts. Yang et al. [25] proposed a mold surface comprehensive compensation method that considers directional compensation factors. Christian et al. [26] pointed out that in order to better predict and compensate for rebound deformation of door cover assembly, it was necessary to construct an integrated prediction method for the manufacturing of the entire process chain. On the whole, the geometric compensation method is still a commonly used correction method for large deformations in autobody structures.
In summary, even if the optimal forming is achieved in the early stage, the structure with dissimilar materials will inevitably produce deformation quality defects under subsequent temperature loads. At present, there is a lack of systematic quality control methods for the manufacturing process.
This paper proposes a modeling and deformation pre-compensation method for the autobody closure panel hemming system oriented towards the process chain in response to the problem that single-process optimization cannot obtain global optimal results. Taking the door’s scaled model as an example, combined with the deformation correction method of the car body’s thin-plate structure, based on surface reconstruction and node compensation, the curing deformation is feedbacked in advance to the gluing and hemming processes. The deformation deviation is corrected through geometric parameter pre-compensation to achieve overall process shape control and optimization.

2. Shape-Control Optimization Based on Forming Process Chain

2.1. Shape-Control Modeling Method

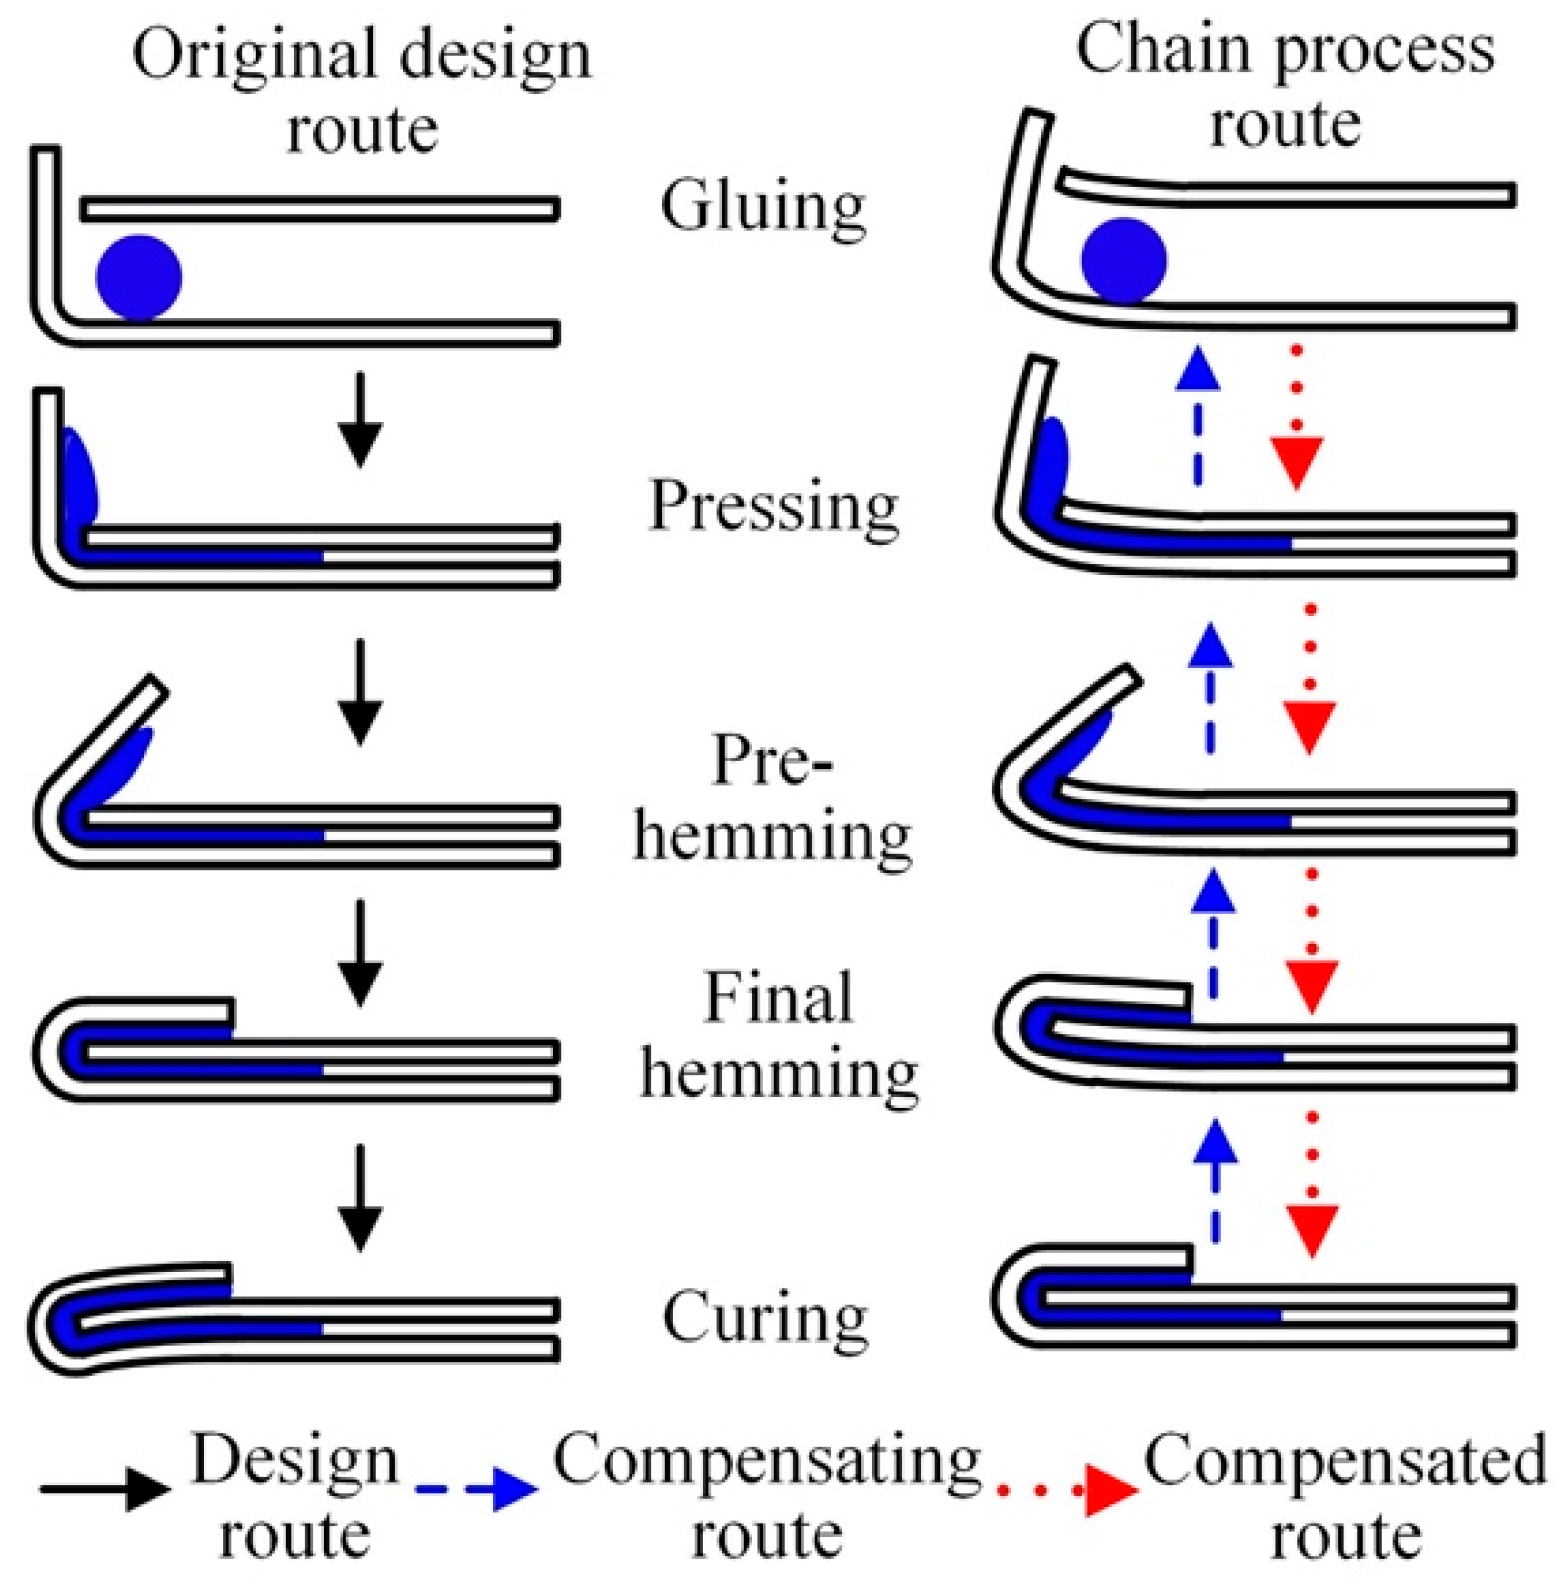
In the composite-forming processes, the forming accuracy of the previous process directly affects the initial state of subsequent processes. Therefore, the manufacturing process is regarded as a process chain, as shown in Figure 1. The output Ri of the previous process is the input Si+1 of the subsequent process. The error eoi continues to amplify in the subsequent process, forming an error eo(i+1). Therefore, the final output of the process chain is compensated by increasing the negative feedback of Δε to the front-end process, forming a closed forming process chain with feedback, thereby reducing the final forming error eon.
The composite-forming modeling method for hybrid autobody closure panels based on the process chain is shown in Figure 2. Firstly, establish a geometric model of adhesive metal sheets. In the gluing and hemming stages, build a fluid–structure coupling model and use numerical simulation methods to evaluate the forming quality. When the forming accuracy error is smaller than the requirement ε , the next curing process will proceed. Secondly, build a thermal–chemical–structural multi-field coupling model and use numerical simulation methods to evaluate the curing quality. When the forming accuracy error is greater than the requirement ε , the following pre-compensation process will continue, including node compensation, surface reconstruction, and geometric modification. Using iterative calculation, finally, the optimal process parameters are obtained and high accuracy in the hemming structure is achieved. The comparison between the original process route and the chain process route is shown in Figure 3.

2.2. Research Sample

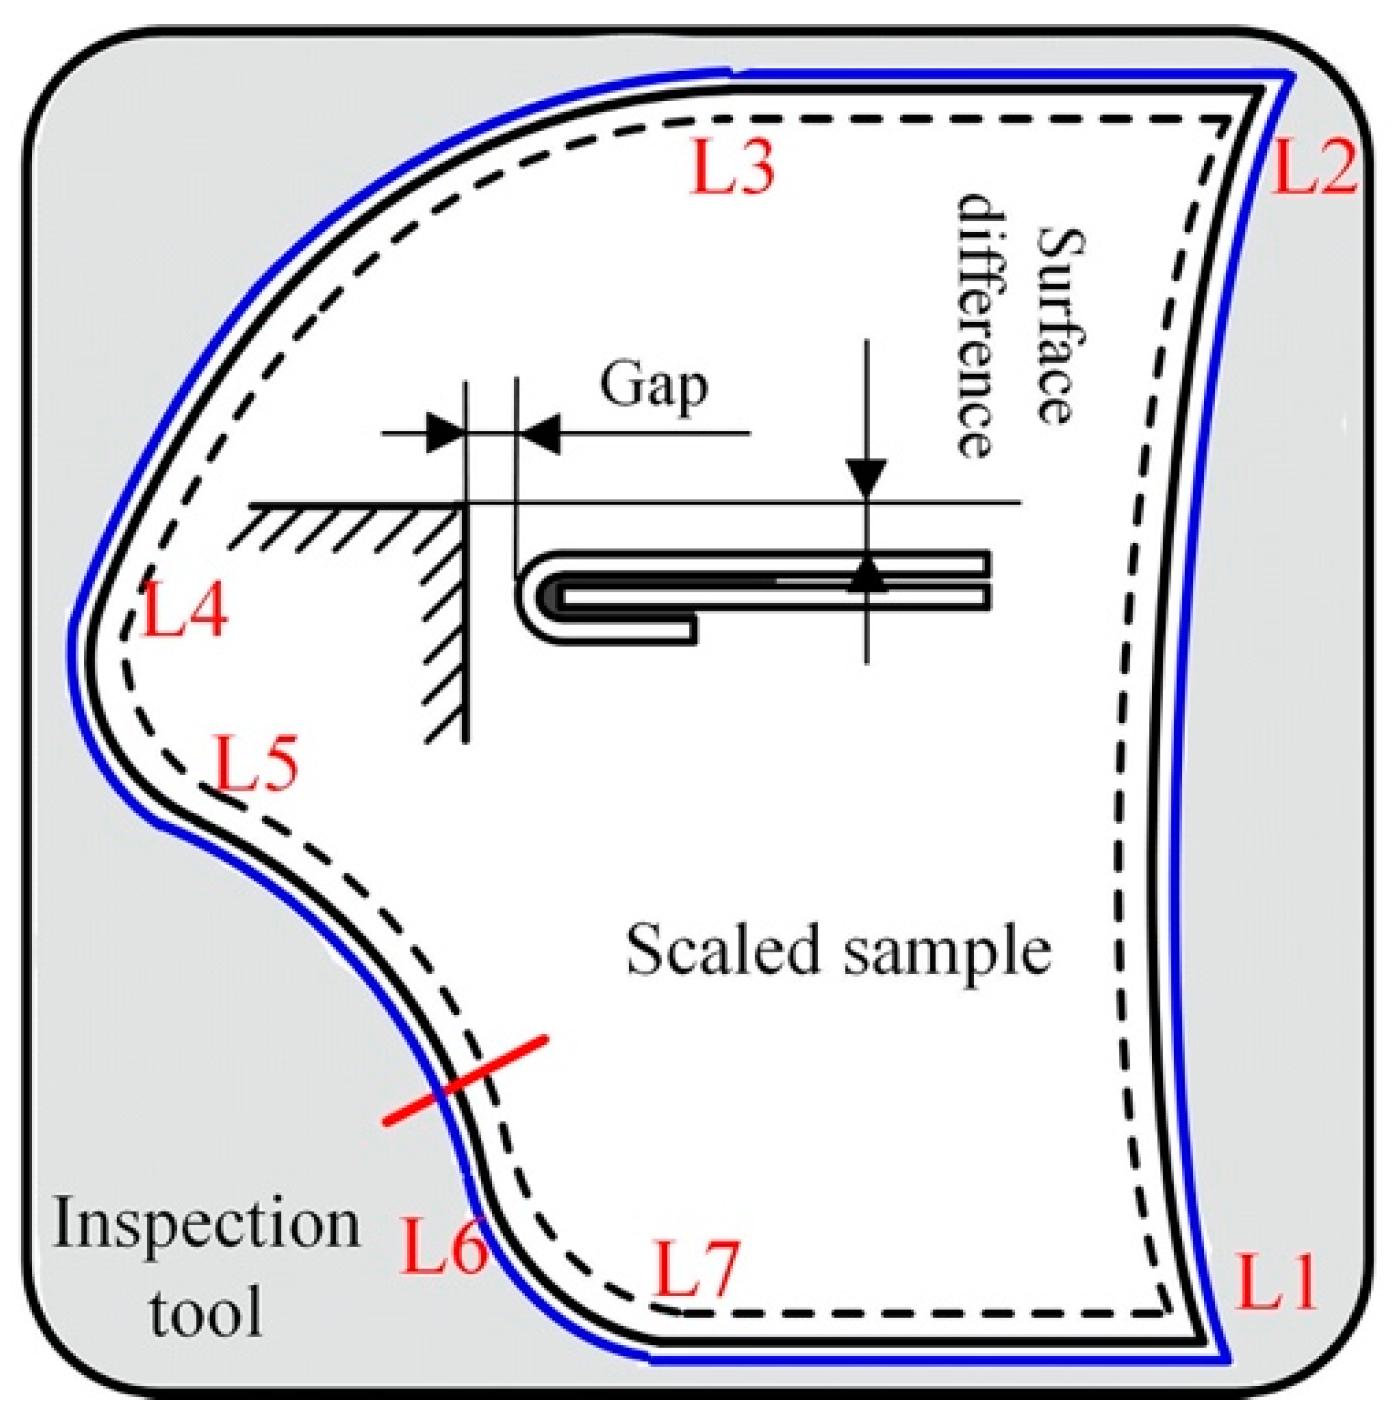
To verify the feasibility of the pre-compensation method for the aforementioned process chain, a car door scaling model with dissimilar materials is used, as shown in Figure 4. The external contour is divided into seven segments, including L1L2, L2L3, …, L7L1. The main geometric and process parameters are shown in Table 1. The surface difference and gap deviation are the most important quality indicators in the final assembly stage. The model is simplified as a thin-walled planar structure with inner and outer panels. The inner plate material is DC04 with a thickness of 0.8 mm. The outer plate material is aluminum alloy AA6016-T4 with a thickness of 0.8 mm. The relevant parameters are shown in Table 2. The model of the hemming adhesive is Dow 1496V, and the theoretical thickness of the lower adhesive layer is 0.2 mm. The relevant characteristic parameters of the adhesive are referred to in reference [27].

3. Modeling and Experimental Validation

3.1. Roller Hemming with Adhesive

3.1.1. Modeling and Simulation

The SPH method is used to simulate the adhesive, which is suitable for solving large deformation and avoiding computational mesh distortion. The discrete approximation equation of the smooth function f (xi) at particle i and its derivative is expressed as
f x i = j = 1 N m j ρ j f x j W x i x j , h
f x i = j = 1 N m j ρ j f x j i W x i x j , h
In the formula, mj and ρj respectively represent particle mass and density, h is the smooth length, and W is a smooth kernel function that has the same impulsiveness and normalization constraints as the Dirac δ function.
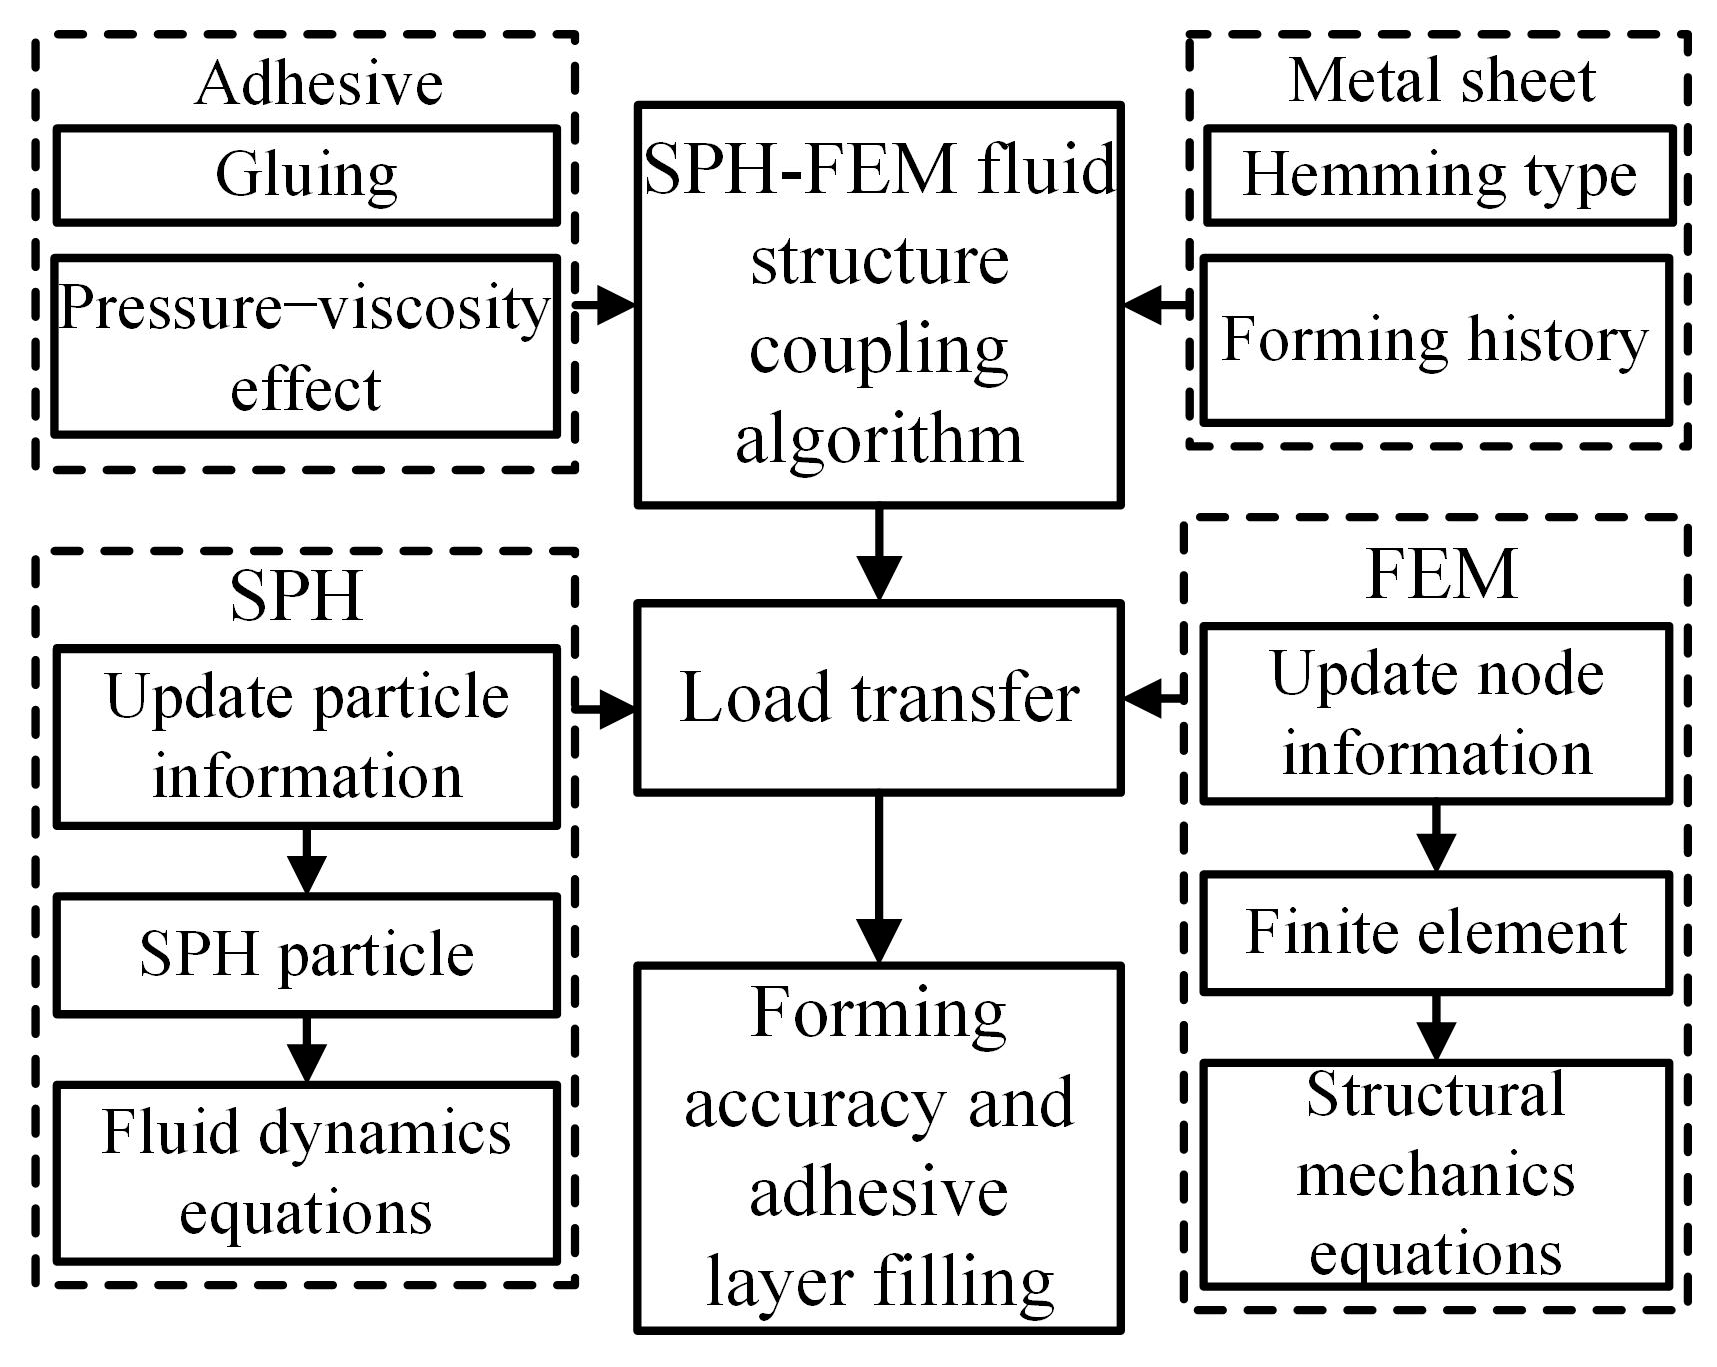
The FEM method has high computational accuracy and is used to simulate metal sheets. Regarding the coupling problem of adhesive and metal sheets, refer to the method in reference [14]. A roller hemming-forming model based on FEM-SPH is established, as shown in Figure 5. The contact forces are separately included in the SPH and FEM equations in the form of external forces, achieving the transmission of element information [28,29]. Taking into account the influence of the pressure–viscosity effect and forming history, the prediction of forming quality for different types of structures is achieved. Since the numerical model with an adhesive layer has a much greater impact on the forming quality than the constitutive model of aluminum alloy, the anisotropy of metal materials is not considered in the simulation.
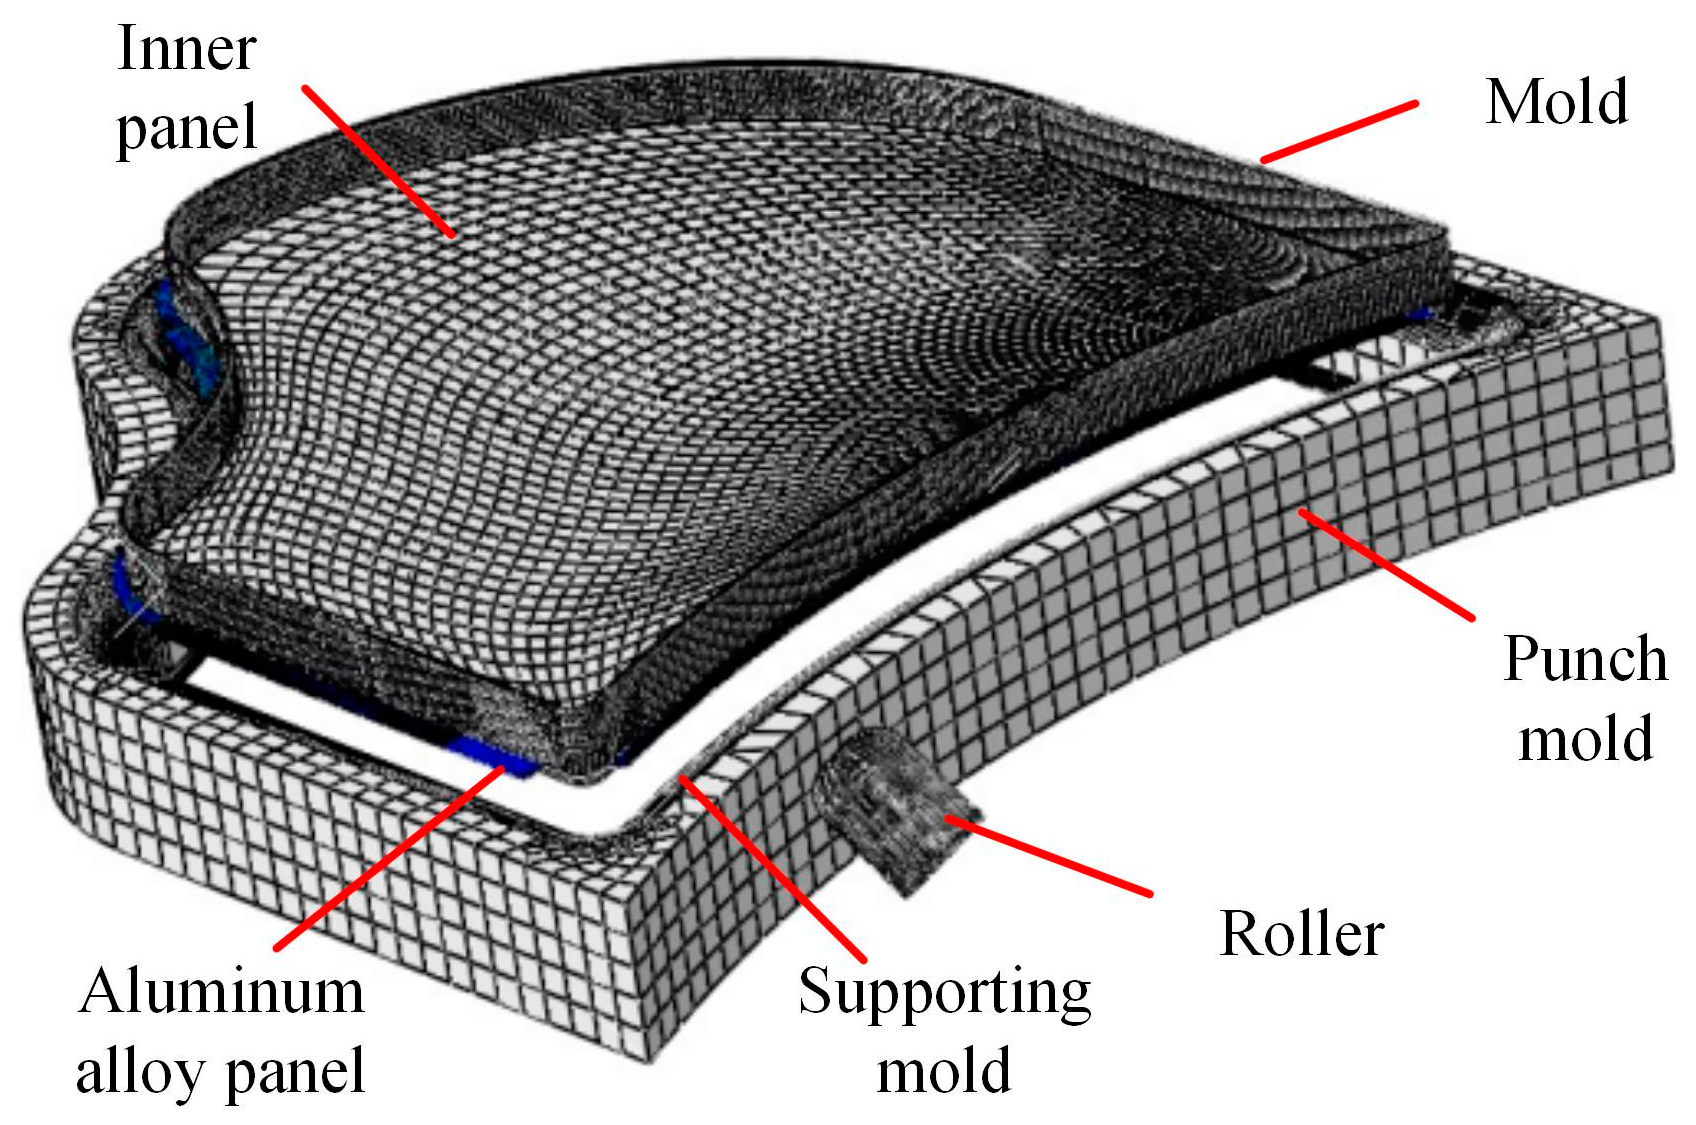
Compared to solid elements, shell elements can save computation time and achieve the same forming accuracy prediction of metal sheets. Therefore, for the simulation of the entire door component, shell elements are used to establish an aluminum alloy FEM model, as shown in Figure 6. The grid size at the corner radius is 0.3 mm; at the flange, it is 0.5 mm. The grid in other areas is sparse. Due to the relatively small impact of the inner panel on the forming quality, it is set as a discrete rigid body, and components such as molds, fixtures, punches, and rollers are also set as discrete rigid bodies.
The boundary condition is that the supporting mold is completely fixed, the steel inner plate can move freely along the direction perpendicular to the thin plate, and the other two directions are fully constrained. The friction coefficient between the mold and the aluminum alloy panel, as well as the coefficient between the adhesive layer and the thin plate, are both 0.1. In addition, to improve computational efficiency, a quality scaling method is adopted and completed through computer multi-core computing, using SPH particles to represent the adhesive, with a particle spacing of 0.1 mm. To improve computational efficiency, a quality scaling method is adopted to perform multi-core calculations on the commercial software platform Abaqus 6.14.

3.1.2. Experimental Verification

In order to verify the accuracy of the complex model and provide a basis for subsequent curing simulation parameters, experimental verification is carried out after the hemming numerical prediction, shown in Figure 7, including the hemming robot, fixture, and supporting mold. The KUKA KR600R2830 robot is selected with force sensors. After flanging, the adhesive strip is applied to the designated position, and then the pressing, pre-hemming, and final hemming processes are completed. The other process parameters are a roller speed of 20 mm/s, a pre-hemming TCP-RTP of 1.5 mm, and a final hemming TCP-RPT of 2.8 mm.

3.2. Curing Process under High-Temperature Cyclic Loading

3.2.1. Modeling and Simulation

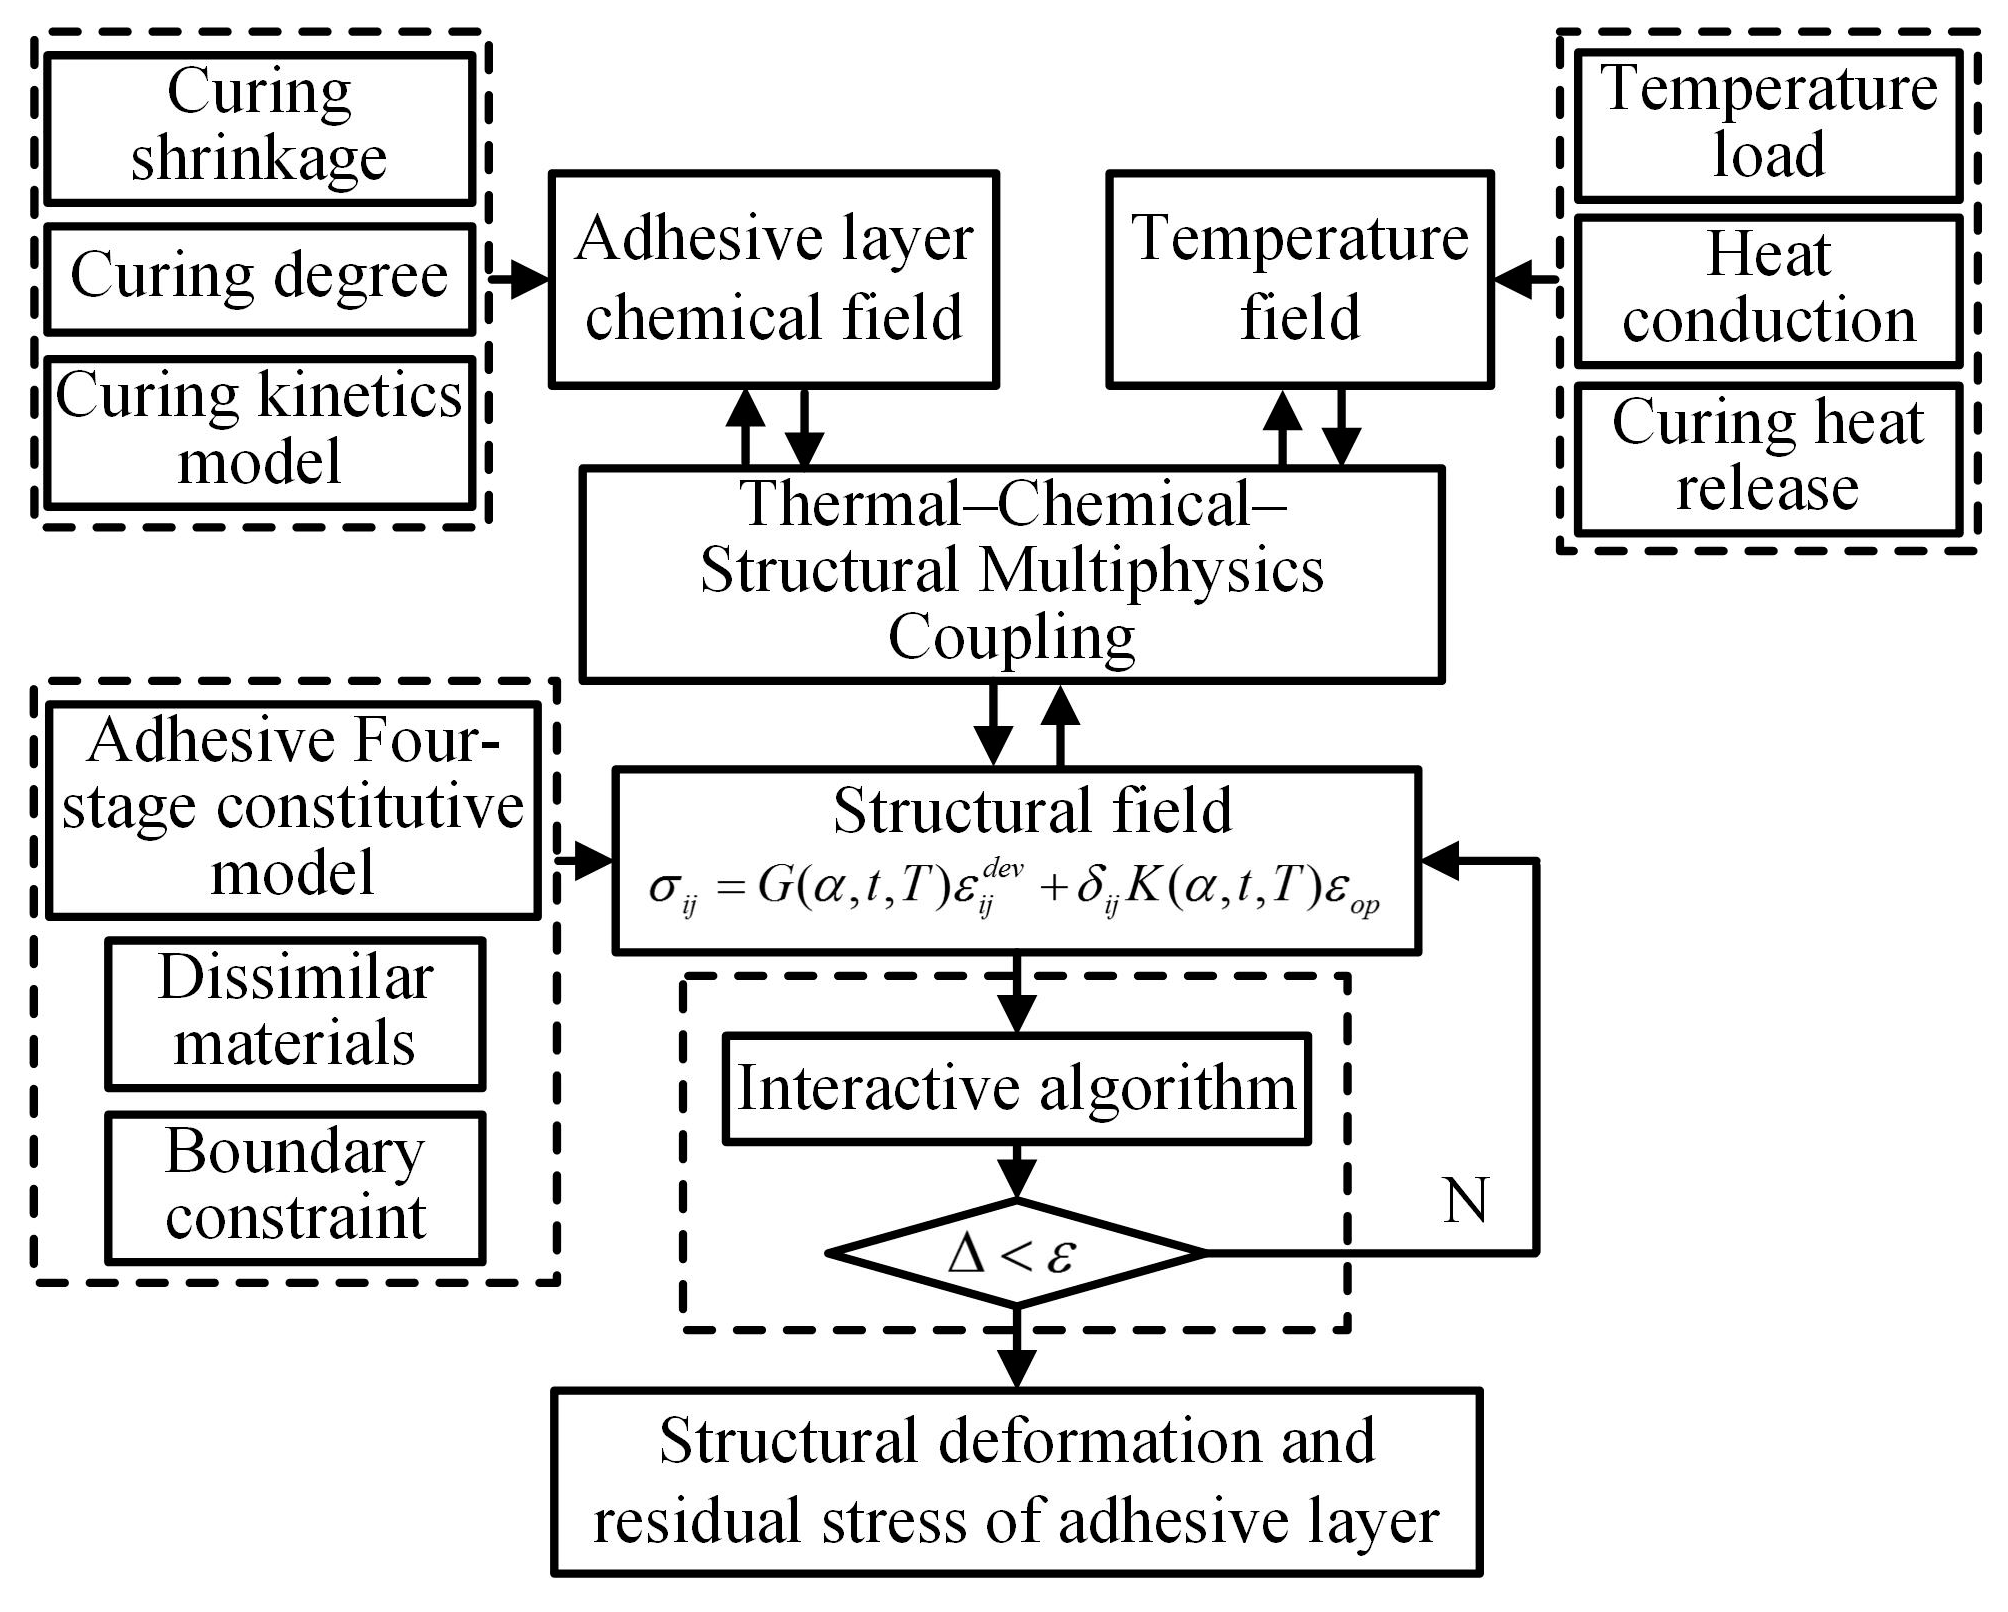
The high-temperature curing process is a multi-physical field that couples the temperature field, the material phase transition, and structural mechanics. To improve prediction accuracy and reduce calculation time, the modeling method [27] is referenced, and a four-stage constitutive model is used for the hemming adhesive.
The differential equation of the transient heat transfer process can be expressed as
ρ c T t = k x 2 T x 2 + k y 2 T y 2 + k z 2 T z 2 + ρ H u d α d t
In the formula, ρ and c represent the density and specific heat of the material, and kx, ky, and kz are the thermal conductivity coefficients in the x, y, and z directions, respectively. T represents the temperature, α represents the curing degree of the folded edge adhesive, Hu represents the total heat released by the adhesive after the curing reaction, and dα/dt is the instantaneous curing rate of the folded edge adhesive.
The constitutive relationship of the structural field can be expressed as
σ i j = G ( α , t , T ) ε i j d e v + δ i j K ( α , t , T ) ε o p
Among them, σ i j is the Cauchy stress tensor, ε i j d e v is the strain partial tensor, δ i j is the Kronecker symbol, and ε o p is the strain tensor. G (α, t, T) and K (α, t, T) represent the shear modulus and bulk modulus, respectively.
The curing kinetics model is represented as
d α d t = A α m ( 1 α ) n exp [ E a R T ]
Among them, R is the universal gas constant 8.314 J/mol·K, A is the prefactor, Ea is the reaction activation energy, and m and n are the reaction orders.
A multiphysics field coupling model for the hemming structure is established, as shown in Figure 8. The chemical field takes into account the effects of curing degree changes and curing kinetics models. The temperature field takes into account external heat conduction and heat release during the curing of the adhesive layer.
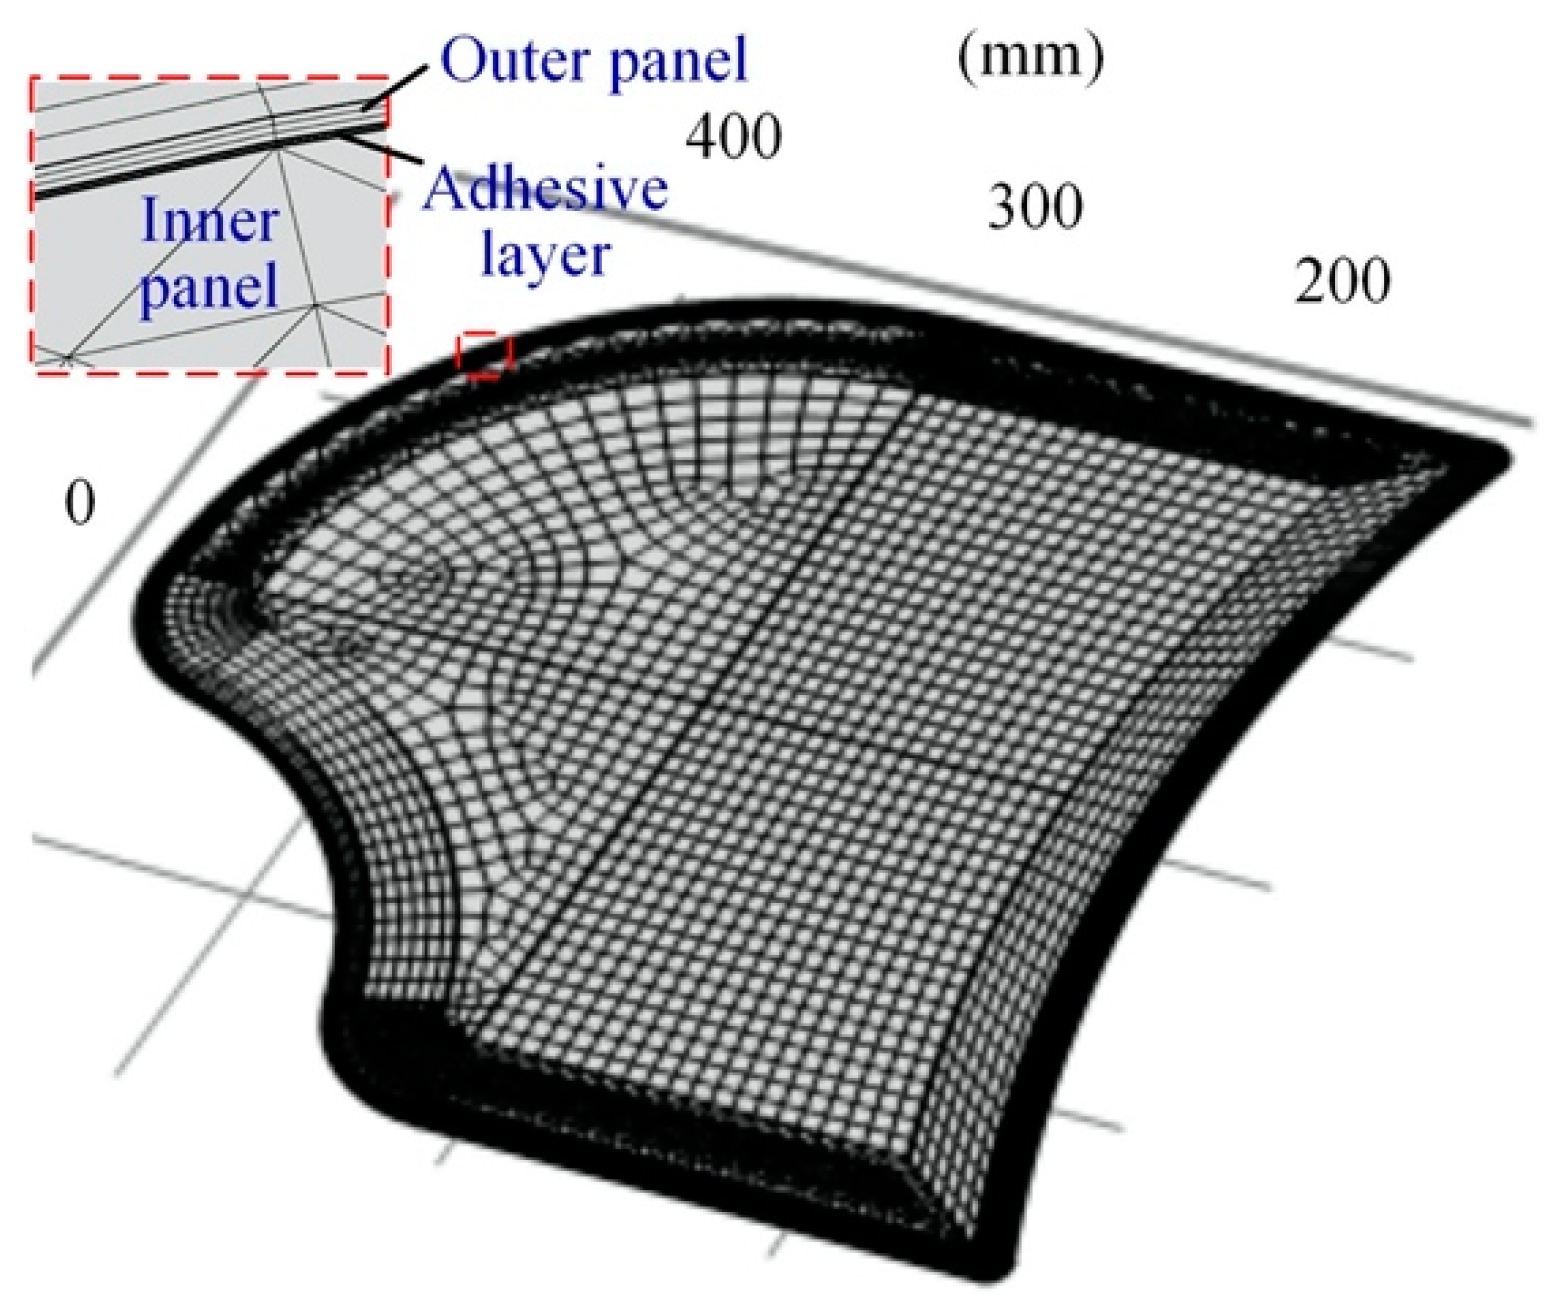
For the mesh division of the finite element model, the adhesive layer at the corner is divided into a triangular prism mesh with a size of 0.05 mm and the rest is divided into a hexahedral mesh, as shown in Figure 9. The edges of the entire structural grid are relatively dense, with a size of 2 mm. The grid size of the flanged part is 0.5 mm, while the grid in other areas is relatively sparse. The curing temperature conditions are a temperature increase of 4 K/min, a maximum temperature of 170 °C, a holding temperature of 30 min, and a cooling rate of 4 K/min. External loads are free, and the structure is only supported by its surface without any constraints. In the curing field, the initial state of the curing degree is 0. To improve computational convergence, it is set to a small initial value of 0.0001. Using the four-stage constitutive model of the adhesive layer, a staged numerical calculation is performed using the transient time domain method. This calculation is completed using the commercial software COMSOL Multiphysics 6.0 platform.

3.2.2. Curing Experiment

The scaled sample is baked in an unconstrained boundary state, which is not suitable to dynamically detect its surface deformation from the vertical direction. Therefore, for the curing deformation of scaled samples, deformation detection is only performed on the final surface state after curing is completed and the surface is cooled to room temperature. As shown in Figure 10, using an ACA ATO-CA38HTS oven, the experimental curing conditions for scaled samples were the same as the simulated conditions.
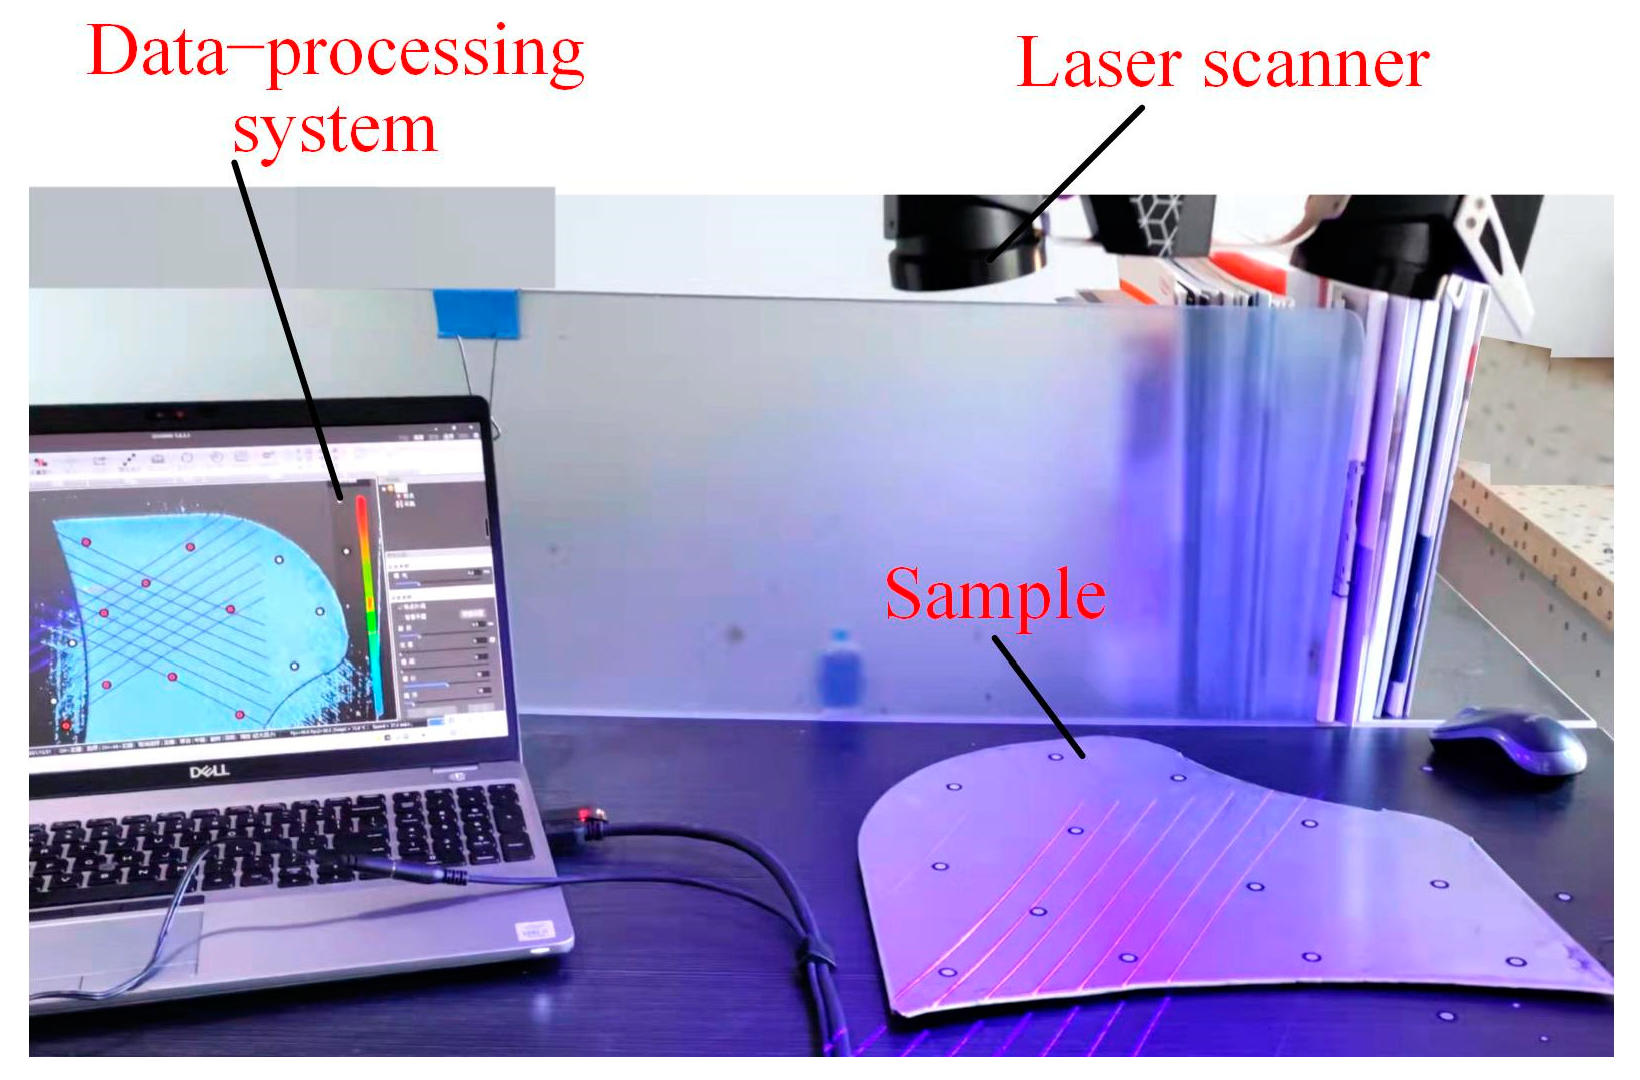
Compared to the assembly gap, the change in assembly surface difference after curing is more significant. The scaled sample undergoes deformation not only at the contour edge, but also internally. This article uses a three-dimensional laser measurement method to obtain surface data of parts, which has the characteristics of non-contact and high accuracy, as shown in Figure 11. The model of the measuring instrument used is SUPERSCAN-BASIC, with a single resolution of 0.01 mm and a single measurement accuracy of 0.01 mm.

3.3. Surface Geometry Correction and Surface Reconstruction

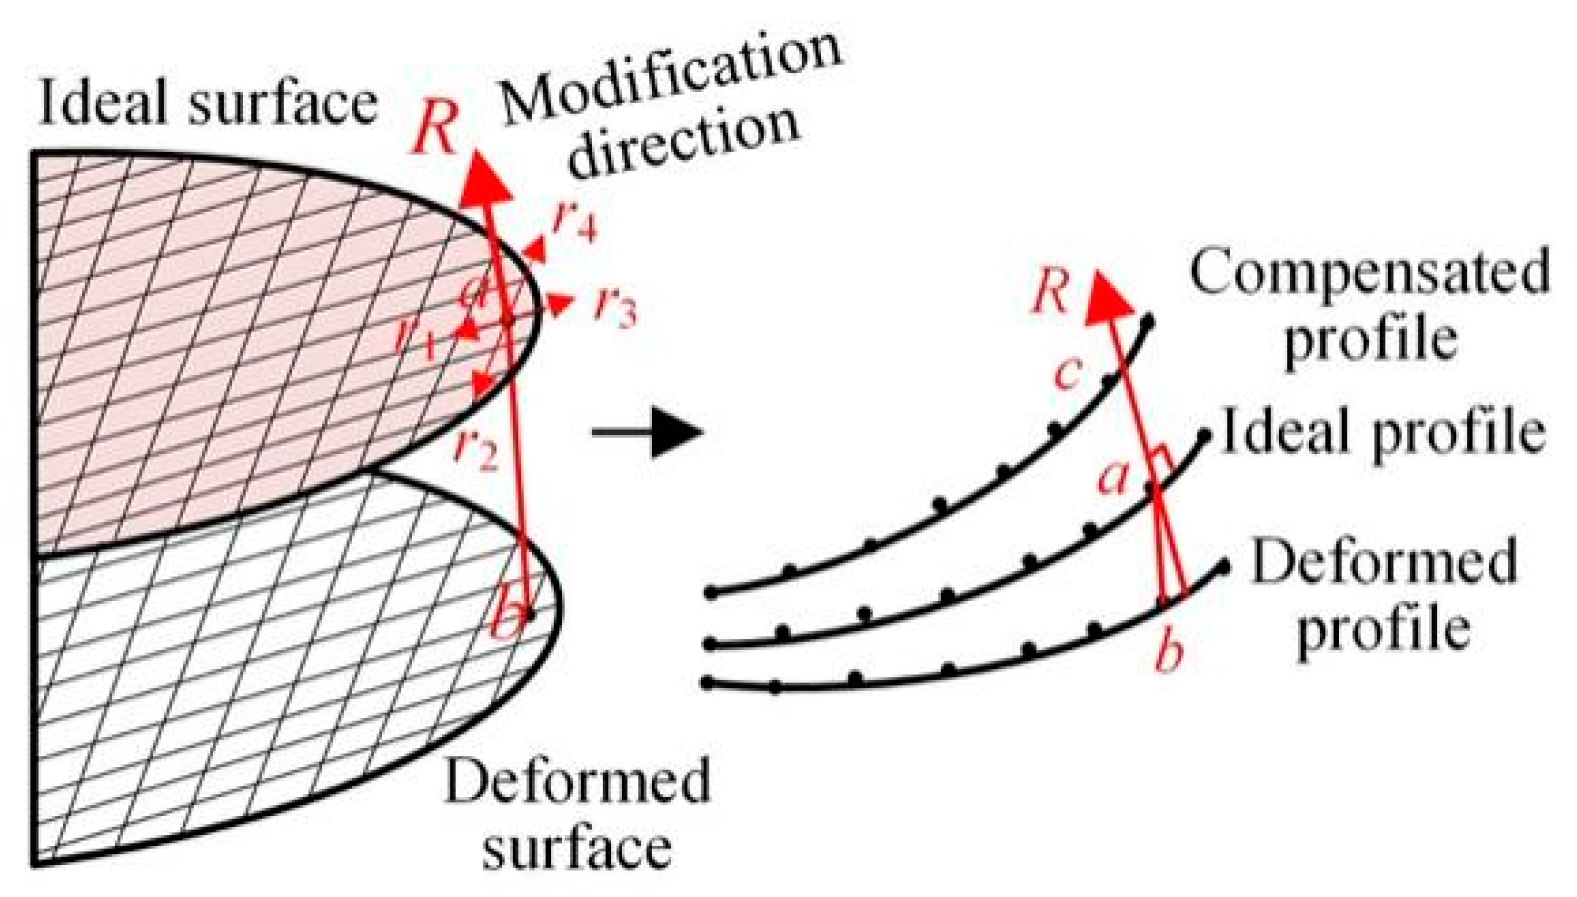
A geometric compensation method to eliminate the curing deformation of hemming structures with dissimilar materials is adopted. As shown in Figure 12, in the opposite direction of the deformation, add a compensation correction amount Δe to the original design surface node. The normal compensation direction method refers to a method where the length of the connecting line between the ideal surface node a and the deformed surface node b is used as the compensation size to find the normal direction for each point on the ideal surface, and the opposite direction is used as the correction direction for compensation. Using normal node compensation, the compensated contour is aligned with the original design contour after the curing process, and the deformation error Δe is finally close to 0.
After the geometric compensation of nodes, inaccurate scattered points, duplicate points, and defect points are easily generated inside the node cloud in local complex surface areas. Therefore, accurate reconstruction from node clouds to surfaces is the key to method implementation. The NURBS method is a direct extension of non-rational B-splines, which can improve local and global shapes by changing vertices and weights. The method is adopted to achieve surface reconstruction.
The general expression for a k × 1 degree NURBS surface is
P ( u , v ) = i = 0 m j = 0 n ω i , j p i , j N i , k ( u ) N j , l ( v ) i = 0 m i = 0 n ω i , j N i , k ( u ) N j , l ( v )
In the formula, di,j is the control vertex, and m and n represent the number of control vertices in the u and v directions, respectively. K and l represent the order of the curves in the u and v directions, respectively. Nj,k (u) is the kth normal B-spline basis function in the u direction, and Nj,l (u) is the lth normal B-spline basis function in the v direction; ω i , j is the vertex weight factor.

4. Results and Discussion

4.1. Forming Process Chain

4.1.1. Analysis of Roller Hemming

Due to the complex structural contours during the roller hemming simulation process, completing multi-stage simulations in the same program can easily lead to overall non-convergence. Therefore, after overall stamping and flanging, multiple program models are established, and simulation calculations are completed for different contour structures. The geometric variation in the outer panel in the roller hemming process using the method of Section 3.1.1 is shown in Figure 13. Compared to the flanged stage, the stress value of the thin plate increases in the hemming stage, mainly due to the stretching of the plate after being squeezed by the roller.
Figure 14 shows the variation values of gaps between different contours of the car door. It can be seen that compared to the method in reference [7], the SPH-FEM method has a higher degree of agreement with experimental values and can reflect the geometric size changes in complex contour structures. The main reason is that this method takes into account the pressure–viscosity effect and considers the transient force of the adhesive layer on the thin plate. Overall, compared to curved contours, the gap between straight contours is relatively larger, and the fluctuation of concave contours is relatively minimal. The smaller the radius, the smaller the gap variation, which is mainly related to the plastic deformation of the metal sheet under tensile and extrusion conditions. At the junctions of different contours, the numerical values fluctuate relatively significantly, mainly due to the changes in roller posture adjustment during the hemming process.
For the convenience of subsequent curing modeling, a comparison is made between the total thickness of the structure and the length of the lower adhesive layer. The measurement position is the same as the gap measurement, and then the values at different points are averaged, as shown in Figure 15. The literature method [7] cannot predict the parameters of the adhesive layer, so only the SPH-FEM simulation results are listed. The experiment method to determine the width of the adhesive layer is to measure it after curing and disassembling the panels. Overall, the experimental values are slightly higher than the simulation values, which is mainly related to the curing expansion of the adhesive. It can be seen that the overall thickness of the structure is uniform, but the convex contours L4L5 and L6L7 are relatively thick, which is mainly caused by material accumulation in the flanging area under small radius bending. The width of the adhesive layer varies with different contours, which is related to the initial gluing-process parameters. It is mainly related to the curing expansion of the adhesive before the measurement operation.

4.1.2. Analysis of Curing Process

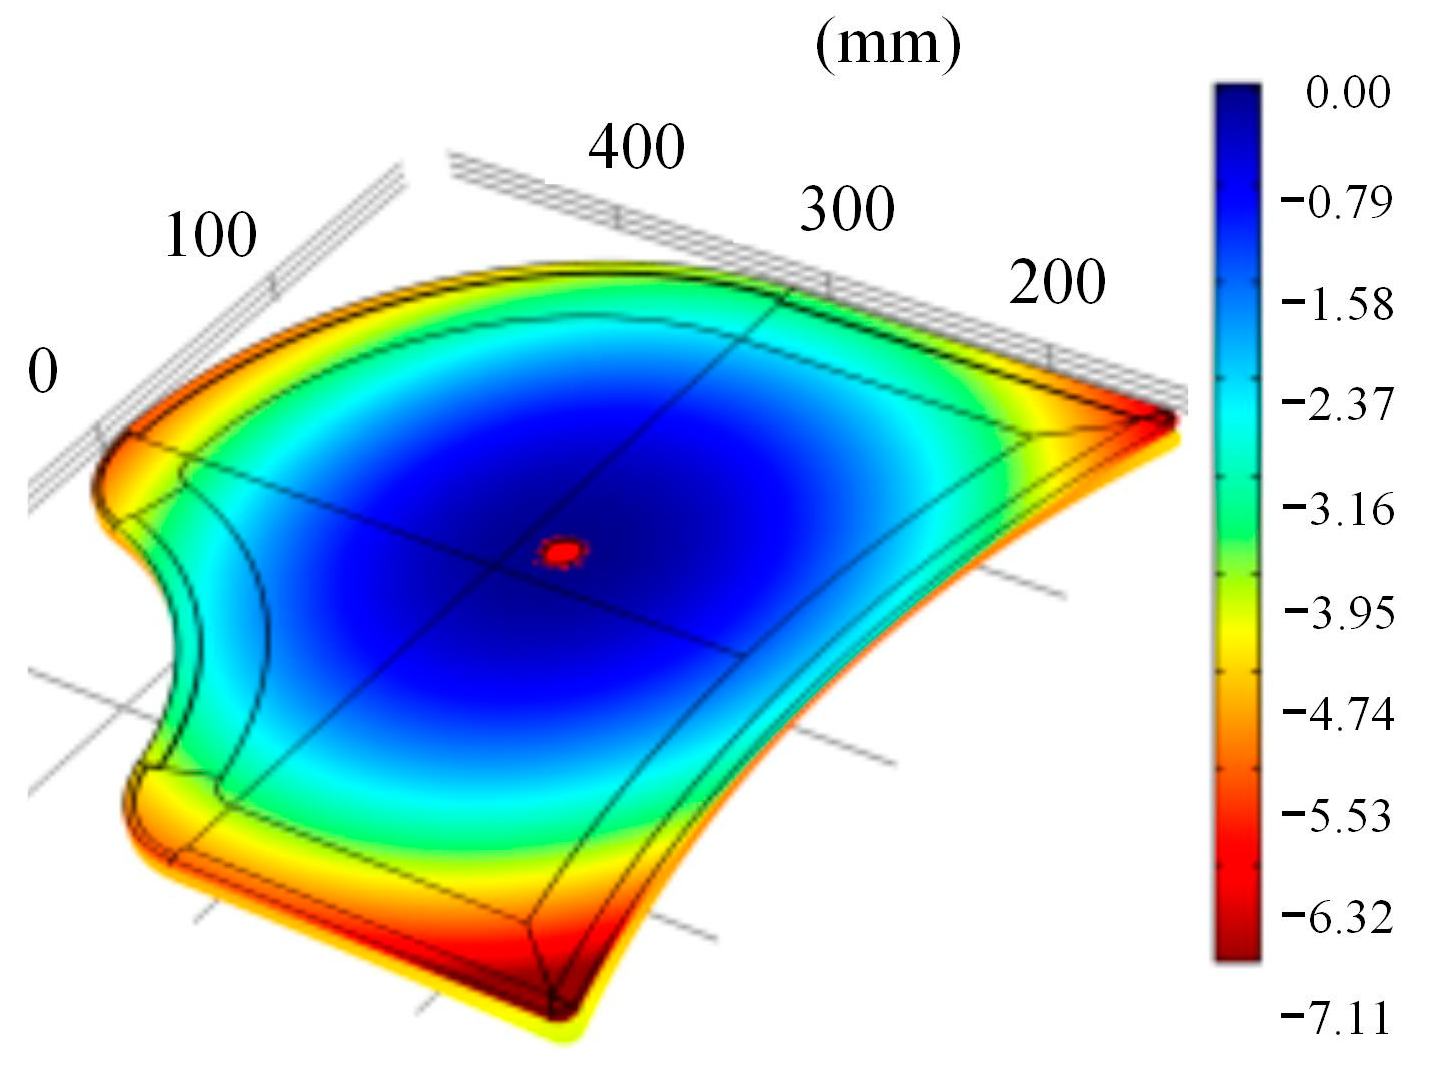
Figure 16 shows the curing simulation deformation results of the sample using the method of Section 3.2.1. It can be seen that the inner and outer surfaces of the cured sample are no longer flat, and the outer contour of the aluminum plate has undergone outward warping deformation. This is mainly due to the curing of the adhesive layer, which induces mismatch deformation of thin plates with dissimilar materials. The gap values of the curing sample are shown in Figure 17. The gap values at different contours of the cured sample increase relatively, which is related to structural warping deformation. The deformation of convex contours L4L5, L5L6, and L6L7 is relatively large. At the corner, the gap value increases relatively significantly, which is mainly related to boundary constraints and size effects.
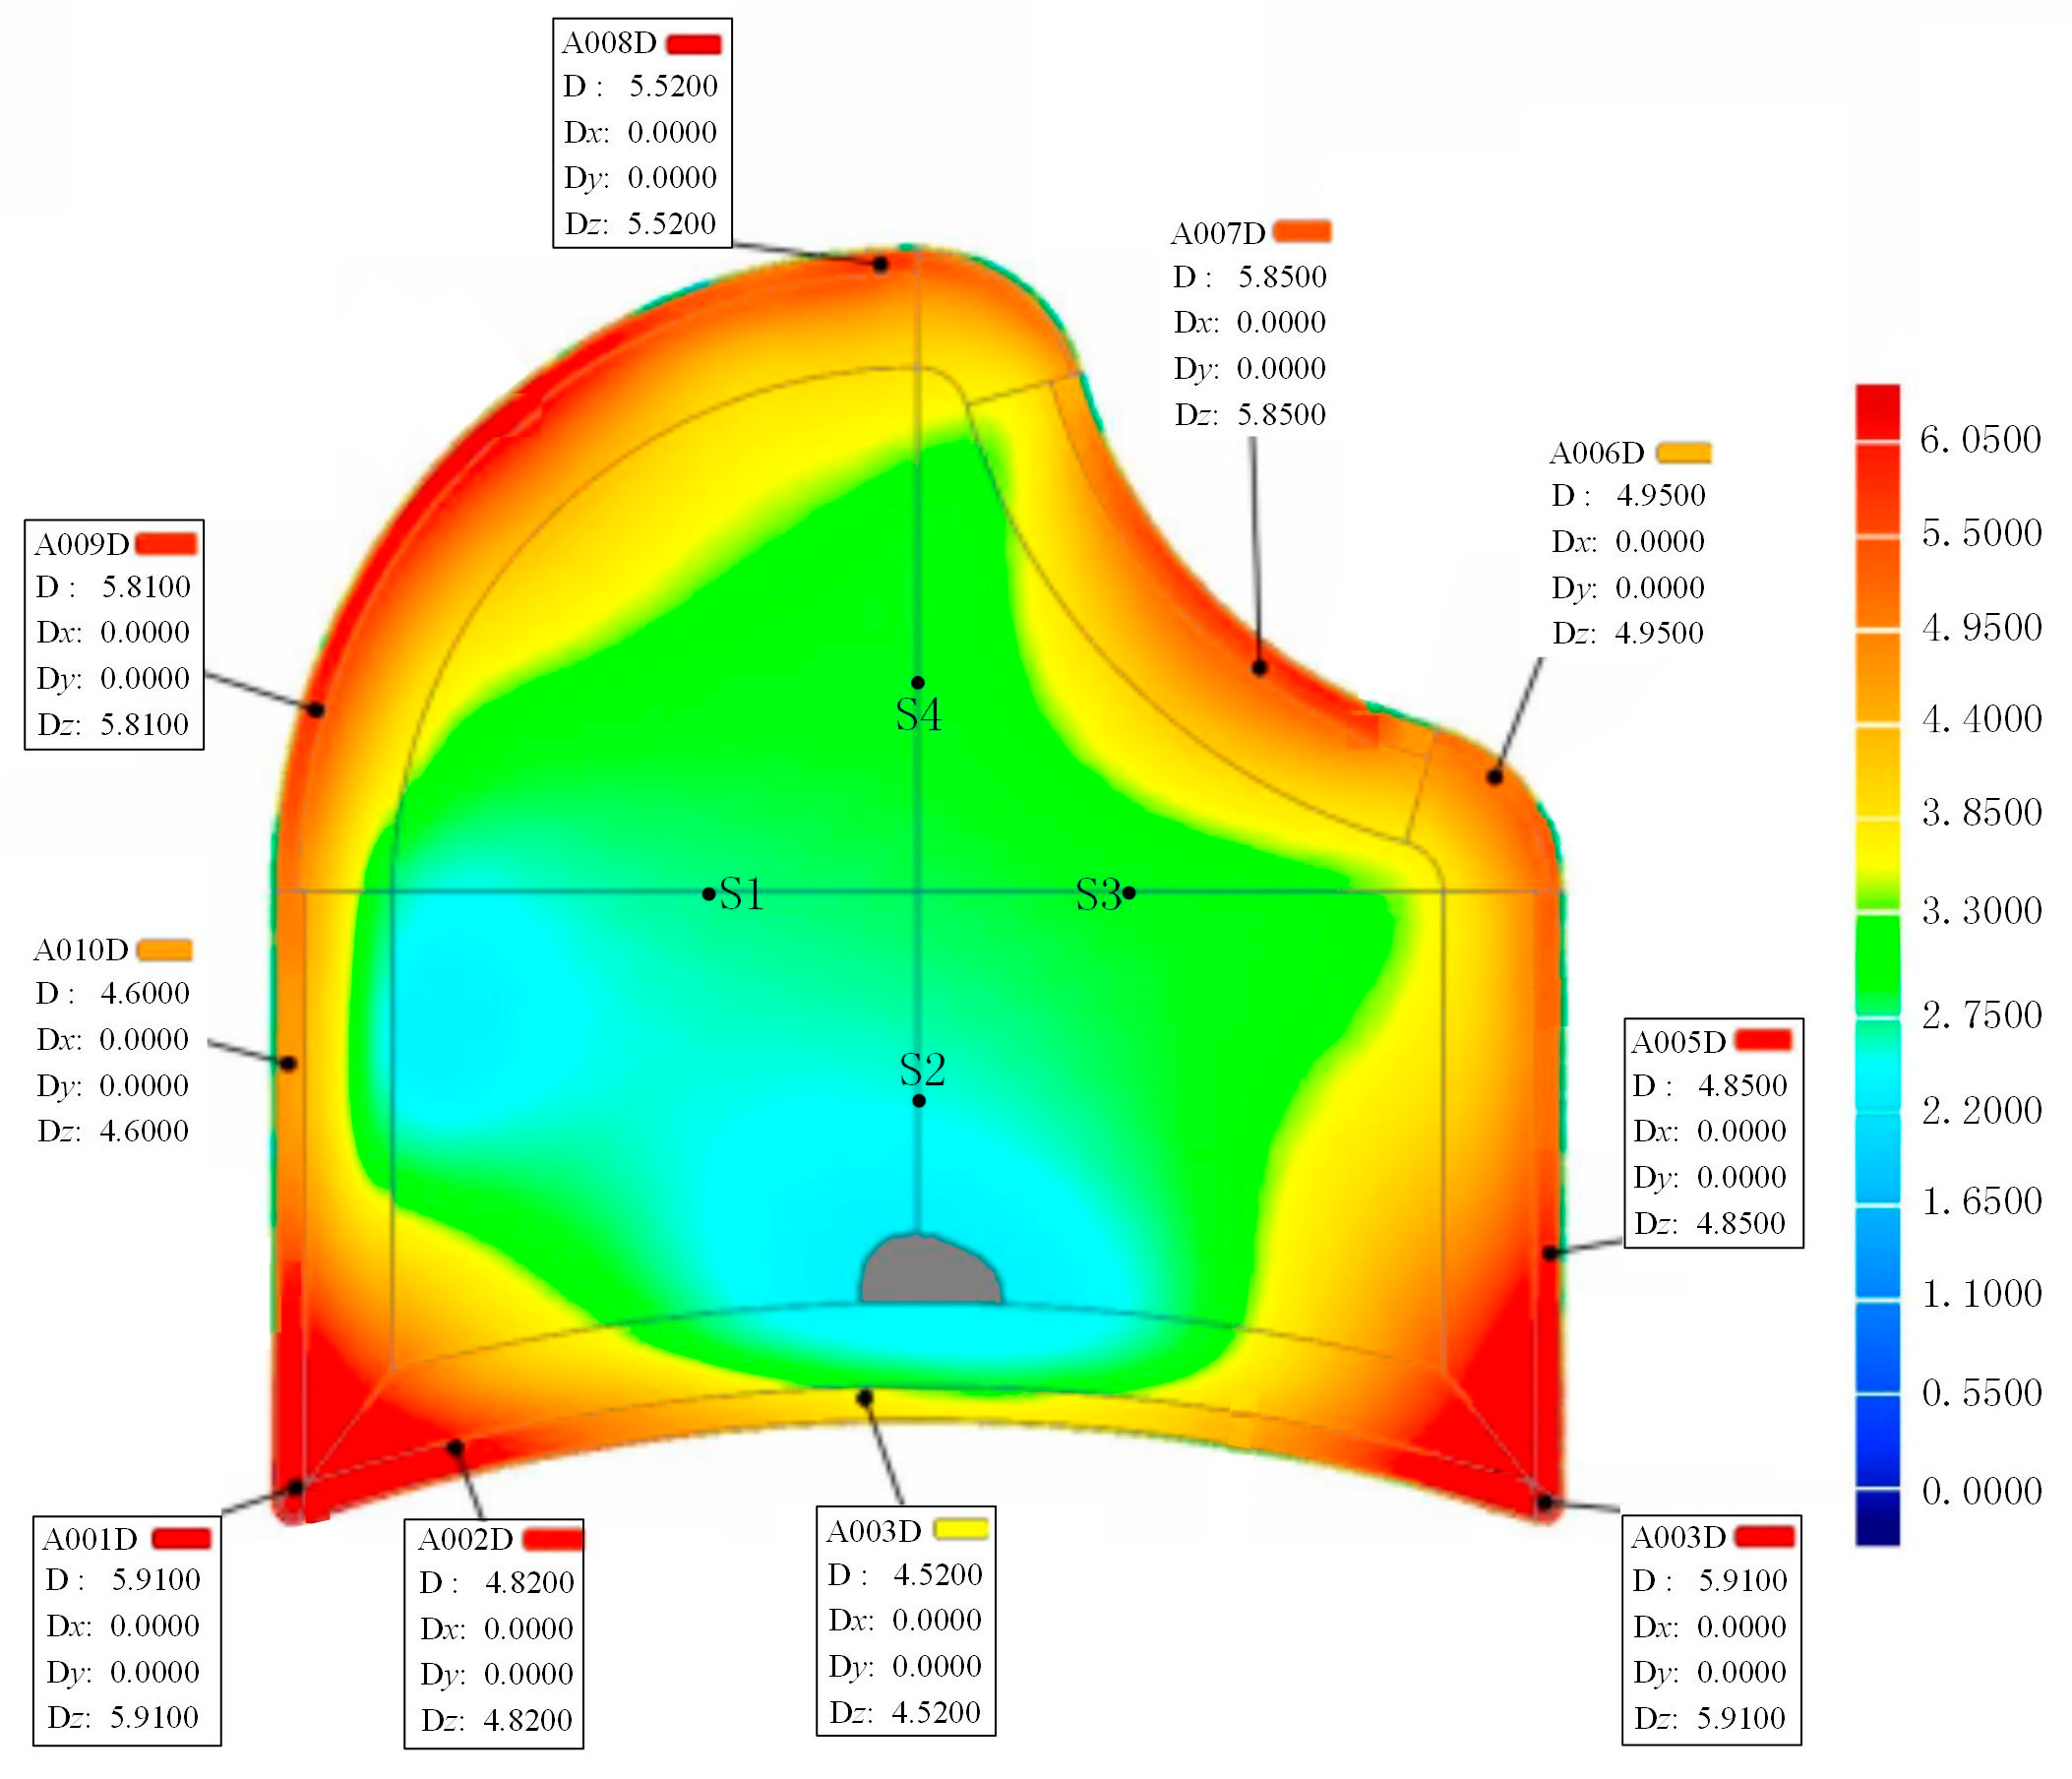
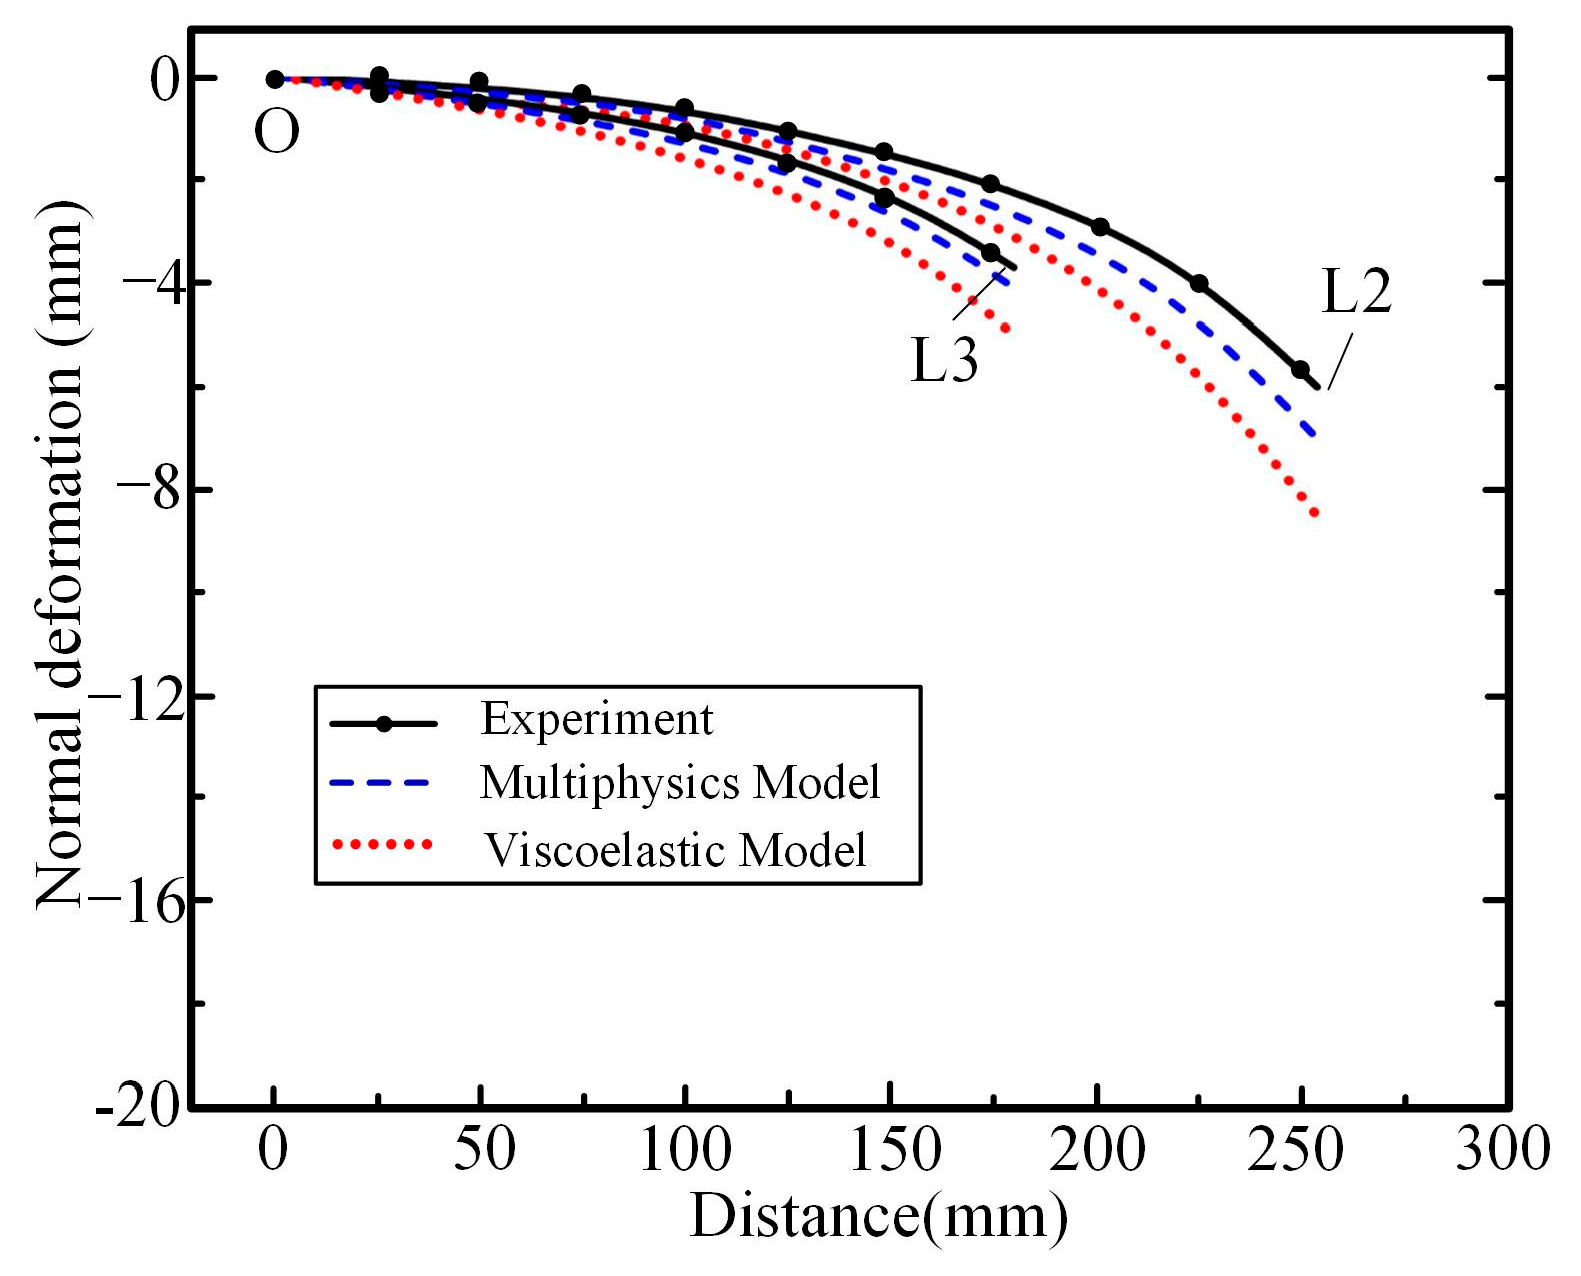
The surface deformation measurement results of a certain sample are shown in Figure 18. It can be seen that the deformation in the middle of the structure is relatively small, while the deformation values around it are relatively large. At the corners L1 and L2, the maximum deformation value reaches 7 mm. The deformation values of OL2 and OL3 segments are shown in Figure 19. It can be seen that compared to the viscoelastic model, the multi-stage model is consistent with the average trend of experimental surface deformation. This is mainly because the multi-stage model considers the influence of chemical shrinkage and curing degree, which can reflect the deformation trend of the hemming structure with complex contours. The amount of curing deformation is smaller away from the center, and the amount of warping at the flange increases, mainly due to the mismatch of different materials. The deformation value is also related to distance, and the shorter the distance, the smaller the deformation value.

4.2. Pre-Compensation and Shape-Control Optimization Process

In response to the above deformation, pre-compensation for node deformation is carried out using the method described in Section 3.3. The deformed node cloud and reconstructed surface are shown in Figure 20. It can be seen that compared to the original panel, the surface has increased the amount of inward bending.
Based on the reconstructed surface shape, simulation and experiments of the roller hemming process are completed. The hemming and curing process parameters remain unchanged. On the basis of the profile, a hemming geometry structure with dissimilar materials is constructed, as shown in Figure 21a, and the pre-compensated scaled sample’s curing simulation results are shown in Figure 21b. It can be seen that after curing, the maximum deformation of the structure still occurs at the corners L1 and L2. Compared with before curing, the gap after curing is relatively reduced, mainly due to the decrease in total deformation of the structural surface and the trend of surface flattening.
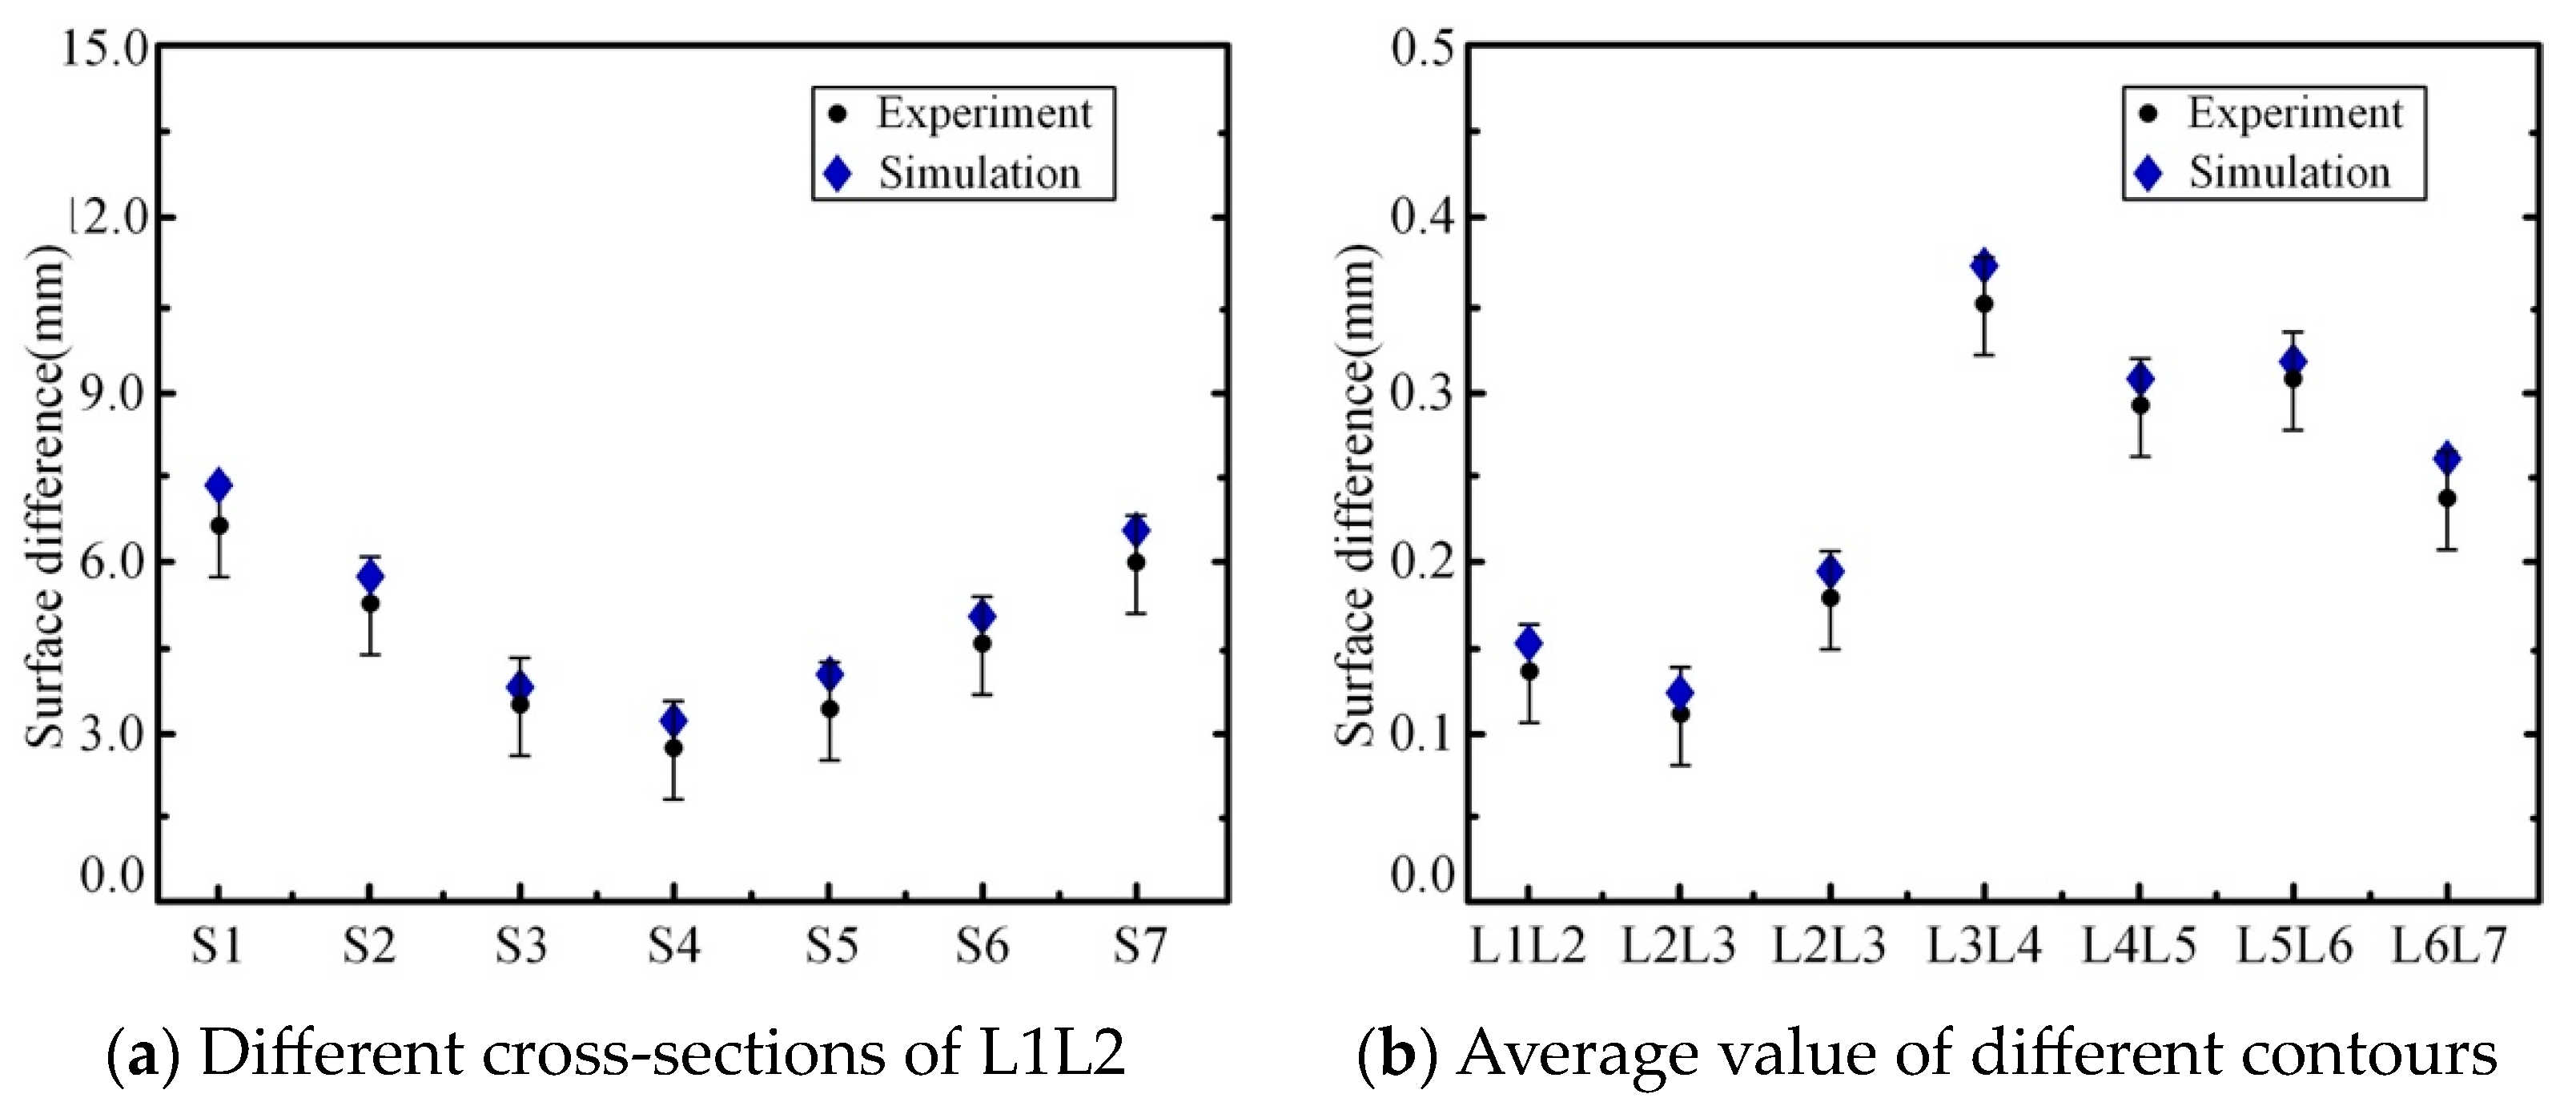
To visually quantify the effect of shape-control methods on correcting assembly errors of door closure components, the mean values of the gap and surface differences at the contour points are taken, as shown in Figure 22. It can be seen that the variation amplitude of the assembly surface difference is much greater than the variation in the gap value. The optimization amplitude on different edge contours is equivalent to a reduction of over 90% in the assembly surface difference. After pre-compensation, the assembly gap is reduced to approximately 0.6 mm, approaching the ideal gap. Overall, the pre-compensation method oriented towards the process chain effectively reduces the overall deformation of the structure and can effectively improve the assembly accuracy of heterogeneous door cover components. With the improvement of manufacturing accuracy, this method can further improve assembly accuracy.

5. Conclusions

(1) The deformation pre-compensation method based on the process chain can significantly reduce the forming quality of steel–aluminum hybrid closure panels, and a single iteration can reduce the assembly deformation surface difference by more than 90%.
(2) The SPH-FEM fluid–structure coupling model can predict the forming quality of hemming thin plates with complex geometric shapes. Compared to curved contours, the gap between straight contours is relatively larger, while the fluctuation of concave contours is relatively smaller.
(3) A multi-stage curing model can predict the quality of the high-temperature curing process of hemming structures with complex geometric shapes. The maximum deformation occurs around the perimeter, which is mainly related to geometric structure and boundary constraints.
(4) The closure panel’s structure is complex, and the geometric model has been simplified in this article. Only one type of thermosetting structural adhesive was selected, and different components of adhesives are needed to verify the reliability of the method. Therefore, to improve the pre-compensation method, it is necessary to construct more refined structural and material models in the future.

Author Contributions

Conceptualization, J.L. and Q.S.; methodology, J.L. and W.Z.; validation, J.L. and Q.S.; formal analysis, J.L. and J.J.; investigation, J.L. and J.J.; resources, J.L. and Q.S.; writing original draft, J.L. and J.J.; writing review and editing, J.J. and W.Z.; funding acquisition, J.L. and W.Z. All authors have read and agreed to the published version of the manuscript.

Funding

This research was supported by the NSFC-China (National Natural Science Foundation of China) Project (No. 51975416).

Data Availability Statement

The original contributions presented in the study are included in the article. Further inquiries can be directed to the corresponding author.

Conflicts of Interest

The authors declare no conflicts of interest.

References

  1. Banea, M.D.; Rosioara, M.; Carbas, R.J.C.; Da Silva, L.F.M. Multi-material adhesive joints for automotive industry. Compos. Part B Eng. 2018, 151, 71–77. [Google Scholar] [CrossRef]
  2. Watson, B.; Nandwani, Y.; Worswick, M.J.; Cronin, D.S. Metallic multi-material adhesive joint testing and modeling for vehicle lightweighting. Int. J. Adhes. Adhes. 2019, 95, 102421. [Google Scholar] [CrossRef]
  3. Tisza, M.; Czinege, I. Comparative study of the application of steels and aluminium in lightweight production of automotive parts. Int. J. Lightweight Mater. Manuf. 2018, 1, 229–238. [Google Scholar] [CrossRef]
  4. Fernholz, K.D. Quantifying the visibility of surface distortions in class A automotive exterior body panels. J. Manuf. Sci. Eng. Trans. ASME 2013, 135, 011001–011011. [Google Scholar] [CrossRef]
  5. Andersson, A. Evaluation and visualisation of surface defects on auto-body panels. J. Mater. Process. Technol. 2009, 209, 821–837. [Google Scholar] [CrossRef]
  6. Gürgen, S. Numerical simulation of roller hemming operation on convex edge-convex surface parts. Adv. Eng. Forum 2016, 15, 75–84. [Google Scholar] [CrossRef]
  7. Svensson, M.; Mattiasson, K. Three-dimensional simulation of hemming with the explicit FE-Method. J. Mater. Process. Technol. 2002, 128, 142–154. [Google Scholar] [CrossRef]
  8. Livatyali, H.; Larris, S.J. Experimental investigation of forming defects in flat surface-convex edge hemming: Roll, recoil and warp. J. Mater. Process. Technol. 2004, 153, 913–919. [Google Scholar] [CrossRef]
  9. Sigvant, M.; Mattiasson, K. FE-Simulation of hemming in the automotive industry. AIP Conf. Proc. 2005, 778, 675–680. [Google Scholar]
  10. Zhang, G.; Xin, W.; Jack, H. A study on fundamental mechanisms of warp and recoil in hemming. J. Eng. Mater. Technol. 2003, 123, 436–441. [Google Scholar] [CrossRef]
  11. Maoût, N.; Thuillier, S.; Manach, P.Y. Drawing, flanging and hemming of metallic thin sheets: A multi-step process. Mater. Des. 2010, 31, 2725–2736. [Google Scholar] [CrossRef]
  12. Thuillier, S.; Maoût, N.; Manach, P.Y. Numerical simulation of the roller hemming process. J. Mater. Process. Technol. 2008, 198, 226–233. [Google Scholar] [CrossRef]
  13. Burka, P.; Liu, X.; Thompson, M.C. Modelling of adhesive bonding for aircraft structures applying the insertion squeeze flow method. Compos. Part B 2013, 50, 247–252. [Google Scholar] [CrossRef]
  14. Li, J.; Zhu, W. Numerical simulation of the roller hemming process based on pressure-viscosity effect. Int. J. Adv. Manuf. Technol. 2019, 105, 1023–1039. [Google Scholar]
  15. Yang, Q.; Huang, P.; Fang, Y. A novel Reynolds equation of non-Newtonian fluid for lubrication simulation. Tribol. Int. 2016, 94, 458–463. [Google Scholar] [CrossRef]
  16. Priesnitz, K.; Sinke, J.; Benedictus, R. Influence of the temperature cycle on local distortions in car panels caused by hot curing epoxies. Int. J. Adhes. Adhes. 2014, 50, 216–222. [Google Scholar] [CrossRef]
  17. Vreugd, J. The Effect of Aging on Molding Compound Properties. Ph.D. Thesis, Delft University of Technology, Delft, The Netherlands, 2011. [Google Scholar]
  18. Fuchs, H.; Fernholz, K.D.; Deslauriers, P. Predicted and measured bond-line read-through response in composite automotive body panels subjected to elevated temperature cure. J. Adhes. 2010, 86, 982–1011. [Google Scholar] [CrossRef]
  19. Priesnitz, K.; Sinke, J.; Benedictus, R. On the simulation of panel distortions due to hot curing adhesives. Int. J. Solids Struct. 2014, 51, 2470–2478. [Google Scholar] [CrossRef]
  20. Zhu, X.; Li, Y.; Chen, G.; Wang, P.C. Curing-induced distortion mechanism in adhesive bonding of aluminum AA6061-t6 and steels. J. Manuf. Sci. Eng. Trans. ASME 2013, 135, 051007. [Google Scholar] [CrossRef]
  21. Zhang, C.; Zhang, G.; Xu, J.; Shi, X.; Wang, X. Review of curing deformation control methods for carbon fiber reinforced resin composites. Polym. Compos. 2022, 43, 3350–3370. [Google Scholar] [CrossRef]
  22. Jansen, K.; Vreugd, J.; Ernst, L. Analytical estimate for curing-induced stress and warpage in coating layers. J. Appl. Polym. Sci. 2012, 126, 1623–1630. [Google Scholar] [CrossRef]
  23. Vreugd, J.; Jansen, K.M.; Ernst, L.J.; Bohm, C. Prediction of cure induced warpage of micro-electronic products. Microelectron. Reliab. 2010, 50, 910–916. [Google Scholar] [CrossRef]
  24. Yoon, M.; Seo, B.; Lim, C.S. Reverse compensation to prevent post-molding dimensional distortion of automobile parts manufactured using CF-SMC. Int. J. Adv. Manuf. Technol. 2022, 123, 4181–4194. [Google Scholar] [CrossRef]
  25. Yang, X.A.; Feng, R. A die design method for springback compensation based on displacement adjustment. Int. J. Mech. Sci. 2011, 53, 399–406. [Google Scholar] [CrossRef]
  26. Christian, K.; Mathias, L.; Karl, R. Springback simulation of the process chain press line forming and roller hemming processes. Key Eng. Mater. 2013, 549, 231–238. [Google Scholar]
  27. Li, J.; Zhu, W.; Li, Y.; Tang, G. Numerical study on curing-induced residual stress and deformation of adhesively bonded sandwich structures of dissimilar materials. Int. J. Adv. Manuf. Technol. 2022, 120, 1189–1201. [Google Scholar] [CrossRef]
  28. Gong, K.; Shao, S.; Liu, H.; Wang, B.; Tan, S.K. Two-phase SPH simulation of fluid-structure interactions. J. Fluids Struct. 2016, 65, 155–179. [Google Scholar] [CrossRef]
  29. Song, H.W.; Pan, P.F.; Ren, G.Q.; Yang, Z.H.; Dan, J.Q.; Li, J.L.; Xiao, J.F.; Xu, J.F. SPH/FEM modeling for laser-assisted machining of fused silica. Int. J. Adv. Manuf. Technol. 2020, 106, 2049–2064. [Google Scholar] [CrossRef]
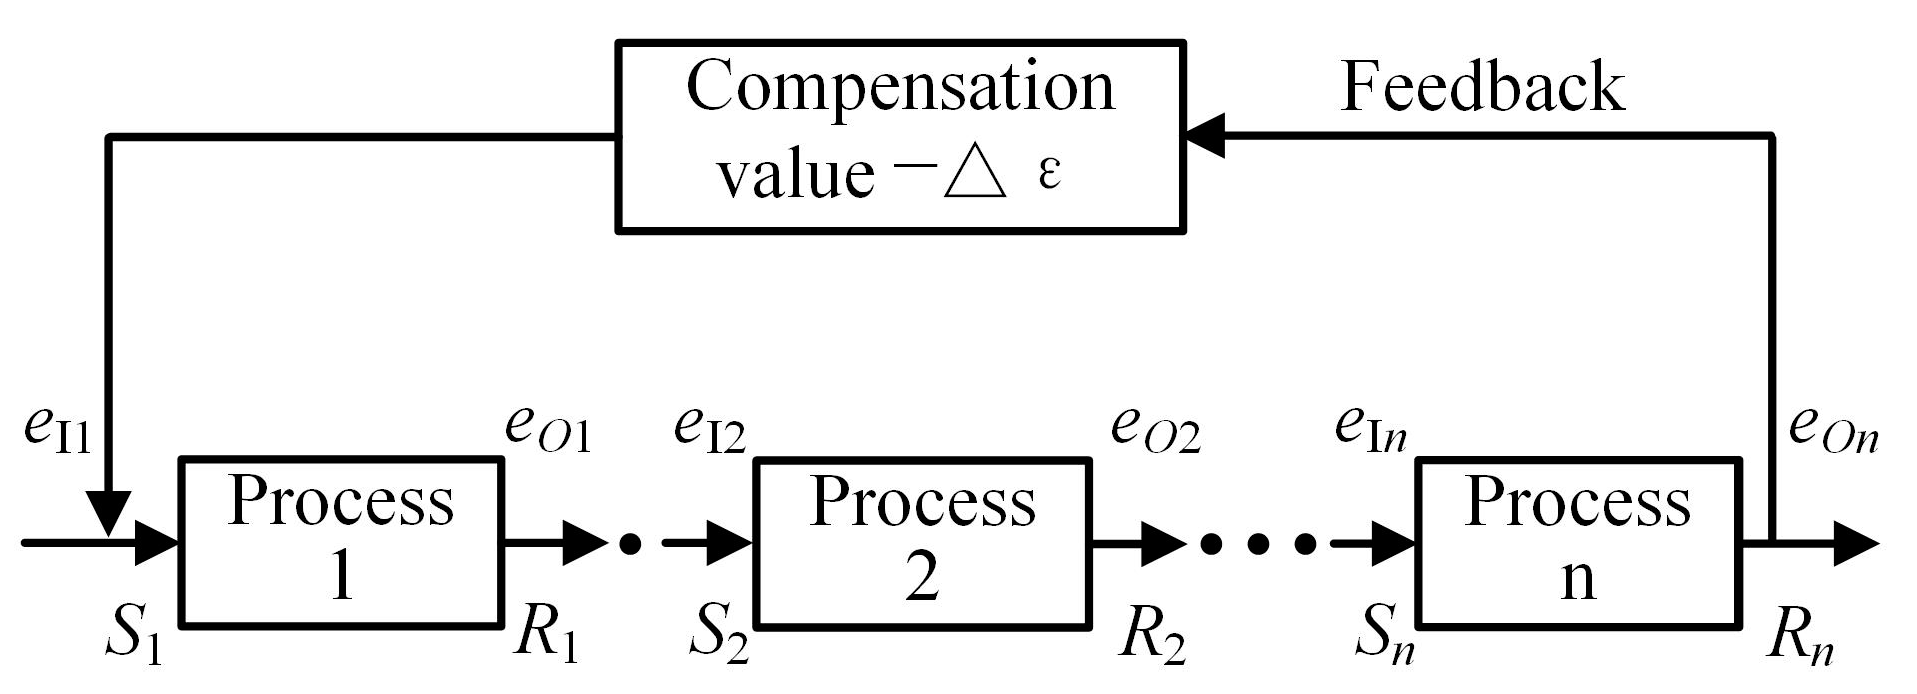
Figure 1. Compensation–logic relationship.
Metals 14 01063 g001
Figure 2. Pre-compensation process based on forming process chain.
Metals 14 01063 g002
Figure 3. The original design route and chain process route (The black arrow represents the original design process route, The blue arrow represents the process compensating route, and the red arrow represents the process compensated route).
Metals 14 01063 g003
Figure 4. Car door scaled sample (The black dashed line represents the flanged edge contour, the black solid line represents the outermost contour, and the blue dashed line represents of the assembly contour of the door).
Metals 14 01063 g004
Figure 5. Fluid–structure coupling algorithm based on FEM-SPH.
Metals 14 01063 g005
Figure 6. Meshing of the roller hemming process.
Metals 14 01063 g006
Figure 7. Roller hemming experiment for car door sample.
Metals 14 01063 g007
Figure 8. Thermal–chemical–structural multiphysics field coupling modeling (Arrows indicate the direction of information transmission for each parameter in the model).
Metals 14 01063 g008
Figure 9. Meshing of the hemming structure.
Metals 14 01063 g009
Figure 10. Curing experiment.
Metals 14 01063 g010
Figure 11. Laser 3D-scanning measurement experiment.
Metals 14 01063 g011
Figure 12. Geometric compensation method for surface deformation (The arrow indicates the normal direction of the node).
Metals 14 01063 g012
Figure 13. The geometric variation in the outer panel in the roller hemming process.
Metals 14 01063 g013
Figure 14. Gap values for different contours.
Metals 14 01063 g014
Figure 15. Total thickness and width of lower adhesive layer.
Metals 14 01063 g015
Figure 16. Simulation prediction of sample curing results.
Metals 14 01063 g016
Figure 17. Changes in surface difference after curing.
Metals 14 01063 g017
Figure 18. Deformation diagram measured by laser 3D scanning.
Metals 14 01063 g018
Figure 19. The deformation of OL2 and OL3 segments.
Metals 14 01063 g019
Figure 20. Compensated aluminum alloy plate nodes and surface (Arrows indicate the direction of the view).
Metals 14 01063 g020
Figure 21. Simulation deformation of hemming structure after compensation (Arrows indicate the direction of the view).
Metals 14 01063 g021
Figure 22. Gap and surface difference variations in different segments.
Metals 14 01063 g022
Table 1. Main geometric and process parameters (mm).
SegmentL1L2L2L3L3L4L4L5L5L6L6L7L7L1
Contour typeConcaveStraightConvexConvexConcaveConvexStraight
Inner plate radius R1530.0180.050.0136.850.0
Outer plate radius R2530.0180.050.0136.850.0
Outer panel fillet radius r0.60.60.60.60.60.60.6
Flanging height H8.58.06.04.55.04.56.0
Adhesive edge distance L2222222
Adhesive diameter D3.23.23.23.23.23.23.2
Table 2. Main parameters of the metal materials.
Material.
Name
Specific Heat
(J/Kg·K)
Coefficient of Thermal
Expansion
(10−6/K)
Shear
Modulus
(GPa)
Bulk
Modulus
(GPa)
Thermal Conductivity
Coefficient
(W/m·K)
AA6016-T489623.226.557.5167
DC0450912.580.717550.2
Disclaimer/Publisher’s Note: The statements, opinions and data contained in all publications are solely those of the individual author(s) and contributor(s) and not of MDPI and/or the editor(s). MDPI and/or the editor(s) disclaim responsibility for any injury to people or property resulting from any ideas, methods, instructions or products referred to in the content.