Article

Sintering Mechanism and Leaching Kinetics of Low-Grade Mixed Lithium Ore and Limestone

1
Institute of Process Engineering, Chinese Academy of Sciences, Beijing 100190, China
2
School of Chemical Engineering, University of Chinese Academy of Sciences, Beijing 100049, China
*
Authors to whom correspondence should be addressed.
Metals 2024, 14(9), 1075; https://doi.org/10.3390/met14091075
Submission received: 7 August 2024 / Revised: 3 September 2024 / Accepted: 14 September 2024 / Published: 19 September 2024

Abstract

:
With the rapid development of new energy fields and the current shortage of lithium supply, an efficient, clean, and stable lithium resource extraction process is urgently necessary. In this paper, various advanced detection methods were utilized to conduct a mineralogical analysis of the raw ore and systematically study the occurrence state of lithium; the limestone sintering process was strengthened and optimized, elucidating the sintering mechanism and analyzing the leaching process kinetics. Under an ingredient ratio of 1:3, a sample particle size of 300 mesh, a sintering temperature of 1100 °C, a sintering time of 3 h, a liquid–solid ratio of 2:1, a leaching temperature of 95 °C, and a leaching time of 1 h, the leaching rate of Li reached 90.04%. The highly active Ca–O combined with Si–O on the surface of β–spodumene to CaSiO4, and Al–O was isolated and combined with Li to LiAlO2, which was beneficial for the leaching process. The leaching process was controlled by both surface chemical reactions and diffusion processes, and Ea was 27.18 kJ/mol. These studies provide theoretical guidance for the subsequent re-optimization of the process.

1. Introduction

Lithium, the lightest solid element, is used extensively in many emerging industries and fields, including batteries, energy storage, and aerospace. It is referred to as the “energy metal that drives the world” with the highest specific heat capacity, the smallest ionic radius of all alkali metals, and a high electrochemical potential [1,2,3]. The demand and supply of lithium resources are rising quickly due to the robust growth of the global new energy industry. By 2030, the global supply of lithium is predicted to reach 200,000 tons, and the demand will rise to 2–4 times the current level, with a high risk of a shortage [4,5]. It is necessary to adopt stable, efficient, and clean methods for extracting lithium resources to reduce the risk of lithium supply shortage and national security.
Salt lake brine, pegmatite, and sedimentary rock lithium resources are the three most significant types of lithium mineralization. Lithium extraction from salt lake brine is a significant global source of lithium resources that offers the benefits of low cost and low pollution [6,7]. In 1978, William and Olson [8] noted that in order to extract lithium from salt lake brine, local conditions must be taken into account. Additionally, to separate lithium from low-grade brine or brine with a high magnesium–lithium ratio, ion exchange or liquid–liquid extraction technology must be developed. The most widely used extractant is TBP solvent [9,10,11], but the disadvantage is that the process is highly corrosive and has serious environmental pollution. Ionic liquid extraction systems [12,13,14] can reduce the pollutant load of organic solvents, but their disadvantages are high cost and low transfer efficiency. Su et al. [15] used TBP, FeCl3, and P507 systems to extract lithium, which has low corrosiveness and degradability. Kopperchem used glucan as an extractant for lithium, which has the advantages of being more water-soluble and stable. It is mainly used for extracting low concentration lithium from waste liquids. However, these methods have not yet been put into industrial production. As a result, industrial lithium of salt lakes extraction technology still faces problems such as long production cycles, unstable production, and environmental pollution. The development and utilization of clay-type lithium resources have gained popularity in recent years, although production capacity has not yet been established, and research is still in the laboratory exploration stage [16]. Nowadays, the production technology for extracting lithium from ore is developing rapidly, with advantages such as a fast production cycle, easy mining, and mature technology, accounting for roughly half of the world’s production of lithium salt. The extraction of lithium from ores is a dependable and effective technique for obtaining lithium salts, especially given the increasing demand for lithium resources [17].
Common methods for extracting lithium from ores include sulfuric acid roasting [18], sulfate roasting [19], limestone sintering [20], alkaline pressure leaching [21], etc. The sulfuric acid roasting method has been widely used in industry. It has the advantages of a high leaching rate and strong adaptability to different raw materials, but the disadvantages of excessive acid consumption in the process and acid mist generated, which pollute the environment and corrode equipment [22,23,24]. These shortcomings restrict the further development of the sulfuric acid method. Zhang et al. [17] added CaO and then carried out sulfuric acid leaching in the transformation and activation of lithium concentrate, which reduced the acid consumption but also increased the amount of waste residue. Other researchers [25] used low-temperature sulfuric acid roasting and water leaching to extract lithium from lepidolite (KLi2Al(OH,F)2Si4O10). Under optimal conditions, the lithium leaching rate can reach 97.1%. However, the obvious risk of equipment corrosion has not yet been addressed. At present, the sulfate roasting method is a promising method for lithium extraction. Su et al. [26] used K2SO4 + KOH as the roasting additive, and the lithium extraction efficiency was 92.78% after roasting at 900 °C. Jiang et al. [16] used FeSO4 + K2SO4 as roasting additives and used microwave heating to roast lepidolite, which reduced the energy consumption of roasting.
However, the use of the sulfate roasting method usually introduced new impurities, which was not conducive to subsequent lithium purification. The alkaline pressure leaching process is short, simple, high purity product, and low equipment corrosion. Mulwanda et al. [27] investigated the pressure leaching of lithium and other valuable metals from lepidolite using NaOH and Ca(OH)2, and the final lithium leaching rate reached more than 92%. However, due to the high cost of additives, this method has not been used in industrial practice.
The limestone sintering method is a relatively common process in the early lithium extraction industry because the raw materials are cheap and easy to obtain, and the production process is simple and environmentally friendly. However, the traditional sintering process has the problem of low lithium leaching rate, which is unclear about the mechanism of the sintering process and does not fully release lithium from the ores. It is urgent to master and clarify the sintering mechanism of lithium ore with limestone, strengthen the sintering process, and improve the lithium recovery rate.
In this paper, various advanced detection methods were utilized to conduct the mineralogical analysis of low-grade mixed lithium ores to track the occurrence status of lithium. Based on the study of sintering thermodynamic and kinetic, by strengthening and optimizing the sintering process, the original crystal structure of lithium is destroyed, promoting the thermal decomposition and oxidation–reduction reactions of lithium compounds in the ore and improving the sintering efficiency of raw materials. By clarifying the mechanism of sintering process and studying the kinetics of leaching process, the leaching and recovery rates of lithium in low-grade lithium ore will be effectively improved.

2. Experimental

2.1. Materials

The raw material for this experiment was from lithium ore in Zimbabwe, African. The experimental lithium ore was a mixed type of lithium ore that needed to be crushed and ground to screen out ore powder. The chemical composition of lithium ore, as determined by X-ray fluorescence (XRF, PANalytical B.V., Almelo, The Netherlands) for the remaining elements and inductively coupled plasma-optical emission spectrometry (ICP-OES, PerkinElmer, Shelton, CT, USA) for Li-concentration, as listed in Table 1. It was evident that the primary constituents of lithium ore were SiO2, Al2O3, K2O, and Li2O. In particular, the content of Li2O was 2.72 wt.%, which was a low-grade lithium ore [28,29]. Trace amounts of Rb2O (0.24 wt.%), Cs2O (0.02 wt.%), and rare earth elements were also found in the sample. The mineralogical characterization of the studied lithium ore [30,31,32] was described in Section 3.1.1.

2.2. Methods

2.2.1. Limestone Sintering Procedure

The sintering experiment was carried out in a muffle furnace with a high temperature. First, 10 g of lithium ore powder was selected for the experiment, and the particle size was chosen within the range of 50–350 mesh. Then, 20–40 g of CaCO3 was mixed with lithium ore powder and placed in a corundum crucible. The crucible was then put inside the muffle furnace, which was heated for 1.5 h from room temperature to 1000–1200 °C at the rate of 10 °C/min. When the target temperature was reached, it was maintained for 1–3 h. After the sintering process was completed, the sintered product was allowed to cool the room temperature in the furnace and then removed. The sintered product was green block-shaped with a loose structure. Finally, the product was ground in a mortar for 20 min, and the next leaching experiment was conducted.

2.2.2. Leaching Procedure

The sintered sample was weighed and recorded for the leaching experiments. A certain amount of pure water was added to the beaker in a constant-temperature oil bath. The liquid–solid ratio for the leaching process was (2–6) mL:1 g, and the water leaching temperature was 75–115 °C, with a leaching time of 1–5 h and a fixed mechanical stirring speed of 400 r/min. Following the conclusion of the leaching experiments, the suspension was separated by vacuum filtration, which was subsequently dried for 8 h at 80 °C. The sintering and leaching conditions in this study were optimized through the use of a sequential test method.
The leaching rate of Li+ can be calculated by Equation (1).
η = 1 M 1 × C 1 × V 1 M 2 × M 3 × C L i + × 100 %
where M1 refers to the mass of leach residues (g), M2 refers to the mass of residues (g) before ICP, M3 refers to the mass of lithium ore (g), CLi+ and C1 refer to the lithium concentration in the material before and after leaching (mg/L), respectively, V1 refers to the volume of the volumetric flask (mL), respectively. The experiments were repeated three times, and the data were taken as the average of three data points.

2.3. Characterization

The elemental contents in the material and filtrate were determined by ICP. The phase composition, microstructure, and elemental distribution were analyzed using X-ray diffraction (XRD, Rigaku Corporation, Tokyo, Japan) of the raw materials with a speed of 2θ = 5°/min in the 2θ scan range from 5° to 90°, electron probe X-ray micro-analyzer (EPMA, JEOL, Tokyo, Japan), mineral liberation analyzer (MLA, FEI, Brno, Czech Republic), scanning electron microscopy, and energy dispersive spectroscopy (SEM/EDS, JEOL, Tokyo, Japan). The weight loss and heat change were measured by thermogravimetric analysis differential scanning calorimetry (TG-DSC, SETARAM LABSYS, Caluire, French). Performed in a nitrogen atmosphere at a flow rate of 100 mL/min and a rate of 10 °C/min from 10 to 1200 °C. The materials project website provides access to the Cifs data needed for this research. Possible reactions were calculated thermodynamically using HSC 6.0. VESTA simulations were used to create the structural model.

3. Results and Discussion

3.1. Mineralogical Analysis

3.1.1. Phase Analysis of Lithium Ore

The phase composition of lithium ore was performed by XRD analysis, as shown in Figure 1. The peak value of α–spodumene was more obvious, while the peak value of lepidolite was weaker, which may be the less lepidolite content in the raw material. Meantime, the most noticeable peaks were those of quartz, albite, and orthoclase, suggesting that there may be a significant amount of SiO2, NaAlSi3O8, and KAlSi3O8 in the raw materials. As such, preliminary conjecture indicated that quartz, orthoclase, albite, and spodumene comprised the major phases of the raw materials, and the content of lepidolite may be very low.

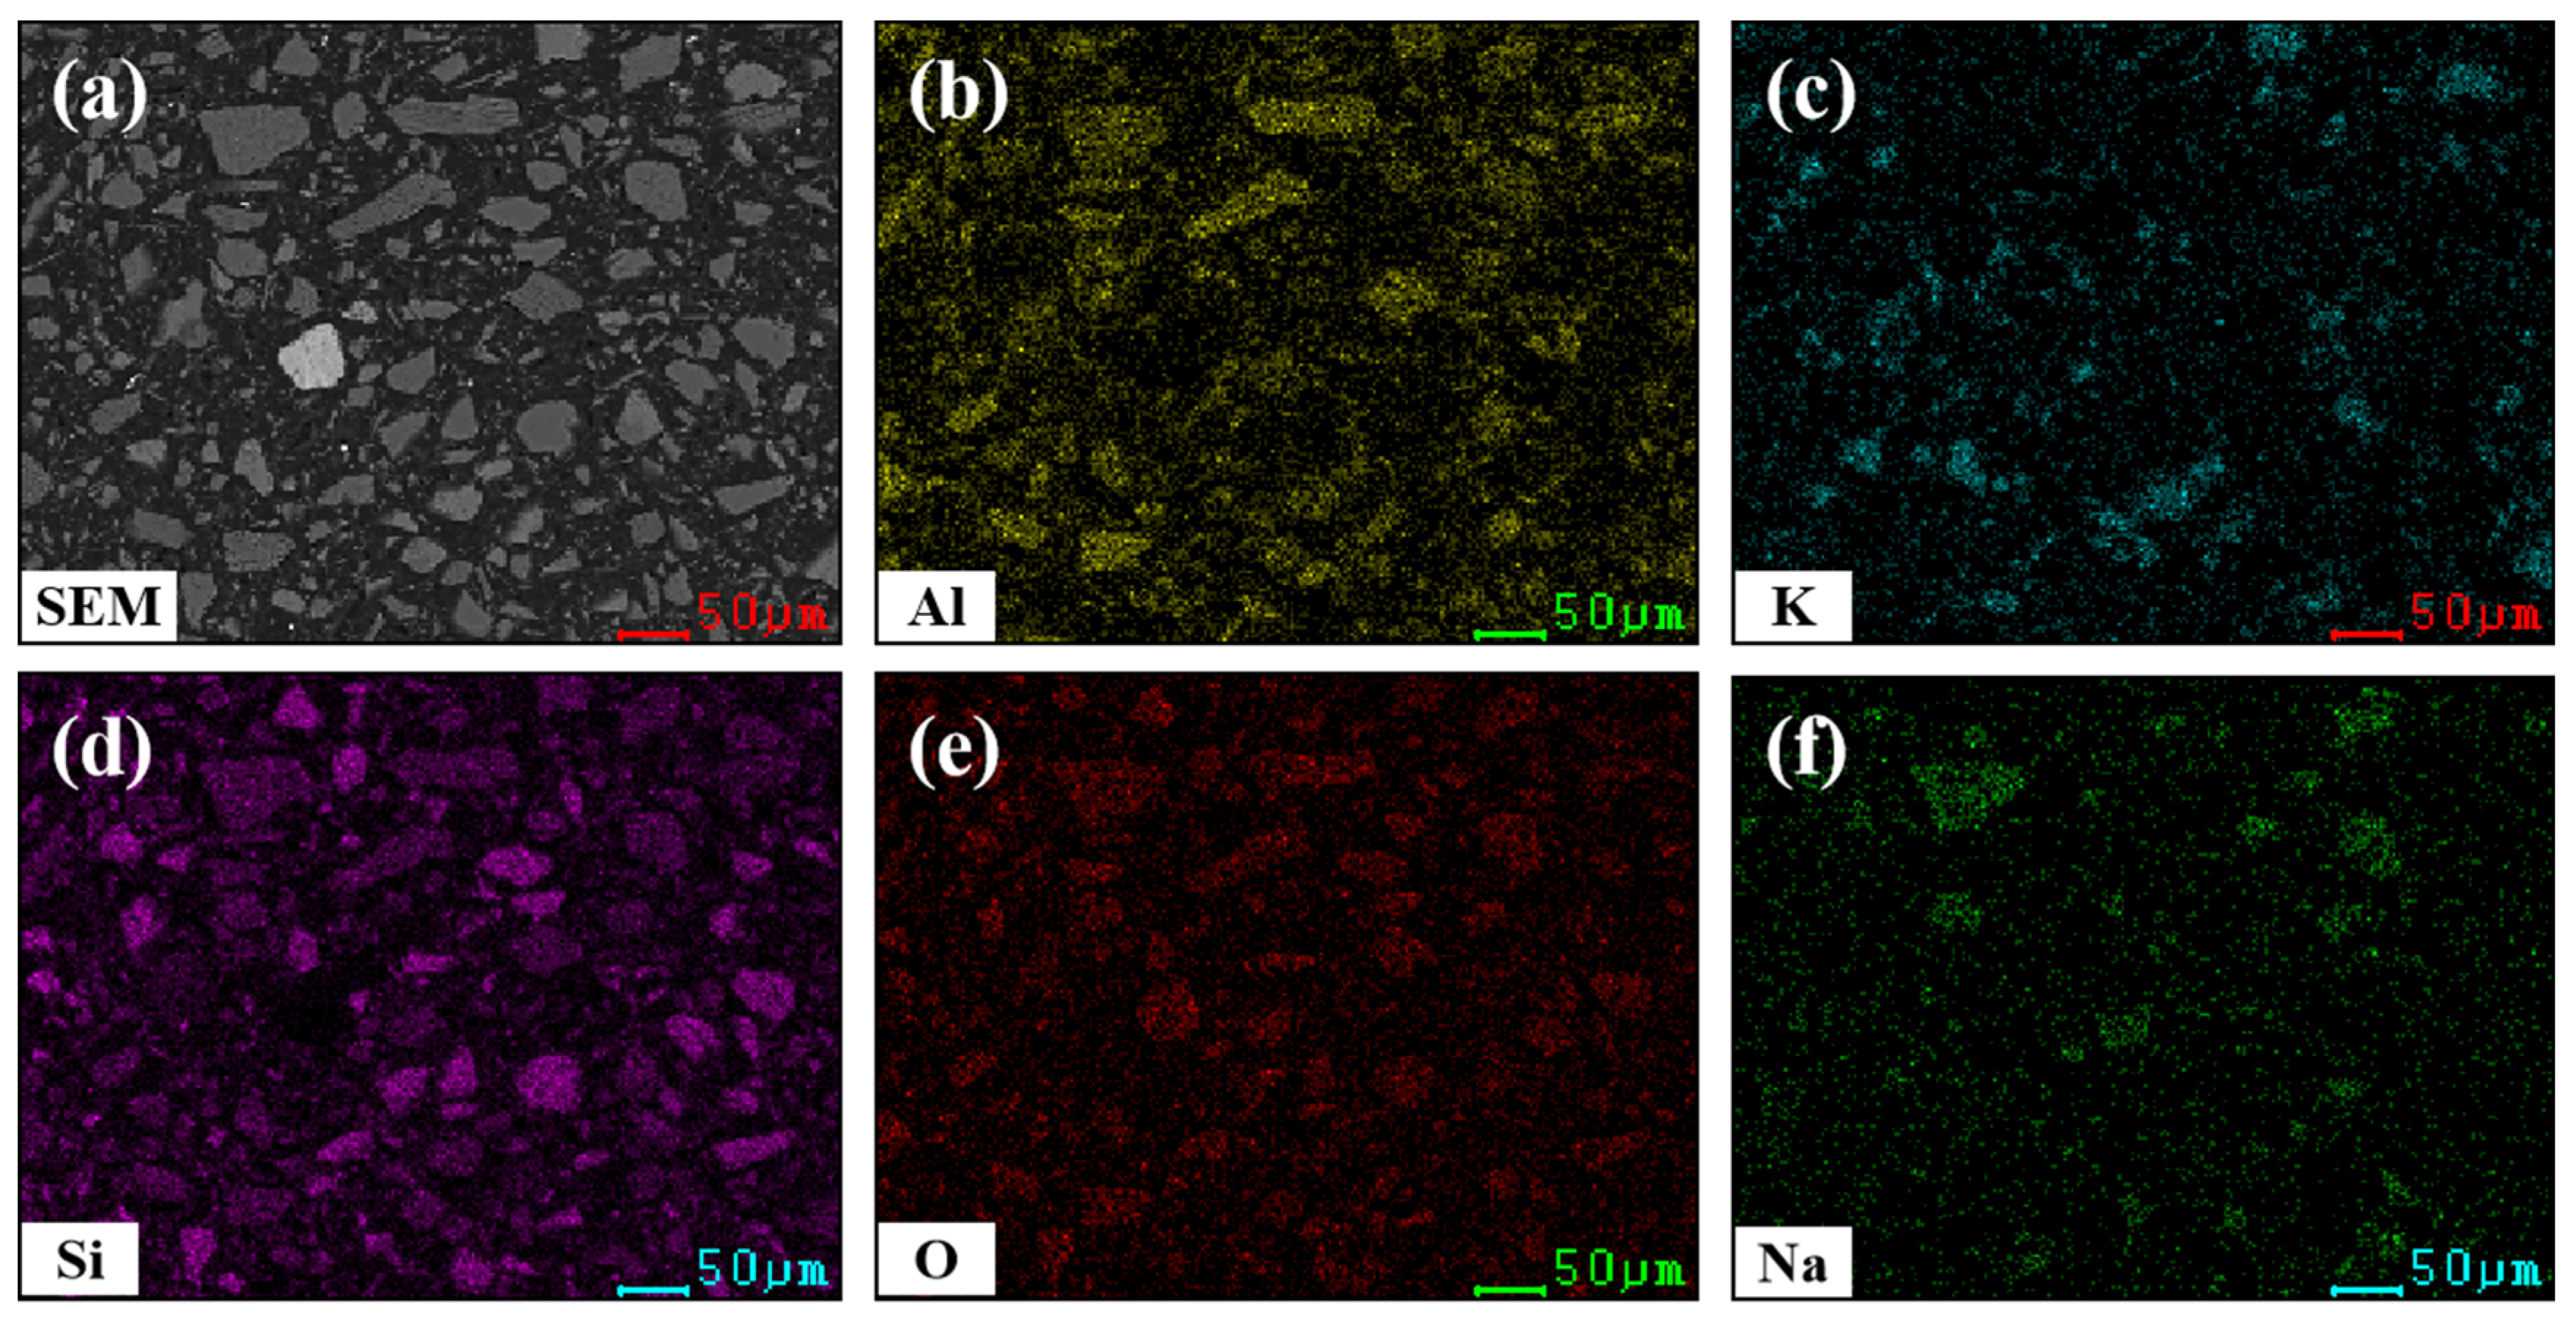
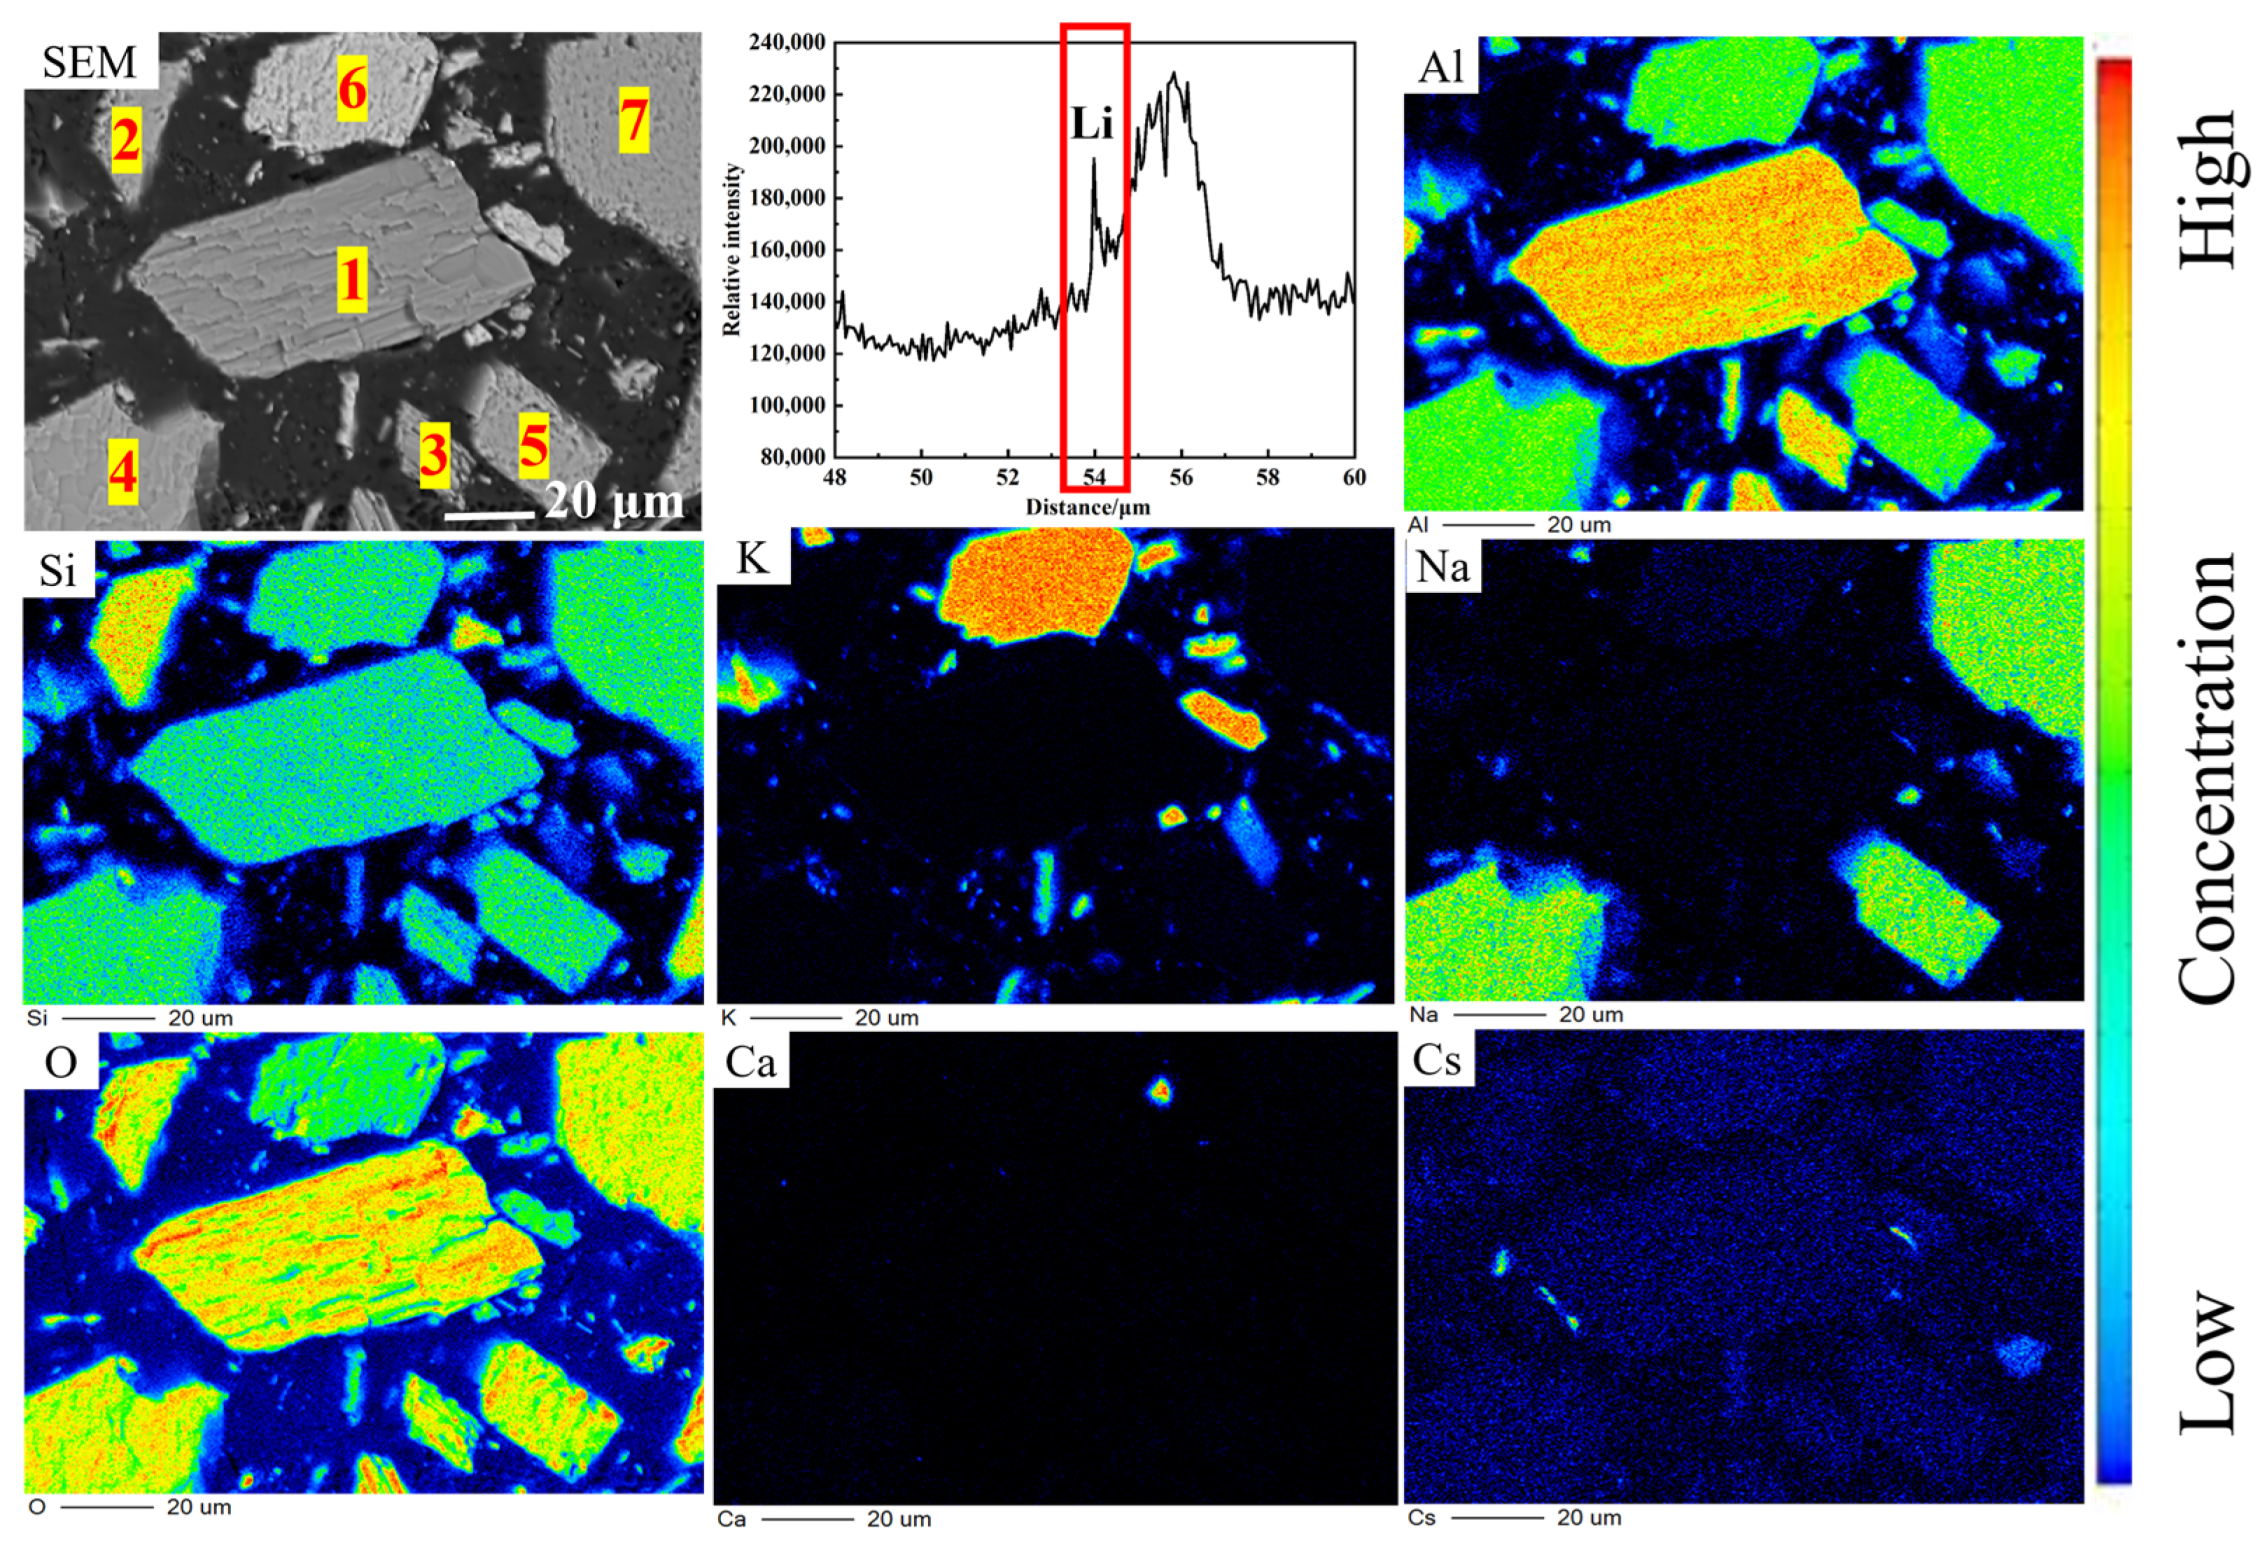
3.1.2. Microstructure of Lithium Ore

Figure 2 displays the microstructure and mapping images of lithium ore. The bulk of the particle morphology was lumpy and large layered. The occurrence state of Li cannot be determined in this part because the X-ray energy of Li is too low for the spectroscopy detector to detect. It can be seen from the EDS diagram that Si, O, and Al were relatively evenly distributed on the surface of each particle. Certain particles, which were thought to be quartz particles, had a high Si content but no Al. A few grains contained concentrated amounts of Na and K as well as Al and Si, which were thought to be potassium feldspar and albite, respectively.
The lithium ore was analyzed using EPMA at the point, line, and surface levels, as displayed in Figure 3. Table 2 shows the elemental composition of the marked points in Figure 3 (SEM). Si, Al, and O were evenly distributed on the surface of the sample, the silicon–aluminum ratio of points 1 and 3 was 2:1, and the sodium–potassium contents were low, which can be inferred as spodumene. The proportion of SiO2 in point 2 was 99.88 wt.%, which can be determined as quartz. The silicon–aluminum ratio of points 4 and 5 was about 2.5:1 and contained a small amount of sodium, which was presumed to be albite or mica. The ratio of silicon–aluminum–potassium at point 6 was 2:1:1, which can be inferred as orthoclase. The line analysis revealed a peak of the lithium signal in Figure 3, located at 54 μm. This suggests that the sample does contain lithium, which is consistent with the inference from points 1 and 3 above. In addition, the above analysis results were supported by EDS.
The above conclusions are only reasonable speculations based on the analysis of the types and contents of elements in the micro-region of raw materials. The important parameters, such as the specific material composition, composition quantification, and mineral particle size of the sample minerals, need to be tested by mineral liberation analysis.

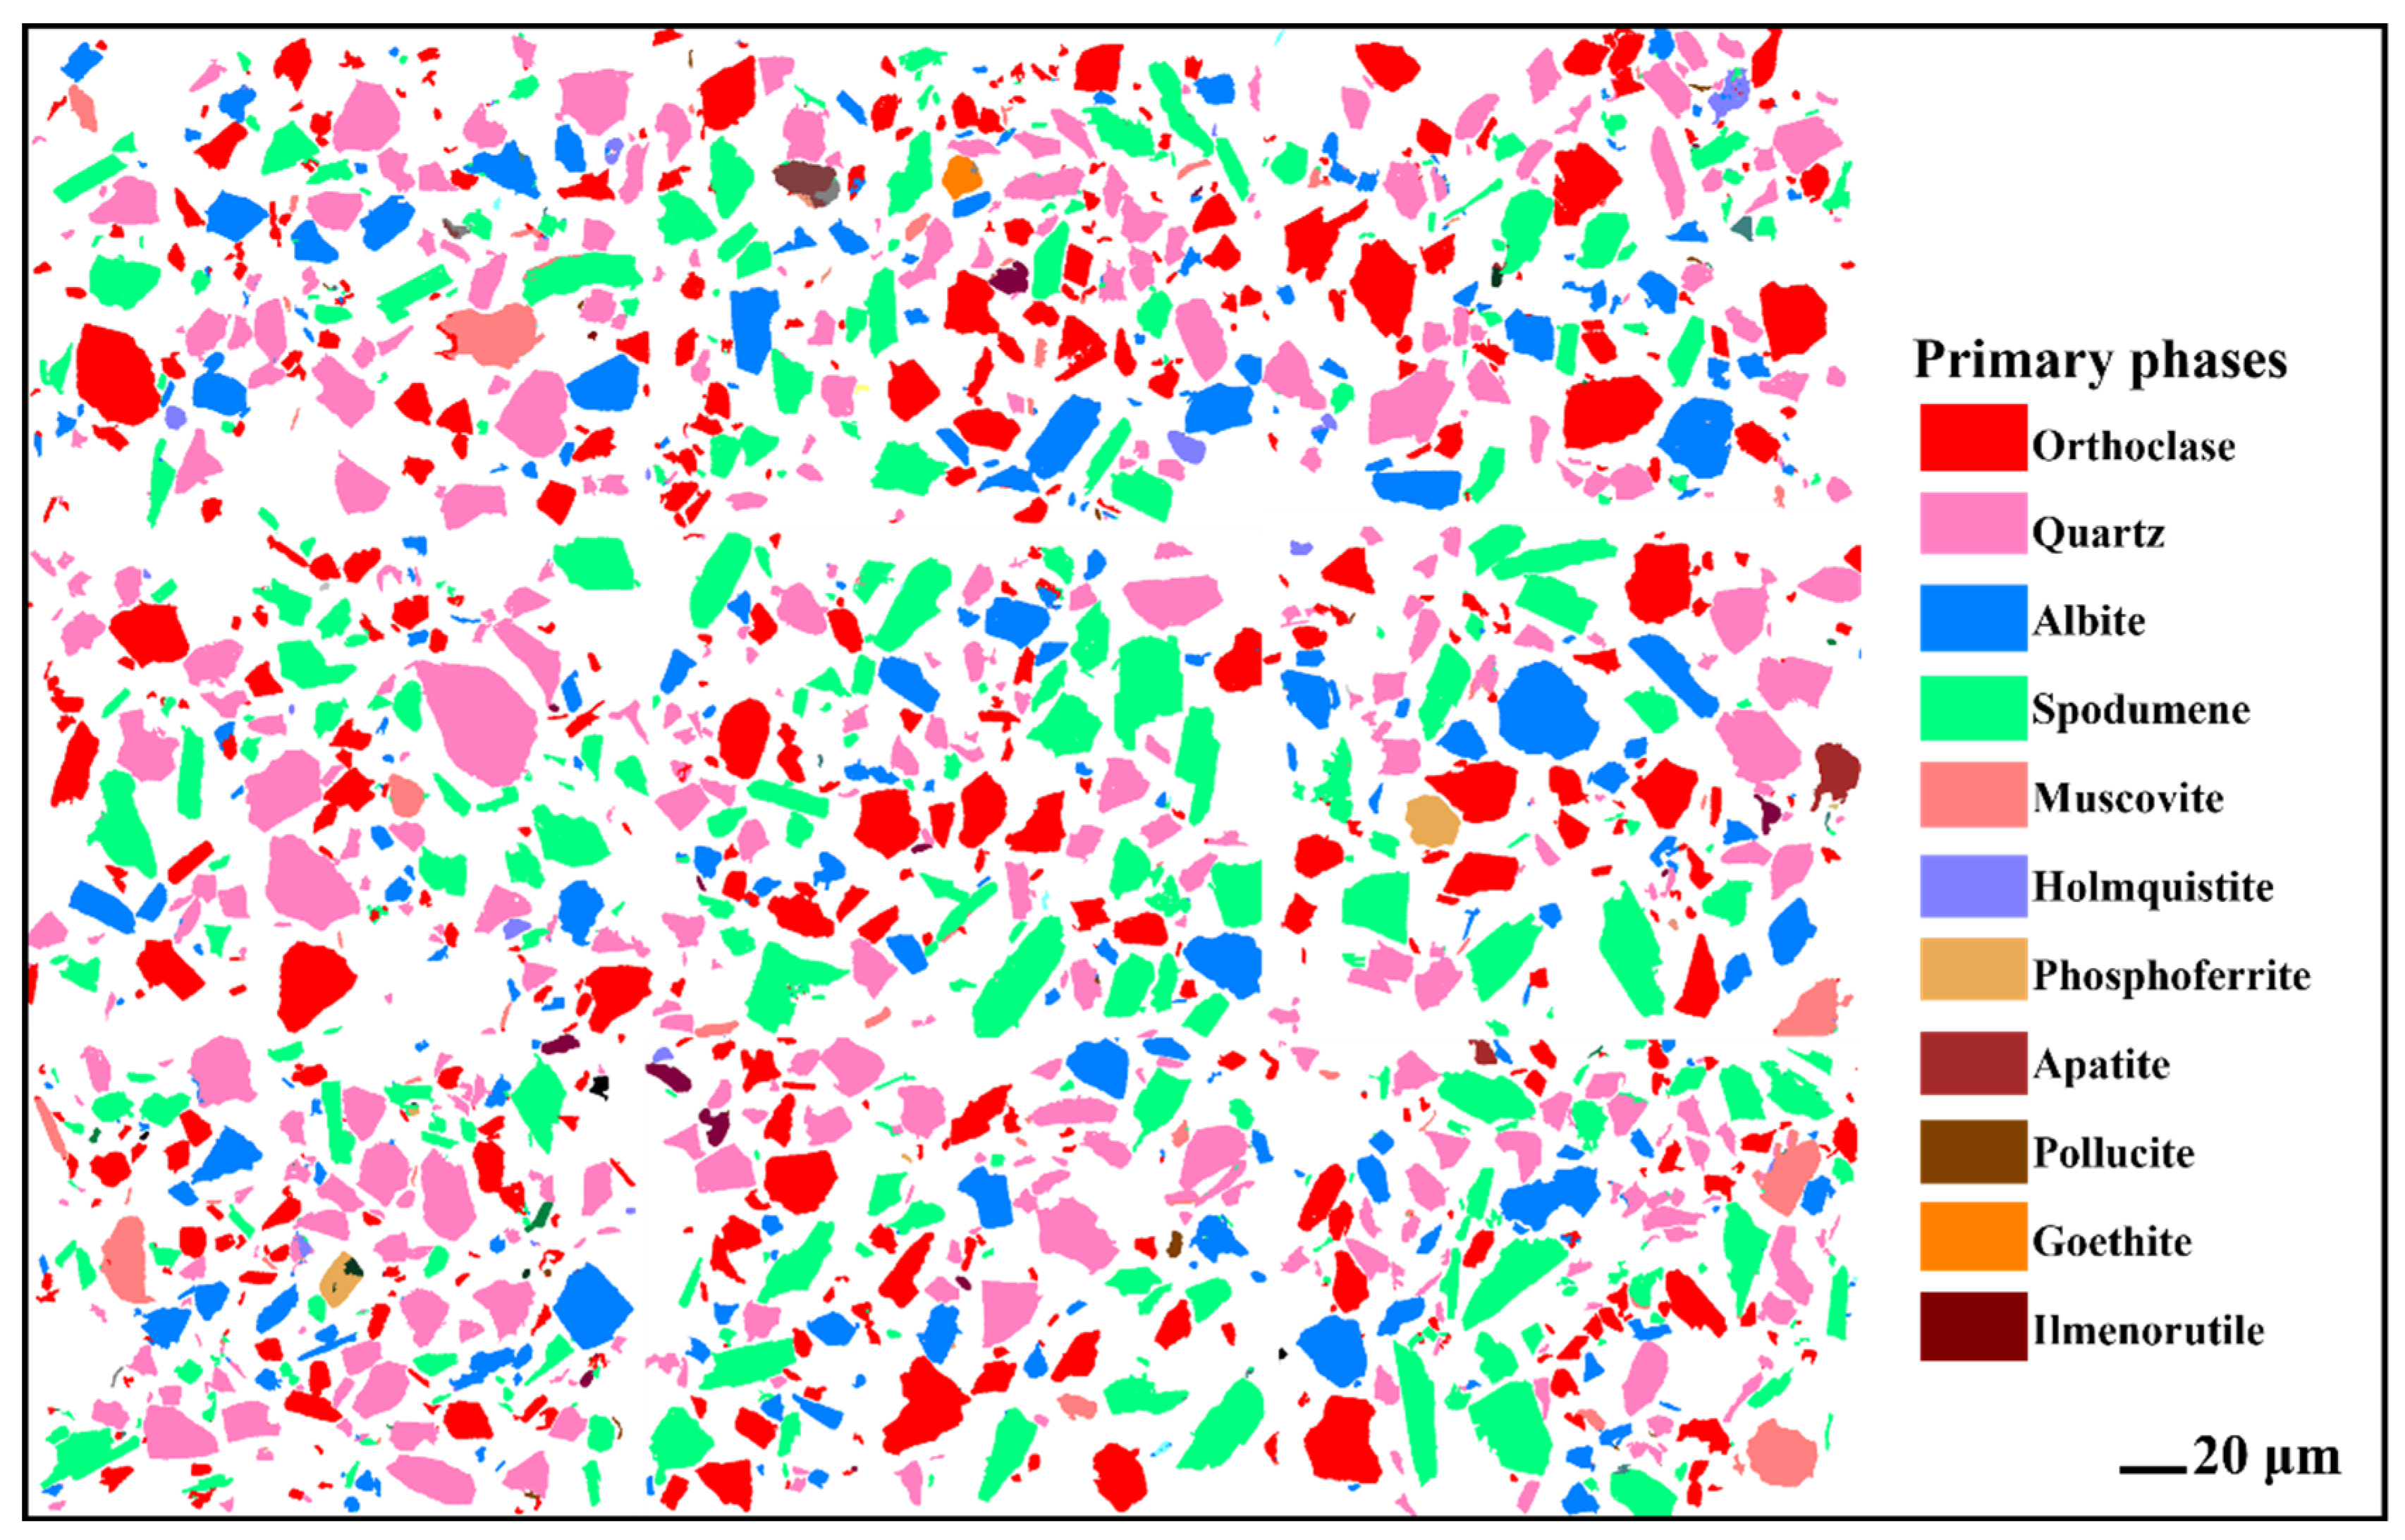
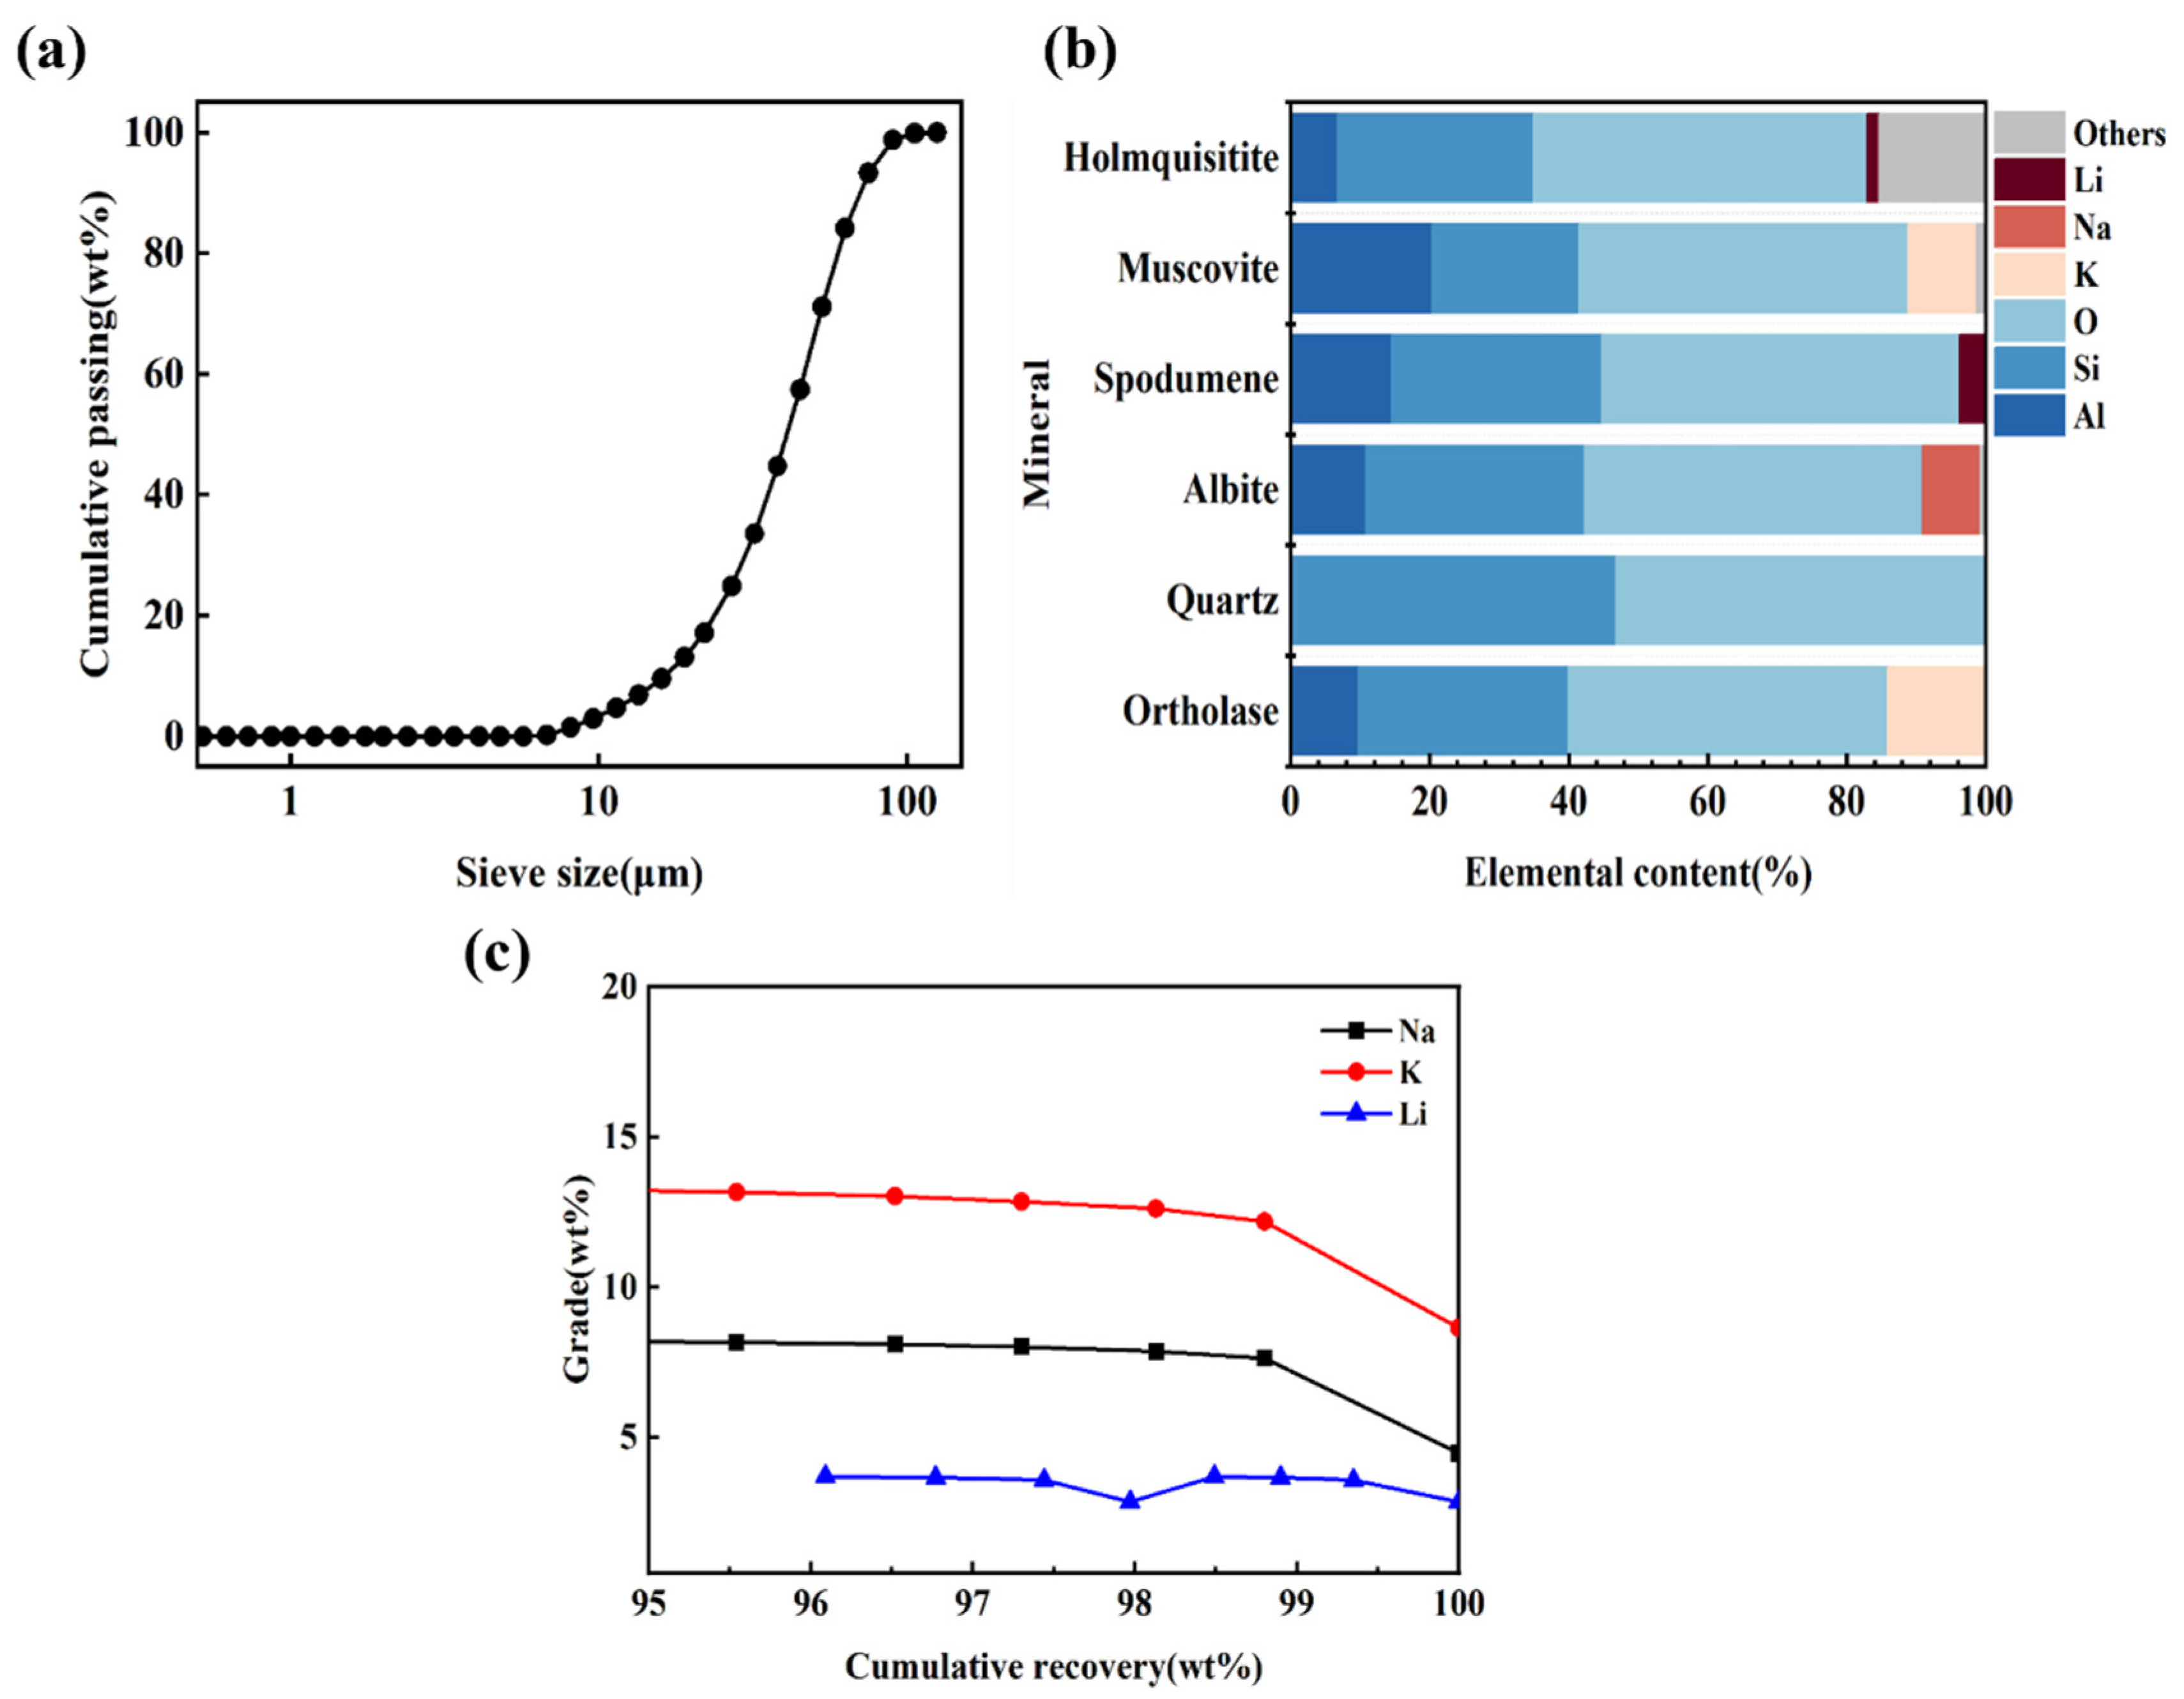
3.1.3. Mineral Liberation Analysis of Lithium Ore

The main minerals in lithium ore are shown in Table 3, along with their respective contents. The results were consistent with XRD, and quartz (28.97 wt.%), orthoclase (22.66 wt.%), albite (14.35 wt.%), and spodumene (29.85 wt.%) were the main minerals. The mineral liberation mapping of lithium ore was depicted in Figure 4, where it was observed that the four phases mentioned above were uniformly distributed, the individual particles were devoid of any mineral impurities, and no clear mineral paragenesis was present. The sample contained less than 0.1 wt.% of goethite, iron phosphataneous ore, amphibole, and other minerals. The mica content was low, which explained why the mica peak in the XRD was weak.
Figure 5 shows the MLA statistical data analysis of lithium ore, including the particle size distribution of lithium ore, elemental content of major mineral phases, and theoretical grade recovery curves of Li, Na, and K. The particle size analysis of raw ore is displayed in Figure 5a. The particle size was less than 125 μm, with approximately 94% of the particle being between 10–100 μm and the remaining 98% being above 100 μm. As can be seen from Figure 5b, the majority of the lithium element in the sample ore was derived from spodumene, accounting for 3.72% of spodumene and 1.74% of holmquisite. The raw ore had a lithium content of roughly 1.63%, which was comparable to the ICP results and indicated low-grade lithium ore. The sample only contained the mica phase, and it was impossible to confirm if lepidolite was present. A theoretical grade-recovery curve based on particle dissociation characteristics was shown in Figure 5c for Li, Na, and K, and the theoretical grade-recovery curve of ore is defined as the maximum expected recovery that can be achieved by physical separation of the mineral at a given grade [16]. The MLA test can only offer guidance because it overestimated the true release to some extent, so the experiment results were required to determine the precise value. The further to the right the curve was, the better the expected grade and recovery [33], and it was anticipated that over 96% of lithium grade recovered below 5% would be recovered.

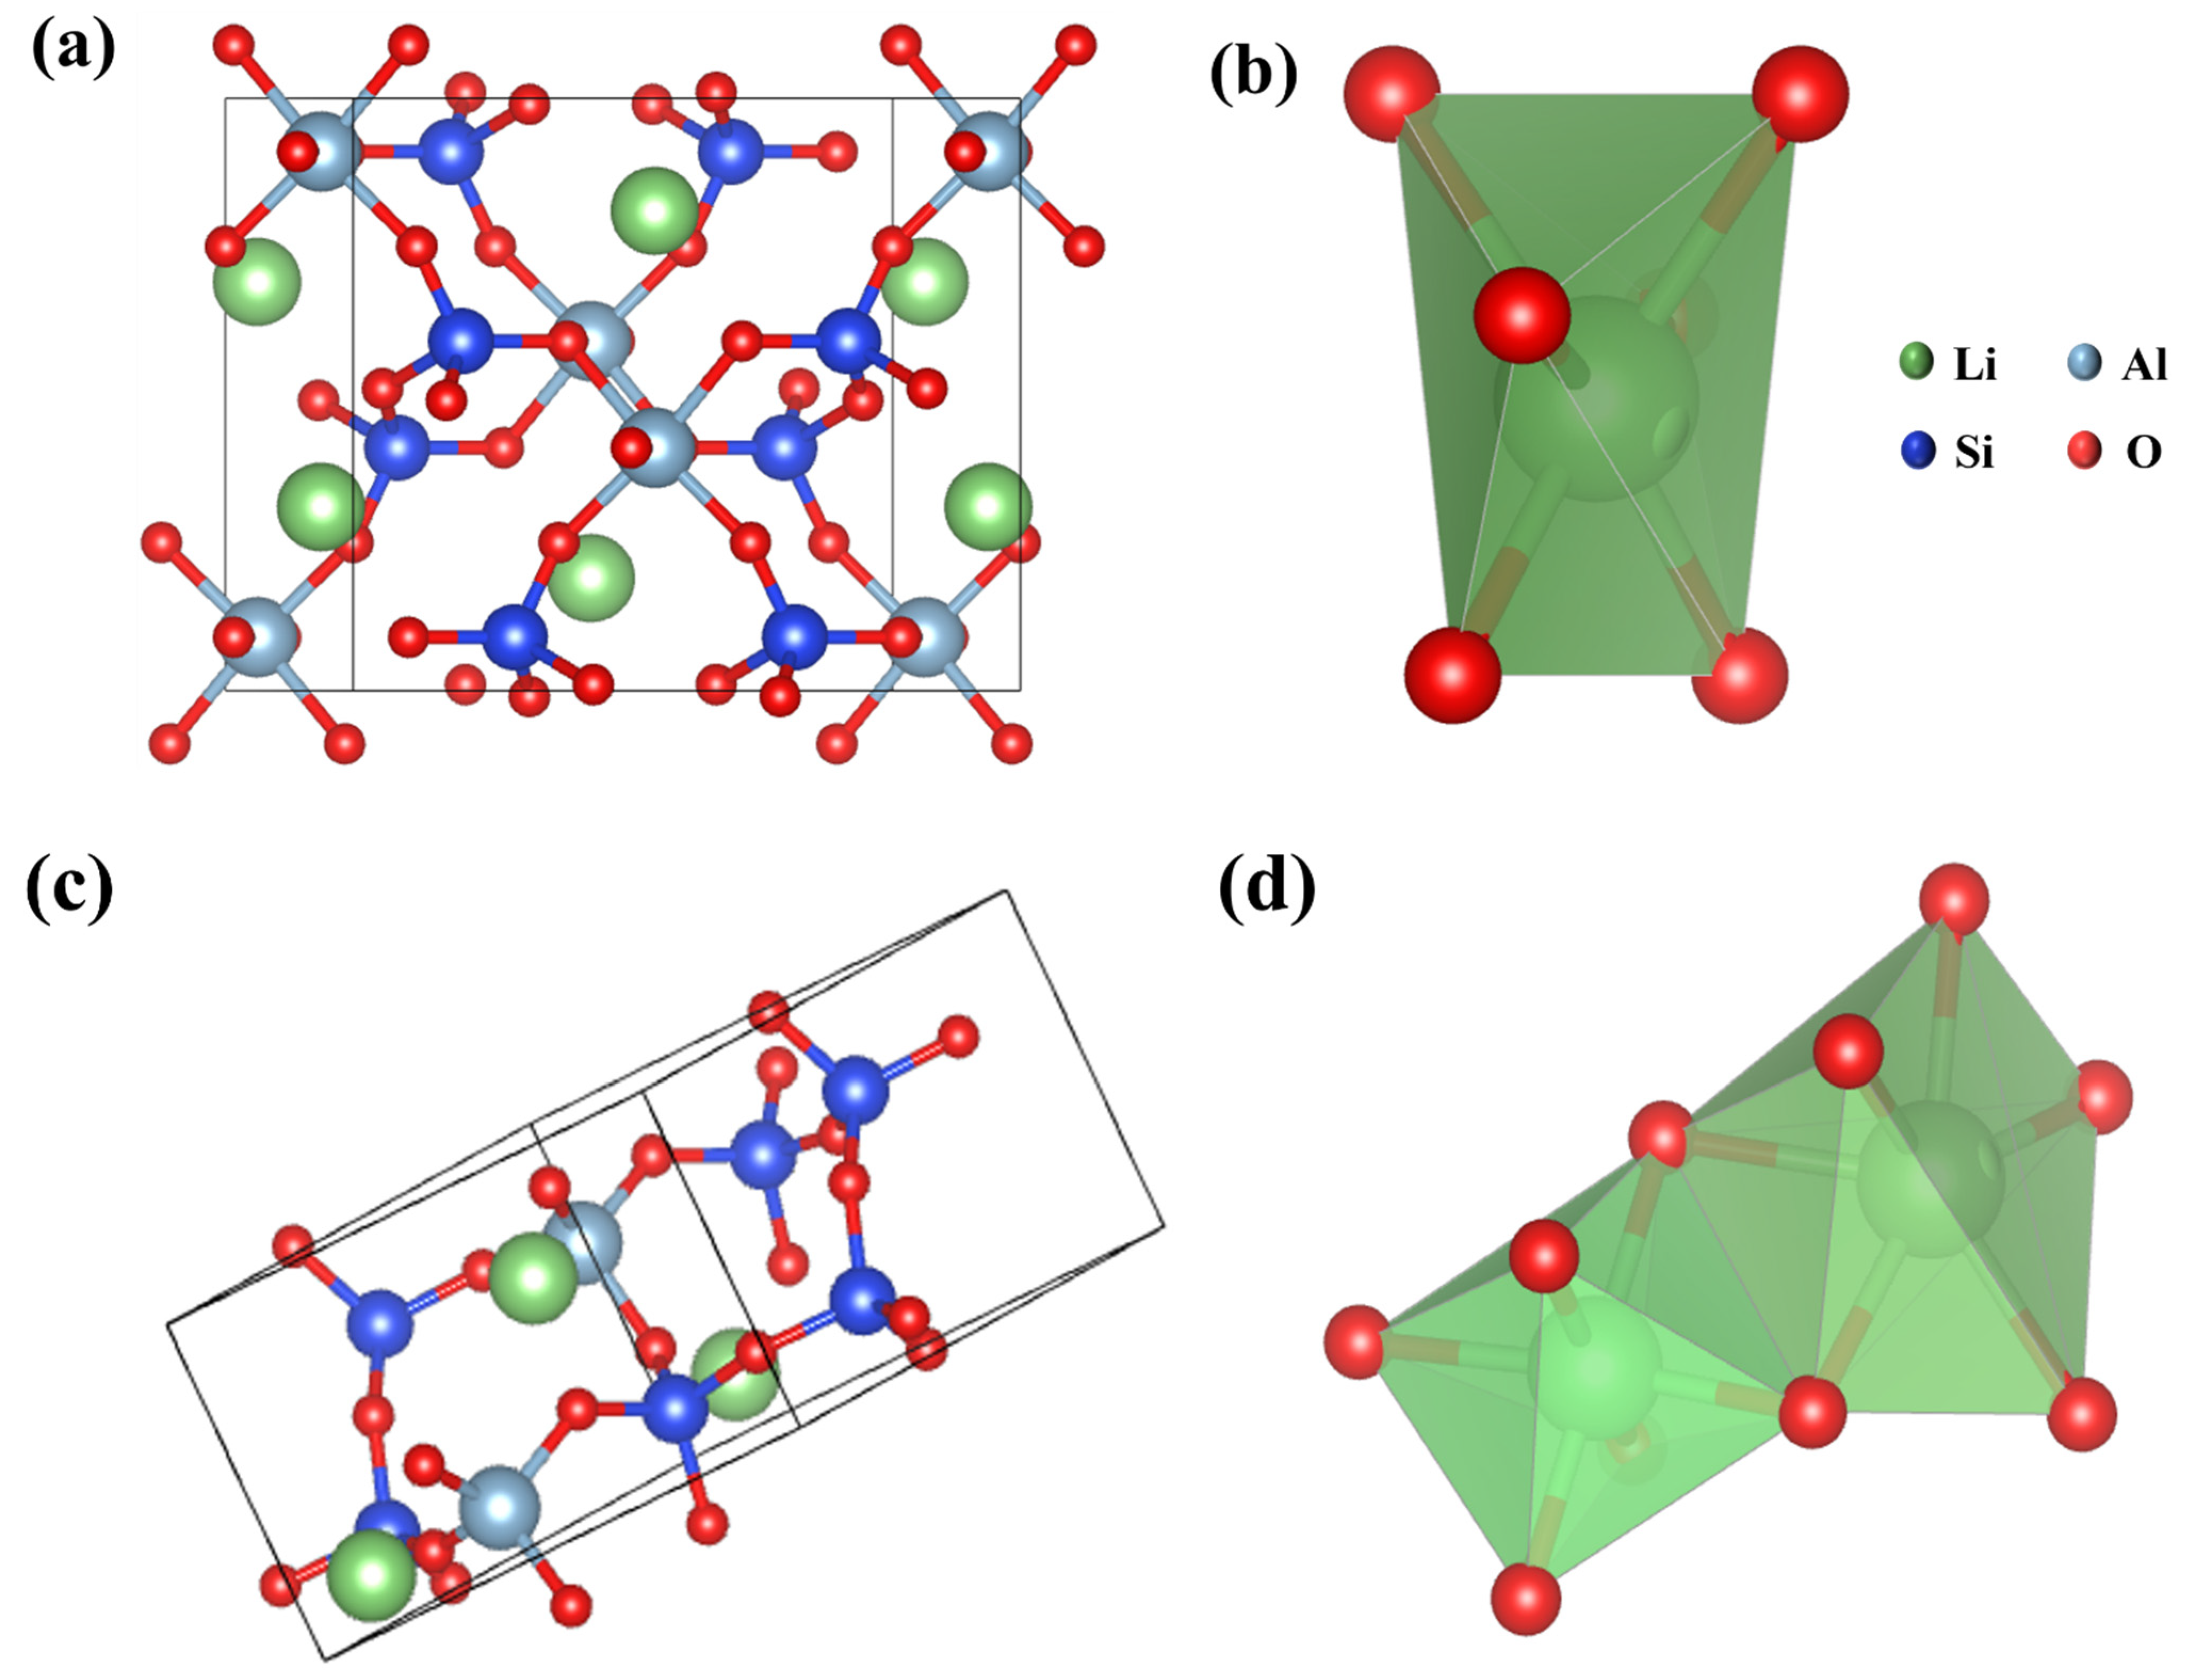
3.1.4. The Crystal Structure of Lithium Ore

The crystal structure microscopic models of α–LiAlSi2O6 and β–LiAlSi2O6 were shown in Figure 6, and the unit cell parameters of spodumene were calculated and analyzed by using Jade software, as shown in Table 4. The transformation roasting causes a change in the existence state of Li+ in its unit cell, and the unit cell volume of β–spodumene is significantly larger than that of α–spodumene. The octahedra of α–spodumene into unstable tetrahedra of β–spodumene, making it easier to extract Li+ from β–spodumene. As shown in Table 5, the Li–O bond length was 2.211 nm, the Si–O bond length was 1.598 nm, and the Al–O bond length was 2.028 nm. The Li–O covalent was the weakest, and the Li–O bond was the most easily broken in the spodumene structure.

3.2. Limestone Sintering Process

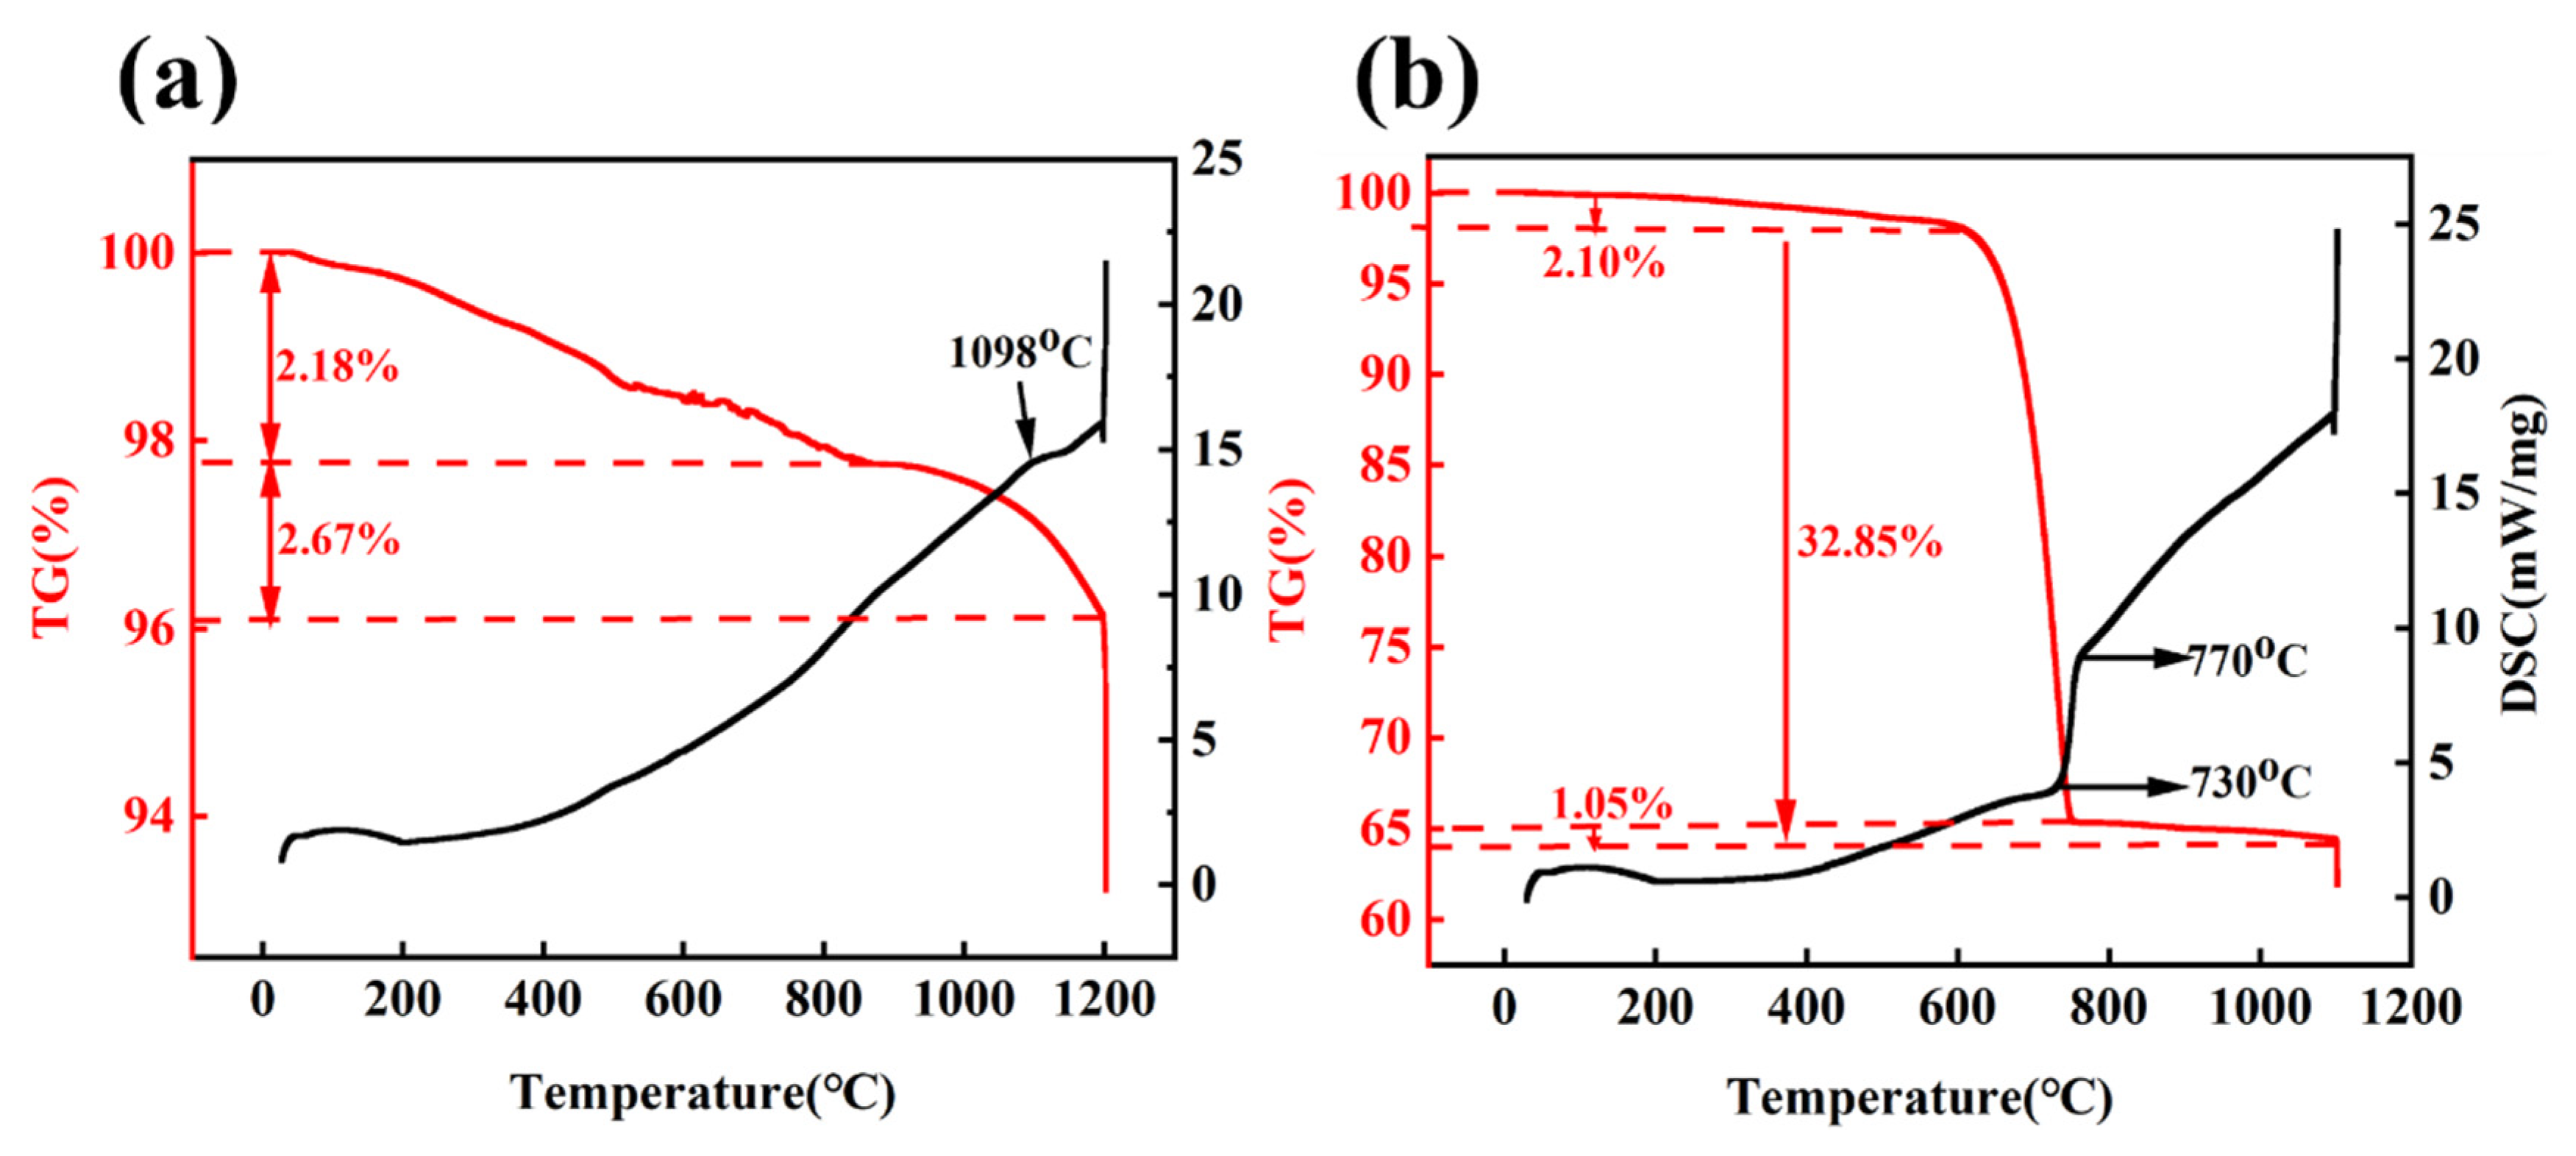
3.2.1. TG–DSC Analysis

Lithium ore was analyzed using TG–DSC, as shown in Figure 7a. When the temperature rose above 1200 °C, the lithium ore absorbed heat sharply while the weight stayed almost unchanged, indicating that the lithium ore was endothermic due to melting. The thermal behavior of lithium ore was shown by two weight loss steps. The first weight loss (2.18 wt.%) was attributed to the evaporation of adsorption water in the mineral. The second weight loss was between 800 and 1200 °C, which might be due to the evaporation of crystalline water in SiO2 and KAlSi3O8. The DSC curve had an endothermic peak near 1098 °C, which corresponded to the transformation of α–spodumene into β–spodumene. According to Figure 7b, the thermal behavior of lithium ore mixed with CaCO3 was shown by three weight loss steps. A weight loss of 2.10 wt% was found in the first stage, which was related to the removal of adsorption water; a significant weight loss of 32.85 wt% was found in the second stage, which was related to the CaCO3 decomposition process; and a weight loss of 1.05 wt% was found in the third stage, which was the evaporation of crystalline water. To ensure the sintering process fully reacted, the sintering temperature ranged from 800–1200 °C.

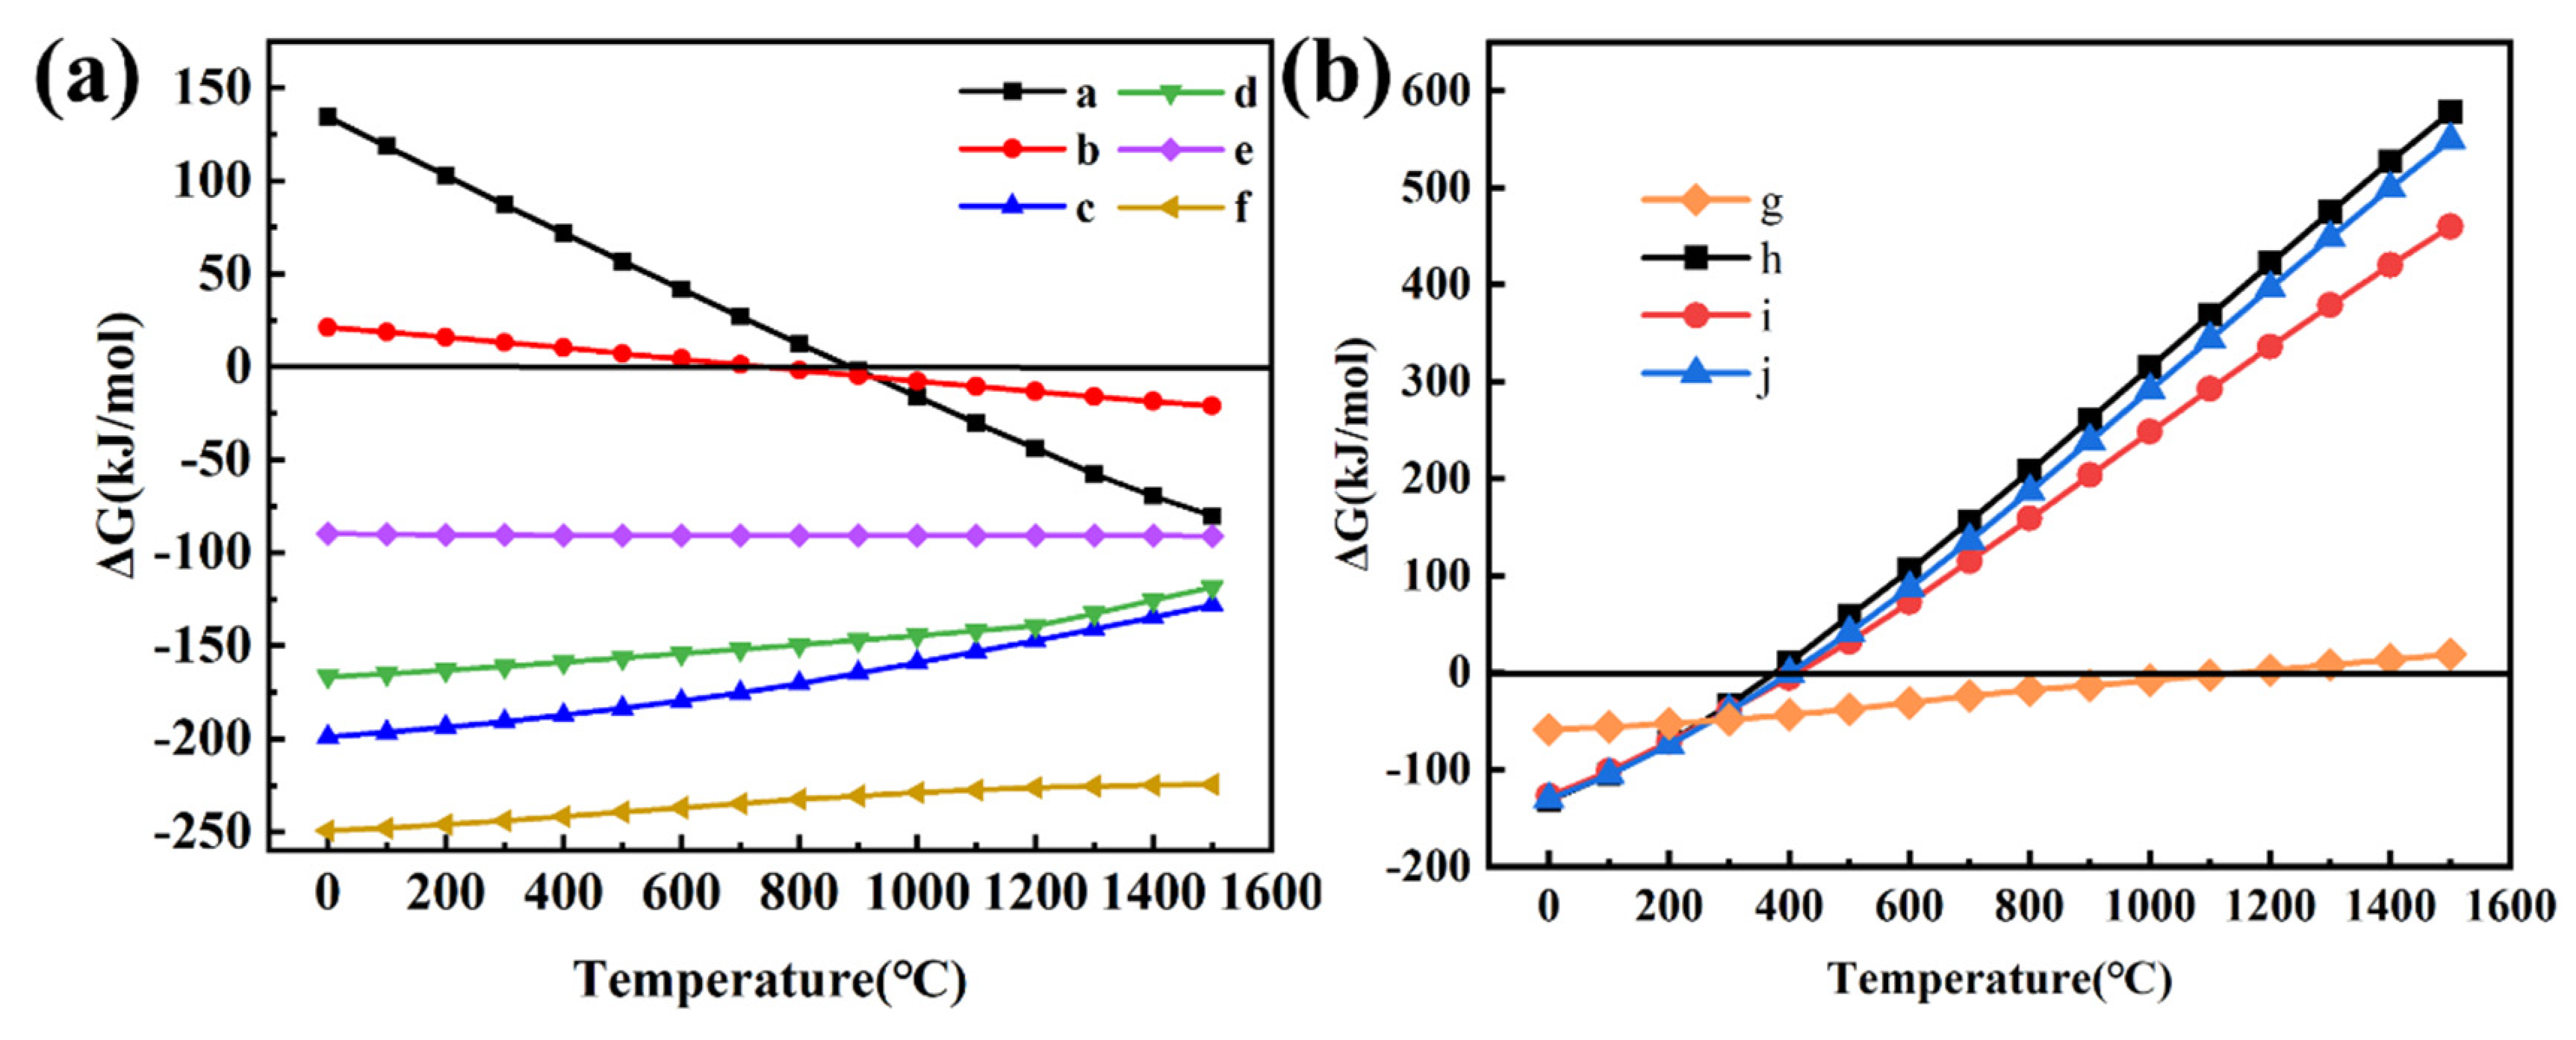
3.2.2. Thermodynamic Calculation

To determine the thermodynamic theoretical sequence and reaction trend of chemical reactions, the magnitude and positive and negative ΔGθT of each chemical reaction were calculated and compared. The main chemical reactions in the sintering and leaching process and the thermodynamic calculation of possible reactions are depicted in Table 6 and Figure 8, respectively. Reactions (a–f) displayed the primary chemical reactions that occur during the sintering process, while Figure 8a displays the computed outcomes. The correlation between T and ΔGθT in Figure 8a demonstrated that CaCO3 only began to break down at above 900 °C. Raising the temperature was beneficial for accelerating decomposition. The crystal form changed to β–spodumene when the temperature of α–spodumene exceeded 800 °C and the ΔGθT was negative. The temperature was too high and not favorable for the reaction, as indicated by increasing ΔGθT curves of lithium aluminosilicate and calcium oxide. At the same reaction temperature, ΔGθf < ΔGθc < ΔGθd < ΔGθe, indicating that the reaction of calcium oxide with lithium aluminosilicate was the most likely to occur. Reactions (g–j) describe the primary chemical reactions that occurred in the sintering process, while Figure 8b shows the calculated results. The ΔGθT values of LiAlO2, NaAlO2, and KAlO2 with Ca(OH)2 were extremely negative, so the leaching reaction easily occurred. It was demonstrated by thermodynamic calculations that the leaching reaction can occur at any temperature, while the sintering reaction must occur spontaneously at a high temperature. From a thermodynamic perspective, the limestone sintering and leaching process is, therefore, feasible.

3.2.3. Effects of Sintering Conditions on the Leaching Rate of Li

The sintering process is a key step in this study, and various parameters, including the ratio of ore and limestone, sintering temperature, and insulation time, have been studied and optimized. When the condition of sintering temperature of 1100 °C and holding time of 3 h, the effect of spodumene ore and limestone ratio on the leaching rate of lithium was examined in Figure 9a, and the XRD patterns of the sintered products were displayed in Figure 10a. When the ingredient ratio increased from 1:2 to 1:3, the reaction trend between CaO and LiAlSi2O6 was significant, and the leaching rate increased from 40.39% to 88.09%. When it exceeded 1:3, the leaching rate was slightly lower than the peak of 1:3. Combined with the XRD pattern of sintered products in Figure 10a, the diffraction peak of Ca2SiO4 was found in the clinker when the ingredient ratio was 1:2, and the peak of LiAlO2 was not fully formed, indicating that the reaction was insufficient because there was not enough CaO in the mixture. At a ratio of 1:2.5, the Ca2SiO4 peak rose, the weak CaO diffraction peak emerged, and the peak of LiAlO2 gradually structured. At a ratio of 1:3, the components showed a distinct peak for LiAlO2, a relatively stable peak height for Ca2SiO4, and an increase in the peak value of CaO. This suggested that CaO had broken down the structure of LiAlSi2O6, releasing Li+ and that there was an excess of CaO present in the sintered products. The peak height of Ca2SiO4 stayed constant, the peak value of CaO increased significantly, and the diffraction peak of LiAlO2 weakened when the ingredient ratio was between 1:3.5 and 1:4. These findings were in line with the experimental findings, indicating that an excess of CaO was not conducive to the fracture of Li+–O2− bond in the crystal lattice and the detachment of Li+.
When the condition that the ingredient ratio was 1:3 and the sintering time was 3 h, the effect of sintering temperature on the leaching rate of lithium was investigated in Figure 9b, and the XRD patterns of sintered products were shown in Figure 10b. The leaching rate rose dramatically from 13.07% to 88.09% with the sintering temperature increase of 1000 to 1100 °C, while the leaching rate decreased at 1200 °C. Combined with Figure 10b, it can be seen that the diffraction peak of LiAlO2 was not detected at 1000 and 1050 °C, which may be due to the incomplete transformation of α–spodumene. Its octahedral structure was difficult to destroy and Li+ cannot be released. From 1100 to 1200 °C, the peak value of LiAlO2 increased gradually, and the peak value of CaO decreased gradually. At 1200 °C, the peak of LiAlO2 was the most significant, and CaO reacted with LiAlSi2O6 to its fullest extent. However, the amount of Ca(OH)2 that must be produced during the leaching process was insufficient because of the material’s reduction in CaO. The leaching rate decreased at 1200 °C due to over-burning during the sintering process, high material hardness, and insufficient grinding and crushing.
When the ingredient ratio was 1:3, and the sintering temperature was 1100 °C, the effect of holding time on the leaching rate of lithium was investigated in Figure 9c, and the XRD patterns of sintered products were shown in Figure 10c. The leaching rate increased with the extension of holding time. When XRD analysis was combined with the short sintering time at 1–2.5 h, the reaction between CaO and LiAlSi2O6 was not fully combined, resulting in a low leaching rate. This was the reason the LiAlO2 diffraction peak only appeared when the sintering time was 3 h. Therefore, the ingredient ratio of 1:3, sintering temperature of 1100 °C, and sintering time of 3 h were selected as the sintering optimal conditions.
In the MLA analysis, it can be known that lithium-containing minerals may be contained within other minerals. Therefore, when the sample ore was crushed into different particle sizes, the degree of exposure to lithium-containing mineral particles was different. In this study, samples of 50, 100, 150, 200, 300, and 350 mesh were selected for the sintering–leaching test, and the results were as Figure 9d. It can be seen from Figure 9d that the influence of particle size on the leaching rate of Li was relatively significant. When the particle size was larger than 200 mesh, the leaching rate significantly increased. Further screening to a finer particle size, the leaching rate remained stability. When the particle size was 300 mesh, the leaching rate reached the highest value (90.04%).

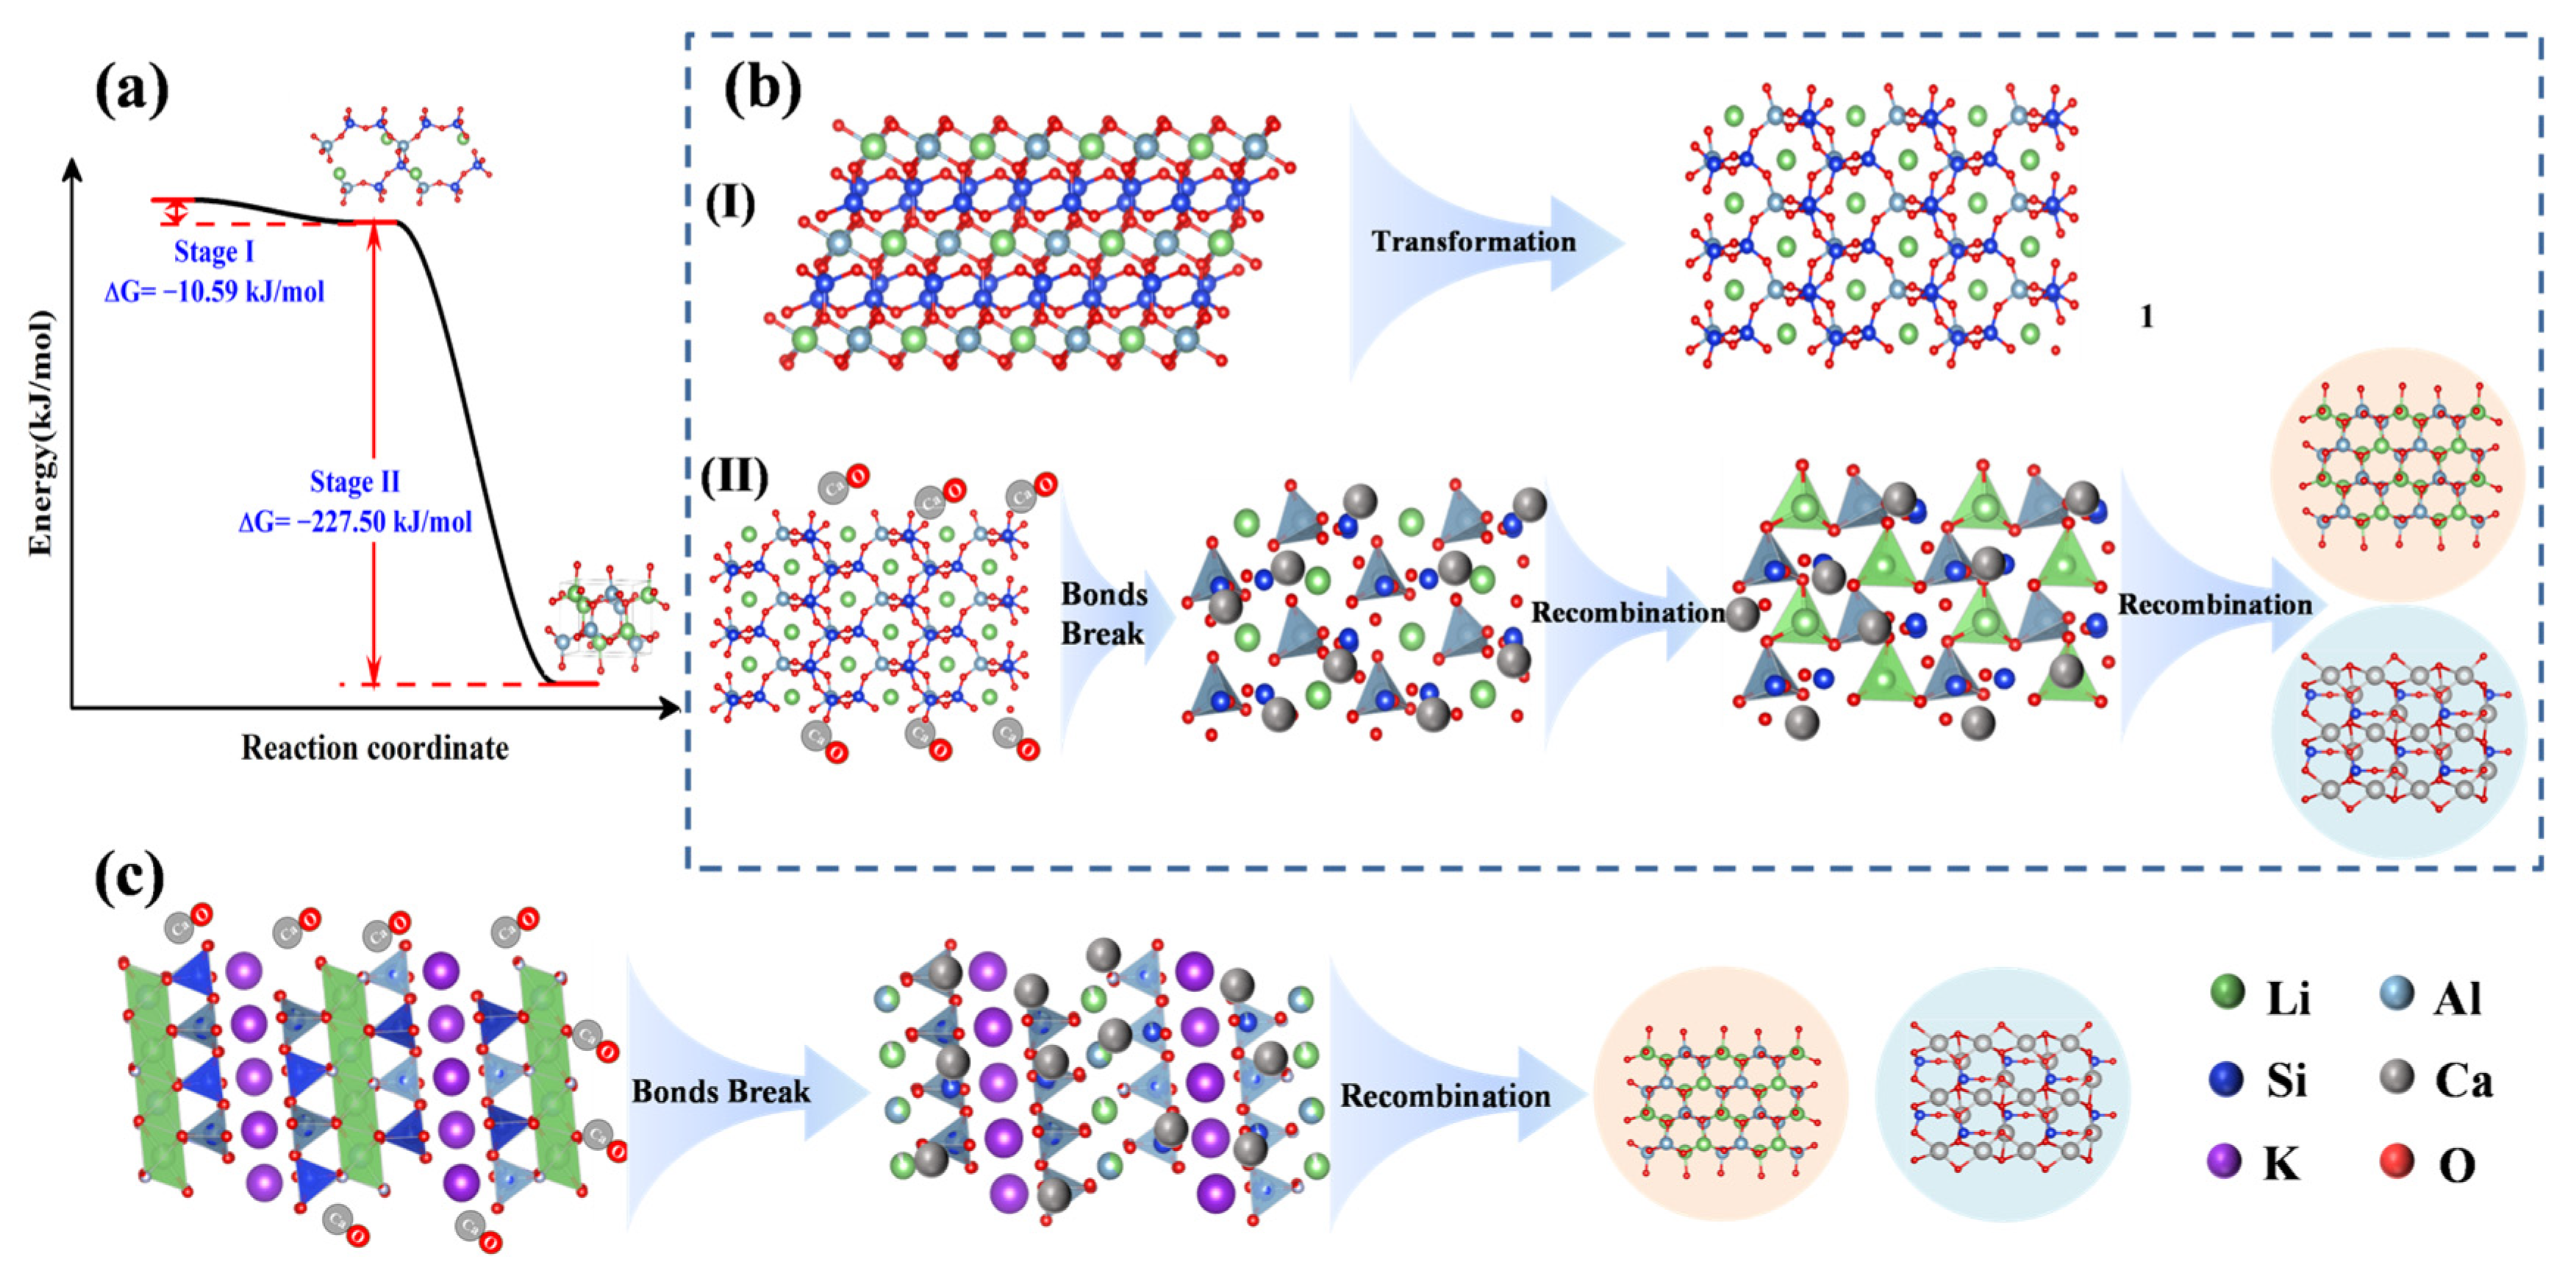
3.3. Mechanism of Sintering Process

The FTIR spectra of the raw material and the addition of CaO for 1–3 h are shown in Figure 11. The types and peaks of functional groups in the raw materials are shown in Table 7. At the roasting time of 1–3 h, the diffraction peaks of Si–O–Si and Si–O almost disappeared, indicating the cleavage of Si–O–Si and Si–O chemical bonds [34]. The diffraction peaks of Si–O–Al were still observable during roasting 1–3 h, but the intensity of 3 h was slightly weaker than that of 1 h, indicating that the internal structure of spodumene was gradually destroyed.
The XRD data were analyzed using jade software, and the crystal structure was mapped using VESTA. Figure 12a Stage I and Figure 12b I showed the transformation of α–spodumene into β–spodumene at 1100 °C; when ΔGθ1100°C = −10.59 kJ from the change of unit cell structure, it can be seen that the unit cell volume of β–spodumene expands, and its intracellular coordination polyhedron was smaller than that of α–spodumene so that Li+ had a larger range of activity in the unit cell and it was easier to separate. The bonds between O2− and Li+ in the [LiO6] octahedron in α–spodumene were stronger than that between O2− and Li+ in the [LiO4] octahedron in β–spodumene, so the binding of Li+ by oxygen ions was also weakened.
Figure 12a Stage II and Figure 12b II depicted the process of β–spodumene combining with CaO at 1100 °C, at this time ΔGθ1100 °C = −227.50 kJ. During the sintering process, high temperatures can activate CaO. The highly active Ca–O contacts spodumene, and the Si–O–Si and Si–O–Al chemical bonds gradually break, as shown as FTIR, releasing Li+ by destroying the structure of β–LiAlSi2O6. In this reaction, CaO continuously combined with Si–O on the surface of β–LiAlSi2O6 to CaSiO4, and Al–O was isolated and combined with Li, Na, and K to LiAlO2, NaAlO2, and KAlO2.
A small amount of lepidolite contributes to the extraction of lithium, even though it is not discussed as the primary chemical reaction in the raw lithium ore. As displayed in Figure 12c, lepidolite K{Li2−xAl1 + x[Al2xSi4−2xO10] (OH, F)2} (x = 0–0.5) was a TOT structure, in which the interlayer charge imbalance was caused by the substitution of part of Si4+ by Al3+ homogeneity. To fill the octahedral position in the crystal structure with Al3+ and Li+, the interlayer deficit charge must be balanced with alkali metal cations like Li+. CaCO3 recombined the Li–F and (Si, Al)–O by destroying the structure of lepidolite to form CaF2, CaO·SiO2, and LiO2·Al2O3.

3.4. Leaching Process

3.4.1. Effects of Leaching Conditions on the Leaching Rate of Li

After the sintering process, the particle size was 300 mesh, the fixed mechanical stirring speed of 400 r/min, the liquid–solid ratio range of pure water to sintering material was (2–6) mL:1 g, the leaching temperature range was 75–115 °C, and the time range was 1–5 h. By controlling a single variable, the optimal leaching conditions can be obtained. Under the leaching temperature of 95 °C and leaching time of 1 h, the effect of the liquid–solid ratio on the leaching rate of Li was investigated, and the results are shown in Figure 13a. Increasing the liquid–solid ratio can speed up the rate at which mass is transferred during the leaching process when viewed from a kinetic standpoint. When the amount of water was increased from 2 to 5 times that of the sintered products, the leaching rate did not change significantly. However, when it was increased to six times, the leaching rate increased from 88.09% to 90.16%. Although the leaching rate was only increased by 2%, the amount of water was increased four-fold, which had minimal financial gains. Therefore, a liquid–solid ratio of 2:1 was selected.
Under the liquid–solid ratio of 2:1 and leaching time of 1 h, the effect of leaching temperature on the leaching rate of Li was examined, and the results are displayed in Figure 13b. The leaching rate increased from 63.20% to 88.09% when the leaching temperature changed from 75 to 95 °C, and it slightly decreased when the temperature rose above 100 °C. According to thermodynamic theory, as temperature rises, more energy is gained by the reactants, which increases the number of activated molecules and the number of effective collisions between them. This increases the intensity of the reaction, amplifies the reaction effect, and accelerates the rate at which lithium leaches. The activated molecules in the reaction system reach saturation at a given temperature, and the reaction is not aided by a constant rise in temperature.
Under the 2:1 liquid–solid ratio and 95 °C leaching temperature, respectively, the effect of leaching time on the leaching rate of Li was studied, and the results are depicted in Figure 13c. When the leaching time was 1 h, the leaching rate of Li significantly increased. When it was longer than 1 h, the changes in the leaching rate were not significant, indicating that the leaching reaction had been finished at 1 h.
The XRD of the leaching residue under optimal conditions is shown in Figure 14. Analysis of the leaching residue shows the presence of Ca2SiO4, Ca(OH)2, and CaO·Al2O3·10H2O. However, the expected product 3CaO·Al2O3·6H2O was not detected, suggesting an incomplete reaction between Ca(OH)2 and LiAlO2 during the leaching process. The solubility of Ca(OH)2 decreased with increasing temperature. In the experiment, we adopted the method of hot filtering, and the unreacted Ca(OH)2 was left in the form of precipitation in the filter residue.
In practical applications, the waste residue of calcium aluminosilicate generated in this study has a certain economic value. This is among the factors that make the procedure more environmentally friendly and energy-efficient than alternative approaches [35,36,37]. Higher strength and durability are found in calcium aluminosilicate, which is also less expensive. Nowadays, building materials, the food industry, and other industrial domains employ calcium aluminosilicate in a multitude of ways. It is frequently used to make cement, ceramic tiles, food additives, gastric medications, etc. Therefore, one of the study’s future objectives is to increase the rate at which waste residue is utilized while lowering environmental pressure.

3.4.2. Leaching Kinetics

In general, reactions between solid and liquid involve the transfer of various substances between the two phases, mainly including mass transfer in the liquid boundary layer (Equation (2)), chemical reactions on the surface (Equation (3)), and diffusion in the solid surface layer (Equation (4)) [38,39,40]. Usually, for a kinetic study, the solid material is spherical, and the particle size distribution needs to be narrow. However, after sintering and grinding, the particles were finer and could not achieve a narrow particle size distribution. Moreover, there were many impurities in the raw materials, and the reactions during the leaching process were complex, resulting in the low correlation coefficients for these models. As a result, Sharp’s method (Equation (5)) was set as the fitting model [41,42]. According to Figure 15a, the leaching rates of Li+ were investigated at various reaction temperatures (55–100 °C) and leaching times (1–180 min) under the conditions of liquid/solid (L/S) = 2:1 and a stirring speed of 400 r/min. It can be seen that the leaching reaction was concentrated within 60 min, indicating that this stage was the key for kinetic analysis.
x = k t
1 1 x 1 3 = k C 0 ρ r 0 t = k r t
1 2 3 x 1 x 2 3 = 2 D C 0 r 0 2 α ρ t = k d t
l n 1 x = k e t n
where x is the leaching rate (%), k, kr, kd, and ke represents the reaction rate constant (min−1), t is leaching time (min), ρ is the density, r0 stands for the initial diameter, and D represents the diffusion coefficient. The constant n depends on the type of leaching reaction: when constant n is close to 1, the leaching reaction is controlled by surface chemical reactions. When parameter n is less than 0.5, the reaction is diffusion-controlled, and when n lies between 0.5 and 1, the reaction is controlled by both surface chemical reactions and diffusion processes.
Equation (5) can be transformed. Substituting x and t to obtain the constant n, as shown in the Figure 15b. Thus, the leaching kinetic Equation of activation time of 60 min was determined:
l n 1 x = k t 0.66
The value of n (n = 0.66) proves that the leaching reaction was controlled by both surface chemical reactions and diffusion processes.
To calculate the apparent activation energy (Ea) of the leaching process, fitting lines of −ln(1 – x) with time at different temperatures were plotted according to Equation (5). Calculating the values of k at different temperatures according to Figure 15c and using the Arrhenius equation (Equation (7)) to calculate Ea.
k = k 0 e E a R T
where k is the overall kinetic/rate constant, k0 is the frequency factor, Ea is the apparent activation energy (kJ/mol), R is the gas constant (8.314 J/(mol·K)), and T is the operating temperature (K) in this study.
Arrhenius plot for the leaching process was shown in Figure 15d, the activation energy during the leaching process was 27.18 kJ/mol.
Therefore, the leaching process was controlled by both surface chemical reactions and diffusion processes. The related kinetic Equation was −ln(1 − x) = kt0.66, and Ea was 27.18 kJ/mol.

4. Conclusions

The lithium ore sintering process is a short process, clean and efficient lithium extraction method. The material composition and occurrence state of lithium in low-grade mixed lithium ore were determined in this study, indicating that the minerals were primarily composed of quartz, orthoclase, albite, and spodumene with a minor amount of lepidolite. With a particle size of less than 125 μm, there was very little paragenesis between minerals. During the sintering process, under the ore and limestone ratio of 1:3, sample particle size of 300 mesh, sintering temperature of 1100 °C, and sintering time of 3 h, the leaching rate of Li reached 90.04%. The structurally stable spodumene undergoes crystal transformation and is combined with quicklime produced by the decomposition of limestone. The highly active Ca–O destroyed the structure of LiAlSi2O6 and released Li+. The Ca–O continuously combined with Si–O on the surface of β–spodumene to form CaSiO4, while the Al–O was isolated and combined with Li, Na, and K to form LiAlO2, NaAlO2, and KAlO2, respectively. In the leaching process, the liquid-solid ratio of 2:1, leaching temperature of 95 °C, and leaching time of 1 h were selected as the optimal conditions. The leaching process was controlled by both surface chemical reactions and diffusion processes, and Ea was 27.18 kJ/mol. In future work, it is necessary to further strengthen the extraction of lithium from the leaching solution and increase the utilization pathways of sodium and potassium. Meanwhile, it is important to improve the resource utilization of tailings after lithium extraction and reduce environmental pressure.

Author Contributions

Methodology, L.M.; software, W.F.; resources, J.Q.; data curation, W.F.; writing—original draft preparation, W.F.; writing—review and editing, L.M. and J.Q.; visualization, W.F.; supervision, L.M. and J.Q.; funding acquisition, L.M. and J.Q. All authors have read and agreed to the published version of the manuscript.

Funding

This work was financially supported by the National Natural Science Foundation of China (No. 52004264).

Data Availability Statement

The data presented in this study are available on request from the corresponding author due to privacy.

Conflicts of Interest

The authors declare no conflict of interest.

References

  1. Christmann, P.; Gloaguen, E.; Labbé, J.-F.; Melleton, J.; Piantone, P. Global Lithium Resources and Sustainability Issues. In Lithium Process Chemistry; Elsevier: Amsterdam, The Netherlands, 2015; pp. 1–40. ISBN 978-0-12-801417-2. [Google Scholar]
  2. Dessemond, C.; Lajoie-Leroux, F.; Soucy, G.; Laroche, N.; Magnan, J.-F. Spodumene: The Lithium Market, Resources and Processes. Minerals 2019, 9, 334. [Google Scholar] [CrossRef]
  3. Martin, G.; Rentsch, L.; Höck, M.; Bertau, M. Lithium Market Research–Global Supply, Future Demand and Price Development. Energy Storage Mater. 2017, 6, 171–179. [Google Scholar] [CrossRef]
  4. Han, S.; Zhenghao, M.; Meilin, L.; Xiaohui, Y.; Xiaoxue, W. Global Supply Sustainability Assessment of Critical Metals for Clean Energy Technology. Resour. Policy 2023, 85, 103994. [Google Scholar] [CrossRef]
  5. Xu, C.; Dai, Q.; Gaines, L.; Hu, M.; Tukker, A.; Steubing, B. Future Material Demand for Automotive Lithium-Based Batteries. Commun. Mater. 2020, 1, 99. [Google Scholar] [CrossRef]
  6. Li, X.; Mo, Y.; Qing, W.; Shao, S.; Tang, C.Y.; Li, J. Membrane-Based Technologies for Lithium Recovery from Water Lithium Resources: A Review. J. Membr. Sci. 2019, 591, 117317. [Google Scholar] [CrossRef]
  7. Choubey, P.K.; Kim, M.; Srivastava, R.R.; Lee, J.; Lee, J.-Y. Advance Review on the Exploitation of the Prominent Energy-Storage Element: Lithium. Part I: From Mineral and Brine Resources. Miner. Eng. 2016, 89, 119–137. [Google Scholar] [CrossRef]
  8. Averill, W.A.; Olson, D.L. A review of extractive processes for lithium from ores and brines. In Lithium Needs and Resources; Elsevier: Amsterdam, The Netherlands, 1978; pp. 305–313. ISBN 978-0-08-022733-7. [Google Scholar]
  9. Hu, Y.; Su, H.; Zhu, Z.; Qi, T.; Pang, Q. Environmentally Benign Techniques of Lithium Extraction from Salt Lakes: A Review. Environ. Chem. Lett. 2024, 22, 105–120. [Google Scholar] [CrossRef]
  10. Xiang, W.; Liang, S.; Zhou, Z.; Qin, W.; Fei, W. Lithium Recovery from Salt Lake Brine by Counter-Current Extraction Using Tributyl Phosphate/FeCl3 in Methyl Isobutyl Ketone. Hydrometallurgy 2017, 171, 27–32. [Google Scholar] [CrossRef]
  11. Liu, Y.; Ma, B.; Lü, Y.; Wang, C.; Chen, Y. A Review of Lithium Extraction from Natural Resources. Int. J. Miner. Metall. Mater. 2023, 30, 209–224. [Google Scholar] [CrossRef]
  12. Sun, X.; Luo, H.; Dai, S. Ionic Liquids-Based Extraction: A Promising Strategy for the Advanced Nuclear Fuel Cycle. Chem. Rev. 2012, 112, 2100–2128. [Google Scholar] [CrossRef]
  13. Mudring, A.; Tang, S. Ionic Liquids for Lanthanide and Actinide Chemistry. Eur. J. Inorg. Chem. 2010, 2010, 2569–2581. [Google Scholar] [CrossRef]
  14. Shi, C.; Jia, Y.; Zhang, C.; Liu, H.; Jing, Y. Extraction of Lithium from Salt Lake Brine Using Room Temperature Ionic Liquid in Tributyl Phosphate. Fusion Eng. Des. 2015, 90, 1–6. [Google Scholar] [CrossRef]
  15. Su, H.; Li, Z.; Zhang, J.; Zhu, Z.; Wang, L.; Qi, T. Recovery of Lithium from Salt Lake Brine Using a Mixed Ternary Solvent Extraction System Consisting of TBP, FeCl3 and P507. Hydrometallurgy 2020, 197, 105487. [Google Scholar] [CrossRef]
  16. Xie, R.; Zhao, Z.; Tong, X.; Xie, X.; Song, Q.; Fan, P. Review of the Research on the Development and Utilization of Clay-Type Lithium Resources. Particuology 2024, 87, 46–53. [Google Scholar] [CrossRef]
  17. Zhang, Y.; Ma, B.; Lv, Y.; Wang, C.; Chen, Y. An Effective Method for Directly Extracting Lithium from α-Spodumene by Activated Roasting and Sulfuric Acid Leaching. J. Ind. Eng. Chem. 2023, 122, 540–550. [Google Scholar] [CrossRef]
  18. Rioyo, J.; Tuset, S.; Grau, R. Lithium Extraction from Spodumene by the Traditional Sulfuric Acid Process: A Review. Miner. Process. Extr. Metall. Rev. 2022, 43, 97–106. [Google Scholar] [CrossRef]
  19. Han, S.; Sagzhanov, D.; Pan, J.; Vaziri Hassas, B.; Rezaee, M.; Akbari, H.; Mensah-Biney, R. Direct Extraction of Lithium from α-Spodumene by Salt Roasting–Leaching Process. ACS Sustain. Chem. Eng. 2022, 10, 13495–13504. [Google Scholar] [CrossRef]
  20. Song, Y.; Zhao, T.; He, L.; Zhao, Z.; Liu, X. A Promising Approach for Directly Extracting Lithium from α-Spodumene by Alkaline Digestion and Precipitation as Phosphate. Hydrometallurgy 2019, 189, 105141. [Google Scholar] [CrossRef]
  21. Wu, X.; Zeng, L.; Wu, S.; Qing, J.; Li, Q.; Cao, Z.; Wang, M.; Zhang, G.; Guan, W. Eco-Friendly Extraction of Arsenic and Tungsten from Hazardous Tungsten Residue Waste by Pressure Oxidation Leaching in Alkaline Solutions: Mechanism and Kinetic Model. J. Environ. Manag. 2023, 325, 116586. [Google Scholar] [CrossRef]
  22. Xiang, J.; Huang, Q.; Lv, X.; Bai, C. Extraction of Vanadium from Converter Slag by Two-Step Sulfuric Acid Leaching Process. J. Clean. Prod. 2018, 170, 1089–1101. [Google Scholar] [CrossRef]
  23. Zhu, Y.; Zhang, D.; Qiu, S.; Liu, C.; Yu, J. Lithium Recovery from Pretreated α -spodumene Residue through Acid Leaching at Ambient Temperature. Can. J. Chem. Eng. 2023, 101, 4360–4373. [Google Scholar] [CrossRef]
  24. Gao, L.; Wang, H.; Li, J.; Wang, M. Recovery of Lithium from Lepidolite by Sulfuric Acid and Separation of Al/Li by Nanofiltration. Minerals 2020, 10, 981. [Google Scholar] [CrossRef]
  25. Zhang, X.; Tan, X.; Li, C.; Yi, Y.; Liu, W.; Zhang, L. Energy-Efficient and Simultaneous Extraction of Lithium, Rubidium and Cesium from Lepidolite Concentrate via Sulfuric Acid Baking and Water Leaching. Hydrometallurgy 2019, 185, 244–249. [Google Scholar] [CrossRef]
  26. Su, H.; Ju, J.; Zhang, J.; Yi, A.; Lei, Z.; Wang, L.; Zhu, Z.; Qi, T. Lithium Recovery from Lepidolite Roasted with Potassium Compounds. Miner. Eng. 2020, 145, 106087. [Google Scholar] [CrossRef]
  27. Mulwanda, J.; Senanayake, G.; Oskierski, H.; Altarawneh, M.; Dlugogorski, B.Z. Leaching of Lepidolite and Recovery of Lithium Hydroxide from Purified Alkaline Pressure Leach Liquor by Phosphate Precipitation and Lime Addition. Hydrometallurgy 2021, 201, 105538. [Google Scholar] [CrossRef]
  28. Nazir, M.K.; Dyer, L.; Tadesse, B.; Albijanic, B.; Kashif, N. Lithium Deportment by Size of a Calcined Spodumene Ore. Sci. Rep. 2022, 12, 18335. [Google Scholar] [CrossRef]
  29. Rosales, G.D.; Resentera, A.C.J.; Wuilloud, R.G.; Rodriguez, M.H.; Esquivel, M.R. Optimization of Combined Mechanical Activation-Leaching Parameters of Low-Grade α-Spodumene/NaF Mixture Using Response Surface Methodology. Miner. Eng. 2022, 184, 107633. [Google Scholar] [CrossRef]
  30. Wang, J.-M.; Hou, K.-S.; Yang, L.; Liu, X.-C.; Wang, R.-C.; Li, G.-M.; Fu, J.-G.; Hu, F.-Y.; Tian, Y.-L.; Wu, F.-Y. Mineralogy, Petrology and P-T Conditions of the Spodumene Pegmatites and Surrounding Meta-Sediments in Lhozhag, Eastern Himalaya. Lithos 2023, 456–457, 107295. [Google Scholar] [CrossRef]
  31. Roy, T.; Plante, B.; Benzaazoua, M.; Demers, I. Geochemistry and Mineralogy of a Spodumene-Pegmatite Lithium Ore at Various Mineral Beneficiation Stages. Miner. Eng. 2023, 202, 108312. [Google Scholar] [CrossRef]
  32. Han, P.; Zhao, F.; Liu, D.; Zhang, Q.; Zhang, Q.; Ullah, S. Occurrence and Favorable Enrichment Environment of Lithium in Gaoping Coal Measures: Evidence from Mineralogy and Geochemistry. Appl. Sci. 2024, 14, 7298. [Google Scholar] [CrossRef]
  33. Aylmore, M.G.; Merigot, K.; Rickard, W.D.A.; Evans, N.J.; McDonald, B.J.; Catovic, E.; Spitalny, P. Assessment of a Spodumene Ore by Advanced Analytical and Mass Spectrometry Techniques to Determine Its Amenability to Processing for the Extraction of Lithium. Miner. Eng. 2018, 119, 137–148. [Google Scholar] [CrossRef]
  34. Chen, H.; Zhang, L.; Pan, J.; He, X.; Shi, S.; Long, X.; Yang, Y.; Zhao, X.; Zhou, C. Study on Modes of Occurrence and Selective Leaching of Lithium in Coal Gangue via Grinding-Thermal Activation. Chem. Eng. J. 2024, 482, 148941. [Google Scholar] [CrossRef]
  35. Lajoie-Leroux, F.; Dessemond, C.; Soucy, G.; Laroche, N.; Magnan, J.-F. Impact of the Impurities on Lithium Extraction from β-Spodumene in the Sulfuric Acid Process. Miner. Eng. 2018, 129, 1–8. [Google Scholar] [CrossRef]
  36. Vuković, F.; Garcia, N.A.; Perera, S.; Turchi, M.; Andersson, M.P.; Solvang, M.; Raiteri, P.; Walsh, T.R. Atomistic Simulations of Calcium Aluminosilicate Interfaced with Liquid Water. J. Chem. Phys. 2023, 159, 104704. [Google Scholar] [CrossRef] [PubMed]
  37. Zheng, H.; Duan, Y.; Li, M.; Hou, D.; Wang, P.; Chen, J.; Li, S. Reaction Molecular Dynamics Study of Calcium Alumino-Silicate Hydrate Gel in the Hydration Deposition Process at the Calcium Silicate Hydrate Interface: The Influence of Al/Si. J. Build. Eng. 2024, 86, 108823. [Google Scholar] [CrossRef]
  38. Cao, R.; Jia, Z.; Zhang, Z.; Zhang, Y.; Banthia, N. Leaching Kinetics and Reactivity Evaluation of Ferronickel Slag in Alkaline Conditions. Cem. Concr. Res. 2020, 137, 106202. [Google Scholar] [CrossRef]
  39. Sethurajan, M.; Huguenot, D.; Jain, R.; Lens, P.N.L.; Horn, H.A.; Figueiredo, L.H.A.; Van Hullebusch, E.D. Leaching and Selective Zinc Recovery from Acidic Leachates of Zinc Metallurgical Leach Residues. J. Hazard. Mater. 2017, 324, 71–82. [Google Scholar] [CrossRef]
  40. Ning, Y.; Zhang, Y.; Zhu, B.; Wei, G.; Wang, Q.; Qu, J. Reducing the Environmental Impact of Lithium-Ion Battery Recycling through Co-Processing of NCM and LFP. Process Saf. Environ. Prot. 2024, 187, 810–819. [Google Scholar] [CrossRef]
  41. Sharp, J.H.; Brindley, G.W.; Achar, B.N.N. Numerical Data for Some Commonly Used Solid State Reaction Equations. J. Am. Ceram. Soc. 1966, 49, 379–382. [Google Scholar] [CrossRef]
  42. Wang, X. Effect of Mechanical Activation on the Leaching Kinetics of Niobium-Bearing Mineralisation in KOH Hydrothermal System. Hydrometallurgy 2018, 181, 123–129. [Google Scholar] [CrossRef]
Figure 1. XRD pattern of lithium ore.
Metals 14 01075 g001
Figure 2. Microstructure and mapping images of lithium ore ((a) SEM of lithium ore; (bf) distribution of Al, K, Si, O, and Na in the SEM of lithium ore, respectively).
Metals 14 01075 g002
Figure 3. Electron probe X-ray micro-analyzer of lithium ore.
Metals 14 01075 g003
Figure 4. Mineral liberation mapping of lithium ore.
Metals 14 01075 g004
Figure 5. MLA statistical data analysis ((a) the lithium ore particle diameter; (b) the elemental content of major mineral phases; (c) theoretical grade recovery curves of Li, Na, and K).
Metals 14 01075 g005
Figure 6. The crystal structure microscopic model of α–LiAlSi2O6 and β–LiAlSi2O6. (a) the crystal structure microscopic model of α–LiAlSi2O6; (b) the unit cell structure model of α–LiAlSi2O6; (c) the crystal structure microscopic model of β–LiAlSi2O6; (d) the unit cell structure model of β–LiAlSi2O6.
Metals 14 01075 g006
Figure 7. TG and DSC curves ((a) TG and DSC curves of lithium ore; (b) TG and DSC curves of lithium ore mixed CaCO3).
Metals 14 01075 g007
Figure 8. Thermodynamic calculation of possible reactions in Table 6 ((a) reactions in the sintering process; (b) reactions in the leaching process).
Metals 14 01075 g008
Figure 9. Effects of various variables on the leaching rate of Li ((a) ratio of ore and limestone; (b) temperature; (c) holding time; (d) particle size).
Metals 14 01075 g009
Figure 10. XRD patterns of sintered products at different conditions ((a) ratio of ore and limestone; (b) temperature; (c) holding time).
Metals 14 01075 g010
Figure 11. FTIR spectra at different roasting times.
Metals 14 01075 g011
Figure 12. The mechanism of the sintering process ((a) the energy required for the transformation of the crystal form; (b) spodumene sintering process; (c) lepidolite sintering process).
Metals 14 01075 g012
Figure 13. Effects of various variables on the leaching rate of Li. ((a) ratio of liquid and solid; (b) leaching temperature; (c) leaching time).
Metals 14 01075 g013
Figure 14. XRD pattern of the leaching residue under optimal conditions.
Metals 14 01075 g014
Figure 15. Kinetic analysis of water leaching reaction for the Li-containing sintered products: (a) Leaching kinetic for Li at different temperatures and times; (b) derivation of parameter n in the kinetic equation; (c) plots of −ln(1x) vs. time t; (d) Arrhenius plot for the reaction.
Metals 14 01075 g015
Table 1. The chemical composition of lithium ore (wt.%).
OxideLi2OSiO2Al2O3K2ONa2ORb2OCs2OFe2O3Cr2O3CaOMgO
Content2.7274.4017.184.801.730.240.020.950.120.150.06
Table 2. Elemental compositions at the points marked in Figure 3 (SEM) (wt.%).
PointSiO2Al2O3CaONa2OK2OFe2O3Cs2O
164.59735.3130.0130.0320.1600.0280.001
299.8800.0440.0060.0180.0240.0260.000
361.46832.2880.0330.1020.0160.0860.006
467.99126.3060.1385.5370.0270.0000.000
568.74826.3060.1385.5370.0270.0000.000
659.16523.0930.0220.25517.4130.0210.031
771.27825.9560.0392.5170.0550.1450.010
Table 3. The main mineral content in lithium ore (wt.%).
MineralOrthoclaseQuartzAlbiteSpodumeneMuscoviteHolmquisiteOthers
Content22.6628.9714.3529.851.870.592.30
Table 4. Analysis of lattice parameters of α–LiAlSi2O6 and β–LiAlSi2O6/(nm).
abcαβγVol/(nm3)
α–LiAlSi2O69.4668.3945.22190.0069.6790.00389.01
β–LiAlSi2O67.5487.5489.17790.0090.0090.00520.36
Table 5. Bonds length/(nm) between atoms in α–spodumene crystal.
Bonds TypeLi–OSi–OAl–O
Bonds length/(nm)2.2111.5982.028
Table 6. The main chemical reactions in the sintering and leaching process.
NumberProcessChemical Reaction
aSinteringCaCO3 →CaO + CO2
bα–Li2O·Al2O3·4SiO2 → β–Li2O·Al2O3·4SiO2
c3CaO + NaAlSi3O8→NaAlO2 + 3CaSiO3
d3CaO + KAlSi3O8→KAlO2 + 3CaSiO3
eCaO + SiO2→CaSiO3
f4CaO + LiAlSi2O6→LiAlO2 + 2Ca2SiO4
gLeachingCaO + 2H2O→Ca(OH)2
h
i
j
2LiAlO2 + 3Ca(OH)2 + 4H2O→2LiOH + 3CaO·Al2O3·6H2O
2NaAlO2 + 3Ca(OH)2 + 4H2O→2NaOH + 3CaO·Al2O3·6H2O
2KAlO2 + 3Ca(OH)2 + 4H2O→2KOH + 3CaO·Al2O3·6H2O
Table 7. Spectral peak positions of different functional groups in the raw.
Functional GroupSi–O–Si Si–O–AlAl–OSi–O
Wavenumber (cm−1)772, 726 and 691535 and 466648 and 5851011
Disclaimer/Publisher’s Note: The statements, opinions and data contained in all publications are solely those of the individual author(s) and contributor(s) and not of MDPI and/or the editor(s). MDPI and/or the editor(s) disclaim responsibility for any injury to people or property resulting from any ideas, methods, instructions or products referred to in the content.

