Article

A New Critical Plane Multiaxial Fatigue Criterion with an Exponent to Account for High Mean Stress Effect

by
Mikel Abasolo
1,*,
Luis Pallares-Santasmartas
2 and
Martin Eizmendi
1
1
Department of Mechanical Engineering, Escuela de Ingeniería de Bilbao, University of the Basque Country, Alameda de Urquijo s/n, 48013 Bilbao, Spain
2
Department of Technology, I.E.S. María Telo, Educantabria, San Fernando 49, 39400 Los Corrales de Buelna, Spain
*
Author to whom correspondence should be addressed.
Metals 2024, 14(9), 964; https://doi.org/10.3390/met14090964
Submission received: 1 July 2024 / Revised: 7 August 2024 / Accepted: 10 August 2024 / Published: 26 August 2024
(This article belongs to the Section Metal Failure Analysis)

Abstract

:
The mean stress effect remains a critical aspect in multiaxial fatigue analysis. This work presents a new criterion that, based on the classical Findley criterion, applies a material-dependent exponent to the mean normal stress term and includes the ultimate tensile stress as a fitting parameter. This way of considering the non-linear effect of the mean stress, with a material-dependent rather than a fixed exponent, is totally innovative among the multiaxial fatigue criteria found in the literature. In order to verify its accuracy, the new criterion has been checked against an extended version of the Papuga database of multiaxial experimental tests with 485 results, and compared with the criteria by Findley, Robert, and Papuga. The new criterion provides outstanding results for pure uniaxial cases, with multiaxial performance similar to the Robert criterion with a smaller range of error and a conservative trend, even surpassing the popular Papuga method in several relevant loading scenarios. These features enhance the applicability and versatility of the criterion for its use in the fatigue design of structural components.

1. Introduction

Despite the enormous advances in the last decades, multiaxial fatigue remains an unsolved problem. Issues such as the effect of mean axial and torsion stresses and the effect of out-of-phase loads are under study, with continuous enhancements in modeling. New multiaxial fatigue methods are continuously being published in the specialized literature [1], and no criterion has proved to indisputably prevail over the others for any material or multiaxial load case [2,3].
Multiaxial fatigue problems were first studied by Gough and Pollard almost a century ago [4]. They developed a criterion for bending and torsion combined loads without mean stress components. In 1942, Smith [5] presented an extended guide to deal with mean axial and torsional stresses for a variety of materials collected from the literature. It was not until 1956, in the context of the first International Conference on Fatigue, that theories able to deal with complex loading cases with mean stresses were introduced. The theories of Marin [6] and Crossland [7], based on stress invariants, and the Findley critical plane [8] criterion were presented.
The development of multiaxial fatigue criteria has progressed in parallel with the available data. Marin used a great database from the literature as a benchmark, and inferred that static stresses have a great influence on the performance of the multiaxial fatigue criteria. Findley’s criterion was devised for the loading cases considered as the most important ones: uniaxial with mean stresses, torsion with mean shear stresses, and combined bending and torsion [9]. Nevertheless, Findley expressed concerns regarding the lack of experimental results for other load cases. In the 1970s and 1980s, multiaxial fatigue campaigns with complex loadings including mean stresses and out-of-phase loadings were performed by German and French researchers [10,11,12,13]. Considering those experimental results, the theories of Zenner [14], Grubisic [15], and Froustey [16], based on the integral approach, and the criterion by Robert [17], based on the critical plane, were devised.
In a paper by Papuga in 2011 [3], a number of criteria were tested against a database of 407 experiments. It was concluded that mean stress effects are of paramount importance, as the method of dealing with these mean stresses is the most critical aspect of a multiaxial fatigue criterion. In this sense, it is shown that the differences between current criteria are not so pronounced without the mean stress effect. Consequently, Papuga states that any newly introduced criterion should check this factor. In a more recent paper examining new criteria [1], Papuga remarked on the idea of comparing the predictions of multiaxial criteria with experimental results including high mean stresses. These experimental results should also include pure uniaxial load cases, which are very important cases of multiaxial loading since uniaxial stress states are very common in structural applications. In this sense, multiaxial fatigue criteria should also reproduce accurately pure uniaxial cases with high mean stresses [1,3,18,19,20].
The present work examines and compares critical plane criteria using the Papuga database, which has been further expanded with experimental results that include mean stresses collected from the literature. The objective of the present work is to develop a multiaxial fatigue criterion able to deal with mean stresses, including uniaxial loading cases. As will be explained, the non-linear effect of the mean stress is considered by applying a material-dependent exponent instead of using a fixed value as state-of-the-art multiaxial fatigue criteria do. For validation purposes, the theoretical predictions of the new criterion are finally compared with the experimental results and the predictions of other criteria in order to check its global accuracy and its suitability to fit uniaxial cases and consider mean stress effects. The experimental database comprises 485 test results from 48 different ferrous materials and aluminum and titanium alloys under a wide variety of biaxial load conditions.

2. Materials and Methods

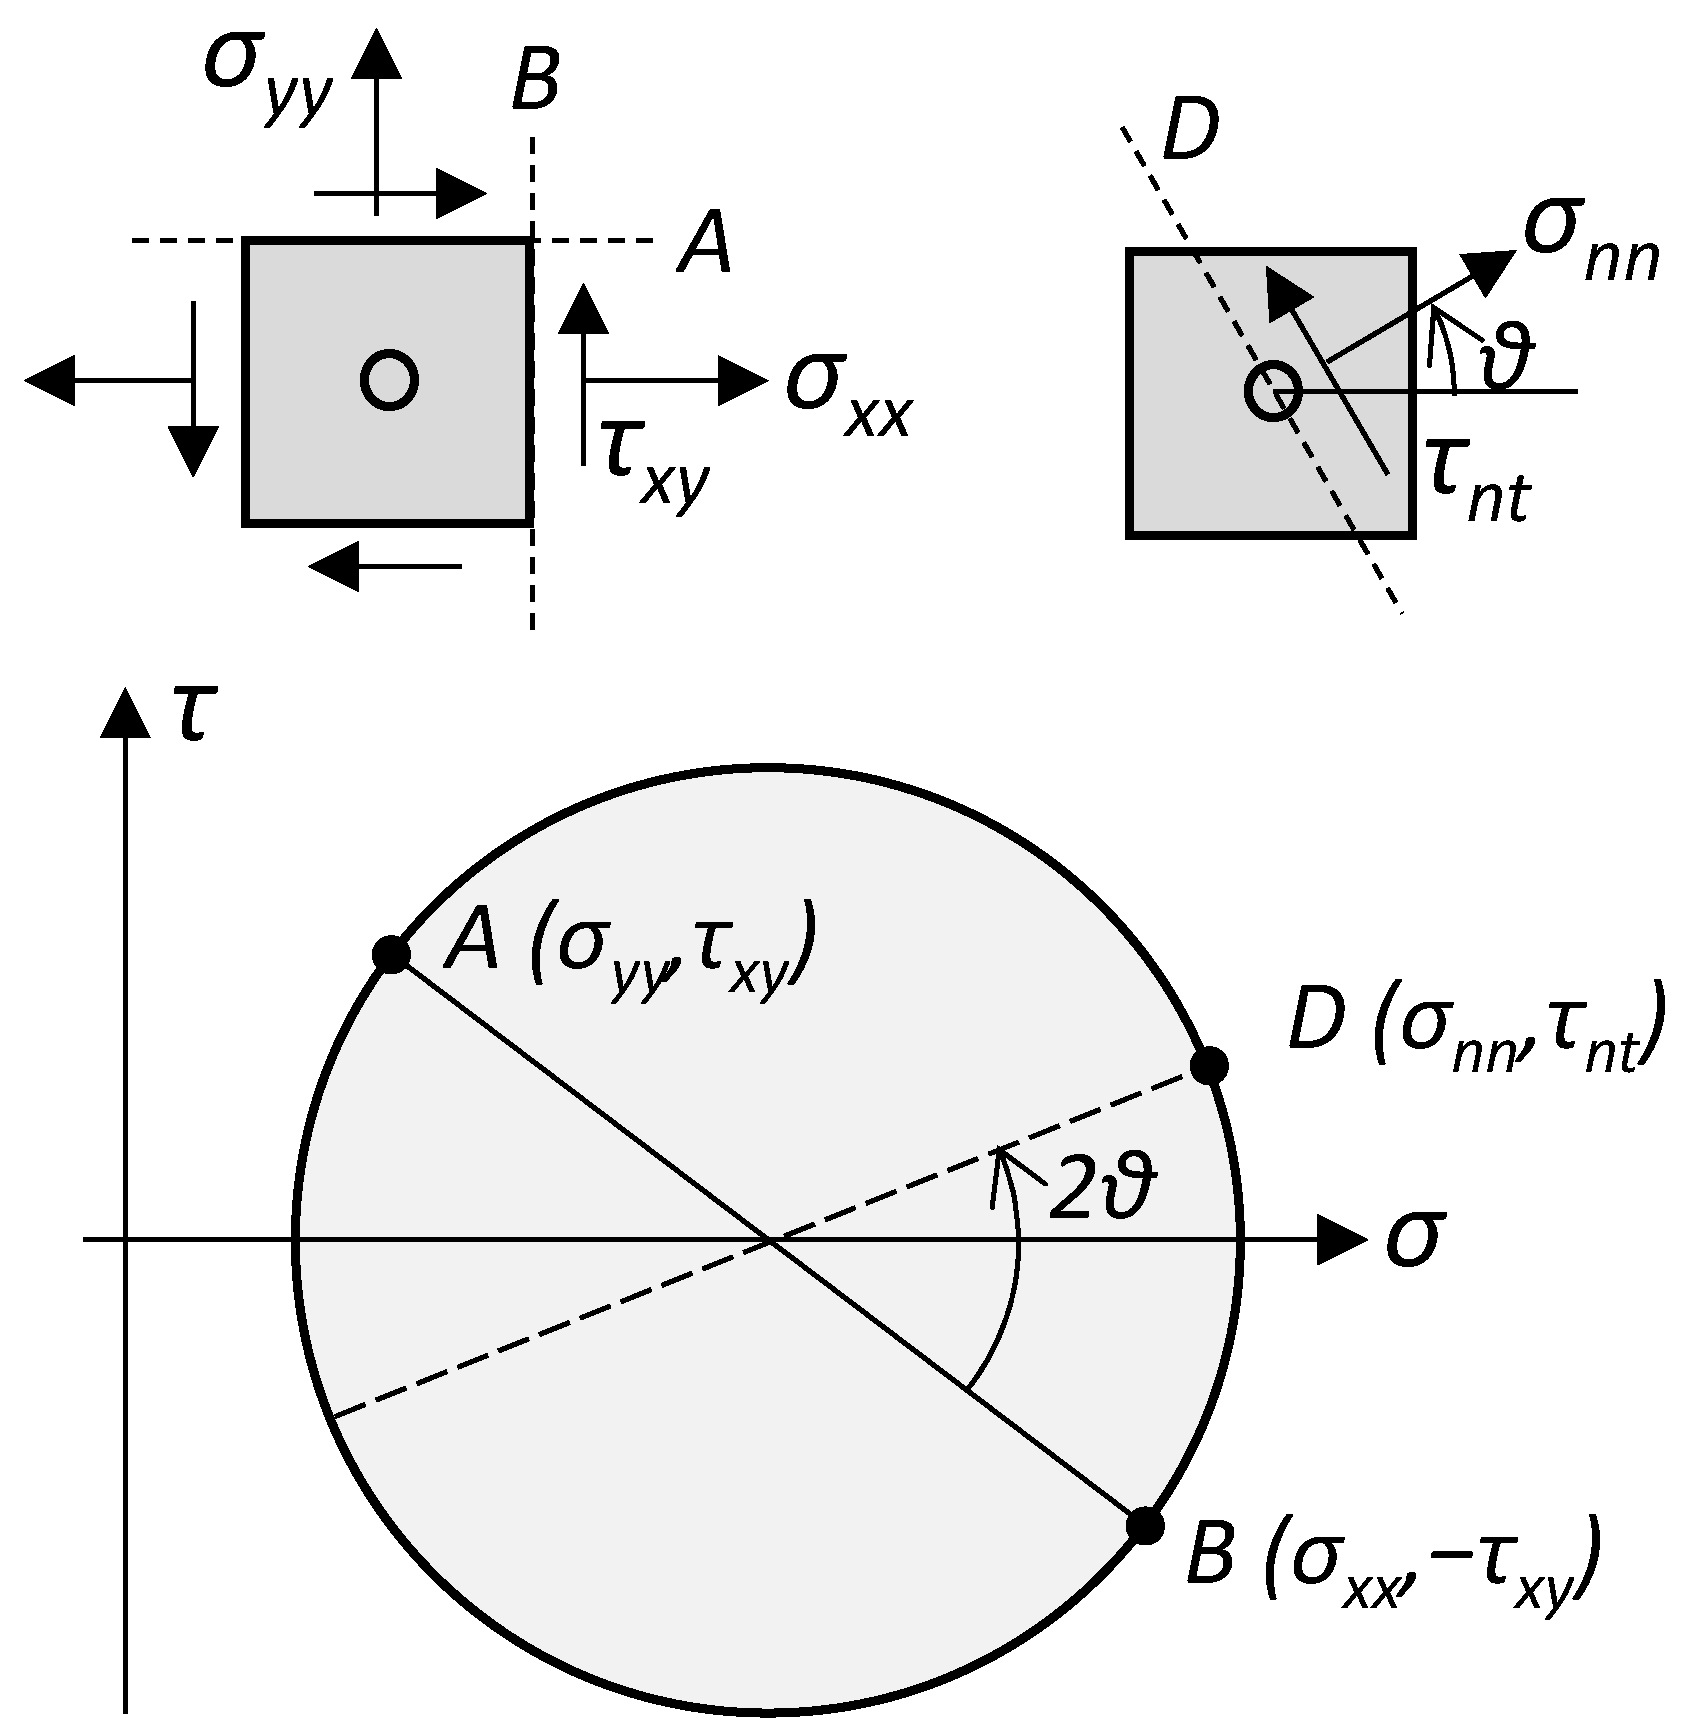
2.1. Critical Plane Methods

Multiaxial fatigue tests with mean stresses started in the late 1940s. Gough [21] and Hanley [22] tested steels under bending torsion, whereas Sauer [23] and Findley [24] tested aluminum alloys. Thus, a wide variety of engineering metals, covering a wide ductility range, had been already tested by the mid-1950s under both uniaxial and multiaxial loading conditions: aeronautical aluminums, carbon and low-alloy steels with different heat treatments, and cast irons [5]. This relatively extensive experimental database set the foundation for the development of more complex and generalist multiaxial fatigue criteria, which could also consider the effect of mean stresses.
Findley analyzed 6 different classic theories and their experimental agreement in [25], and concluded that none of them were able to explain the different κ = σ−1/τ−1 ratios (the ratio between fully reversed axial and torsional fatigue limits, σ−1 and τ−1, respectively). Moreover, the mean stress effect was at that time represented for uniaxial cases by the empirical lines of Goodman, Soderberg, or Gerber, amongst others. In a subsequent discussion, Findley remarked on the importance of the critical plane of failure in [26], speculating that “perhaps the basic mechanism remains the same for all materials but the effect of certain influencing factors changes with material”.
Stulen and Cummings [8] developed the first multiaxial fatigue criterion according to which fatigue damage is caused primarily by the shear stress amplitude, in combination with the maximum normal stresses. Later, Findley applied this formulation to the plane of maximum damage, giving rise to Findley’s critical plane method [9], where the no failure condition is:
τ n t , a + a F σ n n , a + σ n n , m d F
where aF and dF are material parameters that can be identified from endurance fatigue limits, usually σ−1 and τ−1. Being a maximum damage criterion, the equation must be evaluated in several planes so that no fatigue failure will occur if the condition is fulfilled in the most damaged plane, known as the critical plane. Thus, τnt and σnn are, respectively, the shear and normal stresses acting on that critical plane. As remarked literally in [27], “this theory explains the fact that the influence of mean stress is small for torsion and stronger for bending of ductile materials but strong for torsion and bending of cast irons”. The Findley criterion was praised because of its ability to deal with mean shear stresses; nevertheless, Findley himself considered his theory as “tentative” [27] and hypothesized that the effect of the normal stress is probably non-linear, even though the linear addition in Equation (1) adequately adjusted the experimental results available at that time. A later development included a parabolic influence of the normal stress on the critical plane, but the prediction capability hardly improved with respect to Equation (1).
Robert’s critical plane criterion [17] is another maximum damage critical plane criterion. It is an evolution of the Findley criterion, with a separate treatment of mean and alternating normal stresses to the critical plane, based on the premise that each component provokes a different damage:
τ n t , a + a R σ n n , a + b R σ n n , m d R
The 3 material parameters aR, bR, and dR for Robert’s criterion can be adjusted with 3 fatigue tests, generally by means of the axial and reverse torsional fatigue strengths (σ−1 and τ−1) as in Findley’s criterion, and additionally a third test such as the fatigue limit in repeated axial loading σ0.
In the comparison carried out by Papuga [28], the Robert criterion obtained an overall better experimental agreement than the criterion by Findley, showing a more centered distribution with less scatter. However, one set of experimental results of the database had a great impact on the performance of the Robert criterion: the experimental results of Bomas et al. [29] on SAE 52100 steel, which is very common in bearings as well as in automotive and aircraft parts, offered over-conservative predictions for the Robert criterion, dramatically increasing the range of error. Figure 1 shows the Haigh diagram with these experiments, together with the theoretical predictions by the Findley and Robert criteria.
Papuga’s critical plane criterion was first defined in [28] and later optimized in [30]. Papuga developed his criterion from a great database collected from the literature [31] and used a semi-empirical approach. This criterion shares similarities with Robert’s, as it is a maximum damage criterion and analyzes the mean normal and amplitude stresses separately:
a P τ n t , a 2 + b P σ n n , a + c P σ n n , m d P
where aP and bP are two material constants that are defined in two branches depending on the value of κ, being the boundary value defined at 1.155 (extra-brittle materials). As with the Robert criterion, it also needs 3 parameters: σ−1, τ−1, and σ0. The criterion provided outstanding results for the 407 experiments of the database analyzed in [3], but the predictions for SAE 52100 steel in Figure 1 are not accurate.
There are many other multiaxial fatigue theories [32,33,34,35,36,37], such as the Maximum Shear Stress Range (MSSR) critical plane methods, which are not dependent on mean shear stresses in pure torsional fatigue loadings, which is a valuable feature for multiaxial fatigue methods [3,38]. It requires a double optimization process for evaluating the damage function in planes taking a value higher than 99% of the shear stress amplitude [31]. The Integral Analysis methods are computationally expensive, and contrary to the critical plane methods, do not offer the expected crack angle. The Maximum Damage (MD) critical plane methods are able to take into account the influence of high mean stresses on the inclination of the critical plane and require simple optimization, contrary to the MSSR methods [3,38].
In this section, the Maximum Damage critical plane methods of the Findley, Robert, and Papuga criteria were recalled because they are similar to each other, and they also share similarities with the new criterion proposed in this work, which will be presented in the following section. The proposed criterion is an evolution of the Findley criterion where, as a first step, the mean and alternating normal stresses are separated as already done by Robert, as described in the previous section. Analyzing the results of the Findley criterion, Papuga in his review work [3] stated that a mean stress effect revision of the criterion should improve the accuracy. Indeed, Robert’s linear proposal significantly improves the overall performance of the criterion against the database of 407 experiments. However, especially for high mean uniaxial stress cases such as the ones in Figure 1, the results are not good. In this sense, Papuga and Findley hypothesized that linear combination of the mean stress may not be the best approach. Based on this, the new model developed in the current work further evolves Findley’s criterion by applying a material-dependent exponent to the mean normal stress component. The idea of applying exponentials to stress components is not innovative, since many multiaxial methods, the Papuga criterion amongst them, apply exponents to different components of stress or to combinations of them. Nevertheless, in the new criterion, the exponent is not a fixed value but a parameter to be fitted with the strength properties of the material. The idea comes from observing that, for pure uniaxial load cases, different materials are fitted using different classical equations (Goodman, Gerber, Marin, etc.) that use different exponents for the mean and alternating stresses [17], so these exponents can in fact be considered as material properties. Similarly, the Walker equation uses an exponent γ , whose value must be empirically fitted for the material under study, always resulting in a concave upwards shape for the Haigh diagram [39]:
Goodman :   σ a σ 1 + σ m σ u 1 Gerber :   σ a σ 1 + σ m σ u 2 1 Marin :   σ a σ 1 2 + σ m σ u 2   1 Walker :   σ m + σ a 1 γ σ a γ σ 1

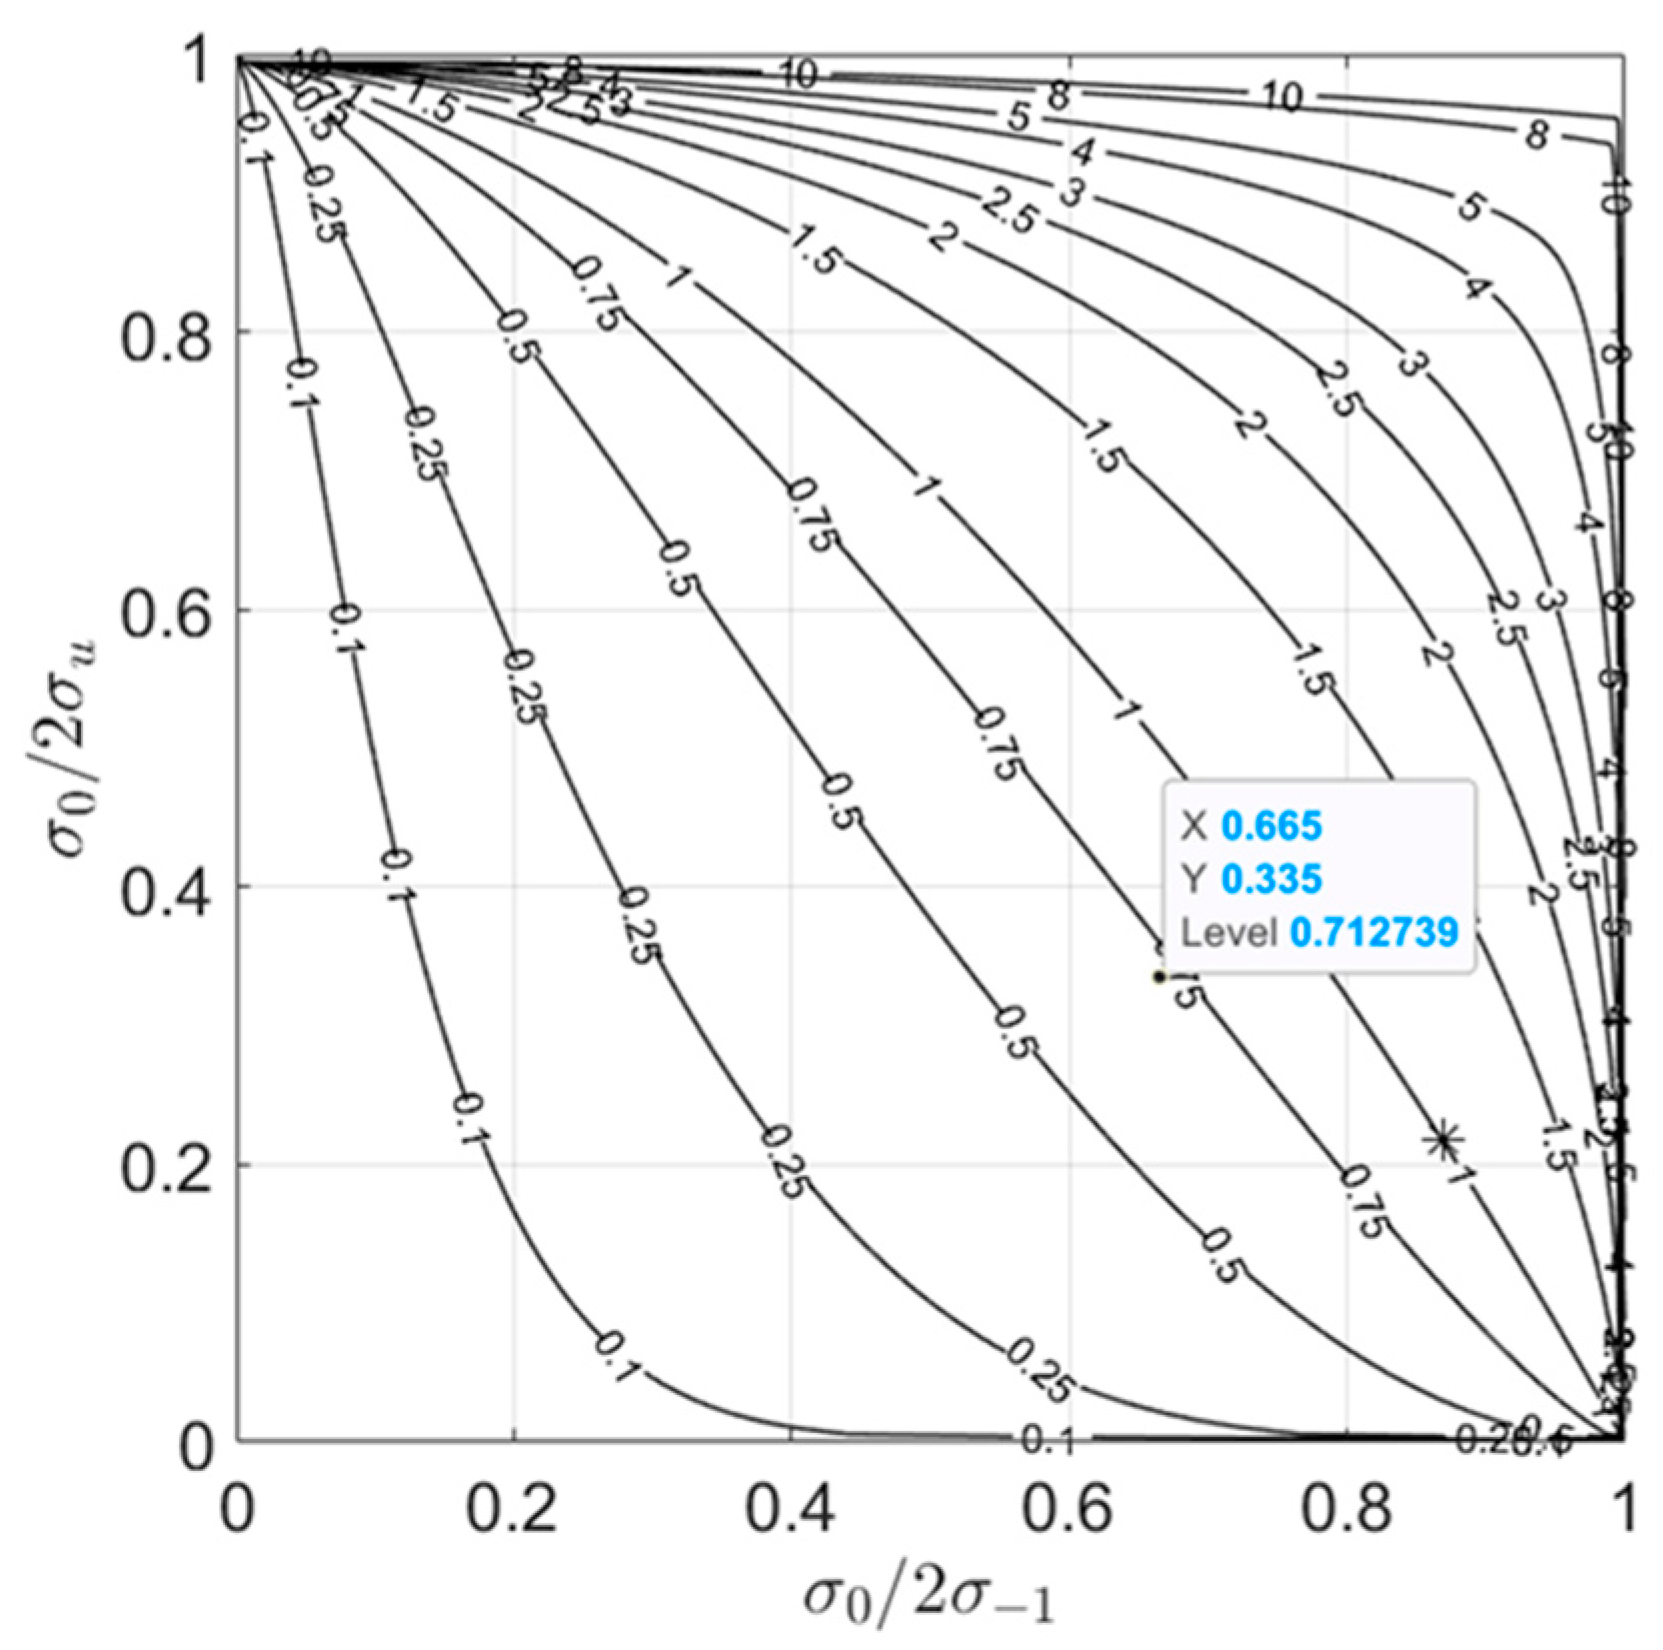
2.2. New Critical Plane Method

As mentioned in the previous section, the new method evolves the Findley criterion by applying an exponent to the mean stress term to account for the non-linear effect of the mean stress. There are several well-known fatigue methods, which have been developed by adding an extra parameter to a previous one. Amongst them, we can cite the Robert method [17], which adds an additional parameter to the Findley method [8], and the Walker method [39], which adds an additional parameter to the Smith–Watson–Topper method in the form of a material-dependent exponent instead of a fixed value of 0.5.
Table 1 summarizes the equations and parameters of the Findley, Robert, Papuga, and the new Abasolo criteria, where the new exponent cA and its material-dependent nature are observed.
The expressions of the parameters of the new model are developed in Appendix A. Comparing the Findley, Robert, and Abasolo equations in Table 1, it is observed that parameters a and d are the same for all the criteria. The reason is that these parameters are fitted from alternating torsion and alternating axial tests, where σnn,m = 0. Therefore, the three equations are the same, with parameters a and d depending on the fully reversed axial and torsional fatigue limits σ−1 and τ−1. Parameter b in the Robert criterion is obtained from the repeated axial loading test (therefore depending on σ0), while b and d in the Abasolo criterion are obtained from the static tensile test and the repeated axial loading test; therefore, they depend on the corresponding strengths σu and σ0. Finally, the parameter cA is obtained as the maximum value of the expression in the range 0 ≤ θ < π/2, so it can be easily worked out by sweeping the whole range of θ in a spreadsheet. For illustrative purposes, Figure 2 shows the values of cA for different κ ratios. Note also that in the third term of the Abasolo equation, the absolute value of the mean stress is used, adding or subtracting it depending on the sign of the mean stress, thus making this expression valid also for compressive mean stresses.
The Abasolo criterion is indeed a generalization of Findley’s criterion, since the Findley criterion is a particular case of the Abasolo criterion when bA = aA = aF and cA = 1. By imposing these equalities, the following conditions are obtained (which correspond to the points marked with an asterisk in Figure 2):
σ 1 σ u = 2 κ σ 0 2 σ 1 = 1 2 κ + κ 2 + 3 1 κ
Furthermore, the Robert criterion is also a particular case of the Abasolo criterion when cA = 1 and bA = bR, with the next condition being fulfilled (which corresponds to the curve cA = 1 in Figure 2):
σ 0 2 σ u = 1 σ 0 2 σ 1 2 κ 1 + σ 0 2 σ 1 κ 2
As summarized in Table 1, the Findley equation only uses two parameters (typically σ−1 and τ−1) as input data to characterize the material. Additionally, the Robert and Papuga criteria use a third parameter, σ0. The new criterion developed in this work has four parameters: σ−1, τ−1, σ0, and σu. The value of σu is commonly available for many materials, or otherwise can be easily measured in a static tensile test. Consequently, being a direct evolution of Findley and Robert, the new criterion is expected to provide more accurate results in general, and in particular for high mean stress cases because σu stands for the high mean stress resistance of the material. The improvement is expected to be especially relevant for uniaxial load cases because σu is a uniaxial resistance property.
Thus, exclusively for validation purposes, the criteria were programmed and applied to an extensive experimental database in order to verify their accuracy in a wide variety of load cases, both uniaxial and multiaxial. The Papuga criterion was also included in the comparison since, apart from having a similar formulation and being a leading criterion as mentioned, the database of the present work is an expansion of Papuga’s one [3].

2.3. Experimental Database and Numerical Implementation

In order to test the multiaxial fatigue methods, the Papuga database presented in [3] was used. It contains 407 test results of 23 different materials, with different types of materials: aluminum alloys, ferrous materials (steels, cast irons, etc.) and Ti-6Al-4V titanium. Therefore, the database contains brittle, semi-ductile, ductile, and extra-ductile materials, which have been tested under a wide variety of biaxial load conditions that include mean tensile and torsional stress components.
Nevertheless, in spite of its extensiveness, the database has some limitations, such as the absence of compressive mean loads because the FatLim version used in [3] zeroed the values of the static stresses to calculate the results, and 15 experiments were dismissed. In the present work, those results were also included in the database and additional tests that deal with mean axial or bending mean loads, including high values of the stress ratio, and in some cases with compressive mean loads, were also added. Table 2 summarizes this new data. As a result, the new extended database has a total of 485 test results from 48 different materials.
The numerical calculations were performed with the multiaxial fatigue tool developed by one of the authors in a previous work [38] and validated against FatLim. In order to calculate the Shear Stress Amplitude τnt,a in Table 1, the Minimum Circumscribed Ellipse method [40] was implemented.
Table 2. Additional experimental results added to the Papuga database [3] in the present work.
ReferenceNumber of Data ItemsMaterialReason for the Selection
Papuga [3]15VariousMean compressive loads applied
Sauer [23]814S-T aluminiumStatic bending or static torsion stresses
O’Connor [41], Chodorowski [42]10NiCrMo steelHigh values of mean axial tension and compressive loads
Ukrainetz [43]60.1 C steelMean axial tension loads. Static shear stresses on torsional fatigue loading
Grün et al. [44]525CrMo4 steelHigh values of mean axial tension and compression loads
Lüpfert et al. [45]820MnCr steelHigh values of static compressive loads. Only biaxial loadings considered.
Rausch [46]14EN-GJV-450 cast ironHigh values of mean axial tension and compression loads. Static shear stresses on torsional fatigue loading
Tovo [47]6EN-GJS-400-18 ductile cast ironMean axial tensile and compressive loads.
Static shear stresses on torsional fatigue loading
Pallarés-Santasmartas [48,49]634CrMo6 steelMean axial tensile and compressive loads.
Static shear stresses on torsional fatigue loading

3. Results and Discussion

In this section, different error indicators are offered in error charts in a similar way to the work of Weber [50] to ease the interpretation of the results for the reader. The error is defined as in [3]. According to it, the equations are rewritten to define an alternating equivalent alternating uniaxial stress in such a form that the no failure condition is defined with respect to the experimental fatigue limit of the material σ−1. Thus, the fatigue index error will be:
E r r o r   ( % ) = σ e q l o a d σ 1 ( m a t e r i a l ) σ 1 ( m a t e r i a l ) · 100
Positive values of Equation (7) will result in conservative predictions, whereas negative values involve non-conservative results.

3.1. General Results for the Complete Database

In order to give a general view of the performance of the criteria under study, Table 3 lists the results of the Findley, Robert, Papuga, and Abasolo criteria when their predictions are compared with the complete database of 485 experimental results. It can be observed that the Robert and Abasolo criteria significantly outperform Findley in all aspects. The Robert criterion has a smaller mean error but a higher standard deviation than the Abasolo criterion, while the latter is slightly more conservative. Finally, in this global comparison, the Abasolo criterion has the smallest range of error amongst the four criteria analyzed, whereas Papuga is found to be the most accurate criterion.

3.2. Results for Uniaxial Load Cases

As previously stated, pure uniaxial loading is of utmost importance in engineering applications, and the criteria of Goodman, Gerber, and Marin are widely used. Table 4 summarizes the results for the pure uniaxial cases within the database. The classic uniaxial criteria such as Goodman, Gerber, and the elliptical relationship of Marin are compared together with the multiaxial fatigue methods. The Goodman and Gerber methods show high ranges of error when compared to the critical plane criteria.
The Abasolo criterion shows an enhanced experimental agreement, with both the lowest range of error and mean absolute value of the error, providing conservative predictions. This improvement is even more remarkable for high mean axial stresses (with load ratio 0.05 ≤ R < 1), as proved in Table 5. The proposed method offers the most reduced range of error, and a shift towards the conservative side, contrary to the Papuga method.
In order to illustrate the performance of the criteria for pure uniaxial cases, Figure 3 shows the experimental results of four materials for which high stress ratio experimental results are available, together with the theoretical predictions. One of them is the troublesome SAE 52100 steel previously analyzed in Figure 1. It can be observed that the Abasolo criterion replicates the shape of the experimental Haigh diagram more precisely, outperforming the rest of the criteria. Indeed, the new criterion has shown a unique ability to adapt the exponent to the shape of the Haigh diagram, whether it is concave or convex. As previously mentioned, this improved performance was already expected because the Abasolo criterion uses σu as an additional fitting parameter when compared with the other multiaxial methods under study, and it considers the mean stress effect with a material-dependent exponent.
Of course, this superior accuracy of the new Abasolo criterion for uniaxial cases should not be at the expense of an inferior prediction capability for multiaxial load cases. As already seen in Table 3, the global performance of the criterion is not penalized; however, a more detailed study is provided next, focusing on the mean stress effect.

3.3. Results for Load Cases with No Mean Stress

In the analyzed database, a great number of the experimental tests were performed without applying mean stresses; most cases are combined bending and torsion cases without mean stresses, both in-phase and out-of-phase. As Papuga pointed out in a previous review of methods [3], “no mean stress” cases do not have a great impact on the overall performance. Table 6 shows that, obviously, no difference exists between the Findley, Robert, and Abasolo criteria since all of them have the same formulation for these cases according to Table 1. The Papuga criterion obtains more adjusted results by a minor margin.

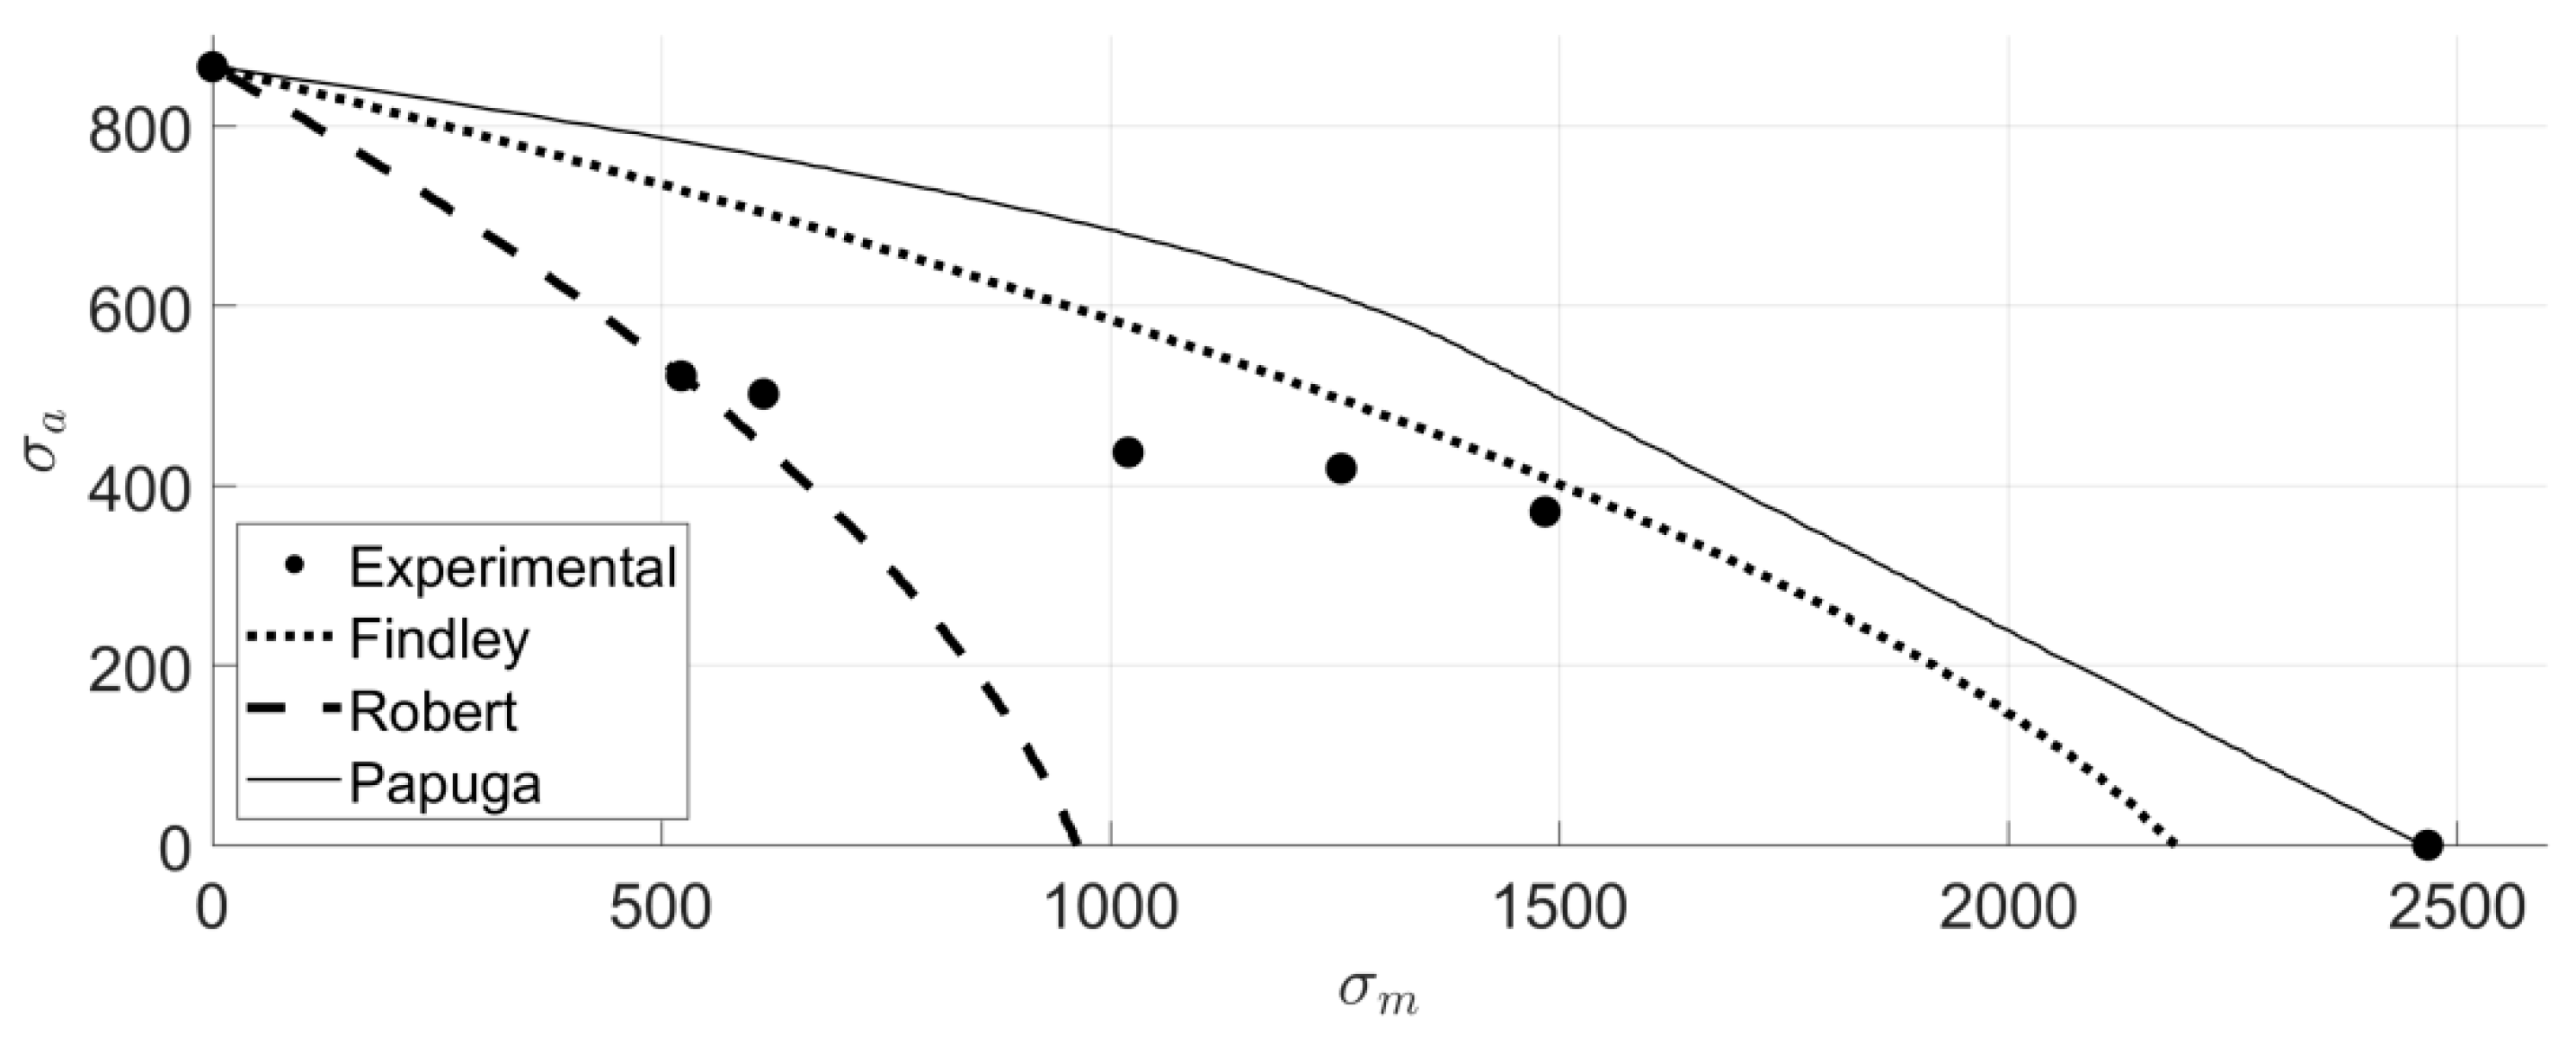
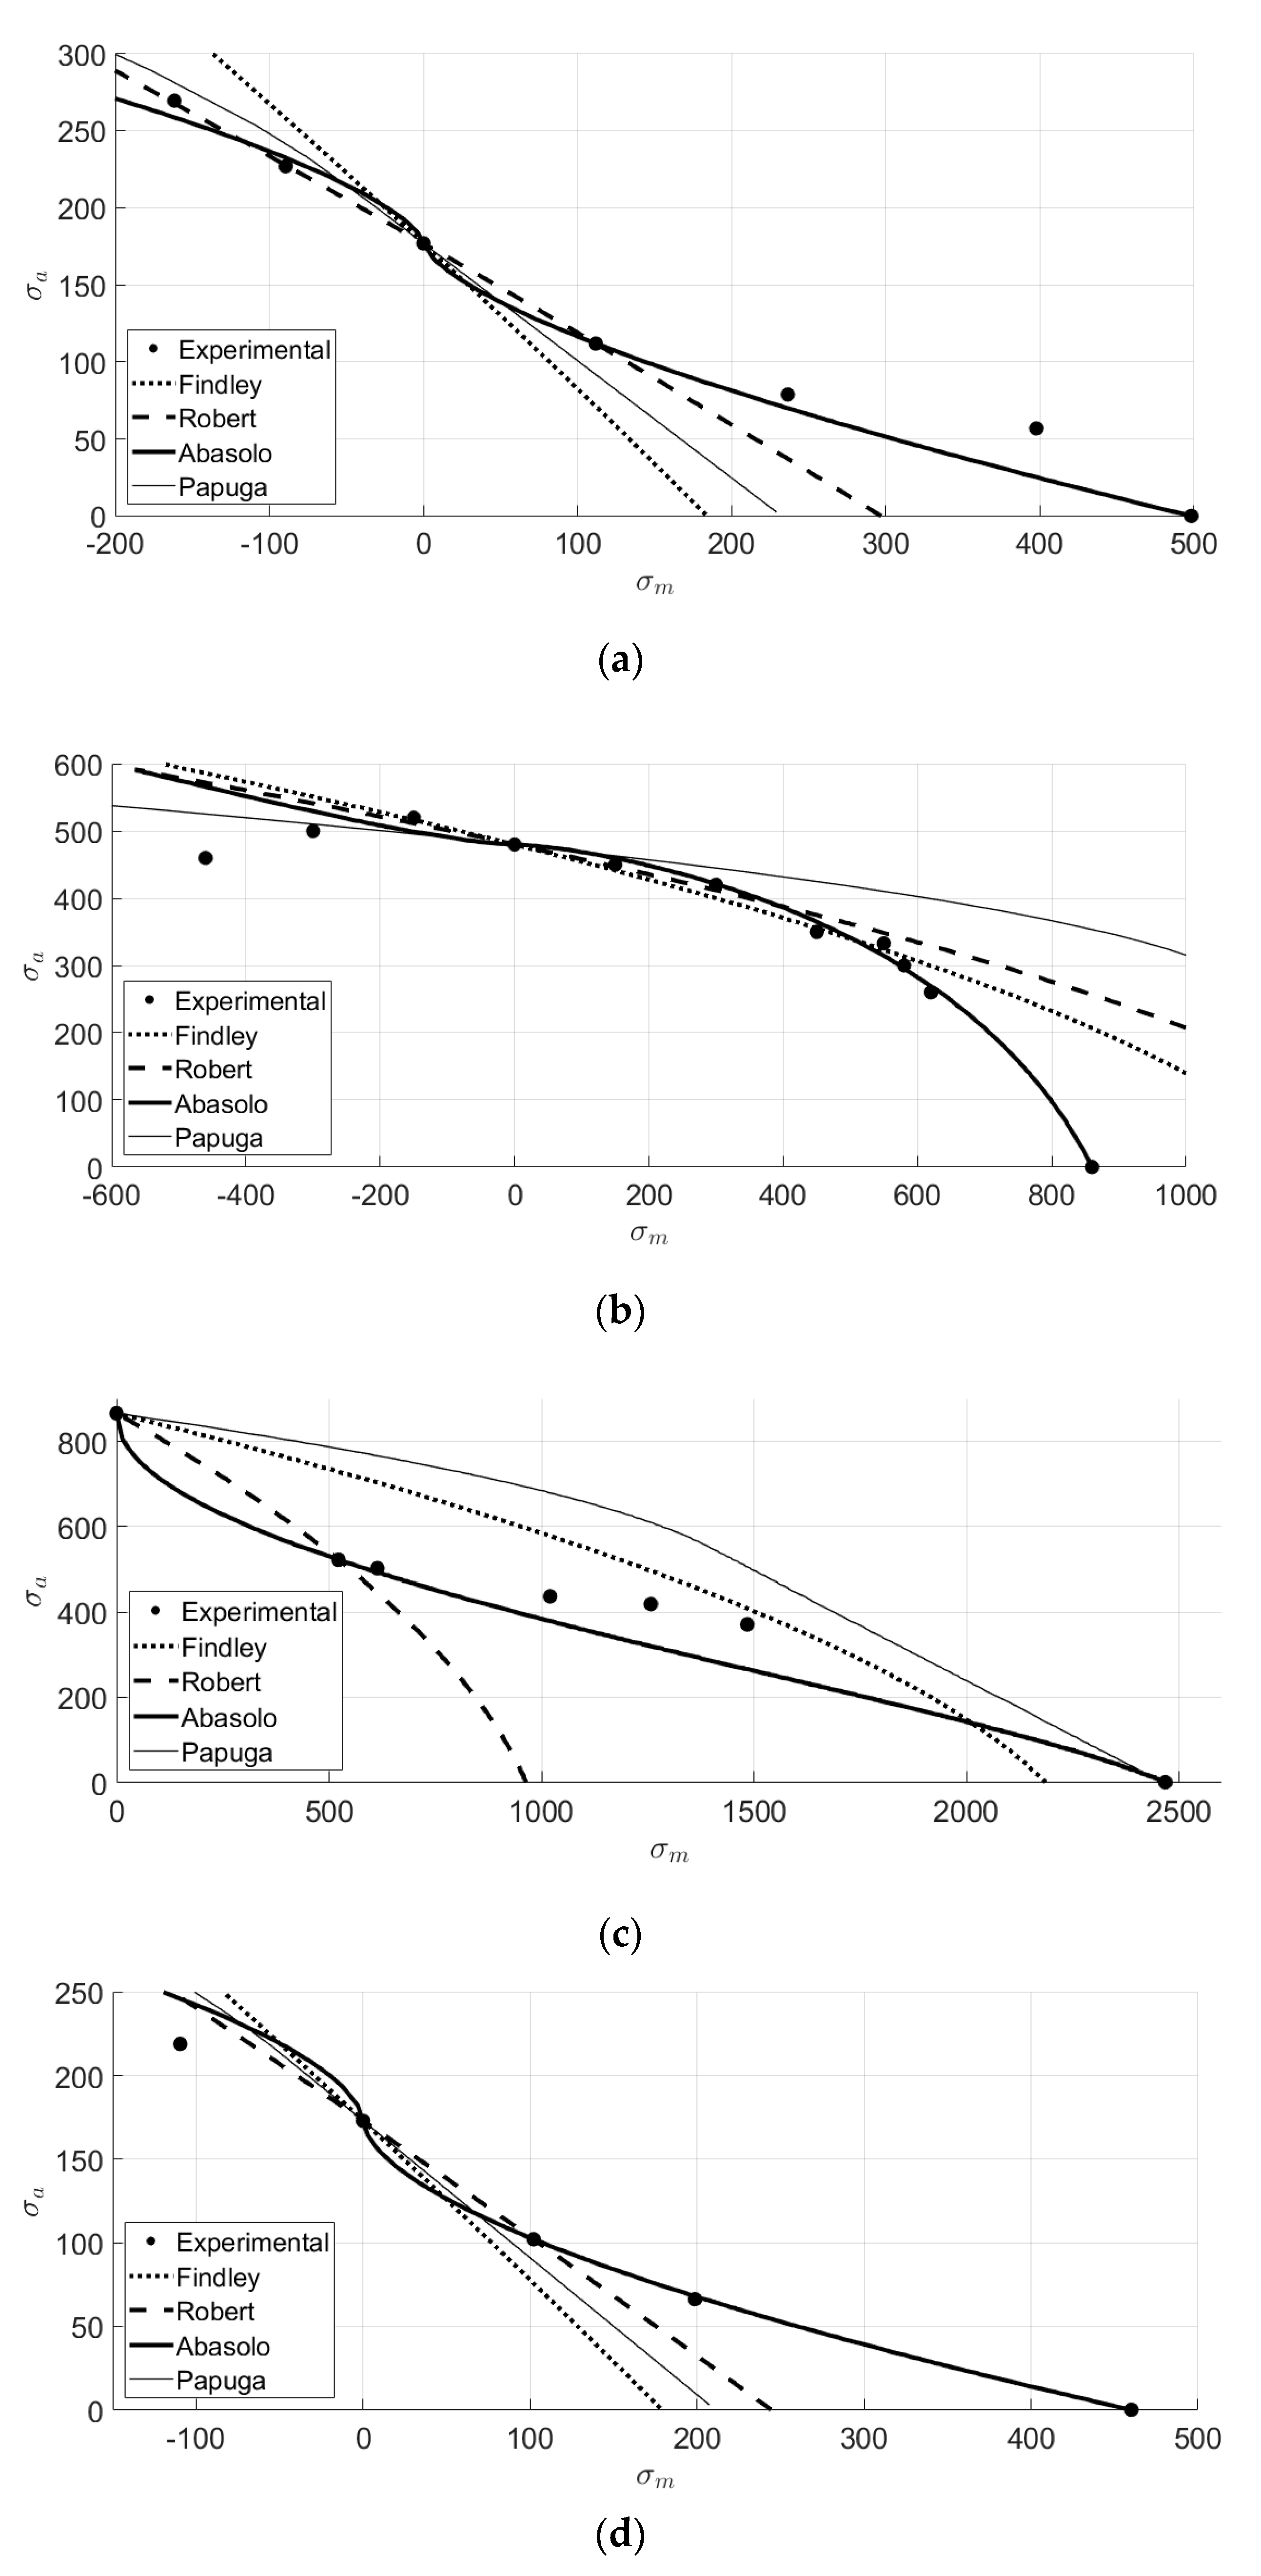
3.4. Results for Load Cases with Mean Stress

The mean stress effect is considered by several authors [3,6,9,18] as the most determining effect of the performance of the criteria. Table 7 shows the results for the cases with non-zero mean stresses. In Table 8, only high mean stress load cases with 0.05 ≤ RvM < 1 are filtered. The multiaxial stress ratio RvM is based on the von Mises equivalent stress, and uses the sign of the hydrostatic stress as in the Manson and McKnight criteria [51]:
R v M = s i g n ( σ x x , m + σ y y , m + σ z z , m ) · σ v M , m i n σ v M , m a x
The conclusions are quite similar to those derived for the global results in Table 3, with the Robert and Abasolo criteria performing similarly, and the Papuga criterion once again in a leading position. As in the global performance summarized in Table 3, the Abasolo criterion shows the lowest range of error among the criteria under study and tends to be conservative.

3.5. Results for Torsional Load Cases

Finally, Table 9 shows the results for mean torsional load cases, whose effect is a controversial issue in multiaxial fatigue [2,14,49,52]. Again, the criterion developed in this work shows a statistical trend for the distribution of error similar to the Robert criterion; however, in this case, the results of the Papuga criterion are significantly improved. In this particular case, all the criteria except Findley are non-conservative.

4. Conclusions

The mean stress effect is a critical aspect of multiaxial fatigue and, to a greater or lesser extent, current multiaxial fatigue methods do not reproduce it satisfactorily. The mean stress effect, and more particularly, the axial stress effect remains as a critical factor in the performance of multiaxial fatigue methods, and the effect of high stress ratios is even amplified, with large ranges of errors for current multiaxial fatigue methods.
A new multiaxial fatigue criterion has been developed in the present work. Based on classical Findley criterion, it applies a material-dependent exponent to the mean normal stress component. The value of the exponent can be easily determined in a spreadsheet. The new criterion uses four fitting parameters, namely the axial and torsional fully reversed fatigue limits σ−1 and τ−1, the fatigue limit in repeated axial loading σ0, and the ultimate tensile strength σu. The criterion provides outstanding results for pure uniaxial cases, reproducing the shape of the Haigh diagrams, especially for high mean axial stresses. This is not a minor aspect because uniaxial loading is a particular case of multiaxial loading, and therefore multiaxial fatigue methods should be accurate not only for biaxial (or triaxial) cases but also for uniaxial cases. Moreover, uniaxial or quasi-uniaxial load cases are the most frequent load cases in engineering applications, which makes them particularly interesting from a practical point of view. In addition, this improvement for uniaxial load cases does not penalize its prediction capability for general multiaxial loading, where the new criterion performs similarly to the Robert criterion, with a reduced range of error and a distribution of error generally shifted to the conservative side. Compared to the Papuga method, even though the Papuga criterion gives unparalleled overall results, the Abasolo criterion is more accurate not only for uniaxial cases, as mentioned before, but also for torsional load cases, which are also quite common in machine elements. All these features make the presented criterion particularly appealing due to its suitability and versatility for practical use as a tool for the fatigue design of structural components.
As a final conclusion, the method of formulating the presented criterion opens a new way of evolving current multiaxial fatigue methods once the influence of quantities such as the normal stress to the critical plane appears to be non-linear, as already pointed out by several authors, and material-dependent as hypothesized by the authors.

Author Contributions

Conceptualization, M.A.; methodology, M.A. and L.P.-S.; software, L.P.-S.; validation, L.P.-S.; formal analysis, L.P.-S.; investigation, M.E.; resources, M.A.; data curation, L.P.-S.; writing—original draft preparation, M.A., L.P.-S. and M.E.; writing—review and editing, M.A., L.P.-S. and M.E.; visualization, M.E.; supervision, M.A.; project administration, M.A.; funding acquisition, M.A. All authors have read and agreed to the published version of the manuscript.

Funding

This research was funded with grants PID2021-122746OB funded by MCIN/AEI/10.13039/501100011033 and ERDF A way of making Europe, and grant IT1542-22 funded by Basque Government.

Data Availability Statement

The original contributions presented in the study are included in the article, further inquiries can be directed to the corresponding author.

Conflicts of Interest

The authors declare no conflicts of interest.

Nomenclature

a, b, c, dparameters of the critical plane criteria
κfatigue limit ratio κ = σ−1−1
σ0fatigue limit in repeated axial loading
σ−1fully reversed axial fatigue limit
σuultimate tensile strength
σnn,anormal stress amplitude on the critical plane
σnn,mmean normal stress on the critical plane
σeqequivalent normal stress amplitude
τ−1fully reversed torsional fatigue limit
τnt,aalternating shear stress on the critical plane
Rload ratio

Appendix A

The failure condition of the Abasolo criterion is, as pointed out in Table 1:
τ n t , a + a A σ n n , a + s i g n σ n n , m b A σ n n , m c A < d A
The equation has four parameters a , b ,   c and d , whose values are summarized in Table 1. This Appendix A explains the derivation of those equations. As there are four parameters, four different tests are necessary to adjust their values: the fully reversed axial and torsional fatigue limits σ 1 and τ 1 , the fatigue limit in repeated axial loading σ 0 and the ultimate tensile strength σ u . On the one hand, parameters a and d are the same as in Findley and Robert methods (see Table 1), obtained from fully reversed axial and torsional fatigue tests (for that reason they are a function of σ 1 and τ 1 ), and their derivation can be found elsewhere [53]. On the other hand, parameters b and c in the Abasolo method are obtained from static tensile and repeated axial loading tests, and their derivation will be explained in this Appendix A.
In a biaxial stress state, the stress vector σ n in a given plane n oriented at an angle θ, and its normal and shear stress components in that plane, σ n n and τ n t respectively, can be worked out as:
σ n = σ · n = σ x x τ x y τ x y σ y y c o s θ s i n θ σ n n = n T · σ n · n τ n t = σ n σ n n
Operating, the module of the normal stress and shear stress components, σ n n and τ n t respectively, are:
σ n n = σ x x + σ y y 2 + σ x x σ y y 2 c o s 2 θ + τ x y s i n 2 θ τ n t = τ x y c o s 2 θ σ x x σ y y 2 s i n 2 θ
These expressions can also be derived from Mohr’s circle in Figure A1. As mentioned, parameters b and c are obtained from axial load cases, where τ x y = σ y y = 0 . Considering this, and separating the mean and alternating components, (A3) can be rewritten as:
σ n n , m = σ x x , m 2 + σ x x , m 2 c o s 2 θ σ n n , a = σ x x , a 2 + σ x x , a 2 c o s 2 θ τ n t , a = σ x x , a 2 s i n 2 θ
τ n t , m has not been included in (A4) because, as shown in (A1), it is not considered in the Abasolo criterion. Besides, the absolute value of τ n t , a must be considered in (A1).
Figure A1. Definition of σ n n and τ n t in Mohr’s circle for a biaxial stress state.
Metals 14 00964 g0a1

Appendix A.1. Static Tensile Test

Static tensile failure takes place when σ x x , m = σ u , being σ x x , a = τ x y , m = τ x y , a = 0 . Thus, replacing these values in (A4), Equation (A1) is in this case:
b σ u 2 + σ u 2 c o s 2 θ c = d
The critical plane is the one where Equation (A5) is maximum. This happens when in the plane θ = 0 :
m a x b σ u 2 + σ u 2 c o s 2 θ c = b σ u c = d
And therefore the value of parameter b is:
b = d σ u c

Appendix A.2. Repeated Axial Loading Fatigue Test

In this test, failure takes place when σ x x , m = σ x x , a = σ 0 / 2 , being τ x y , m = τ x y , a = 0 . Thus, replacing these values in (A4) and taking the absolute value of τ n t , a :
σ n n , m = σ n n , a = σ 0 4 + σ 0 4 c o s 2 θ τ n t , a = σ 0 4 s i n 2 θ
Substituting (A7) and (A8) in (A1):
1 σ 0 4 d a 1 + c o s 2 θ + s i n 2 θ σ 0 4 σ u 1 + c o s 2 θ c = 0
Therefore:
c = l o g 1 σ 0 4 d a 1 + c o s 2 θ + s i n 2 θ l o g σ 0 4 σ u 1 + c o s 2 θ
According to (A10), each θ value, i.e., each plane θ in the [ 0 , π / 2 ) range will have it own value of c (values in the range [ π / 2 , π ) will give the same values as in the [ 0 , π / 2 ) range due to the absolute value of the term s i n 2 θ ). However, it must be recalled that (A9) must be calculated only in the critical plane, and the value of parameter c to be used in Abasolo criterion will be that one that corresponds to that plane. Accordingly, the value of parameter c must be calculated from the following expression:
c = m a x l o g 1 σ 0 4 d a 1 + c o s 2 θ + s i n 2 θ l o g σ 0 4 σ u 1 + c o s 2 θ     for   0 θ < π / 2
Thus, the parameter c can easily be worked out by sweeping the whole range of θ in a spreadsheet and taking the maximum value. As an illustrative example, for a material with σ 1 / σ u = 0.5 , σ 0 / 2 σ 1 = 2 / 3 and σ 1 / τ 1 = 1.75 , the values for c in the range 0 θ < π / 2 according to (A10) are the ones shown in Figure A2. Consequently, c = 0.713 as defined in (A11) and marked in Figure A2. Of course, this value agrees with the one that can be extracted from Figure 2c, shown again as Figure A3; in this figure, the coordinates σ 0 / 2 σ u = 1 / 3 and σ 0 / 2 σ 1 = 2 / 3 that represent the properties of the material, and the resulting value of c = 0.713 have been conveniently marked.
Figure A2. Value of parameter c for a material with σ 1 / σ u = 0.5 , σ 0 / 2 σ 1 = 2 / 3 and σ 1 / τ 1 = 1.75 , calculated according to Equation (A11).
Metals 14 00964 g0a2
Figure A3. Value of parameter c for a material with σ 1 / σ u = 0.5 , σ 0 / 2 σ 1 = 2 / 3 and σ 1 / τ 1 = 1.75 , illustrated in previous Figure 2c, calculated according to Equation (A10).
Metals 14 00964 g0a3

References

  1. Papuga, J.; Nesládek, M.; Hasse, A.; Cízová, E.; Suchý, L. Benchmarking Newer Multiaxial Fatigue Strength Criteria on Data Sets of Various Sizes. Metals 2022, 12, 289. [Google Scholar] [CrossRef]
  2. Papadopoulos, I.V.; Davoli, P.; Gorla, C.; Filippini, M.; Bernasconi, A. A comparative study of multiaxial high-cycle fatigue for metals. Int. J. Fatigue 1997, 19, 219–235. [Google Scholar] [CrossRef]
  3. Papuga, J. A survey on evaluating the fatigue limit under multiaxial loading. Int. J. Fatigue 2011, 33, 153–165. [Google Scholar] [CrossRef]
  4. Gough, H.J.; Pollard, H.V. The strength of metals under combined alternating stresses. Proc. Inst. Mech. Eng. 1935, 131, 3–103. [Google Scholar] [CrossRef]
  5. Smith, J.O. The Effect of Range of Stress on the Fatigue Strength of Metals; University of Illinois Engineering Experiment Station, Bulletin Series No. 334; University of Illinois: Urbana, IL, USA, 1942. [Google Scholar]
  6. Marin, J. Interpretation of fatigue strengths for combined stresses. In Proceedings of the International Conference on Fatigue of Metals, New York, NY, USA, 28–30 November 1956; Institution of Mechanical Engineers: London, UK, 1956; pp. 184–195. [Google Scholar]
  7. Crossland, B. Effect of large hydrostatic pressure on the torsional fatigue strength of an alloy steel. In Proceedings of the International Conference on Fatigue of Metals, New York, NY, USA, 28–30 November 1956; Institution of Mechanical Engineers: London, UK, 1956; pp. 138–149. [Google Scholar]
  8. Findley, W.N.; Coleman, J.J.; Hanley, B.C. Theory for combined bending and torsion fatigue with data for SAE 4340 steel. In Proceedings of the International Conference on Fatigue of Metals, New York, NY, USA, 28–30 November 1956; Institution of Mechanical Engineers: London, UK, 1956; pp. 150–157. [Google Scholar]
  9. Findley, W.N. A theory for the effect of mean stress on fatigue of metals under combined torsion and axial load or bending. J. Eng. Ind. Trans ASME 1959, 81, 301–306. [Google Scholar] [CrossRef]
  10. Baier, F. Time and Fatigue Strength with Superimposed Static and Oscillating Tensile Compression and Torsion Loading. Ph.D. Thesis, University of Stuttgart, Stuttgart, Germany, 1970. [Google Scholar]
  11. Simbürger, A. Festigkeitsverhalten zäher Werkstoffe bei einer Mehrachsigen Phaseverschobenen Schwingbeanspruchungmit Körperfesten und Veränderlichen Hauptspannungsrichtungen; TH Darmstadt: Darmstadt, The Netherlands, 1975. [Google Scholar]
  12. Troost, A.; Akin, O.; Klubberg, F. Dauerfestigkeitsverhalten metallischer Werkstoffe bei zweiachsiger Beanspruchung durch drei phasenverschoben schwingende Lastspannungen. Konstruktion 1987, 39, 479–488. [Google Scholar]
  13. Froustey, C.; Lasserre, S. Multiaxial fatigue endurance of 30NCD16 steel. Int. J. Fatigue 1989, 11, 169–175. [Google Scholar] [CrossRef]
  14. Zenner, H.; Simbürger, A.; Liu, J. On the fatigue limit of ductile metals under complex multiaxial loading. Int. J. Fatigue 2000, 22, 137–145. [Google Scholar] [CrossRef]
  15. Grubisic, V.; Simbiirger, A. Fatigue under Combined out of Phase Multiaxial Stresses. In Proceedings of the International Conference Fatigue Testing and Design, London, UK, 5–9 April 1976; Society of Environmental Engineers: London, UK, 1976; pp. 27.1–27.8. [Google Scholar]
  16. Froustey, C.; Lasserre, S.; Dubar, L. Multiaxial and block fatigue tests validation of a criterion for metallic materials. In Proceedings of the MAT-TEC 1992, Grenoble, France, 14–16 October 1992. [Google Scholar]
  17. Robert, J.L. Contribution à L’étude de la Fatigue Multiaxiale sous Sollicitations Périodiques ou Aléatoires. Ph.D. Thesis, Institut National des Sciences Appliquées de Lyon, Lyon, France, 1992. [Google Scholar]
  18. Susmel, L.; Tovo, R.; Lazzarin, P. The mean stress effect on the high-cycle fatigue strength from a multiaxial fatigue point of view. Int. J. Fatigue 2005, 27, 928–943. [Google Scholar] [CrossRef]
  19. Koutiri, I.; Bellett, D.; Morel, F. The effect of mean stress and stress biaxiality in high-cycle fatigue. Fatigue Fract. Eng. Mater. Struct. 2018, 41, 440–455. [Google Scholar] [CrossRef]
  20. Ince, A. A mean stress correction model for tensile and compressive mean stress fatigue loadings. Fatigue Fract. Eng. Mater. Struct. 2017, 40, 939–948. [Google Scholar] [CrossRef]
  21. Gough, H.J.; Pollard, H.V.; Clenshaw, W.J. Some Experiments on the Resistance of Metals to Fatigue under Combined Stresses; Aeronautical Research Council Reports and Memoranda; His Majesty’s Stationery Office: London, UK, 1951. [Google Scholar]
  22. Hanley, B.C.; Dolan, T.J. The Effects of Range of Stress and State of Stress on the Fatigue Strength of SAE 4340 Steel; Report No. 22, Project NR-031-005; University of Illinois: Urbana, IL, USA, 1951. [Google Scholar]
  23. Sauer, J.A. A study of fatigue phenomena under combined stress. In Proceedings of the Seventh International Congress for Applied Mechanics, London, UK, 5–11 September 1948; pp. 150–164. [Google Scholar]
  24. Findley, W.N. Combined-Stress Fatigue Strength of 76S-T61 Aluminum Alloy with Superimposed Mean Stresses and Corrections for Yielding; NACA-TN-2924; NACA: Washington, DC, USA, 1953. [Google Scholar]
  25. Findley, W.N. Theories relating to fatigue of materials under combinations of stress. In Colloquium on Fatigue/Colloque de Fatigue/ Kolloquiumüber Ermüdungsfestigkeit; Weibull, W., Odqvist, F.K.G., Eds.; Springer-Verlag OHG.: Berlin/Gottingen/Heidelberg, Germany, 1956. [Google Scholar]
  26. Stulen, F.B.; Cummings, H.N. A Failure Criterion for Multi-Axial Fatigue Stresses. Proc. ASTM 1954, 54, 822–835. [Google Scholar]
  27. Findley, W.N. Comments on the sessions. Session 2. In Proceedings of the International Conference on Fatigue of Metals, New York, NY, USA, 28–30 November 1956; Institution of Mechanical Engineers: London, UK, 1956. [Google Scholar]
  28. Papuga, J.; Ruzicka, M. Two new multiaxial criteria for high cycle fatigue computation. Int. J. Fatigue 2008, 30, 58–66. [Google Scholar] [CrossRef]
  29. Bomas, H.; Bacher-Hoechst, M.; Kienzler, R.; Kunow, S.; Loewisch, G.; Muehleder, F.; Schroeder, R. Crack initiation and endurance limit of a hard steel under multiaxial cyclic loads. Fatigue Fract. Eng. Mater. Struct. 2009, 33, 126–139. [Google Scholar] [CrossRef]
  30. Papuga, J. Improvements of two criteria for multiaxial fatigue limit evaluation. Bull. Appl. Mech. 2009, 5, 80–86. [Google Scholar]
  31. Papuga, J. Mapping of Fatigue Damages—Program Shell of FE Calculation. Ph.D. Thesis, Czech Technical University in Prague, Prague, Czech Republic, 2005. [Google Scholar]
  32. Charkaluk, E.; Constantinescu, A.; Maïtournam, H.; Dang Van, K. Revisiting the Dang Van criterion. Procedia Eng. 2009, 1, 143–146. [Google Scholar] [CrossRef]
  33. Vantadori, S.; Carpinteri, A.; Luciano, R.; Ronchei, C.; Scorza, D.; Zanichelli, A. Mean stress effect on fatigue life estimation for Inconel 718 alloy. Int. J. Fatigue 2020, 133, 105391. [Google Scholar] [CrossRef]
  34. Vantadori, S.; Vazquez, J.; Zanichelli, A.; Carpinteri, A.; Luciano, R. Structural integrity of shot peened Ti6Al4V specimens under fretting fatigue. Int. J. Fract. 2021, 234, 45–55. [Google Scholar] [CrossRef]
  35. Bernasconi, A.; Foletti, S.; Papadopoulos, I.V. A study on combined torsion and axial load fatigue limit tests with stresses of different frequencies. Int. J. Fatigue 2008, 30, 1430–1440. [Google Scholar] [CrossRef]
  36. Papadopoulos, I.V. Critical plane approaches in high-cycle fatigue: On the definition of the amplitude and mean value of the shear stress acting on the critical plane. Fatigue Fract. Eng. Mater. Struct. 2002, 21, 269–285. [Google Scholar] [CrossRef]
  37. Dowling, N.E. Mean Stress Effects in Stress-Life and Strain-Life Fatigue. SAE Int. J. Adv. Curr. Pract. Mobil. 2004, 32, 1004–1019. [Google Scholar] [CrossRef]
  38. Pallarés-Santasmartas, L. Development of Two Multiaxial Fatigue Methods for Ductile Metals Based on Energy Considerations. Ph.D. Thesis, University of the Basque Country, Leioa, Spain, 2021. [Google Scholar]
  39. Dowling, N.E.; Calhoun, C.A.; Arcari, A. Mean stress effects in stress-life fatigue and the Walker equation. Fatigue Fract. Eng. Mater. Struct. 2009, 32, 163–179. [Google Scholar] [CrossRef]
  40. Li, B.; Reis, L.; de Freitas, M. Comparative study of multiaxial fatigue damage models for ductile structural steels and brittle materials. Int. J. Fatigue 2009, 31, 1895–1906. [Google Scholar] [CrossRef]
  41. O’Connor, H.C.; Morrison, J.L.M. The Effect of Mean Stress on the Push-Pull Fatigue Properties of an Alloy Steel. In Proceedings of the International Conference on Fatigue of Metals, New York, NY, USA, 28–30 November 1956; Institution of Mechanical Engineers: London, UK, 1956; pp. 102–109. [Google Scholar]
  42. Chodorowski, W.T. Fatigue strength in shear of an alloy steel, with particular reference to the effect of mean stress and directional properties. In Proceedings of the International Conference on Fatigue of Metals, New York, NY, USA, 28–30 November 1956; pp. 122–131. [Google Scholar]
  43. Ukrainetz, P.R. The Effect of the Mean Stress on the Endurance Limit. M.Sc. Thesis, The University of Columbia, New York, NY, USA, 1960. [Google Scholar]
  44. Grün, P.; Troost, A.; Akin, O.; Klubberg, F. Langzeitund Dauerschwingfestigkeit des Vergütungsstahls 25CrMo4 bei mehrachsiger Beanspruchung durch dreischwingende Lastspannungen. Mater. Werkst. 1991, 22, 73–80. [Google Scholar] [CrossRef]
  45. Lüpfert, H.P.; Spies, H.J. Fatigue strength of heat-treated steel under static multiaxial compression stress. Adv. Eng. Mater. 2004, 6, 544–550. [Google Scholar] [CrossRef]
  46. Rausch, T. Zum Schwingfestigkeitsverhalten von Gusseisenwerkstoffen unter Einachsiger und Mehrachsiger Beanspruchung am Beispiel von EN-GJV-450. Ph.D. Thesis, Aachen University, Aachen, Germany, 2011. [Google Scholar]
  47. Tovo, R.; Lazzarin, P.; Berto, F.; Cova, M.; Maggiolini, E. Experimental investigation of the multiaxial fatigue strength of ductile cast iron. Theor. Appl. Fract. Mech. 2014, 73, 60–67. [Google Scholar] [CrossRef]
  48. Pallarés-Santasmartas, L.; Albizuri, J.; Avilés, A.; Avilés, R. Mean Stress Effect on the Axial Fatigue Strength of DIN 34CrNiMo6 Quenched and Tempered Steel. Metals 2018, 8, 213. [Google Scholar] [CrossRef]
  49. Pallarés-Santasmartas, L.; Albizuri, J.; Avilés, A.; Saintier, N.; Merzeau, J. Influence of mean shear stress on the torsional fatigue behaviour of 34CrNiMo6 steel. Int. J. Fatigue 2018, 113, 54–68. [Google Scholar] [CrossRef]
  50. Weber, B. Fatigue Multiaxiale des Structures Industrielles sous Chargement Quelconque. Ph.D. Thesis, INSA Lyon, Villeurbanne, France, 1999. [Google Scholar]
  51. Gyekenyesi, J.Z.; Murthy, P.L.N.; Mital, S.K. NASALIFE—Component Fatigue and Creep Life Prediction Program; NASA/TM—2005-213886; NASA Center for Aerospace Information: Hanover, MD, USA, 2005. [Google Scholar]
  52. Davoli, P.; Bernasconi, A.; Filippini, M.; Foletti, S.; Papadopoulos, I. Independence of the torsional fatigue limit upon a mean shear stress. Int. J. Fatigue 2003, 25, 471–480. [Google Scholar] [CrossRef]
  53. Pinho de Castro, J.T.; Meggiolaro, M.A. Fatigue Design Techniques under Real Service Loads: Volume II—Low Cycle Fatigue and Multiaxial Fatigue; CreateSpace Independent Publishing Platform: Scotts Valley, CA, USA, 2016; pp. 613–620. [Google Scholar]
Figure 1. Experimental uniaxial results of Bomas et al. [29] on SAE 52100 steel and theoretical predictions by Findley, Robert, and Papuga criteria.
Metals 14 00964 g001
Figure 2. Values of cA in the Abasolo criterion: (a) κ = 1.25, (b) κ = 1.50, (c) κ = 1.75.
Metals 14 00964 g002
Figure 3. Experimental results of four materials and theoretical predictions by the Findley, Robert, Papuga, and Abasolo criteria: (a) EN-GJV-450 cast iron [46], (b) EN25 steel [41], (c) SAE 52100 steel [29], (d) EN-GJS-400-18 ductile cast iron [47].
Metals 14 00964 g003
Table 1. Expressions and parameters of Findley, Robert, Papuga, and Abasolo criteria.
CriterionEquation (No Failure Condition)Parameter Values
Findley (F) [9] τ n t , a + a F σ n n , a + σ n n , m < d F a F = 1 κ 2 κ 1
d F = σ 1 2 κ 1
Robert (R) [17] τ n t , a + a R σ n n , a + b R σ n n , m < d F a R = a F
b R = σ 1 σ 0 σ 0 4 σ 1 κ 1 + κ 2 1 κ 1
d R = d F
Papuga (P) [28] a P τ n t , a 2 + b P σ n n , a + c P σ n n , m < d P a P = 1 2 κ 2 + κ 4 κ 2 ; f o r   κ 1.155
a P = 4 κ 2 4 + κ 2 2 f o r   κ > 1.155
b P = σ 1 ; f o r   κ 1.155
b P = 8 σ 1 κ 2 4 κ 2 4 + κ 2 2 ; f o r   κ > 1.155  
c P = τ 1 σ 0
d P = σ 1
Abasolo (A) * τ n t , a + a A σ n n , a + s i g n σ n n , m b A σ n n , m c A < d A a A = a F
b A = d A σ u c A
c A = m a x l o g 1 σ 0 4 d a 1 + c o s 2 θ + s i n 2 θ l o g σ 0 4 σ u 1 + c o s 2 θ for 0 θ < π / 2
d A = d F
* See Appendix A for the derivation of the parameters.
Table 3. Comparison of the predictions of the criteria against the complete experimental database.
Complete Database: 485 ExperimentsFindleyRobertAbasoloPapuga
Mean value of the error8.43.53.9−0.6
Standard deviation17.610.39.77.4
Maximum value of the error147.077.343.942.6
Minimum value of the error−38.7−36.4−32.1−36.4
Range of the error185.7113.776.078.9
Mean absolute value of the error12.47.07.25.2
“Accurate” results (error range ± 5%)40.549.649.663.4
“Acceptable” results (error range ± 15%)70.087.486.094.4
Conservative results (error range + 5% + 40%)41.636.036.817.1
Non-conservative results (error range − 5% − 40%)12.613.813.419.3
Table 4. Comparison of the predictions of the methods against experimental pure axial cases.
Pure Axial Cases:
76 Experiments
GoodmanGerberMarinFindleyRobertAbasoloPapuga
Mean value of the error50.39.5−8.48.34.12.6−2.6
Standard deviation109.452.023.228.016.610.410.7
Maximum value of the error596.0268.468.3147.077.338.942.6
Minimum value of the error−39.1−52.9−57.5−38.7−27.4−25.9−36.4
Range of the error635.2321.3125.9185.7104.664.778.9
Mean absolute value of the error58.925.517.619.08.86.67.7
“Accurate” results
(error range ± 5%)
5.326.321.130.361.856.646.1
“Acceptable” results
(error range ± 15%)
26.359.267.150.084.286.889.5
Conservative results
(error range + 5% + 40%)
42.128.913.231.622.431.617.1
Non-conservative results
(error range − 5% − 40%)
21.134.250.026.311.811.835.5
Table 5. Comparison of the predictions of the methods against experimental pure axial cases with high mean stress (0.05 ≤ R < 1).
Pure Axial Cases with High Mean Stress (0.05 ≤ R < 1):
35 Experiments
GoodmanGerberMarinFindleyRobertAbasoloPapuga
Mean value of the error94.818.2−14.918.410.88.0−2.0
Standard deviation147.673.527.735.321.411.214.5
Maximum value of the error596.0268.468.3147.077.338.942.6
Minimum value of the error−32.6−52.9−57.5−38.7−14.9−9.7−36.4
Range of the error628.6321.3125.9185.792.148.678.9
Mean absolute value of the error100.441.224.927.314.09.410.8
“Accurate” results (error range ± 5%)2.911.411.425.745.737.125.7
“Acceptable” results (error range ± 15%)20.040.048.634.374.380.080.0
Conservative results (error range + 5% + 40%)22.931.45.728.637.157.125.7
Non-conservative results (error range − 5% − 40%)14.337.151.420.08.65.745.7
Table 6. Comparison of the predictions of the methods against “no mean stress” cases.
No Mean Stress Cases: 172 ExperimentsFindleyRobertAbasoloPapuga
Mean value of the error1.61.61.61.1
Standard deviation5.05.05.03.7
Maximum value of the error16.116.116.112.4
Minimum value of the error−12.4−12.4−12.4−9.7
Range of the error28.428.428.422.1
Mean absolute value of the error4.14.14.13.1
“Accurate” results (error range ± 5%)70.570.570.581.5
“Acceptable” results (error range ± 15%)98.898.898.8100.0
Conservative results (error range + 5% + 40%)21.421.421.413.9
Non-conservative results (error range − 5% − 40%)8.18.18.14.6
Table 7. Comparison of the predictions of the methods against mean stress cases.
Mean Stress Cases: 313 ExperimentsFindleyRobertAbasoloPapuga
Mean value of the error12.14.65.1−1.5
Standard deviation20.712.111.48.7
Maximum value of the error147.077.343.942.6
Minimum value of the error−38.7−36.4−32.1−36.4
Range of the error185.7113.776.078.9
Mean absolute value of the error17.39.09.36.5
“Accurate” results (error range ± 5%)24.038.038.053.4
“Acceptable” results (error range ± 15%)54.081.278.991.4
Conservative results (error range + 5% + 40%)52.744.145.418.8
Non-conservative results (error range − 5% − 40%)15.016.916.327.5
Table 8. Comparison of the predictions of the methods against experimental cases with high mean stress (0.05 ≤ RvM < 1).
High Mean Stress Cases (0.05 ≤ RvM < 1): 110 EXPERIMENTSFindleyRobertAbasoloPapuga
Mean value of the error19.56.58.2−2.3
Standard deviation27.915.713.211.7
Maximum value of the error147.077.343.942.6
Minimum value of the error−38.7−18.0−16.6−36.4
Range of the error185.795.260.578.9
Mean absolute value of the error25.811.712.19.0
“Accurate” results (error range ± 5%)17.328.227.337.3
“Acceptable” results (error range ± 15%)35.574.569.182.7
Conservative results (error range + 5% + 40%)43.647.355.524.5
Non-conservative results (error range − 5% − 40%)17.321.816.437.3
Table 9. Comparison of the predictions of the methods against the Mean Stress effect for pure torsional loading cases.
Mean Stress Cases, Pure Torsion: 33 ExperimentsFindleyRobertAbasoloPapuga
Mean value of the error−0.7−4.7−5.4−7.5
Standard deviation11.06.35.68.3
Maximum value of the error29.15.85.47.7
Minimum value of the error−31.0−18.0−16.6−31.3
Range of the error60.123.722.039.0
Mean absolute value of the error7.45.95.98.1
“Accurate” results (error range ± 5%)54.551.545.545.5
“Acceptable” results (error range ± 15%)87.990.993.984.8
Conservative results (error range + 5% + 40%)24.23.03.03.0
Non-conservative results (error range − 5% − 40%)21.245.551.551.5
Disclaimer/Publisher’s Note: The statements, opinions and data contained in all publications are solely those of the individual author(s) and contributor(s) and not of MDPI and/or the editor(s). MDPI and/or the editor(s) disclaim responsibility for any injury to people or property resulting from any ideas, methods, instructions or products referred to in the content.

