Article

Mechanical, Corrosion and Wear Characteristics of Cu-Based Composites Reinforced with Zirconium Diboride Consolidated by SPS

1
Institute of Technology, University of the National Education Commission, Krakow, Podchorazych 2 St., 30-084 Krakow, Poland
2
Faculty of Non-Ferrous Metals, AGH University of Krakow, Mickiewicza 30 Av., 30-059 Krakow, Poland
3
Łukasiewicz Research Network–Institute of Non-Ferrous Metals, Pilsudskiego 19 St., 32-050 Skawina, Poland
*
Authors to whom correspondence should be addressed.
Metals 2024, 14(9), 974; https://doi.org/10.3390/met14090974
Submission received: 26 July 2024 / Revised: 23 August 2024 / Accepted: 24 August 2024 / Published: 28 August 2024
(This article belongs to the Special Issue Feature Papers in Metal Matrix Composites—2nd Edition)

Abstract

:
This study aimed to investigate the physical, mechanical, corrosion, and tribological properties of Cu-based composites with varying zirconium diboride content. The composites were successfully consolidated using spark plasma sintering (SPS) at temperatures of 850 °C and 950 °C and a pressure of 35 MPa. The effect of the ZrB2 content and the sintering temperature on the properties of the Cu-based composites was investigated. Scanning electron microscopy (SEM), electron backscatter diffraction (EBSD), and X-ray diffraction were used to analyse microstructure evolution in copper matrix composites. Microhardness tests were used to evaluate mechanical properties. Wear behaviour was evaluated using a ball-on-disc method. Corrosion properties were estimated on electrochemical tests, such as potentiodynamic polarisation. The results demonstrated an enhancement in the density and porosity of the composites as the sintering temperature increased. A uniform dispersion of ZrB2 was observed in the copper matrix for all composites. With an increase in the content of the ZrB2 reinforcement phase, there was an increase in microhardness and an improvement in the wear resistance of the sintered composites. A reduction in densification and corrosion resistance of Cu-based composites was observed with increasing ZrB2 content.

1. Introduction

Pure copper is widely used for electrical and electronic equipment due to its excellent electrical conductivity and high resistance to corrosion [1]. Due to its low hardness, mechanical strength, and wear resistance, the expansion of the use of copper in demanding applications is limited [2]. On the one hand, pure copper is strengthened by introducing alloying additives. However, introducing an alloying additive reduces the electrical conductivity of copper [3,4]. Therefore, a second alternative is copper matrix composite materials. They are promising materials for various engineering applications in the electronics, energy, automotive, and manufacturing industries, where good electrical and thermal conductivity, good strength and corrosion properties, and microstructural stability are required [5,6,7]. The development of copper matrix composites is primarily based on using suitable ceramic as a reinforcing phase. The choice of reinforcing material is determined by its properties, such as hardness, wear resistance, corrosion and oxidation resistance, good chemical stability, price, and availability on the market [8,9,10]. The ceramic particles used in copper matrix composites are oxides (Al2O3, Y2O3, TiO2, and ZrO2 [7,11,12,13]), carbides (SiC, TiC, NbC, and B4C [14,15,16,17]), nitrides (Si3N4, AlN, and TiN [18,19,20]), and borides (TiB2, ZrB2, and CrB2 [21,22,23,24]). The consequence of introducing ceramic particles is to improve the strength and tribological properties of copper matrix composites. Cu-based composites have a wide range of applications in the automotive, military, electrical, and electronic industries and as heat exchangers in power plants. In particular, Cu-based composites are used to produce electrodes for electrical spot welding, electrical contacts and high-performance switches, heat exchangers, connecting wires for high-speed trains, and lead frames of semiconductors [7,10,15,18,25].
The corrosion properties of composite materials are a crucial aspect of their evaluation in technical applications. Metal-based composites with a ceramic reinforcing phase are characterised by a complex microstructure that may favour the formation of corrosion microcells between different phases. A significant problem in these materials is the presence of micropores and discontinuities at the boundary between the matrix and the reinforcement phase [26]. Electrolytes can penetrate micropores, which leads to increased reaction surface and acceleration of corrosion processes. The penetrating electrolyte increases the surface area susceptible to oxidation, and corrosion products can accumulate in the pores, causing crevice corrosion. The accumulation of corrosion products at these discontinuities can also promote the development of pitting and intergranular corrosion of the material used as the matrix. Due to these phenomena, the study of the corrosion properties of composite materials is critical. Considering the problems related to the decrease in the corrosion resistance of composites, it seems reasonable to use a metal or alloy with increased resistance as a matrix. As mentioned above, this role can be played by copper, a material with excellent corrosion resistance often used in corrosive environments [27].
Tribological wear is caused by friction processes in which the properties of the contact areas’ mass, structure, and surface layer are altered. The intensity of tribological wear depends on the type of tribological pair and the type of interaction under operating conditions [28]. According to the literature [29,30,31,32,33,34], research was carried out on the influence of various ceramic particles (TiB2, TiC, Al2O3, SiC, WS2, and MoS2) on the tribological properties of copper-based composites. The authors focused mainly on research on the influence of the reinforcing phase on the physical, mechanical, and tribological properties of composites. According to data from the literature, introducing a ceramic phase into the copper matrix improves the wear resistance of composites. This was confirmed by the research of Zhou et al. [30] on the tribological properties of Cu−WS2 composites. It was shown that the friction coefficient increases gradually, and the wear rate increases dramatically as the particle size of WS2 decreases from 5.0 to 0.6 µm. In turn, Fan et al. [35] showed that, as the ZrB2 content increased, the hardness and abrasion resistance of the composites increased. At the same time, the electrical conductivity of the composites decreased. In another work [32], the influence of different amounts of TiC reinforcing phase on the wear resistance of sintered composites was determined using the pin-on-disc method. As research has shown, the wear resistance of composites improves with increasing volume fraction of the reinforcing phase. According to the authors, ceramic particles enhance the hardness of the matrix and consequently reduce the actual wear surface.
The above review illustrates that incorporating ceramic additives into copper can influence various properties. Equally important is the synthesis method used for Cu-based composites, as it plays a crucial role in determining the final material quality. In this context, our research focused on developing a synthesis technique for copper-based composites using the spark plasma sintering (SPS) method. We investigated the effects of varying ZrB2 content (5–20 wt%) and sintering temperatures (850 °C and 950 °C) on the resulting Cu-based composites’ densification, mechanical, corrosion, and tribological properties.

2. Materials and Methods

Pure copper powder (approximately 10 μm in size; 99.9 wt% purity) and ZrB2 powder (2.5–5.5 μm in size; 99.9 wt% purity) were used to produce Cu-based metal matrix composites. The ZrB2 particles were added to the Cu powders by weight in 5, 10, 15, and 20%. The powder mixtures were prepared using a planetary ball mill (Fritsch Pulverisette 6, Birkenfeld, Germany) with a rotation speed of 200 rpm for 10 h. The composite powders were poured into a 20 mm diameter graphite die and sintered using an SPS system (LSP-100, Laboratory Sintering Press Dr. Fritsch GmbH, Fellbach, Germany) under an argon atmosphere. The sintering was carried out at temperatures of 850 °C and 950 °C, a pressure of 35 MPa, and a time of 300 s. After sintering, the samples were 7–8 mm in height and 20 mm in diameter (Figure 1).
The density of the sintered composites was determined using the Archimedes immersion method in water [36]. An analytical balance RADWAG AS 220/C/2 (Radwag, Radom, Poland) was used to measure the weight of the sinters. Apparent density (ρ) and open porosity (Po) were calculated according to the relevant standards [36]. The apparent density was calculated according to the following:
ρ = m 1 m 1 m 2 ρ L
The open porosity was calculated according to the following:
P o = m 3 m 1 m 3 m 2 100 %
where:
m1—mass of the dry sample (g);
m2—apparent mass of the immersed sample (g);
m3—mass of the sample saturated with liquid (g);
ρL—density of water (g/m3).
Hardness measurements were made with a Vickers hardness tester (NEXUS 4000, Innovatest Europe BY., Maastricht, The Netherlands) under a load of 2.942 N and a hold time of 10 s. Each sample was tested with 10 points. The measurement error did not exceed 2%.
Samples for microstructural analysis were prepared using standard methods of mechanical grinding using SiC foil (400÷2000 gradation) and polishing using diamond suspension (3 and 1 μm) and MD-Mol discs. The examined samples were then chemically etched. Composites were characterised by scanning electron microscopy (SEM) using Jeol JSM 6610 LV (Akishima, Tokyo, Japan) with energy-dispersive spectroscopy (EDS). Additionally, the microstructure of the composites was characterised using high-resolution scanning electron microscopy (Inspect F50 FEI, Hillsboro, OR, USA) with electron backscatter diffraction (EBSD) analysis. The samples were tilted 70° from the horizontal to collect EBSD data at an accelerating voltage of 20 kV and a beam current of 200 mA. EBSD analysis was performed using TSL OIM software (Ametek, Berwyn, PE, USA) and a PDF ICCD 2011 database format. X-ray diffraction (XRD) measurements were carried out to identify the phases in the sintered samples using an Empyrean Panalytical (Malvern, United Kingdom) diffractometer equipped with Cu/Kα radiation.
Wear resistance tests of sintered Cu + ZrB2 composites were carried out using the ball-on-disc method on a universal tribotester from ELBIT Innovation—Implementation Company (Tarnów, Poland) according to the standard [37]. Three tests were performed for each sintered material. The tests were conducted under dry friction conditions at 22 °C, with a load of 5 N, a sliding speed of 0.1 m/s, a sliding distance of 1000 m, and a time of 10,000 s. A counter-sample made of bearing steel (AISI52100; diameter of 3.175 mm) was used. During the test, each sample interacted with the new ball surface. Before the tests, balls and samples were washed in ethyl alcohol in an ultrasonic washer and weighed on a RADWAG AS 220/C/2 scale. The final mass after the ball-on-disc test was also weighed for each sample. Mass loss (Δm) was calculated based on the formula [38]:
Δ m = m o m k m o 100 %
where:
mo—initial mass (g);
mk—final mass (g).
The wear tracks were analysed in the next stage using an OLYMPUS LEXT OLS5100 (Tokyo, Japan) confocal microscope with OLS5100-Analysis Application software Ver. 2.2.3 dedicated to surface analysis. According to the standard [36], the wear profile was measured in four places and the wear volume of the disc sample was calculated (Figure 2). The wear rate (Wv) was calculated based on the formula:
W V ( d i s c ) = V d i s c F n * L
where:
Fn—applied load (N);
Vdisc—wear volume of disc specimen (mm3);
L—sliding distance (m).
The corrosion test was carried out using a 3.5 wt% NaCl solution. A conventional three-electrode system was applied with Ag/AgCl (3M KCl) as a reference electrode and a platinum sheet as a counter electrode. The samples were mounted horizontally and sealed with an 8 mm O-ring, and the sample mounted this way had an active surface of 0.503 cm2. The examined surface was polished on a P800 grid of abrasive paper and cleaned in an ultrasonic water bath before each experiment. All measurements were conducted at room temperature (22 ± 3 °C) in a naturally aerated solution. The experiments were controlled with a potentiostat AUTOLAB PGSTAT128 (Metrohm AG, Herisau, Switzerland). The potentiodynamic polarisation scan was performed at a scan rate of 1 mV/s from −0.25 V vs. the open-circuit potential (OCP) to a potential where the current density reaches 5 mA/cm2. Before each polarisation test, a sample was conditioned for 900 s in the solution to obtain the OCP value.

3. Results

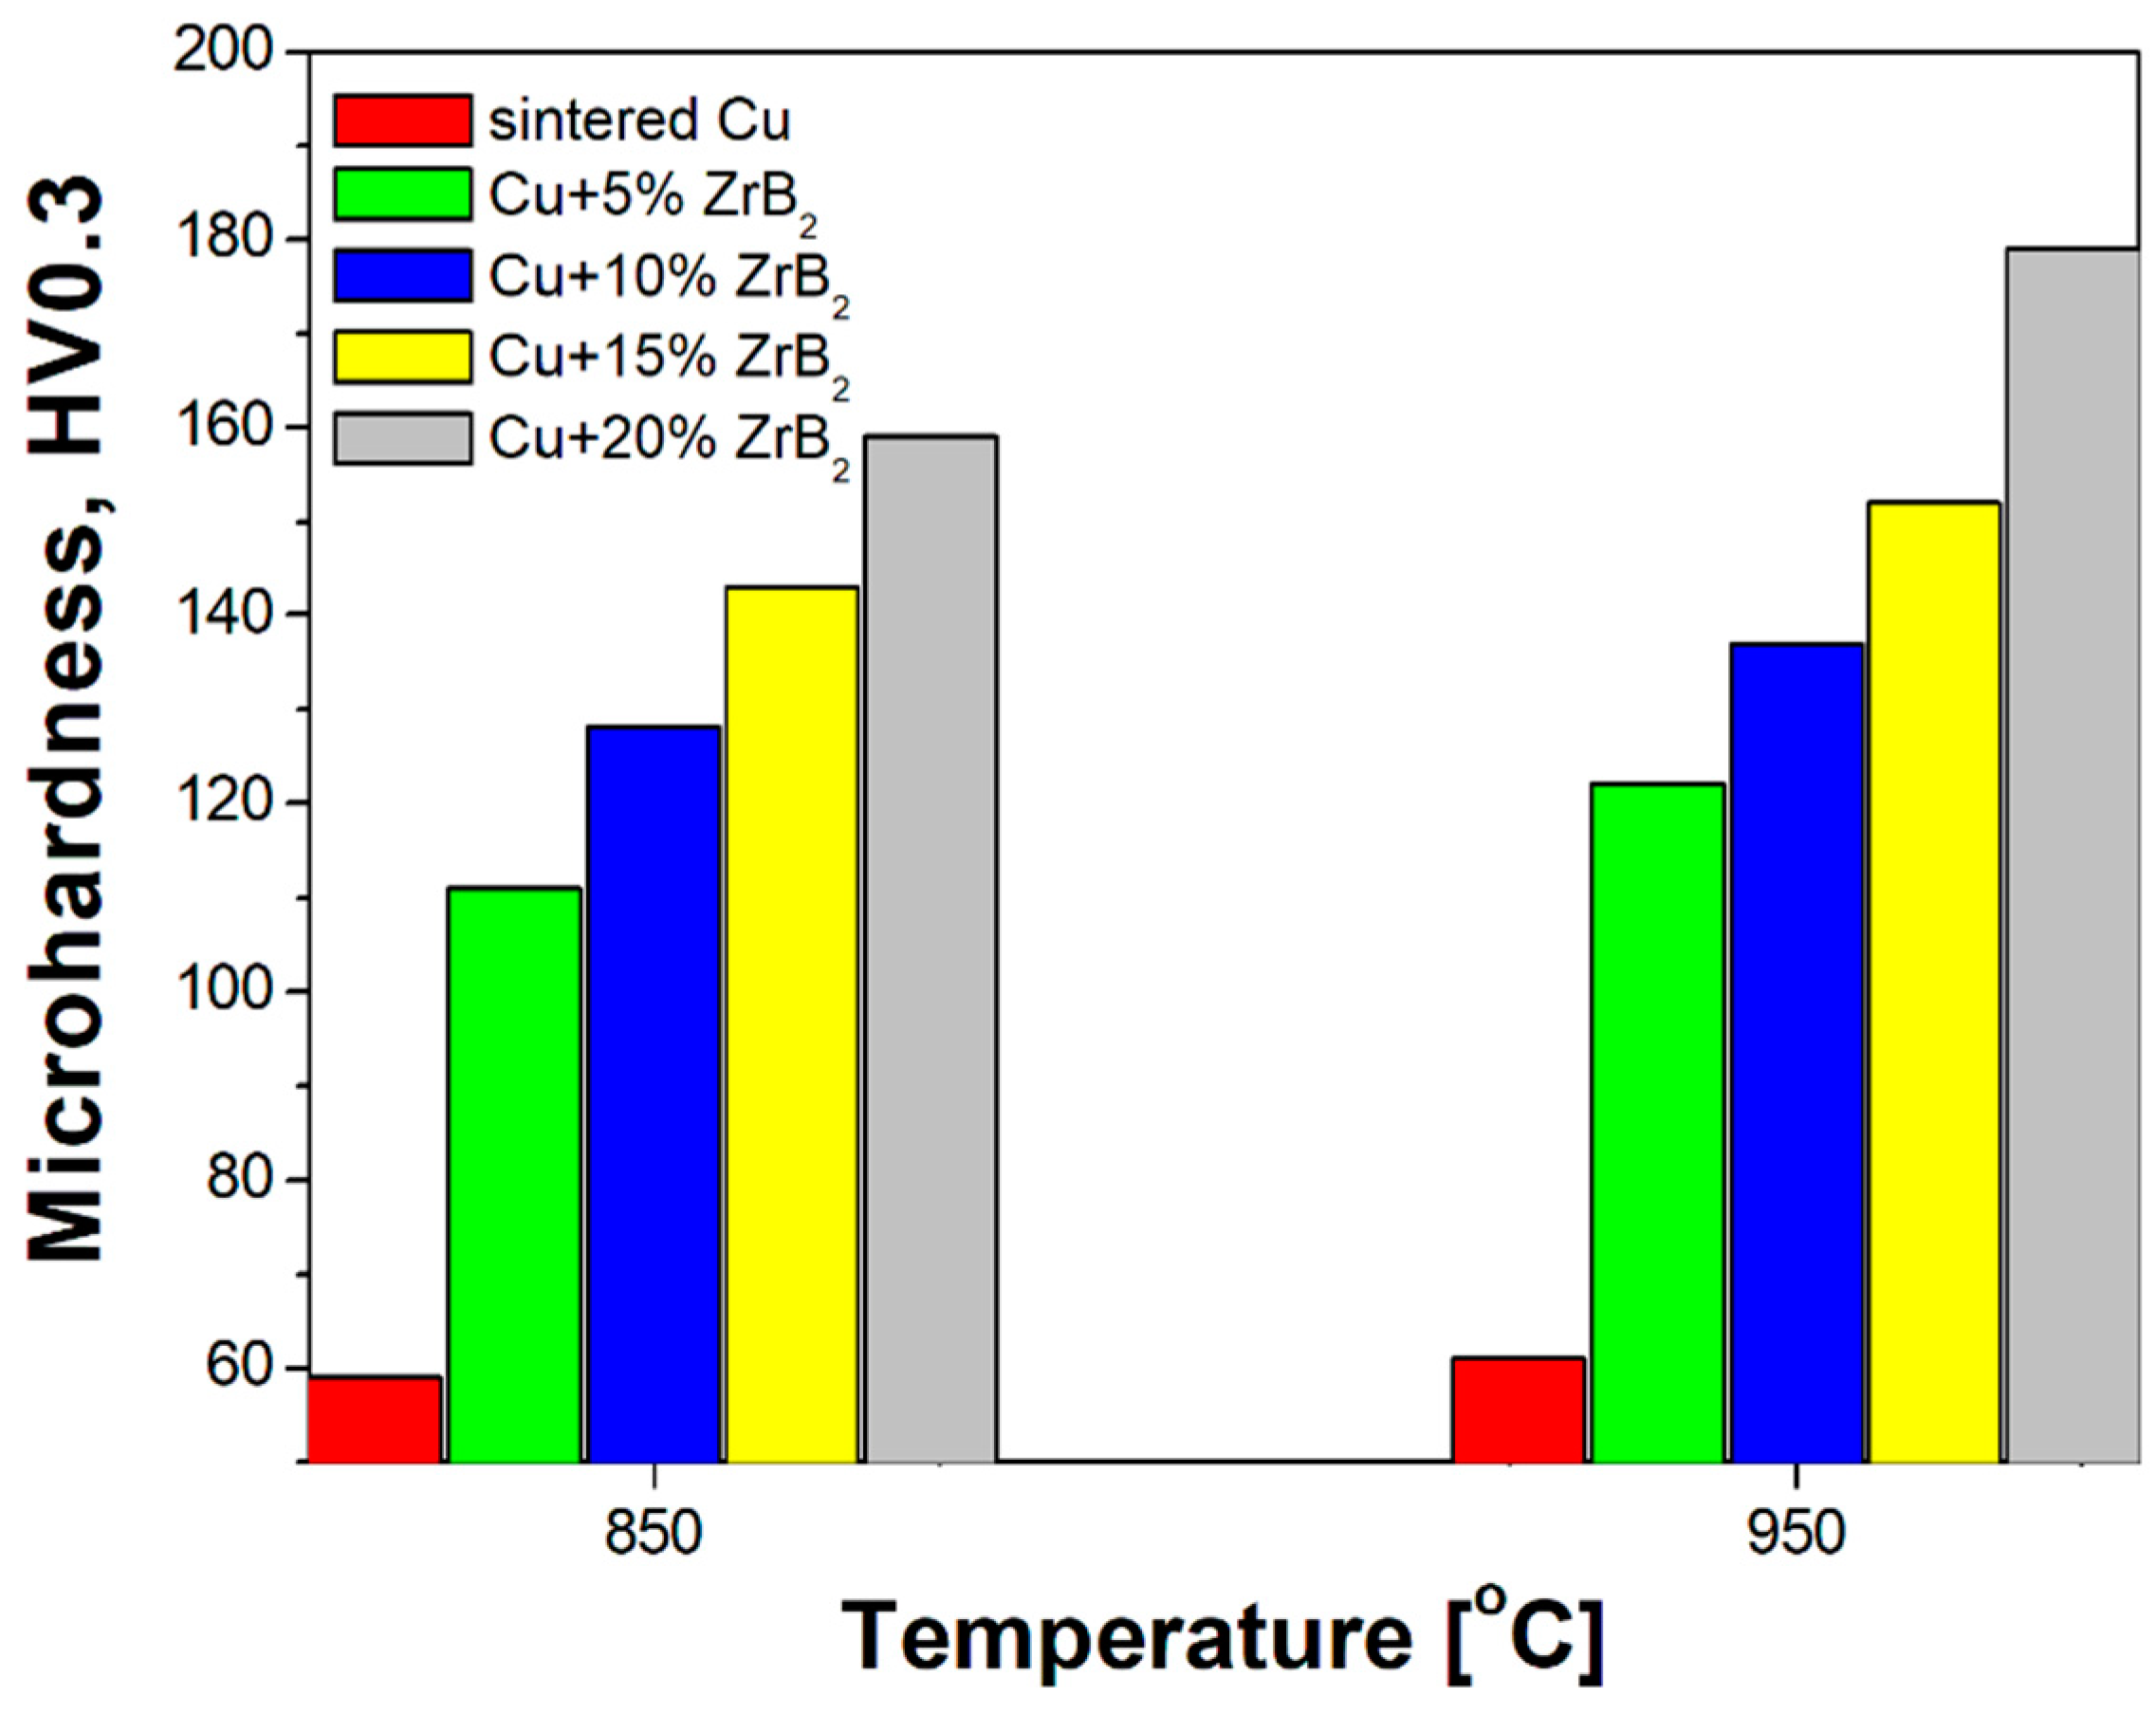
3.1. Physical and Mechanical Properties

Figure 3 shows the apparent density and open porosity results for copper matrix composites with different weight percentages of ZrB2 as a function of temperature. The apparent density gradually decreases as the amount of ZrB2 increases. The apparent density gradually decreases with increasing ZrB2 content. Wang et al. [39] observed a similar trend in their research. They produced Cu–ZrB2 composites using a hot-pressing sintering process at 840 °C. A decrease in density was found (from 96.1 to 91.3%) when the ZrB2 content was changed (1–9 wt%). Zang et al. [40] prepared Cu–5 wt.%ZrB2 composites using hot-pressed sintering. They showed that relative density increased from 84 to 95% with the sintering temperature (760 °C to 920 °C). The difference in the apparent density of ZrB2 and copper can explain this relationship. According to the literature [2,41], ZrB2 ceramics have a lower apparent density (6.10 g/cm3) compared to copper (8.96 g/cm3). The results also indicated the dependence of density and open porosity on the sintering temperature. Composites produced at a temperature of 850 °C have a relative density of 87–95% of the theoretical density and open porosity in the range of 2.1–11.5% (for 5–20% ZrB2). For higher ZrB2 contents (from 10 wt%), the open porosity is greater than 9%. This result suggests that pores are not eliminated during sintering at 850 °C. This results in a decrease in relative density. The test results indicate that the temperature of 850 °C is inadequate to obtain a high degree of consolidation of Cu + ZrB2 composites. Increasing the temperature by 100 °C improved the relative density and reduced open porosity. For the temperature 950 °C, the best relative density of 93–97% of the theoretical density was achieved. The open porosity is in the range of 1.2–3.8%. It should be noted that, regardless of the sintering temperature, the relative density of pure sintered copper is above 98% of the theoretical density.
The results of the Vickers microhardness measurements of the sintered copper and Cu + ZrB2 composites are shown in Figure 4. Microhardness increases with increasing ZrB2 content in the copper matrix. The highest microhardness values were obtained for composites containing 20% ZrB2. In comparison, the microhardness of pure copper is 61.4 HV0.3. Adding a 20% reinforcement phase resulted in an almost 3-fold increase in microhardness to values of 162 HV0.3 and 179 HV0.3 for sintering temperatures of 850 °C and 950 °C, respectively. Improvement in microhardness can be attributed to the high hardness of ZrB2 ceramics (above 22 GPa [41]) and the uniform distribution of ZrB2 in the copper matrix. Shaik [6] and Pouyani [42] observed a similar relationship between an improvement in hardness and an increase in the reinforcement-phase ZrB2. The analysis of the results (Figure 4) shows a negligible effect of the sintering temperature on the microhardness of the composites.
In general, higher microhardness values were obtained at 950 °C. This increase is approximately 10% compared to the microhardness of all Cu + ZrB2 composites sintered at a lower temperature, i.e., 850 °C. Wang et al. [42] produced Cu composites with various ZrB2 contents (1–9 wt%) by hot sintering. They showed that the microhardness of pure copper (57.5 HV0.2) was increased to 100.8 HV0.2 with an increase in the ZrB2 content to 7 wt%. The addition of 9 wt% ZrB2 to the copper matrix resulted in a decrease in microhardness to 82 HV0.2. Similarly, Zang et al. [40]
] prepared Cu–5 wt.%ZrB2 composites using hot-pressed sintering. They reported that, by increasing the sintering temperature to 840 °C, the microhardness of the composite continuously increased to the maximum value of 92 HV0.2 and then decreased to 85 HV0.2 with further increase in the sintering temperature (to 920 °C). In turn, Bagheri [32] showed that the hardness of the composites improved with an increase in the percentage prepared of TiC particles. Hardness enhanced from 43 to 285 HV1 for the copper and copper-36 vol% TiC composite, respectively. The increase in hardness is explained by the formation of TiC nanoparticles during the in situ process, their uniform distribution in the copper matrix, and the Orowan strengthening mechanism.

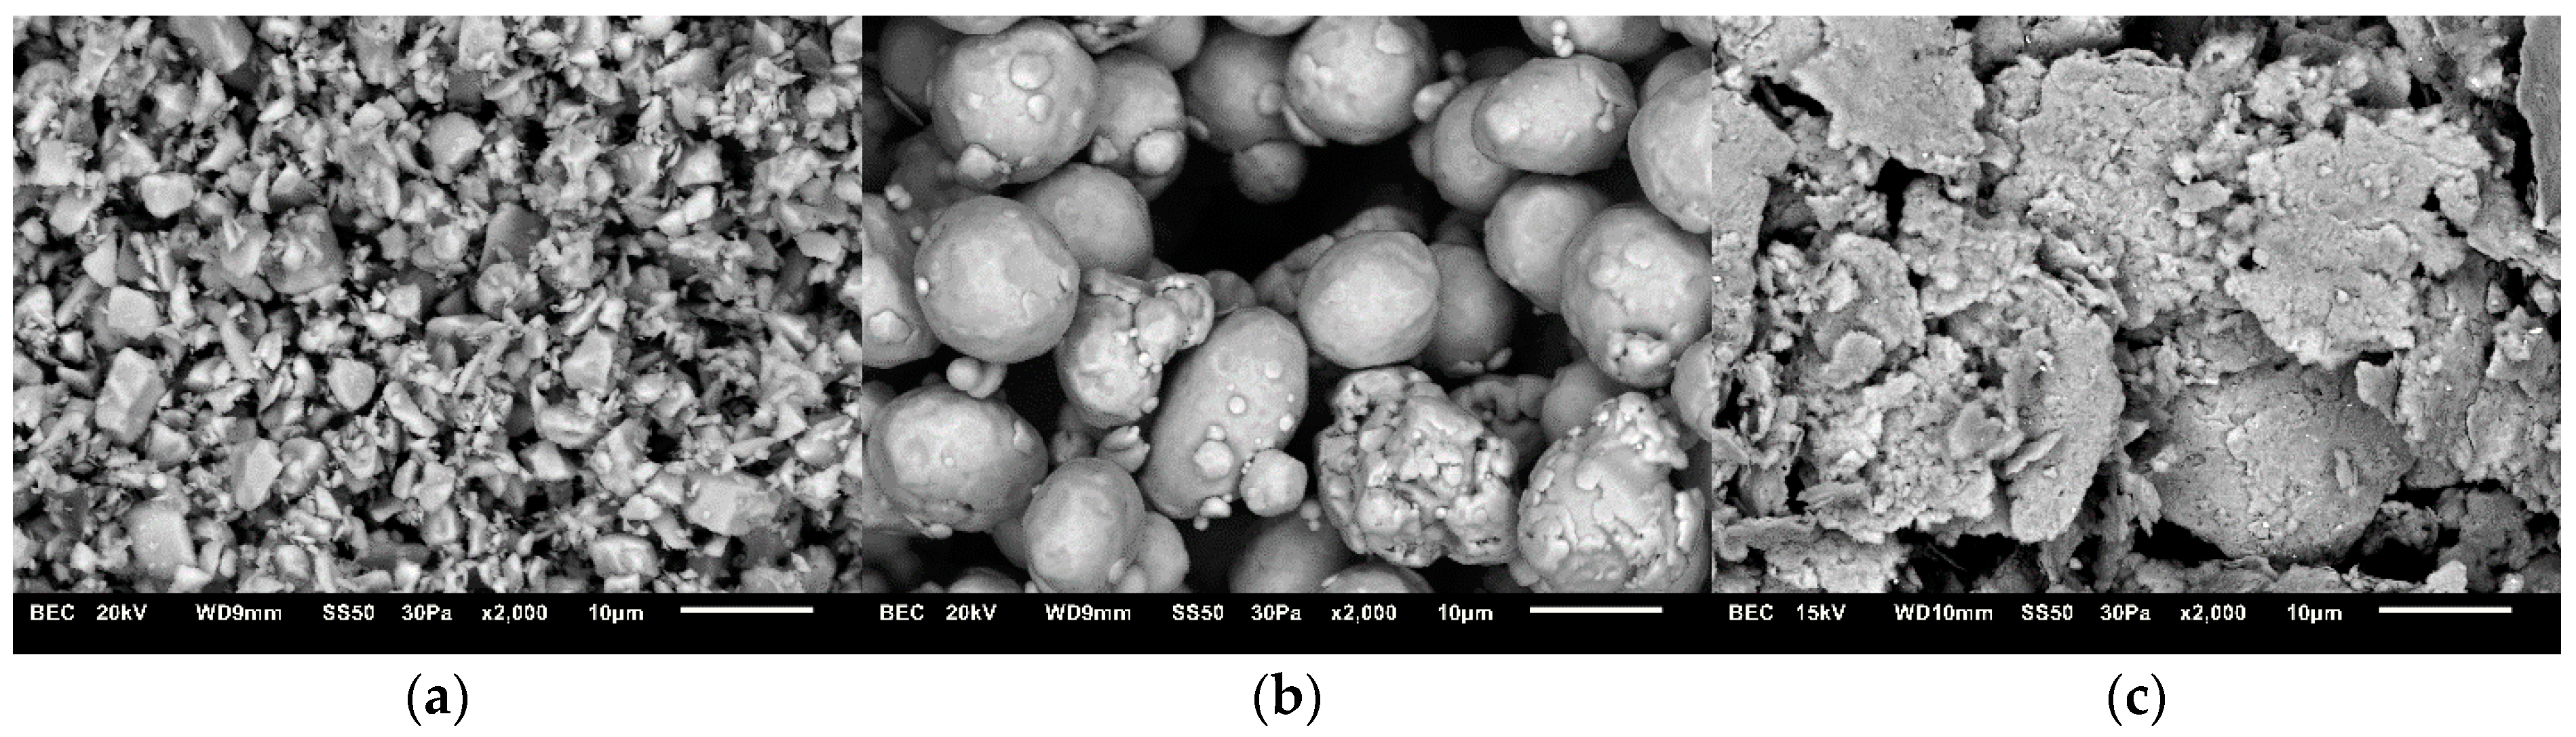
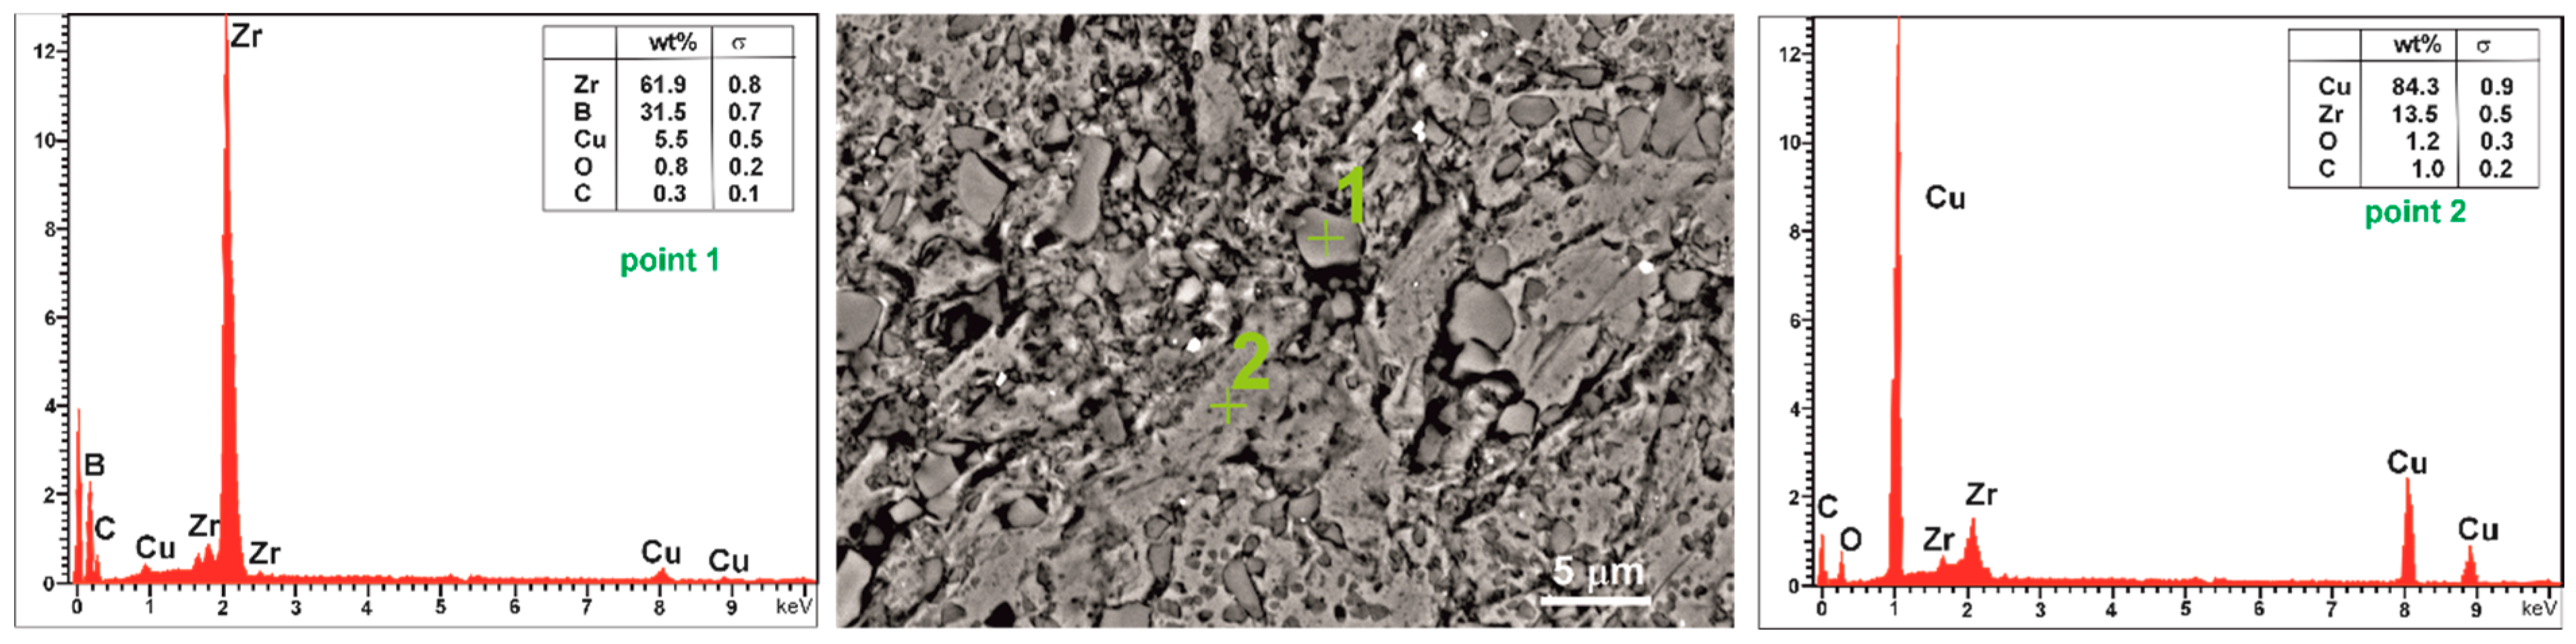
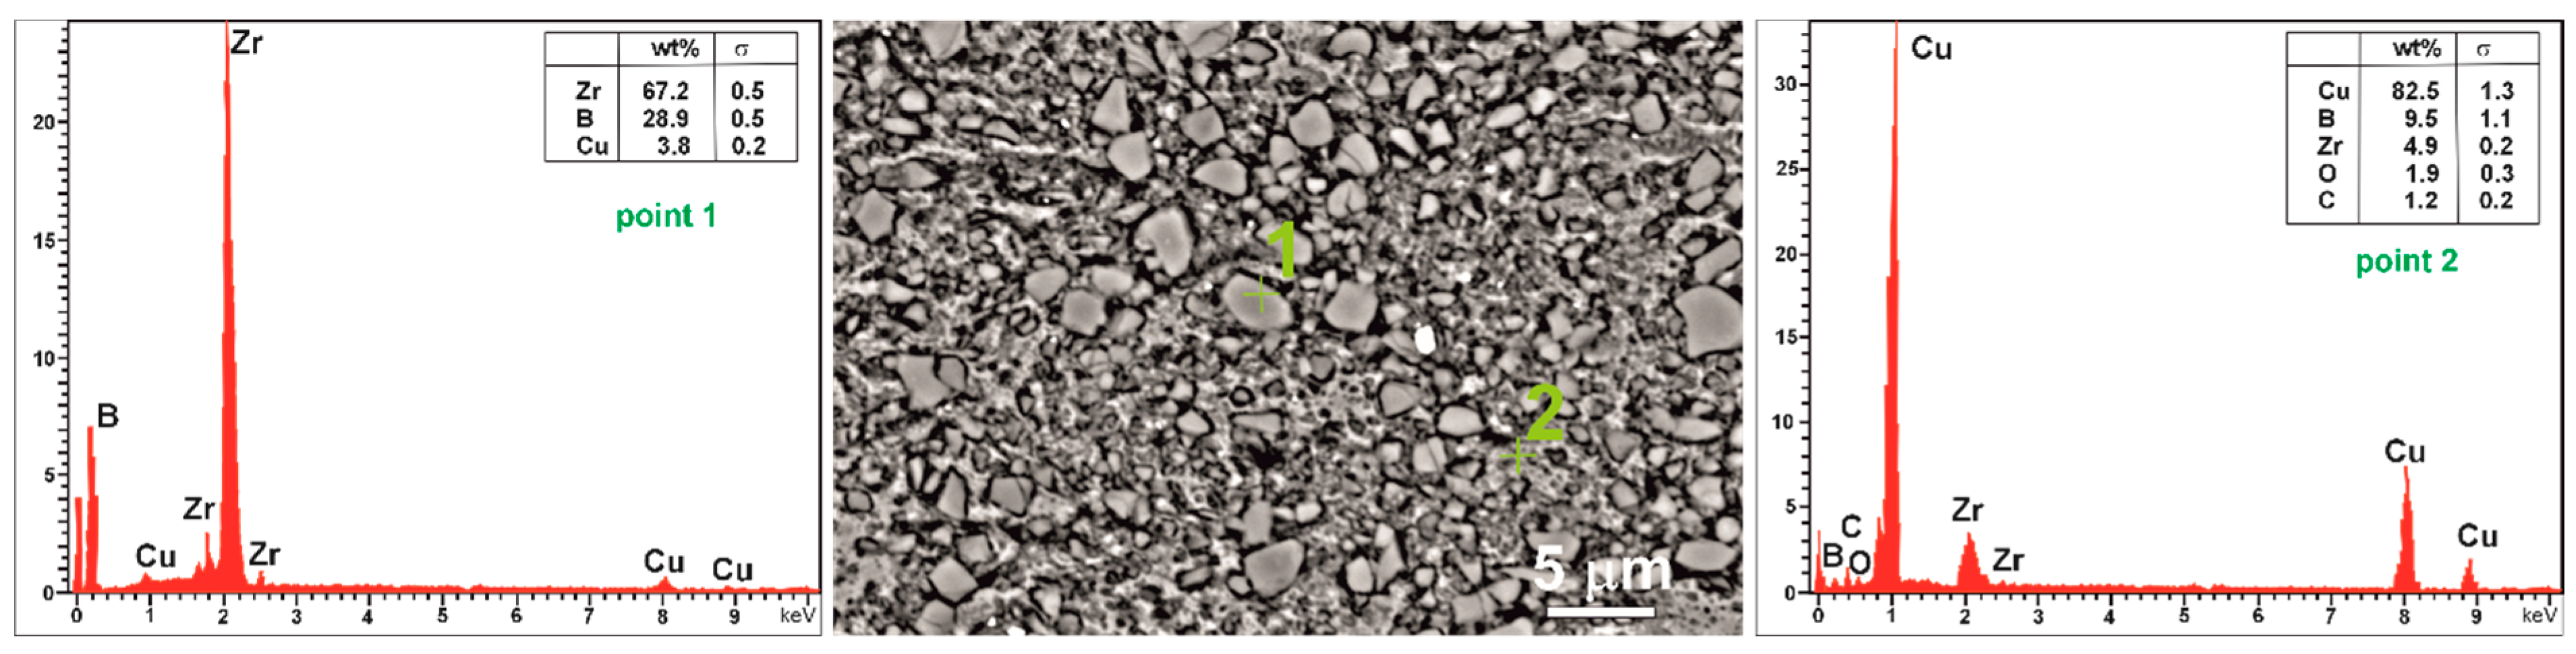
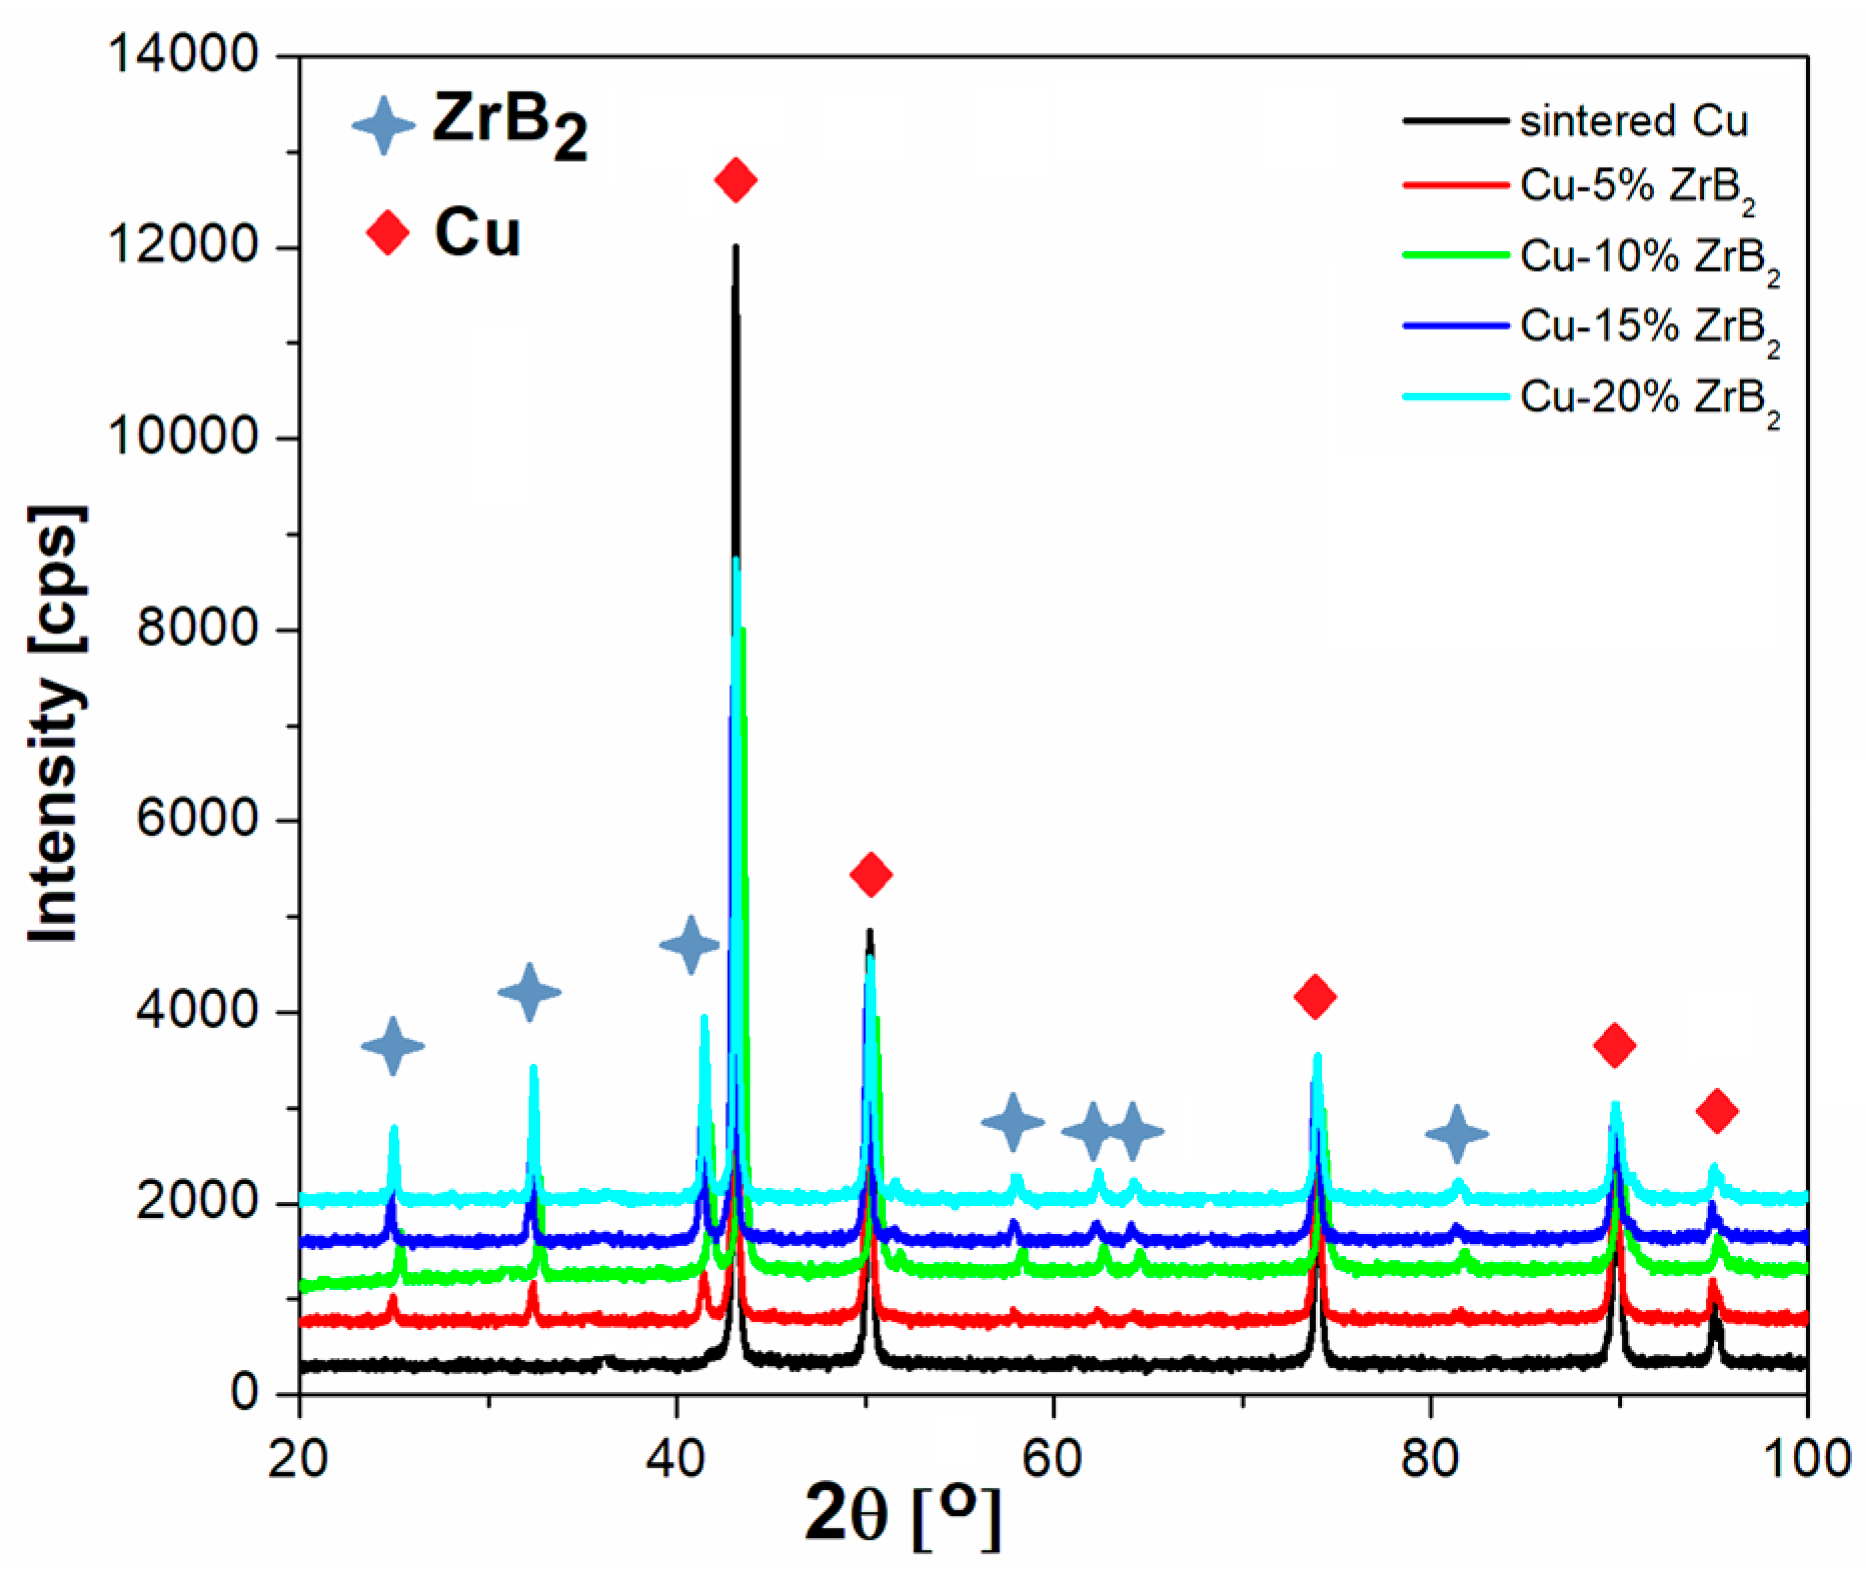
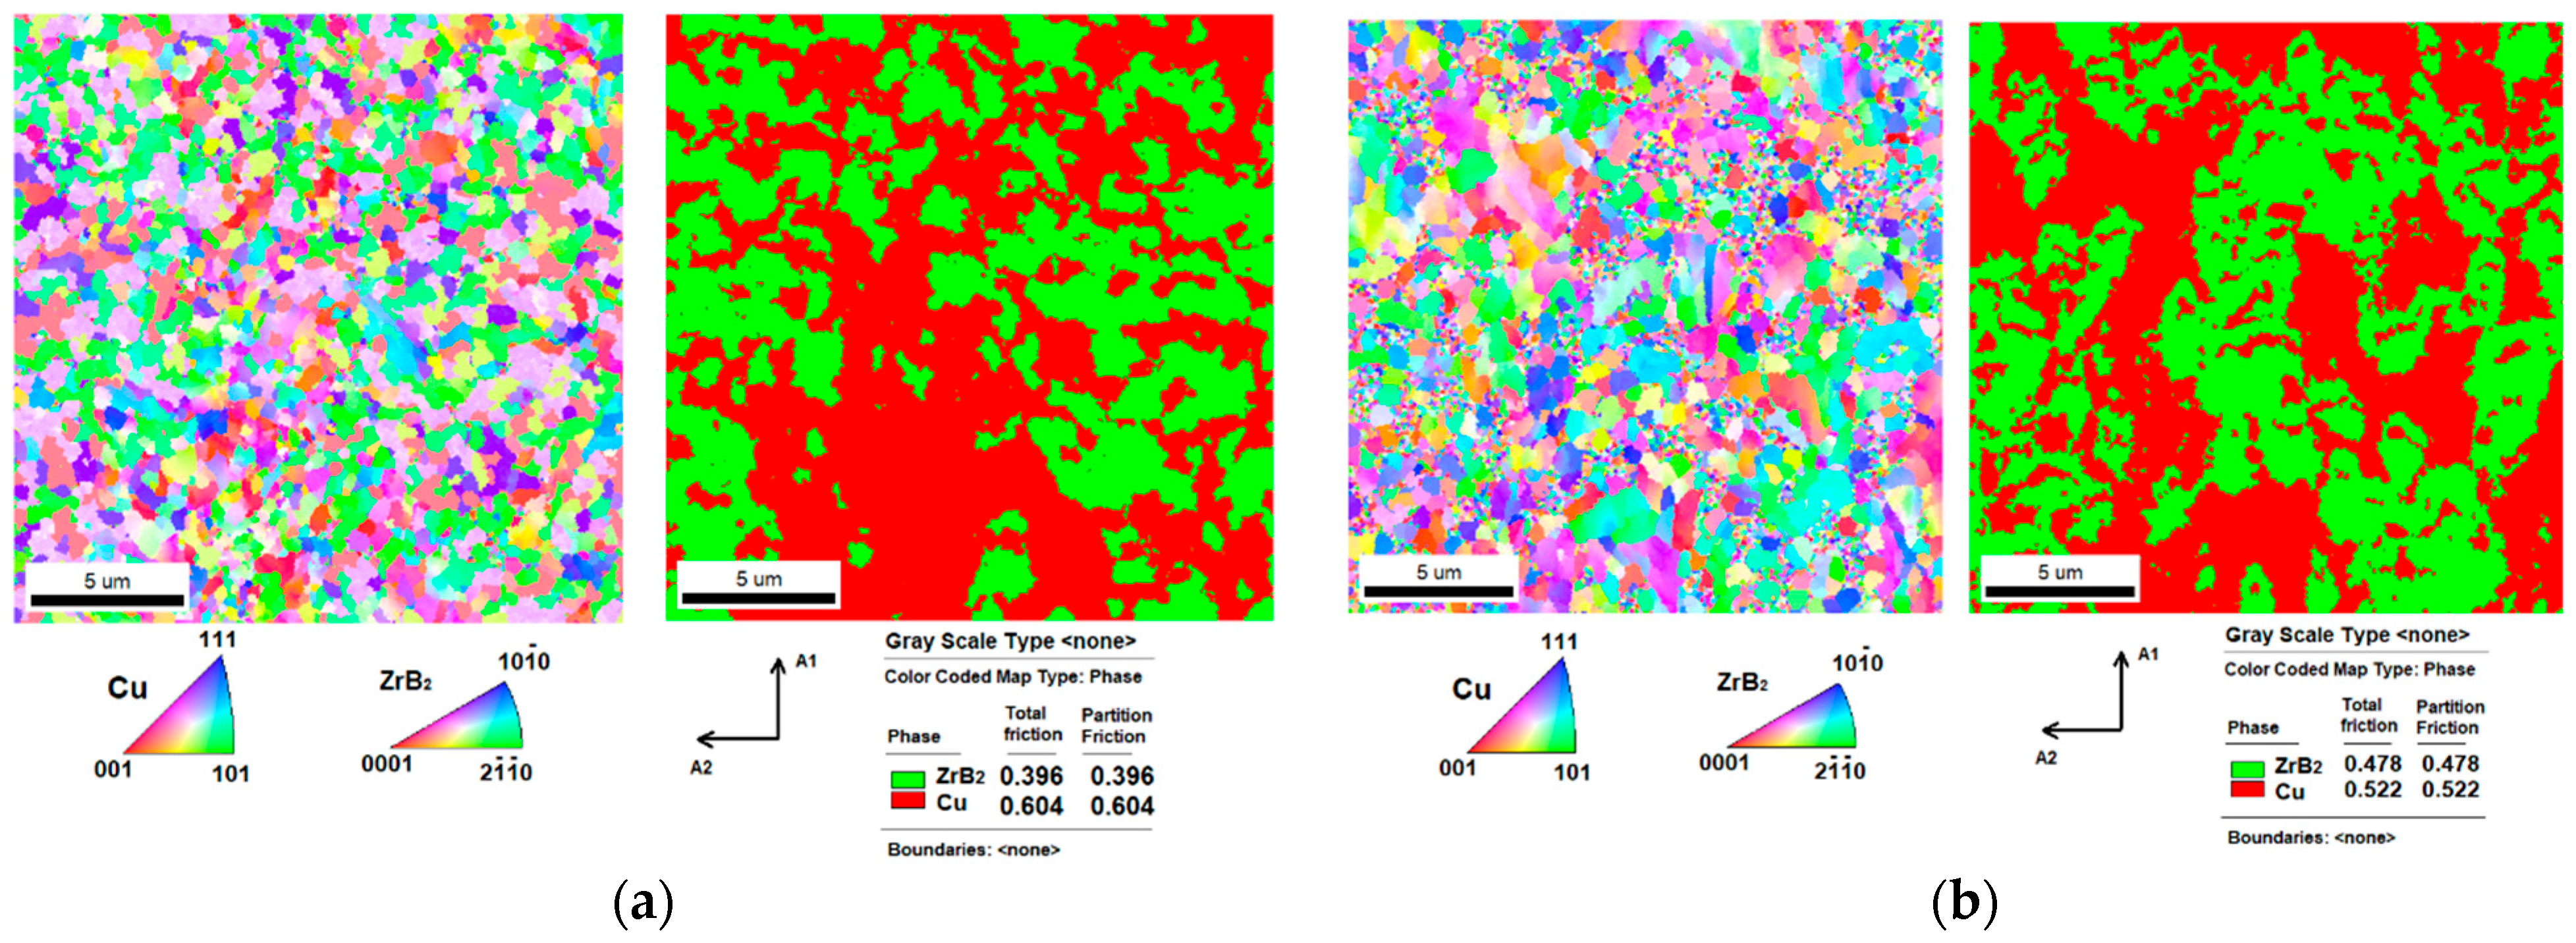
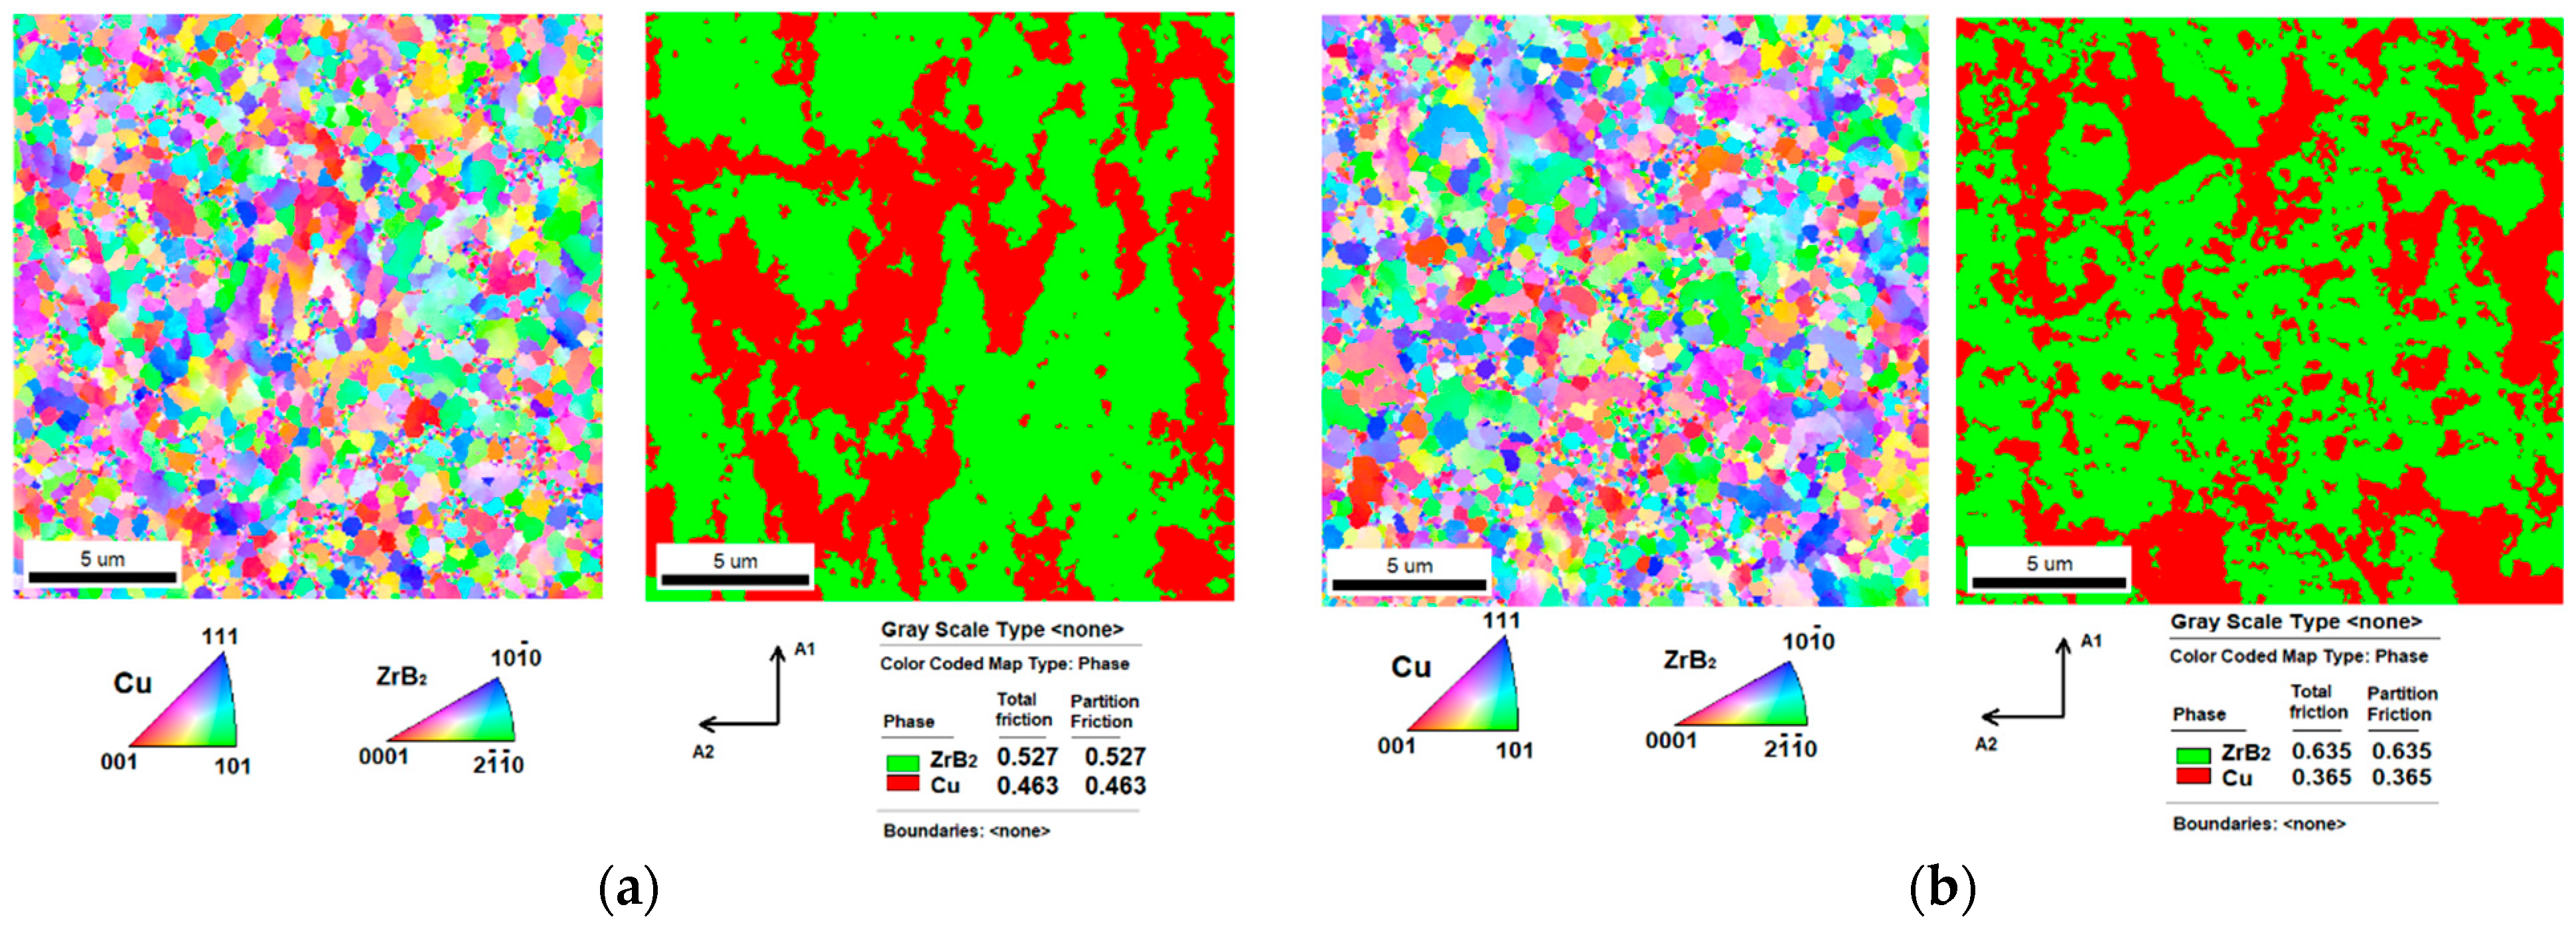
3.2. Microstructures

Figure 5 and Figure 6 show the results of the microstructural tests of Cu + ZrB2 composites sintered at 950 °C with EDS chemical composition analysis. The EDS profiles (point 1, Figure 4 and Figure 5) show peaks of copper (Cu), zirconium (Zr), and boron (B), confirming the presence of the ZrB2 reinforcing phase in the copper matrix. ZrB2 particles are uniformly distributed in the matrix, and their agglomeration was not observed. Furthermore, no micro- or macrocracks were observed in the Cu + ZrB2 composites. The results of the EDS analyses were confirmed by phase composition studies using the X-ray (Figure 7) and EBSD technique (Figure 8 and Figure 9). Based on EBSD phase analyses, the presence of the following phases in the microstructure of the sintered composites was confirmed: Cu and ZrB2.

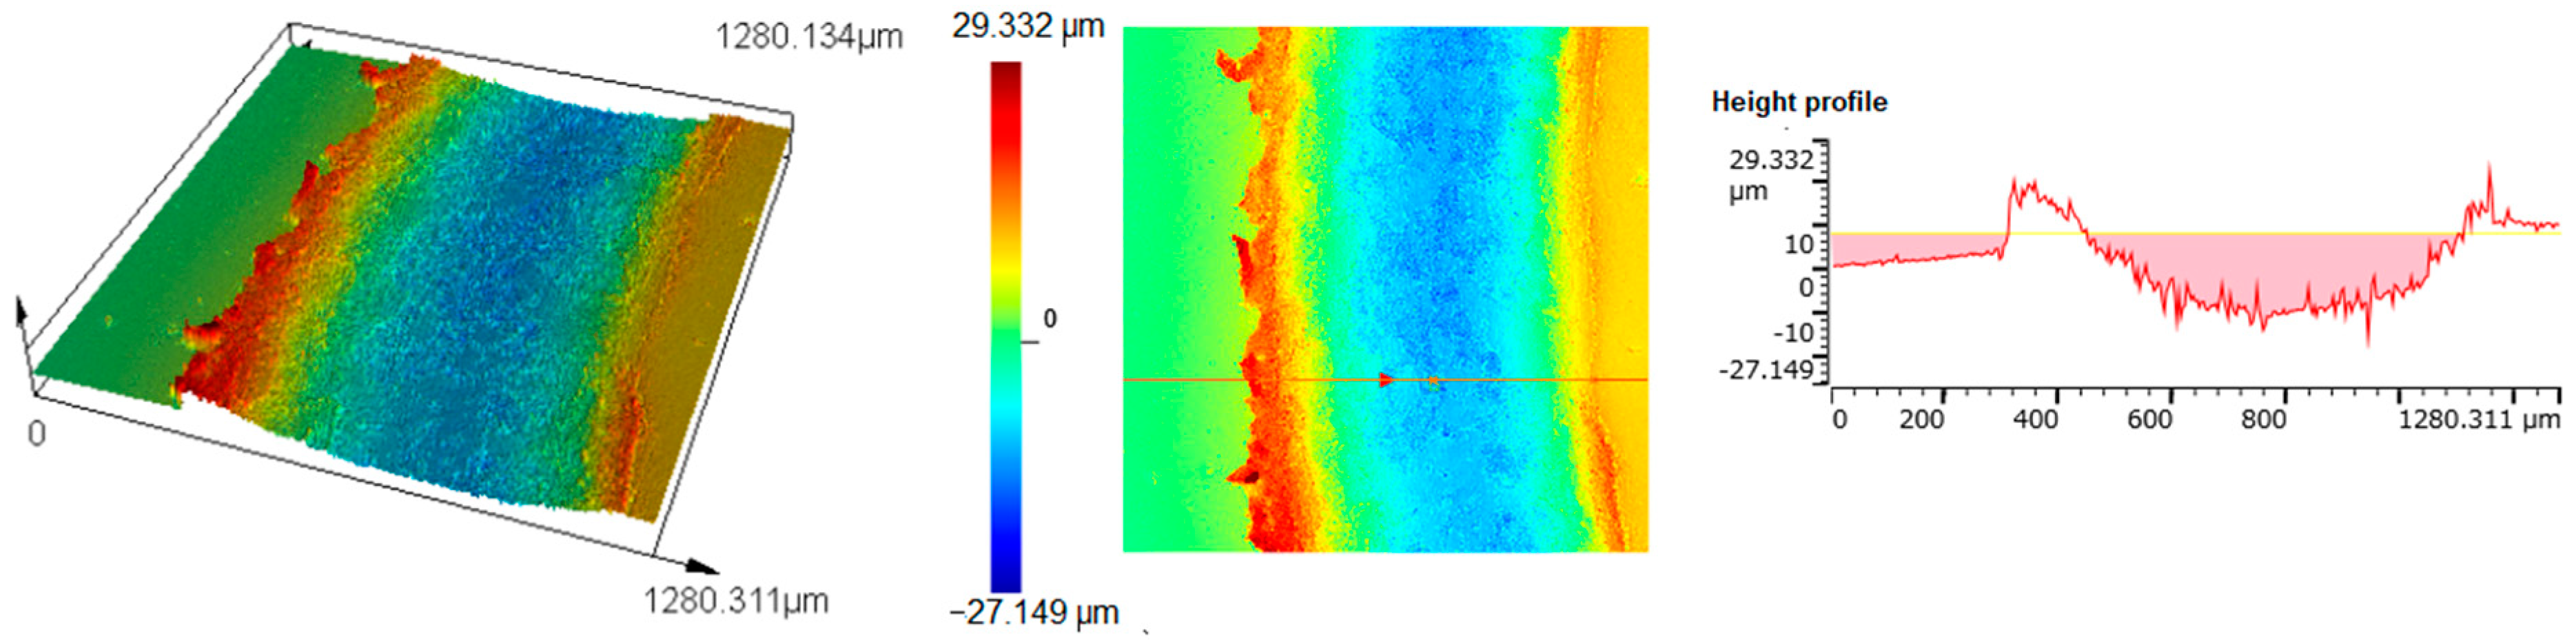
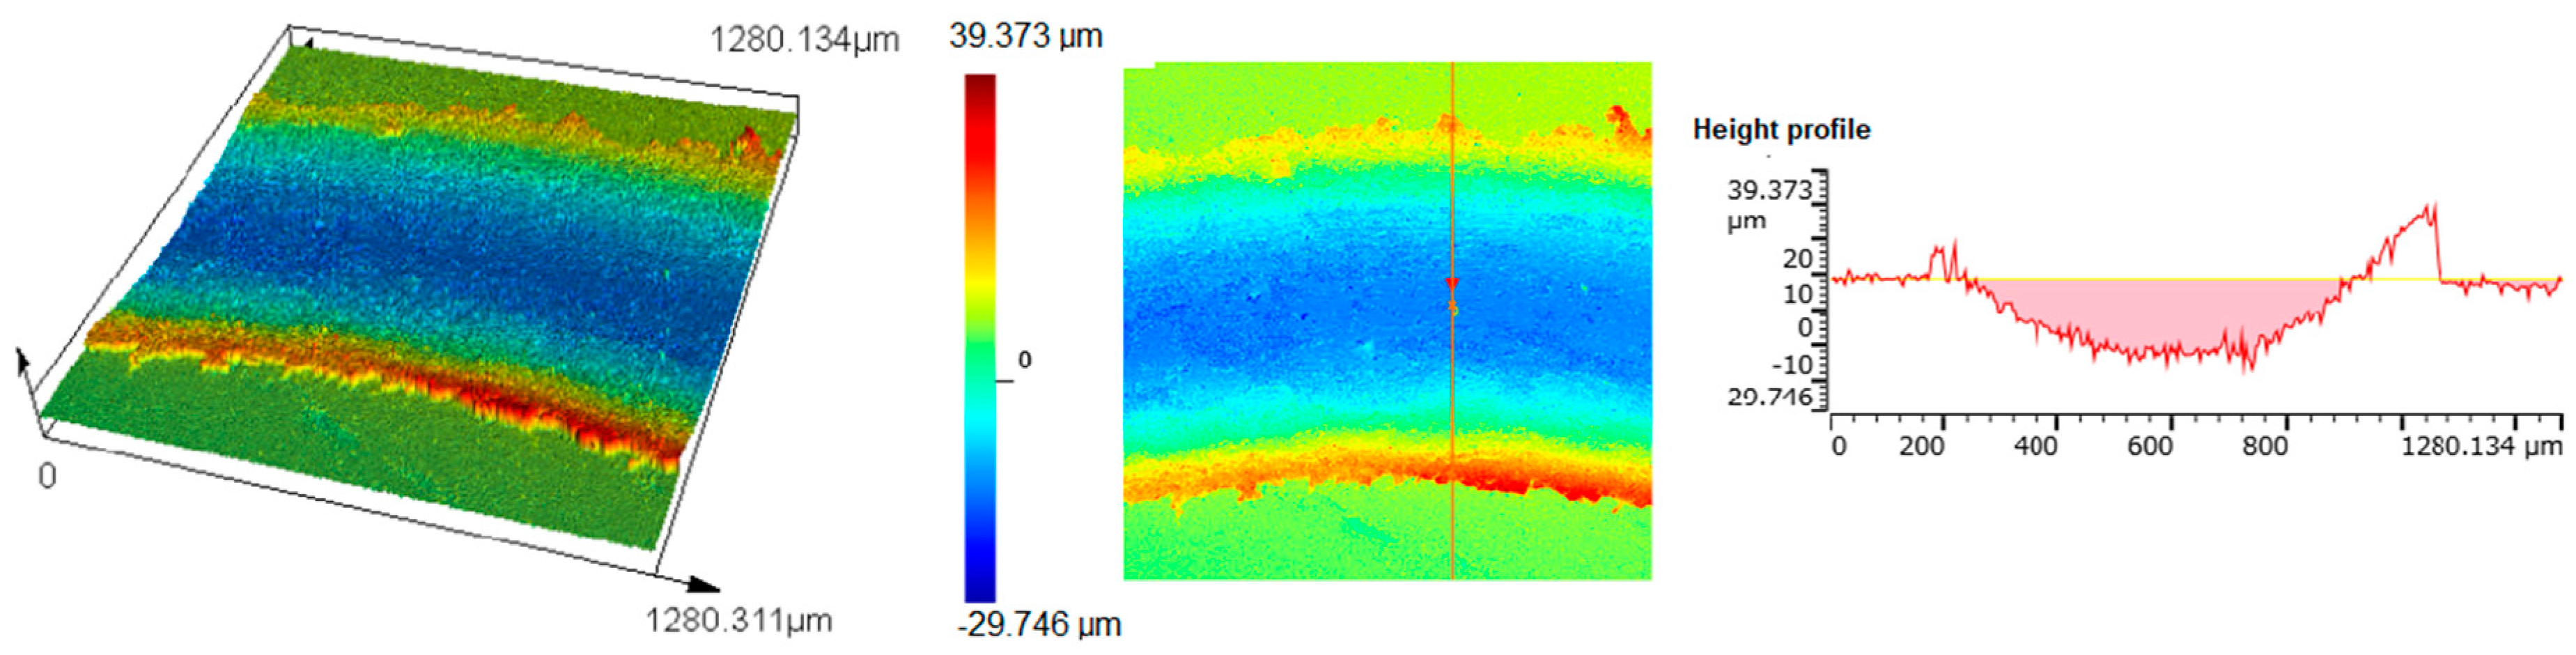
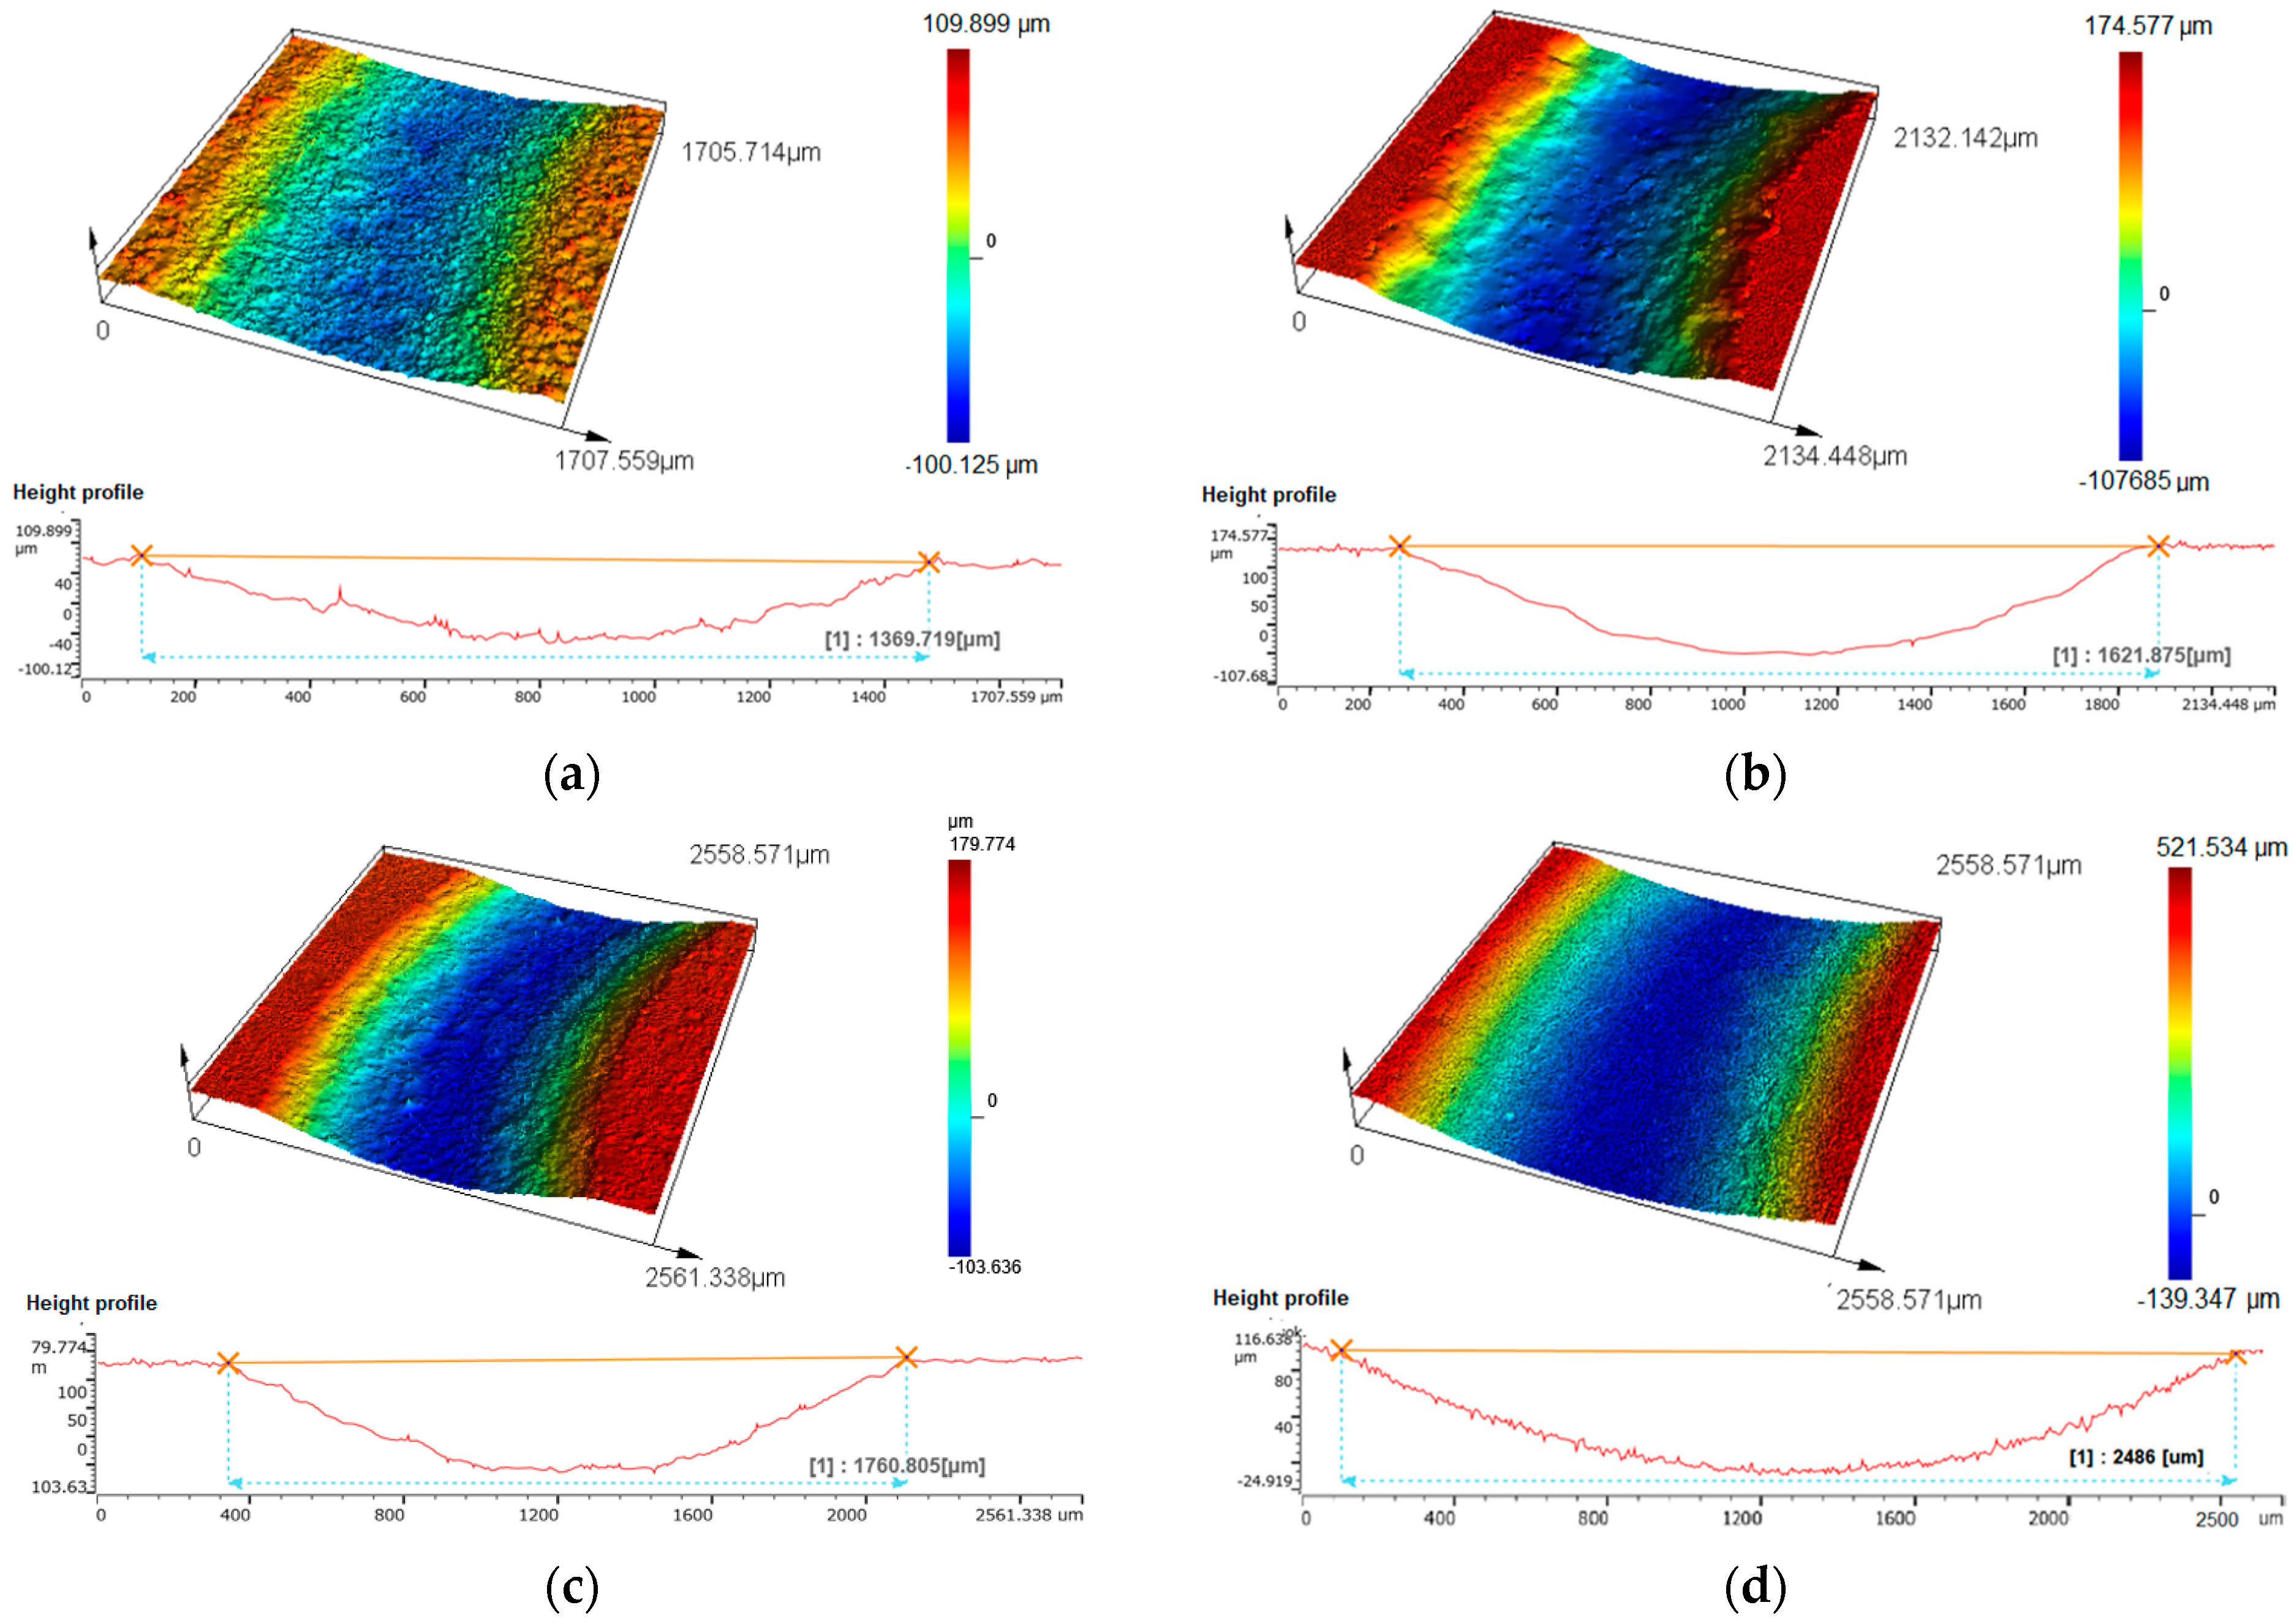
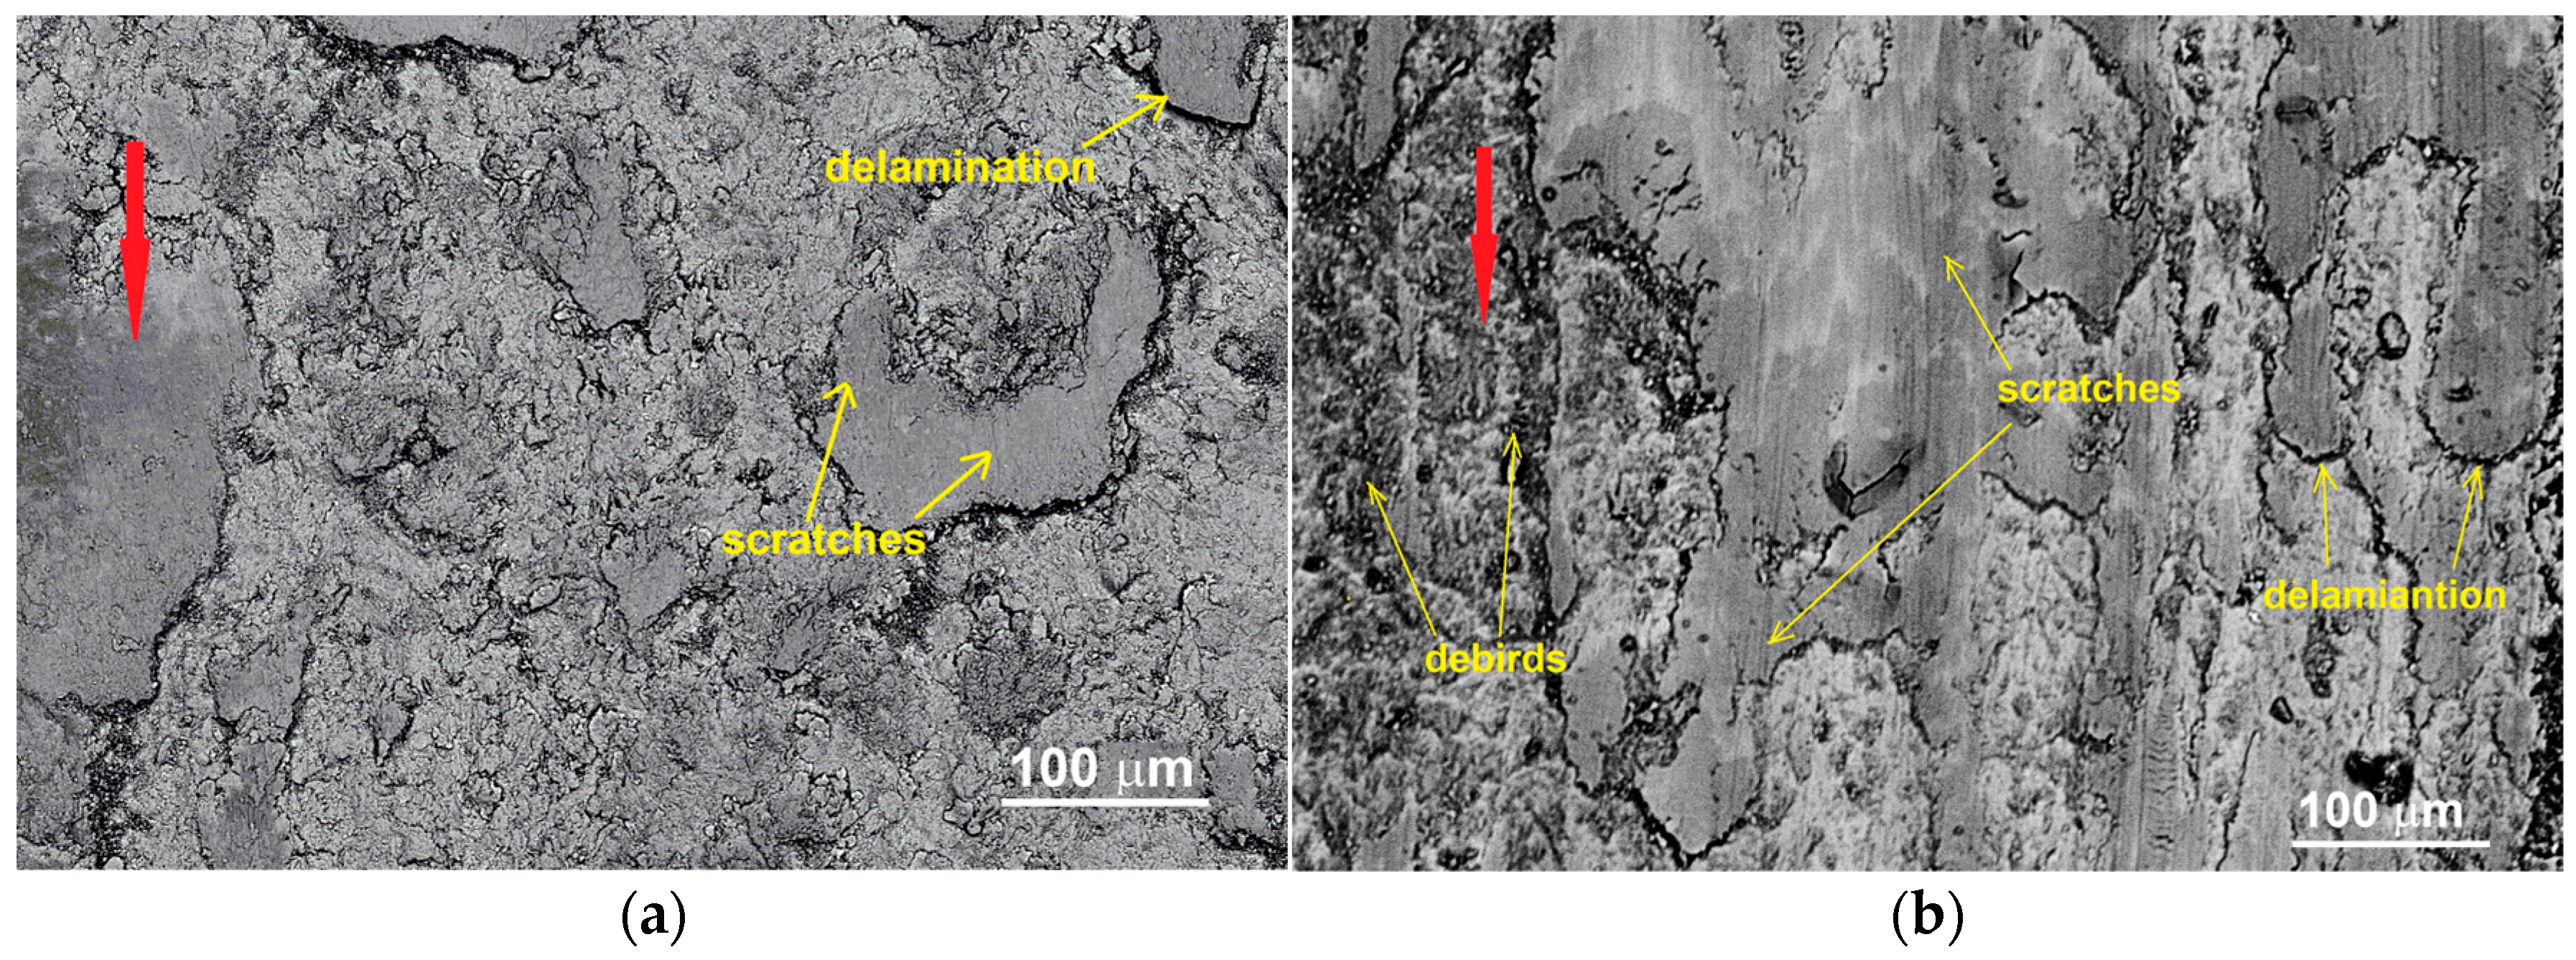
3.3. Wear Properties

Table 1 summarises the test results for the friction coefficient, mass loss, and specific wear rate for sintered materials at various temperatures. The results show that the tribological parameters slightly depend on the sintering temperature. When a higher sintering temperature of 950 °C was used, lower friction coefficient values, weight loss, and specific wear rate were obtained for sintered copper and each Cu + ZrB2 composite. The test results (Figure 10) showed that the friction coefficient depends on the content of ZrB2. The friction coefficient of pure copper (0.60–0.61) increased to 0.62–0.64 when the ZrB2 content increased to 5 wt%. Adding more strengthening phase (above 10 wt%) gradually decreased the friction coefficient. The lowest friction coefficient (0.48–0.49) was obtained for the composite containing 20% ZrB2. A different trend was observed for the specific wear rate, which was determined by analysing the change in the amount of ZrB2 in the copper matrix. It was found that the abrasion resistance of Cu + ZrB2 composites improves as a function of the change in the ZrB2 content. According to the determined data (Table 1), the specific wear rate gradually decreases from 8.08 × 10⁻⁴ (mm3/Nm) to 2.37 × 10⁻⁴ (mm3/Nm) for copper and the Cu + 20% ZrB2 composite, respectively. Using the pin-on-disc method, Shaik and Golla [6] examined the effect of different amounts (1, 3, 5, and 10 wt%) of ZrB2 on the abrasive properties of copper-based composites. The friction coefficient decreased from 0.56 to 0.16 for pure copper Cu and Cu + 3wt% ZrB2, respectively. Introducing a harder recovery phase (10 wt%) slightly increased the factor to 0.22. Pure copper showed a high wear coefficient of 17.33 × 10⁻², which decreased to 2.4 × 10⁻² for Cu + 3 wt% ZrB2 composites. The further addition of ZrB2 reinforcement reduced the wear resistance of the tested composites.
Figure 11, Figure 12, Figure 13 and Figure 14 show wear tracks and their profiles measured in four places for the Cu + 5% ZrB2 composite according to the diagram presented in Figure 2 and the standard [37]. Analogous measurements were made for other materials tested using the ball-on-disc method (Figure 14). For all Cu + ZrB2 composites, a very similar nature of material removal was observed by the ball from the worn zone. During the tests, the material was permanently deformed and abraded to the edge of the wear track. A characteristic layering of the material was observed at the edge of the wear track (Figure 11, Figure 12, Figure 13, Figure 14 and Figure 15). Profile analyses of composites with different amounts of ZrB2 (5–20 wt%) showed differences in the dimensions of the wear track. An increase in the width and depth of the wear track was observed, along with an increase in the reinforcing phase in the copper matrix. During the test, hard ZrB2 ceramic particles are torn out of the matrix and move in the contact zone of the ball with the sample surface. It is an additional factor that accelerates the wear of the composite.
Microstructural observations (SEM) confirmed the results of analysing the worn areas using confocal microscopy. Examples of microstructures of the worn surfaces of copper-based composites with different contents of the ZrB2 phase are shown in Figure 16. The analysis of the results showed that the worn surfaces of the composites are subject to plastic deformation. As a result, delaminations were observed. In addition, abrasive scratches and grooves were observed in the worn surface area. It suggests a mixed nature of the wear of the tested materials. The wear mechanism of composites is a combination of abrasive and adhesive wear.

3.4. Corrosion Properties

Uniform corrosion of copper in a neutral pH environment and in the presence of chloride ions proceeds according to the reaction [27]:
C u + + C l C u C l
The reaction produces an initial corrosion product which, depending on the conditions, can evolve to Cu2O, Cu(OH)2, CuO, Cu2(OH)3Cl, or CuCO3∙Cu(OH)2CuCO3∙Cu(OH)2 [43].
The electrochemical behaviour of copper and the Cu + ZrB2 composites immersed in a 3.5% NaCl solution was studied by potentiodynamic polarisation after monitoring the open-circuit potential. Figure 16 shows the result of the potentiodynamic polarisation measurements. Polarisation curves reveal that adding ZrB2 to copper increases the measured corrosion current, equivalent to deterioration of the corrosion resistance of the composite. The most probable reason is the increased porosity from adding ZrB2, leading to a larger specific surface area of Cu exposed to NaCl and crevice corrosion processes. It should also be noted that sinters containing up to 5% ZrB2 exhibit a less noble potential than Cu.
In comparison, those with more than 10% ZrB2 exhibit a more noble potential than Cu. The observed relationship occurs regardless of the sintering temperature. The shift of the potential to a more negative direction for copper may be caused by an increase in the concentration of chloride ions or an increase in temperature [27]. As a result of ongoing corrosion processes, this can be attributed to the increased concentration of chloride ions in the pores and free space. This theory appears to be confirmed by the shape of the polarisation curves, where a flattening appears on the anode side, suggesting diffusion effects before the Tafel region (η approximately 100 to 200 mV). This flattening indicates limited mass transport, likely due to the narrow micropores. The discussed effect does not appear for ZrB2 contents of 10% and more. The addition of ZrB2 is probably already large enough to change the electrode potential according to mixed potential theory [44]. In this case, the values of the anode branch slope are close to the standard value of 120 mV/decade. The ignition of the anodic curve at 120 mV/decade is typically due to the Tafel behaviour in the active region of the corrosion process, indicating a well-defined electrochemical reaction mechanism.
Table 2 presents parameters obtained from polarisation curves such as Erest, Ecorr, Icorr, βa, and βc. The Erest potential result is the last OCP value detected before the polarisation measurement. However, the corrosion potential of Ecorr was estimated using Tafel extrapolation. In some cases, significant differences between these values result from the lack of straightness in the Tafel region, which may suggest complex electrode reactions. The values obtained from the corrosion currents allow the samples to be divided into two groups. The first group of composites contains up to 5% ZrB2. They do not differ significantly from the reference sample of pure solid copper and are characterised by corrosion currents below 10 uA/cm2. The second group consists of samples with a 10% ZrB2 content, with much higher corrosion current values. Based on the results, it is difficult to find a significant impact of temperature on corrosion resistance for samples containing up to 5% ZrB2. However, for composites with a ZrB2 content greater than 10%, samples sintered at 950 °C show significantly worse corrosion resistance despite lower open porosity (approximately 3% vs. 9%). One can try to explain this by saying that, with a sufficiently high open porosity value, there is no accumulation of corrosion products in the pores and no local pH changes, so corrosion occurs mainly uniformly.

4. Conclusions

Based on the experimental results obtained for Cu + ZrB2 composites fabricated by SPS, the following conclusions can be drawn:
  • Using a temperature of 950 °C in the SPS process is beneficial for obtaining a high degree of densification of Cu + ZrB2 composites, for which the apparent density is 93–97% of the theoretical density. The densification of the composites was observed to decrease with increasing ZrB2 phase.
  • The microhardness increased significantly with the change in the content of ZrB2. Among all the composites, Cu + 20% ZrB2 showed the maximum hardness (179 HV0.3).
  • The wear resistance of the Cu + ZrB2 composites increases with the increasing content of ZrB2.
  • Adding ZrB2 above 5% significantly reduces the resistance of the composite to corrosion in chloride solutions. Regardless of sintering temperature, composites with a ZrB2 content of up to 5% do not show a significant difference in corrosion resistance compared to pure copper.

Author Contributions

Conceptualisation, I.S. and M.S.; methodology, I.S. and M.S.; software, P.H.; validation, I.S., P.H. and S.B.; formal analysis, P.H.; investigation, I.S., S.B. and M.S.; resources, I.S.; data curation, I.S.; writing—original draft preparation, P.H., M.S. and R.K.; writing—review and editing, I.S and R.K.; visualisation, I.S. and P.H.; supervision, I.S.; project administration, I.S.; funding acquisition, I.S. and P.H. All authors have read and agreed to the published version of the manuscript.

Funding

This research was funded by funds from the Institute of Technology, University of the National Education Commission (WPBU/2024/03/00009). The project for purchasing scientific and research equipment: “Innovative research and scientific platform for a new class of nanocomposites”, financed by the Ministry of Education and Science, contract number 7216/IA/SP/2021.

Data Availability Statement

The original contributions presented in the study are included in the article, further inquiries can be directed to the corresponding authors.

Conflicts of Interest

The funders had no role in the design of the study; in the collection, analyses, or interpretation of data; in the writing of the manuscript; or in the decision to publish the results.

References

  1. Renwick, S. Copper Alloys: Processes, Applications and Developments; New York Research Press: New York, NY, USA, 2015. [Google Scholar]
  2. Davis, J.R. Copper and Copper Alloys. In ASM Specialty Handbook; ASM International: Materials Park, OH, USA, 2001. [Google Scholar]
  3. Pang, Y.; Xia, C.; Wang, M.; Li, Z.; Xiao, Z.; Wei, H.; Sheng, X.; Jia, Y.; Chen, C. Effects of Zr and (Ni, Si) additions on properties and microstructure of Cu–Cr alloy. J. Alloys Compd. 2014, 582, 786–792. [Google Scholar] [CrossRef]
  4. Wang, M.; Yang, Q.R.; Jiang, Y.B.; Li, Z.; Xiao, Z.; Gong, S.; Wang, Y.R.; Guo, C.L.; Wei, H.G. Effects of Fe content on microstructure and properties of Cu–Fe alloy. Trans. Nonferrous Met. Soc. China 2021, 31, 3039–3049. [Google Scholar] [CrossRef]
  5. Krüger, C.; Mortensen, A. In situ copper-alumina composites. Mater. Sci. Eng. A-Struct. 2013, 585, 396–407. [Google Scholar] [CrossRef]
  6. Shaik, M.A.; Golla, B.R. Two body abrasion wear behaviour of Cu–ZrB2 composites against SiC emery paper. Wear 2020, 450–451, 203260. [Google Scholar] [CrossRef]
  7. Taha, M.A.; Zawrah, M.F. Effect of nano ZrO2 on strengthening and electrical properties of Cu-matrix nanocomposites prepared by mechanical alloying. Ceram. Int. 2017, 43, 12698–12704. [Google Scholar] [CrossRef]
  8. Yan, Y.F.; Kou, S.Q.; Yang, H.Y.; Shu, S.L.; Qiu, F.; Jiang, Q.C.; Zhang, L.C. Ceramic particles reinforced copper matrix composites manufactured by advanced powder metallurgy: Preparation, performance, and mechanisms. Int. J. Extrem. Manuf. 2023, 5, 032006. [Google Scholar] [CrossRef]
  9. Mittal, P.; Mehta, J.; Mahto, S.; Mehta, S. Copper Matrix Composites—Synthesis and Applications, Metal Matrix Composites; Chapter 3; CRC Press: Boca Raton, FL, USA, 2022. [Google Scholar]
  10. Qu, X.; Zhang, L.; Wu, M.; Ren, S. Review of metal matrix composites with high thermal conductivity for thermal management applications. Prog. Nat. Sci. Mater. Int. 2011, 21, 189–197. [Google Scholar] [CrossRef]
  11. Zhou, S.; Zhang, D.L.; Kong, C.; Munroe, P. Factors controlling the tensile properties of ultrafine structured Cu–5vol%Al2O3 nanocomposite prepared by high energy mechanical milling and powder compact extrusion. Mater. Sci. Eng. A 2013, 584, 67–72. [Google Scholar] [CrossRef]
  12. Huang, B.; Hishinuma, Y.; Noto, H.; Muroga, T. Mechanochemical processing of Cu-Y2O3 alloy by MA-HIP for heat sink materials application. Fusion Eng. Des. 2019, 140, 33–40. [Google Scholar] [CrossRef]
  13. Fuentes, S.; Tapia, A.; Pozo, P. Synthesis, characterization, and antibacterial activity evaluation of Cu-TiO2 nanocomposites. Mater. Lett. 2021, 296, 129885. [Google Scholar] [CrossRef]
  14. Prajapati, P.K.; Chaira, D. Fabrication and characterization of Cu–B4C metal matrix composite by powder metallurgy: Effect of B4C on microstructure, mechanical properties and electrical conductivity. Transit. Indian Inst. Met. 2018, 72, 673–684. [Google Scholar] [CrossRef]
  15. Wang, F.; Li, Y.; Wang, X.; Koizumi, Y.; Kenta, Y.; Chiba, A. In-situ fabrication and characterization of ultrafine structured Cu–TiC composites with high strength and high conductivity by mechanical milling. J. Alloys Compd. 2016, 657, 122–132. [Google Scholar] [CrossRef]
  16. Zeng, W.; Xie, J.; Zhou, D.; Fu, Z.; Zhang, D.; Lavernia, E.J. Bulk Cu-NbC nanocomposites with high strength and high electrical conductivity. J. Alloys Compd. 2018, 745, 55–62. [Google Scholar] [CrossRef]
  17. Liu, Q.; Miao, W.; Ding, H.; Glandut, N.; Jia, H.; Li, C. The introduction of SiC into Cu melts based on Ti–SiC system and its transformation. J. Mater. Res. Technol. 2020, 9, 2881–2891. [Google Scholar] [CrossRef]
  18. Wang, F.; Jiang, C.; Li, J.; Huang, J. Metal-Nitride nanocomposite thin film of nanomaze-like Cu embedded in TiN. Mater. Lett. 2021, 294, 129780. [Google Scholar] [CrossRef]
  19. Ding, H.; Zhang, X.; Liu, Q.; Miao, W.; Zhou, J.; Wang, J. The microstructures of the TiN–Ti5Si3 hybrid reinforced Cu matrix composites fabricated by the Ti–Si3N4 reaction and its preparation mechanism. J. Mater. Res. Technol. 2021, 14, 1709–1723. [Google Scholar] [CrossRef]
  20. Ramírez-Vinasco, D.; Le, C.A.; Nanko, M.; Aguilar-Reyes, E.A. Consolidation behaviour of Cu/AlN composites by pulse electric current sintering of copper-coated aluminium nitride precursors. Powder Technol. 2021, 377, 723–732. [Google Scholar] [CrossRef]
  21. Soloviova, T.O.; Solodkyi, I.V.; Loboda, P.I. Spark Plasma Sintering of Cu-(LaB6-TiB2) Metal-Ceramic Composite and Its Physical-Mechanical Properties. J. Superhard Mater. 2019, 41, 213–220. [Google Scholar] [CrossRef]
  22. Rino, J.J.; Prabu, S.B.; Paskaramoorthy, R. Comparison of thermal and mechanical properties of Al-5wt.%TiB2 and Al-5wt.%ZrB2 composites processed through salt-melt reaction route. Mater. Today Proc. 2017, 4, 8739–8750. [Google Scholar] [CrossRef]
  23. Ružić, J.; Stašić, J.; Marković, S.; Raić, K.; Božić, D. Synthesis and Characterization of Cu-ZrB2 Alloy Produced byPM Techniques. Sci. Sinter. 2014, 46, 217–224. [Google Scholar] [CrossRef]
  24. Guo, X.; Jia, L.; Lu, Z.; Xing, Z.; Xie, H.; Kondoh, K. Preparation of Cu/CrB2 composites with well-balanced mechanical properties and electrical conductivity by ex-situ powder metallurgy. J. Mater. Res. Technol. 2022, 17, 1605–1615. [Google Scholar] [CrossRef]
  25. López, M.; Jiménez, J.A.; Corredor, D. Precipitation strengthened high strength-conductivity copper alloys containing ZrC ceramics. Compos. Part A Appl. Sci. Manuf. 2007, 38, 272–279. [Google Scholar] [CrossRef]
  26. Stępień, M.; Sulima, I.; Hyjek, P.; Kowalik, R. Evaluation of the corrosion resistance of spark plasma sintered stainless steel 316L matrix composites with zirconium diboride in sulfuric acid. Arch. Civ. Mech. Eng. 2022, 22, 127. [Google Scholar] [CrossRef]
  27. Kear, G.; Barker, B.D.; Walsh, F.C. Electrochemical corrosion of unalloyed copper in chloride media—A critical review. Corros. Sci. 2004, 46, 109–135. [Google Scholar] [CrossRef]
  28. Hutchings, I.; Shipway, P. Tribology: Friction and Wear of Engineering Materials; Butterworth-Heinemann: Oxford, UK, 2017. [Google Scholar]
  29. Yang, Y.; Guo, X.; Song, K.; Long, F.; Wang, X.; Li, S.; Lsi, Z. Electrical wear performance of copper matrix composites reinforced with hybrid CNTs and TiB2 particles. Ind. Lubr. Tribol. 2022, 74, 609–618. [Google Scholar] [CrossRef]
  30. Zhou, J.; Ma, C.; Kang, X.; Zhang, L.; Liu, X. Effect of WS2 particle size on mechanical properties and tribological behaviors of Cu–WS2 composites sintered by SPS. Trans. Nonferrous Met. Soc. China 2018, 28, 1176–1185. [Google Scholar] [CrossRef]
  31. Su, Y.; Jiang, F.; Long, M.; Wu, F.; Xiao, Z.; Wu, M. Microstructure and frictional properties of copper-tin composites containing graphite and MoS2 by rapid hot-press sintering. Tribol. Int. 2023, 183, 108392. [Google Scholar] [CrossRef]
  32. Bagheri, G.H.A. The effect of reinforcement percentages on properties of copper matrix composites reinforced with TiC particles. J. Alloys Compd. 2016, 676, 120–126. [Google Scholar] [CrossRef]
  33. Aleksandar, V.; Viseslava, R.; Fatima, Z. Friction and wear properties of copper based composites reinforced with micro and nano-sized Al2O3 particles. In Proceedings of the 8th International Conference on Tribology, Sinaia, Romania, 30 October–1 November 2014; pp. 357–358. [Google Scholar]
  34. Raja, R.; Jannet, S.; Ruban, S.R.; George, L. Mechanical, wear, and microstructural examination of copper surface composites reinforced with SiC nanoparticles done by FSP. Mater. Today Proc. 2023, 92, 376–381. [Google Scholar] [CrossRef]
  35. Fan, X.; Liu, Q.; Ding, H.; Wang, H.; Hao, C. The microstructures and properties of in-situ ZrB2 reinforced Cu matrix composites. Results Phys. 2019, 14, 102494. [Google Scholar] [CrossRef]
  36. Taylor, R.P.; McClain, S.T.; Berry, J.T. Uncertainty analysis of metal-casting porosity measurements using Archimedes’ principle. Int. J. Cast Met. Res. 1999, 11, 247–257. [Google Scholar] [CrossRef]
  37. ISO 20808:2016(E); International Standard, Fine Ceramics (Advanced Ceramics, Advanced Technical Ceramics)- Determination of friction and wear characteristics of monolithic ceramics by ball-on-disc method, Edition 2. American National Standards Institute: New York, NY, USA, 2016.
  38. Meozzi, M. Special use of the ball on disc standard test. Tribol. Int. 2006, 39, 496–505. [Google Scholar] [CrossRef]
  39. Wang, C.; Lin, H.; Zhang, Z.; Li, W. Fabrication, Interfacial characteristics and strengthening mechanisms of ZrB2 microparticles reinforced Cu composites prepared by hot-pressed sintering. J. Alloys Compd. 2018, 748, 546–552. [Google Scholar] [CrossRef]
  40. Zhang, P.; Wang, C.; Zhou, S.; Guo, B.; Zhang, Z.; Yu, Z.; Li, W. Effect of Sintering Temperature on the Microstructure and Properties of High-Strength and Highly Conductive 5 wt.% ZrB2/Cu Composite. Powder Metall. Met. Ceram. 2023, 61, 560–573. [Google Scholar]
  41. Fahrenholtz, W.G.; Hilmas, G.E.; Talmy, I.G.; Zaykoski, J.A. Refractory Diborides of Zirconium and Hafnium. J. Am. Ceram. Soc. 2007, 90, 1347–1364. [Google Scholar] [CrossRef]
  42. Pouyani, M.R.; Rajabi, M. Microwave-assisted synthesis of Cu–ZrB2 MM Nanocomposite using double pressing double sintering method. J. Mater. Sci. Mater. Electron. 2019, 30, 266–276. [Google Scholar] [CrossRef]
  43. Bengough, G.D.; Jones, R.M.; Pirret, R. Diagnosis of brass condenser tube corrosion. J. Inst. Met. 1920, 23, 65–158. [Google Scholar]
  44. Ahmad, Z. Principles of Corrosion Engineering and Corrosion Control; Butterworth-Heinemann: Oxford, UK, 2006. [Google Scholar] [CrossRef]
Figure 1. SEM images of the starting powders of (a) ZrB2, (b) copper, and (c) examples of Cu + 10ZrB2 composite powders after the milling process (10 h).
Metals 14 00974 g001
Figure 2. Schematic of the wear track measurement on disc specimen. Adapted from Ref. [37].
Metals 14 00974 g002
Figure 3. Variation in (a) apparent density and (b) open porosity of sintered Cu and Cu + ZrB2 composites as a function of sintering temperature.
Metals 14 00974 g003
Figure 4. Variation in Vickers microhardness of sintered Cu and Cu + ZrB2 composites as a function of the sintering temperature.
Metals 14 00974 g004
Figure 5. Microstructure (SEM) of Cu + 10% ZrB2 composite with the corresponding point analysis (EDS).
Metals 14 00974 g005
Figure 6. Microstructure (SEM) of the Cu + 20% ZrB2 composite with the corresponding point analysis (EDS).
Metals 14 00974 g006
Figure 7. X-ray diffraction (XRD) patterns of the sintered materials.
Metals 14 00974 g007
Figure 8. The EBSD maps of (a) Cu + 5% ZrB2 and (b) Cu + 10% ZrB2 composites.
Metals 14 00974 g008
Figure 9. EBSD maps of (a) Cu + 15% ZrB2 and (b) Cu + 20% ZrB2 composites.
Metals 14 00974 g009
Figure 10. Effect of ZrB2 content on (a) friction coefficient and (b) specific wear rate of sintered composites.
Metals 14 00974 g010
Figure 11. Results of the analysis of the wear tracks (area 1) of a Cu + 5% ZrB2 composite sample examined under a confocal microscope.
Metals 14 00974 g011
Figure 12. Results of the analysis of wear tracks (area 2) of a Cu + 5% ZrB2 composite sample examined under a confocal microscope.
Metals 14 00974 g012
Figure 13. Results of the analysis of wear tracks (area 3) of a Cu + 5% ZrB2 composite examined under an Olympus LEXT OLS5100 confocal microscope.
Metals 14 00974 g013
Figure 14. Results of the analysis of wear tracks (area 4) of a Cu + 5% ZrB2 composite examined under a confocal microscope.
Metals 14 00974 g014
Figure 15. Comparison of example results of the 3D analysis of wear profiles for: (a) Cu + 5% ZrB2, (b) Cu + 10% ZrB2, (c) Cu + 15% ZrB2, and (d) Cu + 20% ZrB2 composites examined under a confocal microscope.
Metals 14 00974 g015
Figure 16. SEM image of composite surfaces worn with: (a) 5% ZrB2, (b) 10% ZrB2, (c) 15% ZrB2, and (d) 20% ZrB2. Sliding direction is shown by the red arrow.
Metals 14 00974 g016aMetals 14 00974 g016b
Table 1. Wear results of Cu + ZrB2 composites after the wear test.
Sintered MaterialsSintering Temperature
(°C)
Friction Coefficient
μ
(-)
Specific Wear Rate
Wv⋅10−4
(mm3/Nm)
Loss of Weight
Δm
(%)
Cu8500.618.160.36
9500.608.080.29
Cu + 5% ZrB28500.646.560.27
9500.626.260.24
Cu + 10% ZrB28500.624.420.18
9500.584.280.17
Cu + 15% ZrB28500.563.980.12
9500.543.610.11
Cu + 20% ZrB28500.492.590.09
9500.482.370.09
Table 2. Potentiodynamic polarisation parameters for copper and Cu + ZrB2 composites in 3.5% NaCl with different content of ZrB2 and sintering temperature.
SamplesSintering Temperature Erest (mV)Ecorr (mV)Icorr (µA/cm2)βa (mV/dec)βc (mV/dec)
Cu solid-----−0.183−0.1713.3326201
Cu (sintered)850 °C−0.190−0.1944.6267222
Cu + 5% ZrB2 −0.187−0.2456.3386133
Cu + 10% ZrB2 −0.136−0.16816.6871160
Cu + 15% ZrB2 −0.136−0.18434.51101199
Cu + 20% ZrB2 −0.133−0.17227.67121161
Cu (sintered)950 °C−0.183−0.2533.30179163
Cu + 5% ZrB2 −0.201−0.2444.4874189
Cu + 10% ZrB2 −0.149−0.20822.70106166
Cu + 15% ZrB2 −0.118−0.20852.60145136
Cu + 20% ZrB2 −0.094−0.177124.45110123
Disclaimer/Publisher’s Note: The statements, opinions and data contained in all publications are solely those of the individual author(s) and contributor(s) and not of MDPI and/or the editor(s). MDPI and/or the editor(s) disclaim responsibility for any injury to people or property resulting from any ideas, methods, instructions or products referred to in the content.

