Abstract
This research was focused on the effect of Ti and S content on the formation of non-metallic inclusions and their influence on the mechanical properties and machinability of low-carbon ferritic–pearlitic steels. An analysis and classification of the non-metallic inclusions were carried out. The tensile strength and impact toughness were determined from samples taken in the rolling direction. Machinability investigations were carried out on a CNC turning machine and by analyzing the surface roughness. TiO-TiN inclusions are present in steels with an increased Ti content. In these steels, the hardness, tensile strength, and cutting forces increase with a higher proportion of Ti. In the second group of steels with increased contents of S, Al, and Ca, MnS and CaO-Al2O3-MnS non-metallic inclusions are formed. As the S content increases, the tensile strength and cutting forces decrease, while the impact toughness increases. In steels with added Ti, the machining is more difficult, but a finer surface is achieved after turning, while a higher S content results in an increased fraction of softer sulfide inclusions, which reduce the cutting forces but also result in a reduced surface quality.
1. Introduction
The machinability of metal can be defined as the removal of material with the aim of transforming a semi-finished product, i.e., from a raw material into a finished product, with design and dimensional requirements. There are various machining techniques, the most common of which are turning and milling [1]. The machinability of the material is related to factors such as the properties and geometry of the cutting tool and the processing parameters, as well as the properties of the material being processed [2,3]. From the point of view of microstructures, the structure of the metal (ferrite, pearlite, martensite), the size of the crystal grains, and especially the non-metallic inclusions are important. Materials with a softer structure (ferrite, pearlite) and smaller and uniformly sized grains are easier to cut and machine, while the addition of elements such as sulfur (S), lead (Pb), and tellurium (Te) makes the material easier to machine [4,5]. The machinability criterion of the material is defined according to the level of tool wear, the total energy consumption, the magnitude of the cutting forces, the speed of removal, and the type of chips or according to the achievable surface quality defined by surface roughness [6,7].
In industrial production and in the automotive industry, steels, especially carbon and low-alloy steels, are still one of the most frequently used materials [8,9]. Their machinability depends on the carbon content, previous thermomechanical treatment, and the content of sulfur, manganese, phosphorus, nitrogen, and lead in the steel. Cold forming reduces the ductility and thus contributes to more favorable chip formation and removal, heat treatment helps to reduce the internal stresses and hardness and homogenize the microstructure, and sulfur and manganese contribute to favorable chip breakage through the formation of manganese sulfides [10,11].
From the standpoint of carbon content, low-carbon steels are too ductile, while steels with more than 0.3% carbon reduce the machinability due to increased hardness, and the best machinability is found with steels having 0.15–0.30% carbon [12,13].
The machinability and properties of steel are strongly influenced by non-metallic inclusions. According to the processing concept, non-metallic inclusions are to some extent desirable (in terms of composition, number, size, morphology, and distribution) as they can facilitate the formation of chips, but usually deteriorate the mechanical properties of the steel. The positive impact of non-metallic inclusions on the machinability includes raising the stress in the shear plane, which causes the formation of cracks in the chip and brittle chips that can break [2,14]. By being active in the area of the metal flow, the inclusions help shear the metal and also form a diffusion barrier that protects the tool from chemical diffusion at high temperatures. They also act as a lubricant and thus increase the tool’s resistance to wear [15,16]. Mainly silicates, aluminates, magnesium, and manganese oxides, which also affect the anisotropy of the properties, have a negative impact on machinability, and to some extent also the inclusions of zirconium, titanium, vanadium, and boron with nitrogen and carbon [17]. However, oxide and sulfide inclusions with rare earth metals (REMs) can have a positive influence due to the lubrication effect. On the other hand, Ca-Al-Si-oxide and MnS inclusions improve the machinability with their softness and ductility, but can cause anisotropy and a deterioration of mechanical properties [18], especially MnS inclusions. The harmful effect can be reduced by modifying them with Ca, REMs, or Zr [19]. The purpose of the modification is to change the chemical composition and physical properties of sulfides, to change the size and shape, or globalization and homogenization of inclusions [20].
The deliberate addition of sulfur and manganese to the steel during the secondary processing of steel and the formation of MnS inclusions is the most common way to achieve better machinability. MnS inclusions on the cutting edge of the tool reduce friction and wear, as they act as a lubricant and thus enable a longer tool life, as well as higher feed rates [21,22]. According to the morphology in the cast state, three types of MnS inclusions are known [23], round with an oxide core (often formed as a duplex structure with silicates), dendritic (arranged in chains), and angular (formed in steels deoxidized with an excess of Al) [24]. During hot-working deformation, the MnS inclusions are elongated into a strip or sheet-shaped inclusions (mainly dendritic and angular ones, which are softer than harder round ones), thus causing anisotropy as well as a deterioration of mechanical properties, i.e., the ductility, toughness, weldability, and corrosion resistance of the steel [25,26]. Depending on the aspect ratio of the MnS inclusions, short and thick sulfides with a small volume fraction are preferred for good machinability and minimal impact on the mechanical properties. It was found that MnS inclusions of ≤1 µm and inclusions with pinned oxide do not deform into long strip shapes [14,27].
MnS inclusions are poorly wetted in the steel melt and therefore not trapped in the steel matrix, but grow in the melt. For the fine dispersion of MnS inclusions, oxides with a low melting temperature and a high sulfide capacity, such as Ti and Al oxides, are required [28]. These accelerate the stable eutectic reaction (dendritic and angular forms of MnS) by creating nucleation sites for MnS precipitation [29]. With the addition of titanium to steel, oxide (TiMn)O inclusions are formed, which are well wetted at the limit of the solidification of the melt and have a high affinity for sulfides. Thus, Ti and Al oxides act as heterogeneous nucleation sites for the formation of MnS liquid droplets [30,31]. These droplets are anchored on the surface of the inclusions and are thus trapped and solidified as small inclusions, much smaller and rounder than in steels without any Ti addition [20,32].
Titanium has a high affinity for C, N, S, and O and is used as a micro-alloying element, mainly to control the size of austenite and ferrite crystal grains. It combines with C and N to form Ti(C,N) and TiN [33,34], which are very thermally and chemically stable and have low solubility even at high melt temperatures. TiN is preferentially excreted along the borders. It can be separated in the melt, during the solidification in the austenitic and ferritic zone [35]. Large nitrides, up to a few tens of micrometers, are formed in the metal melt and are too large to affect crystal grain-growth limitation, recrystallization, and precipitation hardening [36].
In contrast, coarse TiN acts as cleavage-fracture initiation sites, impairs fatigue properties and weldability, and reduces the steel’s toughness. Therefore, TiN precipitates, which are formed or nucleate in austenite and during hot working, are preferred. These are tiny, a few tens of nanometers in size, and successfully attach to austenite grain boundaries, nucleate on dislocations, and thus inhibit repair and recrystallization during the heating and hot working of the steel. They also improve the machinability and lead to better mechanical properties of the steels [34].
Our research was focused on steels for forging and machining with increased sulfur and manganese content for improved machinability. Two series of laboratory charges with the same basic chemical composition were prepared. In the first series, the content of titanium was varied, and in the second series, with the same addition of aluminum and calcium, the content of sulfur was increased. The purpose of this research was to determine how changing the chemical composition, sulfur content, modification of MnS inclusions, and type of non-metallic inclusions affects the machinability and mechanical properties of low-alloyed ferrite–perlite steels.
2. Experimental Part
2.1. Production of Laboratory Charges
The research focused on low-alloy ferritic–pearlite steels for forging and machining with basic compositions of 0.45% C, 0.7% Si, 1.7% Mn, 0.25% Cr, and 0.02% V. To investigate the influence of composition modification on the workability and mechanical properties, 8 laboratory charges with different chemical compositions were produced. These charges were made in a laboratory open induction furnace under a protective argon atmosphere and cast into 60 × 60 × 300 mm3 molds. For each charge, 18 kg of a steel insert was used, the composition of which is given in Table 1. After melting the insert, an appropriate amount of silicomanganese (SiMn) and ferrosilicon (FeSi) was added to achieve the appropriate base composition. After the homogenization of the melt, final alloying elements such as ferrotitanium (FeTi) and sulfur (S) were added to the first series of four charges (Table 2). The second series of four charges (Table 3) was alloyed with aluminum (Al), calcium silicon (CaSi), and sulfur (S). Still hot ingots (T ≤ 1150 °C) were then rolled from 60 × 60 to 22 × 70 mm2, carried out in four rolling covers (degree of deformation: 60%). The chemical analysis of the material analyzed used ICP-OES instruments Agilent 5800 (Agilent Australia) Samples (20 × 20 × 20 mm3) were then taken from the rolls for the metallographic investigation of the steel structure, analysis of non-metallic inclusions, and hardness measurement. In the direction of rolling, in accordance with the ASTM E8 standard [37], samples for tensile mechanical tests (do = 8 mm, Lo = 40 mm) and machinability tests (15 × 100 mm2) were also produced.

Table 1.
Chemical composition of charging steel in wt%.
Table 2.
Melts of steels alloyed with Ti and S (classified by Ti content) in wt%.
Table 3.
Melts of steels alloyed with S, Ca, and Al (classified by S content) in wt%.
2.2. Metallographic Investigation
The samples for metallographic examination were first ground with sandpaper from P180 to P1200, polished with diamond paste, and finally etched with aqua regia. The metallographic analysis of the microstructure of the steels was performed with an optical microscope (OM), Nikon mikrophoto—FXA. In the following, a high-resolution analysis of metal inclusions was performed using an electron microscope (SEM) and energy-dispersive spectroscopy (EDS) (Jeol JSM-6500 with Inca Energy 450, INCA X-SIHT LN2 detector, Oxford instruments, Abingdon, UK).
EDS analyses were performed at an accelerating voltage of 15.0 kV and an energy resolution of 150 eV.
2.3. Mechanical Investigations and Machinability
Measurements of the mechanical properties at room temperature, including tensile strength and elongation, were performed on an INSTRON 8802, 250 KN tensile-testing machine (INSTRON, UK) in accordance with ASTM E8. Toughness was measured by the Charpy impact test with charpy hammer 300J (MFL, Germany, EN ISO 148-1) [38], and Rockwell hardness (EN ISO 6508-1 [39], was measured on a Rockwell 4JR, Instron B2000 (INSTRON, UK). Machinability investigations under the conditions of rough and fine turning were made on a CNC lathe (Mori Seiki SL 153, Nagoya, Japan) equipped with force meters and using standard ISCAR cutting elements. SNMM 120408-R3P (ISCAR Ltd., Migdal Tefen, Israel) single-sided 90° square cutting elements with a tip radius of 0.8 mm, a cutting speed of 180 m/min, a feed rate of 0.2 mm/min, and a depth of cut of 1 mm were used for rough turning. SNMG 090404-F3P (ISCAR Ltd., Israel) double-sided 90° square cutting elements with a tip radius of 0.4 mm, cutting speed of 240 m/min, feed speed of 0.15 mm/min, and depth of cut of 0.3 mm were used for fine turning. A new cutting element was used for each sample.
3. Results and Discussion
3.1. Achieved Chemical Composition of Charges
Table 2 and Table 3 show the chemical compositions of the laboratory melts. The analysis shows that silicon, manganese, and carbon in all charges are in a narrow and relatively equal range of the target chemical composition; Si = 0.59–0.81%, Mn = 1.65–1.94%, and C = 0.44–0.49%. In the first group of four charges (T1–T4), which were alloyed with Ti and S (Table 2), the Ti content varies between 0.0184 and 0.0591%. The second charge (T2) is without S addition and alloyed only with Ti, while the other three, in addition to the increasing Ti content, are also alloyed with approx. 0.033% S added. Another group of four charges (S1–S4) was alloyed with Al, S, and Ca (Table 3). In all four charges, the Al content is 0.03% and the Ca content is approx. 0.0014%, while the S content increases from 0.026% to 0.084%.
3.2. Metallographic Analyses
The microstructure of all eight produced charges of steel is ferritic–pearlite (Figure 1) with a grain size between 7 and 8 (Table 4), assessed according to the ASTM E112-13 standard [40]. As can be seen in Table 4, the content of Ti, Al, S, and Ca does not affect the grain size significantly.
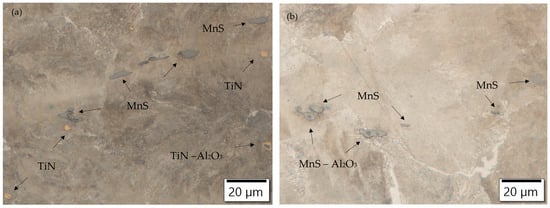
Figure 1.
Ferrite–pearlite microstructure of charges (a) T3 and (b) S4 with typical inclusions; 500× magnification.
Table 4.
Size of crystal grains in steel charges according to the standard ASTM E 112-13.
For all charges, the crystal grain size varies between 7.1 and 7.8 (21.1–28.1 µm). The size of the crystal grains is mainly influenced by the cooling rate of the ingots and their thermomechanical treatment, which did not change in the given case.
Non-metallic inclusions are also present in the ferrite–pearlite microstructure. Oxide inclusions, elongated manganese sulfides (MnS inclusions), and modified oxide inclusions, which also act as nucleation sites for the sulfide inclusions, are present in all charges. Titanium nitrides are also present in the Ti-alloyed charges. SEM images of typical non-metallic inclusions of charges alloyed with Ti and S (T3) and alloyed with S, Ca, and Al (S4) are shown in Figure 2.
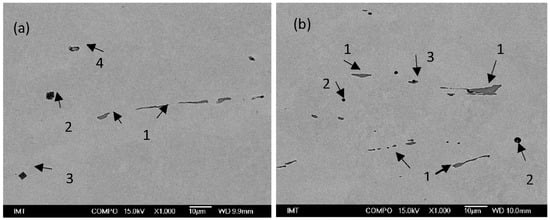
Figure 2.
SEM images of non-metallic inclusions in charge samples (a) T3 (1—MnS, 2—AlO3SiO2MnO, 3—TiN with Al2O3, 4—MnS) and (b) S4 (1—MnS, 2—CaOAl2O3, 3—MnS with Al2O3).
3.3. Non-Metallic Inclusions
The emerging inclusions in the researched type of low-alloy steel are primarily oxide inclusions of the ternary system MnO–SiO2–Al2O3. As a result of titanium alloying, in addition to TiN, complex binary inclusions of TiOx–Al2O3 with the presence of a MnO or SiO2 phase are formed. Titanium inclusions are formed, which can be pure nitride, pure oxide, or multiphase, consisting of nitride, sulfide, or oxide phases (TiN, (Ti, Al, O), MnS) [41]. Many mixed oxide-based nitride inclusions (Al2O3) are present in the manufactured charges (T1–T4), Figure 3. Titanium also affects the sulfide inclusions and the formation of two-phase inclusions composed of MnS and TiN, as shown in Figure 4. By increasing the addition of titanium, the proportion of titanium increases in the nitride, oxide, and sulfide inclusions [20].

Figure 3.
TiN inclusion with (Sp.1) and without Al2O3 oxide (Sp.2) analyzed in charge T2.
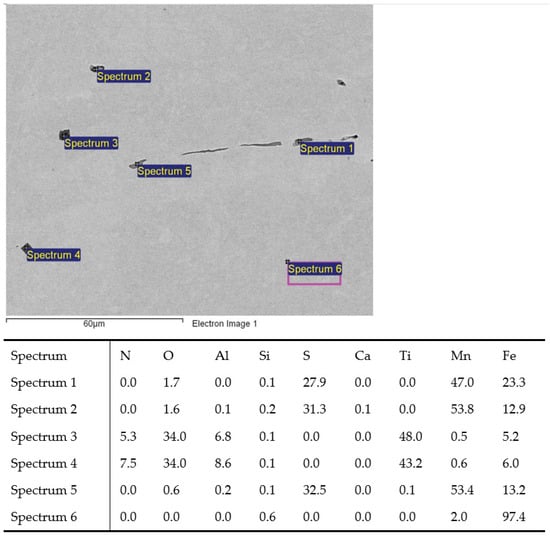
Figure 4.
MnS inclusions (Sp.1, 2, 5) and TiN with oxide in middle (Sp.3, 4); charge T3.
In charges with increased sulfur content and added aluminum and calcium (S1–S4), pure MnS and two-phase MnS–Al2O3 or MnS–CA inclusions are being formed (Figure 5). The result of the deoxidation of the steel with aluminum is the formation of aluminate inclusions from the MnO–SiO2–Al2O3–MnS system [42].
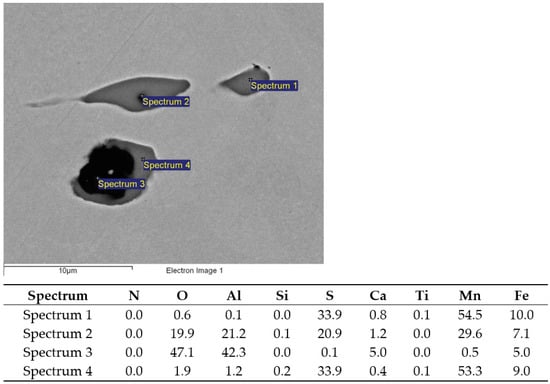
Figure 5.
MnS (Sp. 1, 4), two-phase MnS-Al2O3 (Sp.2), and CaO-Al2O3 (Sp.3) inclusions; charge S1.
Pure aluminates have a high melting point, and are hard and irregularly shaped; complex ones have a lower melting point, and are soft and globular. As a result of the added calcium, calcium aluminates (CAs) with a low melting point are also formed. In charges S1–S4, both modified CA inclusions and unmodified aluminate inclusions with a small amount of a CaO phase are present. The latter, in the formation of primary MnS inclusions, can act as seeds for their nucleation on existing aluminate oxides [20]. Thus, we find MnS inclusions with a smaller part of the CA phase. The distribution of inclusions in the CaO–Al2O3–SiO2 ternary phase diagram shows that in all four charges with an increased proportion of Ca added to modify the inclusions, the composition of the inclusions shifts towards the CaO–Al2O3 binary diagram [20]. The analysis of the shape of the formed MnS inclusions shows that in all charges, the MnS inclusions are mainly elongated, and with the increase in the proportion of sulfur, they become more elongated.
Ternary plots, presented in Figure 6, Figure 7, Figure 8 and Figure 9, show two points per single non-metallic inclusion, labeled as “rel” and “wt%”. The “rel” points are calculated in the established way of normalization (or relativization) such that for every row (A, B, C), the sum of all three components A + B + C is 1 (or 100%). This is calculated by the formula Arel = A × 100/(A + B + C) and in the same way for Brel and Crel. The calculation of points under “wt%” labels is performed simply by Awt% = A/100; Bwt% = B/100; and Cwt% = C/100. This is only possible since the chemical composition of each non-metallic inclusion for each component is inherently between 0 and 1 (0 and 100%). Awt% is thus actually the weight percent of component A in the analyzed non-metallic inclusion. The new “wt%” calculated and plotted ternary plots seem to be more intuitive and informative when used combined with established normalized (relative) ternary plots. It is worth noting that generally for some components of ternary plot calculation in form Awt% = A/100, it is not possible if the component is not inherently between 0 and 100%. It is, however, possible to normalize only a single component of the ternary plot to some (e.g., max) value of a given component distribution. In the case of non-metallic inclusions, one such component is inclusion area, where the upper bound of the component is generally not between 0 and 1.
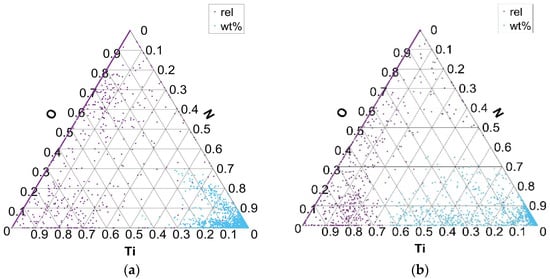
Figure 6.
Distribution of Ti and N elements in Ti–N–O ternary phase equilibrium in charges T1 (a) and T4 (b).
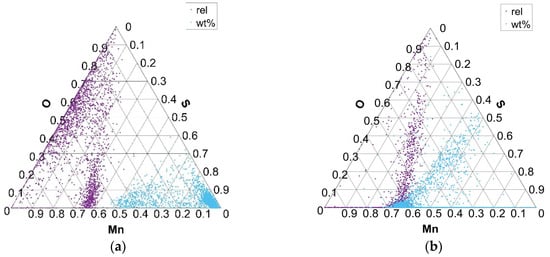
Figure 7.
Distribution of Mn and S elements in Mn–S–O ternary phase equilibrium in charges S1 (a) and S4 (b).
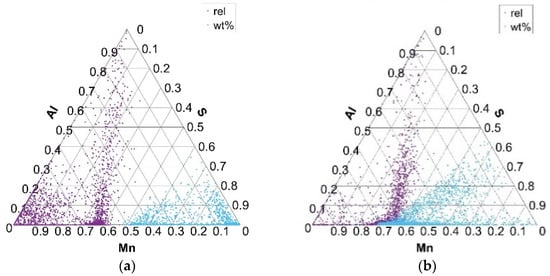
Figure 8.
Distribution of Mn, S, and Al elements in Mn–S–Al ternary phase equilibrium in charges S1 (a) and S4 (b).
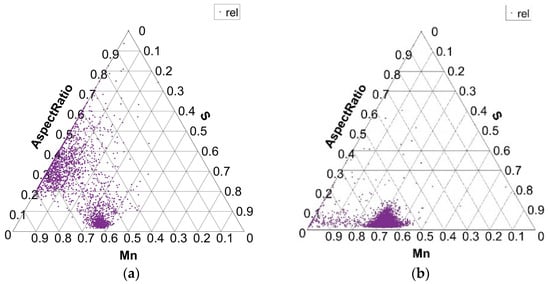
Figure 9.
Size distribution of MnS inclusions (aspect ratio) in charges S1 (a) and S4 (b).
An advantage of “wt%” representation is that a chemical composition of particular inclusion (point in ternary plot) is directly readable despite being placed in ternary plots in more dense ‘clouds’. On the contrary, the ‘rel’ representation forms more spread clouds and thus gives more precise interrelation among (A, B, C) components, but without exact chemical composition. From the authors’ point of view, the combined representation of both “rel” and “wt%” compositions of non-metallic inclusions in the ternary plot gives improved insight into their interrelations.
Figure 6 shows the distribution of the formed phases in the Ti–N–O ternary diagram for charges with added Ti (T1 with 0.018% Ti and T4 with 0.059% Ti). TiO and TiN inclusions are formed as part of the distribution of Ti, N, and O elements. The distribution of the formed phases between the Ti, N, and O elements, according to the composition of all analyzed inclusions, shows that inclusions are mainly formed in the corner of the N–Ti binary diagram. At higher Ti contents, the fraction of Ti in the TiN inclusions increases. In the charges where Ti was not added and its proportion in the steel is negligible (S1–S4), phases are formed in the area of the binary diagram O–N.
The variation in the composition of MnO- and MnS-type inclusions for charges with added Al, Ca, and S (S1–S4) is shown in the Mn–S–O ternary diagram in Figure 7 (S1 with 0.026% S and S4 with 0.084% S). The exclusive equilibrium between Mn, S, and O elements (rel) indicates the formation of phases of MnS non-metallic inclusions and mixed inclusions of MnS and MnO composition. Equilibrium phases between the Mn, S, and O elements, according to all analyzed phases or present inclusions (wt%), indicate the formation of mainly MnS phases of inclusions with different proportions of Mn. Similarly, but in smaller numbers, MnS phases are formed in charges T1, T3, and T4, while in charge T2, due to the extremely low proportion of sulfur, there are practically no MnS phases and mainly MnO–SiO2 oxide phases are formed.
As the sulfur content in the steel increases (charges S1 to S4), the amount of MnO and MnS combined inclusions decreases, while the number of MnS increases, especially in charge S4. In charge S4, the composition of the MnS inclusions also changes to higher concentrations of Mn and S in the inclusions (Figure 7a).
Ternary diagrams of elements between Mn, S, and Al for charges S1–S4 (Figure 8) show the same arrangement of the formed phases as in the Mn–S–O ternary equilibrium. This actually confirms that, in addition to MnS and MnO inclusion phases, MnS and Al2O3 mixed inclusion phases are also formed. There are no significant differences in the formation of Mn–S–Al phases, in terms of the formation of complex sulfide inclusions, in charges S1–S4.
The shape of MnS inclusions is found in Figure 9, where the diagram shows the aspect ratio of MnS inclusions for charges S1 and S4. In charge S1, there are a few MnS inclusions with an aspect ratio of up to 0.1. The same is true for the S4 charge. These values indicate the presence of elongated inclusions. But in charge S1, there is a good part of MnS inclusions with an aspect ratio of 0.2 to 0.6, which indicates the formation of rounder MnS forms as well. The analysis of the inclusions and metallographic examination showed that elongated inclusions with an aspect ratio below 0.2 are simple MnS inclusions, while rounder inclusions with an aspect ratio from 0.2 to 0.6 are more complex in composition. Similar shapes and sizes of MnS inclusions, as in charge S1, are found in charges S2 and S3, with the exception of charge S4. In charge S4, with the largest proportion of S in the steel melt, the aspect ratio of most MnS inclusions is below 0.2, which indicates the presence of mostly elongated MnS inclusions.
3.4. Mechanical Properties
The results of the mechanical properties’ measurements are shown in Table 5.
Table 5.
Hardness, tensile strength, elongation, contraction, and toughness of the investigated charges.
For charges with added Ti, the hardness and tensile strength increase with increasing titanium content in the steel (T1 -> T4). On the contrary, with an increase in the proportion of Ti, the toughness decreases, with the highest toughness values being reached in the charge without the addition of sulfur, i.e., T2 (Figure 10a). In charges with an increased proportion of S and Al, as the proportion of sulfur (S1 -> S4) increases, the hardness and tensile strength decrease, while the toughness increases (Figure 10b).
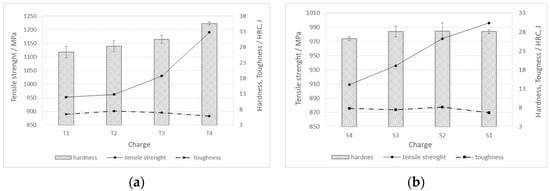
Figure 10.
Mechanical properties (hardness, tensile strength, and toughness) for charges of steels (a) T1–T4, and (b) S1–S4.
The steel machinability was investigated by the cutting process and a measurement of cutting forces, which included cutting force (Fc), push force (Fp), and feed force (Ff). Figure 11 shows the components of the cutting forces during rough turning, depending on the hardness of the produced steel charges. In the case of both charge groups (with the addition of Ti and S, see Figure 11a, and with the addition of Al, Ca, and S, see Figure 11b), the cutting forces decrease with the decreasing hardness or tensile strength of the steel.
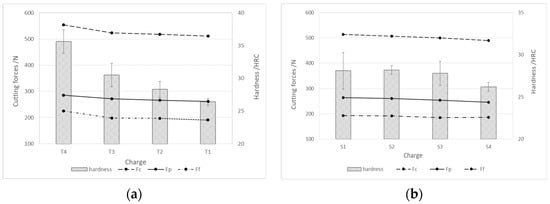
Figure 11.
Cutting forces during rough turning depending on the hardness of the produced charges of steel; (a) charges with higher % Ti and (b) charges with higher % S and Al.
Figure 12 shows the components of the cutting forces during rough turning. The cutting forces during rough turning in charges with added Ti increase with an increase in the proportion of Ti, while in charges with added Al, Ca, and S, they decrease with an increase in the proportion of S. The same trend is also present in fine turning (Figure 13). The cutting force Fc during rough turning is in the range of 500–550 N, the thrust force Fp between 250 and 300 N, and the feed force Ff in the range of 200N. For fine turning, Fc values are between 130 and 140 N, Fp between 90 and 100 N, and Ff between 60 and 70 N. A distinct trend of a decrease in cutting forces with increasing S content is noticeable, which is a consequence of a higher proportion of pure MnS inclusions and their more elongated/filamentous shape. In the case of charges with Ti, as the proportion of Ti increases, the proportion of TiN inclusions increases, and with it the hardness of the steel, and thus machinability is reduced [43,44,45,46,47].
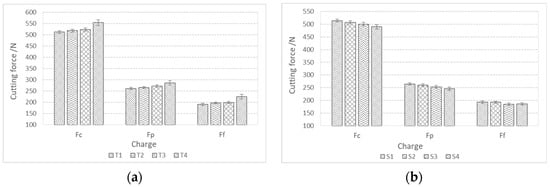
Figure 12.
Components of cutting forces (Fc, Ff, Fp) during rough turning of bars made from charge steels; (a) with a higher proportion of Ti and (b) with a higher proportion of Al, Ca, and S.
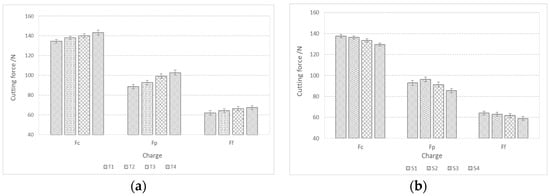
Figure 13.
Components of cutting forces (Fc, Ff, Fp) during fine turning of bars made from manufactured steel charges; (a) with a higher proportion of Ti and (b) with a higher proportion of Al, Ca, and S.
In addition to the lower values of the cutting forces, the better machinability of the steels is also manifested in lower roughness or finer surface qualities. The achieved values of the mean height of the unevenness of the roughness profile Rz and the mean arithmetic deviation of the profile Ra during fine turning of bars are shown in Figure 14. We can see that in charges with a higher proportion of Ti, the value of Ra is in the range of 1.5 m and the value of Rz is in the range of 7 m (Figure 14a). The Ra value decreases with increasing Ti content, which is typical for steels with increased hardness and lower toughness, and the formation of short spiral chips (Figure 15a). The exception is charge T2 with the highest toughness, which prevents normal chip breaking and fine processing. Rz increases with an increase in the proportion of Ti, and with such a larger proportion of TiN inclusions, these can be torn out of the surface during cutting. In charges with a higher proportion of Al, Ca, and S, the roughness values are higher (Ra = 1.5–2.0 m and Rz = 7.5–8.0 m), which is the result of softer and tougher material and the formation of long spiral shavings (Figure 15b). Significant differences in surface roughness cannot be observed between charges with different S content, also due to the scatter of the measurement results (Figure 14b).
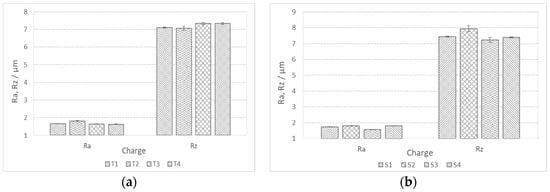
Figure 14.
Mean profile deviation (Ra) and mean height of unevenness (Rz) of bar surface during fine turning; (a) charges with higher %Ti and (b) charges with higher %S.
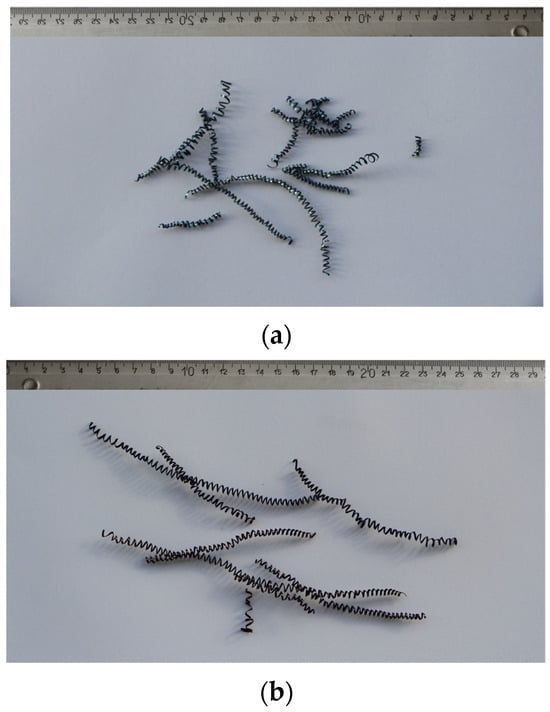
Figure 15.
Chips produced during fine turning; (a) in charge T4 with the highest Ti content and (b) charge S4 with the highest S content.
4. Conclusions
The present research, which included the production of two series of laboratory charges of low-carbon steel with the same basic chemical composition but different levels of “trace” elements, was focused on a determination of the effect of Ti and S content on the formation of non-metallic inclusions, mechanical properties, and machinability of steel. In the first series, the content of titanium in the steel varied from 0.0184 to 0.0591%, while in the second series, with the same addition of aluminum and calcium, the content of sulfur in the steel varied from 0.026 to 0.084%. The results of the research can be summarized in the following conclusions:
- The contents of Ti or S and Al do not affect the grain size in the as-cast state significantly. In all eight produced charges of steel, regardless of the content of Ti, S, and Al, the microstructure is ferrite–pearlite, with a grain size between 7 and 8, according to the ASTM standard.
- In charges with an elevated Ti content, Ti–O and especially TiN inclusions, with and without oxide (Al2O3) in the middle, are present in addition to non-metallic sulfide inclusions. By increasing the addition of titanium, the proportion of titanium increases in both oxide and sulfide inclusions. In charges with increased S, Al, and Ca content, mainly MnS, Al2O3, and mixed MnS–Al2O3 inclusions and modified CaO-Al2O3 inclusions are formed. As the sulfur content in steel increases, the amount of mixed MnO–MnS inclusions decreases, while the number of MnS increases. The MnS inclusions have an elongated shape, which increases with increased S content, reaching a strip-like shape at the highest S content.
- The hardness and tensile strength of the investigated low-carbon steel increase with increasing Ti content (26.4 HRC → 35.6 HRC; 952 MPa → 1190 MPa), while impact toughness and elongation decrease (6.5 J → 5.8 J; 14, 2% → 12.2%), which can be related to the presence of hard Ti–N–O inclusions. In contrast, with an increase in S content and the formation of softer sulfide inclusions, the hardness and tensile strength decrease (28.2 HRC → 26.2 HRC; 996 MPa → 909 MPa), and impact toughness and elongation increase (6.7 J → 7.8 J; 13.6% → 14.5%).
- In accordance with the increase in hardness and tensile strength, the cutting forces also increase with increased Ti content (approx. 10%). And this is true for both rough and fine turning. In contrast, with an increased content of S and corresponding decrease in hardness, the cutting forces decrease while steel machinability is improved. However, the influence of S is smaller (approx. 5%) as compared to Ti.
- The influence of Ti and S content on the steel’s machinability and surface quality was evaluated through a surface-roughness analysis, performed after fine turning. Although the addition of Ti increases the hardness and makes machining more difficult, it results in a finer surface. The addition of S, on the other hand, increases the toughness, which causes the formation of long spiral chips and a rougher surface.
Author Contributions
Conceptualization, B.A. and B.P.; methodology, F.T.; investigation, B.A. and F.T.; software, F.V.; writing—original draft preparation, B.A.; data curation, B.A. and F.V.; validation, B.A.; visualization, F.V.; supervision, B.P.; writing—review and editing, B.P. All authors have read and agreed to the published version of the manuscript.
Funding
This research has the financial support from the Slovenian Research Agency (ARIS), research core funding No. P2-0050.
Data Availability Statement
The raw data supporting the conclusions of this article will be made available by the authors on request.
Acknowledgments
The authors would like to acknowledge Luka Kranc and Jaka Burja for performing such laboratory charges. Thanks also to Borut Žužek due to the production of mechanical tests.
Conflicts of Interest
The authors declare that in this research, there are no conflicts of interest.
References
- Hamler, T. Analiza Sodobnih Postopkov Odrezavanja. Diploma Thesis, University of Maribor (UM), Maribor, Slovenia, 2008. [Google Scholar]
- Luiz, N.E.; Machado, À.R. Devepolments trends and review of free-machining steels. J. Eng. Manuf. 2008, 222, 347–360. [Google Scholar] [CrossRef]
- Sanjana, E.; Vishnu, A.V.; Naidu, G.G.; Kumar, K.S. Machinability of Alloy steels-A Review. Int. J. Sci. Res. Dev. 2016, 10, 50–53. [Google Scholar]
- Martinez Krahmer, D.; Urbican, G.; Sànchez Egea, A.J. Dry machinability analyses between free cutting, resulfurized and carbon steels, Materials and Manufacrturing Processes. Mater. Manuf. Process. 2020, 35, 460–468. [Google Scholar] [CrossRef]
- Wang, F.; Guo, H.; Liu, W.; Yang, S.; Zhang, S.; Li, J. Control of MnS Inclusions in High and Low-Sulfur Steel by Tellerium Treatment. Materials 2019, 12, 1034. [Google Scholar] [CrossRef]
- Wang Sujan, Zhang Tao, Deng Wenping, Sun Zhanwen, sandy to Analitycal modeling and prediction of cutting forces in orthogonal turing: A review. Int. J. Adv. Manuf. Technol. 2022, 119, 1407–1434. [CrossRef]
- Özel, T.; Hsu, T.-K.; Zeren, E. Effects of cutting edge geometry, workpiece hardness, feed rate and cutting speed on surface roughness and forces in finish turning of hardened AISI H13 steel. Int. J. Adv. Manuf. Technol. 2005, 25, 262–269. [Google Scholar] [CrossRef]
- Watari, K.; Aiso, T.; Iwasaki, T. Development of Lead-free Free-cutting Steel and Cutting Technology. Nippon. Steel Sumitomo Matal Tech. Rep. 2017, 116, 32–37. [Google Scholar]
- Free, M. Important Machining Factors of Carbon of Steels, Production Machining. Available online: https://www.productionmachining.com/articles/important-machining-factors-of-carbon-steels (accessed on 27 March 2023).
- Maravčikovà, J.; Moravčik, R.; Palcut, M. Effect of Heat treatment on resulting Dimensional Characteristics of the C45 Carbon Steel after Turning. Metals 2022, 12, 1899. [Google Scholar] [CrossRef]
- Guo, J.; Yang, W.; Shi, X.; Zheng, Z.; Liu, S.; Duan, S.; Wu, J.; Guo, H. Effect of Sulfur Content on the Properties and MnS Morphologies of DH36 Structural Steel. Metals 2018, 8, 945. [Google Scholar] [CrossRef]
- Park, H.; Lee, C.; Kim, K.W.; Kim, S.D.; Jang, J.H.; Ha, H.Y.; Moon, J.; Lee, C.H.; Park, S.J. Effect of S addition on mechanical and machinability propretries in austenitic Fe-Mn-Al-C lightweight steels. Mater. Sci. Eng. A 2022, 856, 143939. [Google Scholar] [CrossRef]
- Semih Genculu, P.E. Factors Affecting Machining Machinability of Metals. Available online: www.cabww.com (accessed on 16 January 2023).
- Anmark, N.; Karasev, A.; Jönsson, P.G. The Effect of Different Non-Metallic Inclusions on the Machinability of Steels. Materials 2015, 8, 751–783. [Google Scholar] [CrossRef] [PubMed]
- Songmene, V.; Zaghbani, I.; Kientzy, G. Machining and machinability of tool steels: Effects of lubrication and nmachining conditions on tool wear and tool life data. Procedia CRIP 2018, 77, 505–508. [Google Scholar] [CrossRef]
- Farahat, A.I.Z.; Abdel-Hamid, Z.; Gomaa, N. Effect of Manganese Sulphide Shapes on the Work-hardening Coefficient of Hot Rolled Structural Steel. J. Metall. Eng. 2015, 4, 346–355. [Google Scholar] [CrossRef]
- Luo, S.; Wang, B.; Wang, Z.; Jiang, D.; Wang, W.; Zhu, M. Morphology of Solidification Structure and MnS Inclusion in High Carbon Steel Continuously Cast Bloom. ISIJ Int. 2017, 57, 2000–2009. [Google Scholar] [CrossRef]
- Shen, P.; Fu, J. Morphology Study on Inclusion Modifications Using Mg-Ca Treatment in Resufurized Special Steel. Materials 2019, 12, 197. [Google Scholar] [CrossRef] [PubMed]
- Li, G.-Z.; Wang, F.-M.; Hui, R.; Cao, W.-K. Effect of sulfur addition methods and Ca-Si treatment on the microstructure and properties of 30MnVS. Int. J. Miner. Metal. Mater. 2009, 16, 650. [Google Scholar]
- Kranjc, L. Mehanizem Tvorbe Nekovinskih Vključkov v Jeklih s Povišano Vsebnostjo Žvepla, Doktorska Disertacija. Ph.D. Dissertation, Technical University of Natural Sciences in Ljubljana (FNT-UNI), Ljubljana, Slovenia, 2014. [Google Scholar]
- Oikawa, K.; Ohtani, H.; Ishida, K.; Nishizawa, T. The Control of the morphology of MnS Inclusions in Steel during Solidification. ISIJ Int. 1995, 35, 402–408. [Google Scholar] [CrossRef]
- Tanaka, Z.; Pahlevani, F.; Moon, S.-C.; Dippenaar, R.; Sahajwalla, V. In situ characterisation of MnS precipitation in high carbon steel. Sci. Rep. 2019, 9, 10096. [Google Scholar] [CrossRef]
- Guo, S.; Karasev, A.V.; Tilliander, A.; Jönsson, P.G. Evaluation of Sulfide Inclusions before and after Deformation of Steel by Using the Electrolytic Extraction Method. Metals 2021, 11, 543. [Google Scholar] [CrossRef]
- Kim, H.S.; Lee, H.-G.; Oh, K.-S. Precipitation behavior of MnS on Oxide Inclusions in Si/Mn Deoxidized steel. Met. Mater. 2000, 6, 305–310. [Google Scholar] [CrossRef]
- Holappa, L.; Hämäläinen, M.; Liukkonen, M.; Lind, M. Thermodinamic examination of inclusion modification and precipitation from calcium treatment to solidified steel. Ironmak. Steelmak. 2003, 30, 111–115. [Google Scholar] [CrossRef]
- Yang, S.; Zhao, M.; Feng, J.; Li, J.; Liu, C. Induced-Pitting Behaviors of MnS Inclusions in Steel. High Temp. Mater. Process. 2018, 37, 1007–1016. [Google Scholar] [CrossRef]
- Shao, X.; Wang, X.; Jiang, M.; Wang, W.; Huang, F. Effect of heat treatment conditions on shape control of large-sized elongated MnS inclusions in resulfurized free-cuuting steels. ISIJ Int. 2011, 51, 1995–2001. [Google Scholar] [CrossRef]
- Oikawa, K.; Ishida, K.; Nishizawa, T. Effect of Titanium Addition on the Formation and Distribution of MnS Inclusions in Steel during Solidification. ISIJ Int. 1997, 37, 332–338. [Google Scholar] [CrossRef]
- Wang, C.; Nuhver, N.T.; Sridhar, S. Transient behavior of inclusion Chemistry, Shape and Structure in Fe-Al-Ti-O melts: Effect of fradual increase in Ti. Metall. Mater. Trans. B 2009, 41, 1022–1034. [Google Scholar] [CrossRef]
- Kim, H.S.; Lee, H.G.; Oh, K.S. Evolution Size, composition and morphology of primary and secondary inclusions in Si/Mn and Si/Mn/Ti deoxidized steels. IJS Int. 2002, 42, 1404–1411. [Google Scholar] [CrossRef]
- Kikuchi, N.; Nabeshima, S.; Kishimoto, Y.; Sridhar, S. Micro-structure refinement in low carbon high manganese steels through Ti-deoxidation-inclusion precipitation and solidification structure. IJS Int. 2008, 48, 934–943. [Google Scholar] [CrossRef]
- Wang, D.; Jiang, M.; Matsuura, H.; Tsukihashio, F. Dynamic evolution of inclusion in Ti-bearing Al-deoxidized molten irons at 1873 K. Steel Res. Int. 2014, 85, 16–25. [Google Scholar] [CrossRef]
- Shhu, Q.; Visuri, V.-V.; Alatarvas, T.; Fabritius, T. Model for precipitation kinetics during solidification of steel applications in MnS and TiN inclusions. Metal. Mater. Trans. B 2020, 51, 2905–2916. [Google Scholar] [CrossRef]
- Baker, T.N. Titanium microalloyed steels. Ironmak. Steelmak. 2019, 46, 1–55. [Google Scholar] [CrossRef]
- Capurro, C.; Cicutti, C. Analysis of titanium nitrides precipitated during medium carbon steels solidification. J. Mater. Res. Technol. 2018, 7, 342–349. [Google Scholar] [CrossRef]
- Mu, W. Microstructure and Inclusion Characteristics in Steels with Ti-Oxide and TiN Additions. Ph.D. Thesis, KTH Royal Institute of Technology, Stockholm, Sweden, 2015. [Google Scholar]
- ASTM E8/E8M-22; Standard Test Methods for Tension Testing of Metallic Materials. American Association State: Tallahassee, FL, USA, 2022.
- EN ISO 148-1; Metallic Materials-Charpy Pendulum Impact Test. International Standard, Europe: Geneva, Switzerland, 2023.
- EN ISO 6508-1; Metallic Materials-Rockwell Hardness Test. International Standard, Europe: Geneva, Switzerland, 2023.
- ASTM E112-13; Standard Test Methods for Determining Average Grain Size. American Association State: Tallahassee, FL, USA, 2021.
- Choi, W.; Matasuura, H.; Tsukihashi, F. Effect of Nitrogen on the formation and evolution of non-metallic inclusions in Fe-Al-Ti-N alloy. ISIJ Int. 2013, 53, 2007–2012. [Google Scholar] [CrossRef][Green Version]
- Kim, Y.-J.; Woo, D.-H.; Gaye, H.; Lee, H.-G.; Kang, Y.-B. Thermodinamic of MnO-SiO2-Al2O3 Liquid Oxysulfide: Experimental and Thermodynamic Modelling. Metall. Mater. Trans. B 2011, 42, 535–545. [Google Scholar] [CrossRef]
- Zhao, F.; Liu, X.; Zhang, Z.; Xie, J. Effect of nitrogen content on the mechanical properties and deformation behaviors of ferritic-pearlitic steels. Mater. Sci. Eng. A 2022, 855, 143918. [Google Scholar] [CrossRef]
- Abouridouane, M.; Lschet, G.; Kripak, V.; Dierdorf, J.; Prah, U.; Witz, G.; Bergs, T. Microstructure-based approach to predict the machinability of the ferritic-pearlitic steel C60 by cutting operations. Procedia CIRP 2019, 82, 107–112. [Google Scholar] [CrossRef]
- Ren, J.; Ren, F.; Li, F.; Cui, L.; Xiong, Y.; Volinsky, A.A. Effect of microstructure, Mechanical and Physical Properties on Machinability of Graphite Cast Irons. Metals 2020, 10, 285. [Google Scholar] [CrossRef]
- Hiremath, P.; Gajrani, K.K.; Joshi, S. Effect of Composiion, microstructure and Hardness after Heat treatment on Machinability of Steel Forgings. J. Mater. Eng. Perform. 2020, 29, 1751–1766. [Google Scholar] [CrossRef]
- Fountas, N.A.; Papantoniou, I.; Manolakos, D.E.; Vaxevanidis, N.M. Implementation og grey Wolf, Multi-Verse and Ant Lion Metaheuristic Algorithms for Optimizing Machinability of Dry CNC Turning of Annealed and Hardnened UNIMAX Tool Steel. Machines 2024, 12, 156. [Google Scholar] [CrossRef]


Disclaimer/Publisher’s Note: The statements, opinions and data contained in all publications are solely those of the individual author(s) and contributor(s) and not of MDPI and/or the editor(s). MDPI and/or the editor(s) disclaim responsibility for any injury to people or property resulting from any ideas, methods, instructions or products referred to in the content. |
© 2024 by the authors. Licensee MDPI, Basel, Switzerland. This article is an open access article distributed under the terms and conditions of the Creative Commons Attribution (CC BY) license (https://creativecommons.org/licenses/by/4.0/).