Article

The Interplay between Nucleation and the Rates of Chemical Reduction in the Synthesis of Bimetallic Nanoparticles in Microemulsions: A Computer Study

Physical Chemistry Department, Faculty of Chemistry, University of Vigo, E-36310 Vigo, Spain
Metals 2024, 14(9), 987; https://doi.org/10.3390/met14090987
Submission received: 17 July 2024 / Revised: 24 August 2024 / Accepted: 27 August 2024 / Published: 29 August 2024
(This article belongs to the Section Computation and Simulation on Metals)

Abstract

:
Monte Carlo simulations were conducted to investigate the interaction between nucleation and the rates of chemical reduction in Au/Ag, Au/Pt and Au/Pd nanoparticles prepared in microemulsions using a one-pot method. The impact of nucleation on final nanostructure depends on the critical nucleus size value: at a high critical nucleus size, nucleation becomes the main factor in determining the final nanostructure, even with a very large difference in reduction rates, as seen in the Au/Pd pair. However, when the critical nucleus size is small, the difference in reduction rates of the two metals becomes the key parameter determining the final nanostructure. Furthermore, the relevance of heteroatomic nucleation on the mechanism of nanoparticle formation depends on the difference between the reduction rates of the two metals. Smaller differences, such as in the Au/Ag or Au/Pt pairs, result in a greater impact of heteroatomic nucleation on the final nanostructure. In contrast, in the Au/Pd pair, heteroatomic nucleation becomes less important due to the low availability of Pd until late stages of synthesis. This study provides deeper insight into the complex mechanisms that govern reactions in microemulsions.

Graphical Abstract

1. Introduction

Bimetallic nanoparticles have garnered significant interest due to their unique properties and their applications in various fields such as catalysis [1,2,3,4,5], magnetic properties regulation [6], optoelectronic devices [7], and surface plasmon band modifications [8]. All these enhanced properties result from changes in surface and structure caused by alloying. Therefore, controlling the composition distribution of bimetallic nanoparticles is crucial for improving the nanoparticle properties.
Different approaches have been employed to synthesize bimetallic nanoparticles, with the micremulsion route being one of the most commonly used [3,9,10]. A microemulsion is a thermodynamically stable dispersion of water droplets in a continuous oil phase (reverse micelles), protected by a surfactant layer at the interface of oil and water. This surfactant film surrounds the water droplets, reducing interfacial tension. The primary advantage of using microemulsions is that surfactant-stabilized droplets act as nanoreactors for processing reactions within them and serve as protective barriers for particles. When small amounts of an aqueous solution containing metal ions are added to a micellar solution, the species will be solved in the aqueous phase, encapsulated within droplets. When two microemulsions, each one containing one reactant, are mixed, the water pools act as “nanoreactors”. This facilitates the exchange of their contents through fusion and redispersion processes, so when both reactants are enclosed within the same microemulsion droplet, chemical reactions can take place. In this way, reverse micelles offer a suitable reaction medium for controlled nucleation and growth, which promotes the formation of nanoparticles with narrow size distribution. Furthermore, the surfactant layer’s stabilizing effect prevents nanoparticle aggregation, thereby ensuring effective control over particle size.
Advancing the microemulsion method and thoroughly understanding the mechanism of bimetallic nanoparticle formation within microemulsion droplets are crucial for controlling the final nanoarrangement. The intraparticle nanostructure significantly determines the final properties of nanoparticles, and it is the result of the mechanism of nanoparticle formation. A nanoparticle originates from a nucleus and grows by accumulating new layers as additional atoms are deposited over the existing ones. It is believed that the main determinant of the order of metal deposition in a bimetallic nanoparticle is the difference between the reduction potentials of the two metals [11,12,13,14]. If ions of two different metals are in close proximity, such as within a micelle, the metal precursor with higher potential is reduced faster than the other and it builds up the nucleus and internal layers. Then, the other metal with lower reduction potential (more slowly reduced) is deposited forming the surrounding shell. For example, Ag-Ni [15] (Δε° = 1.04 V) or Ir-Pt [16,17] (Δε° = 0.7 V) nanoparticles have been obtained as core-shell nanostructures. On the contrary, quite similar reduction potentials result in simultaneous reduction of both ions, that typically yields a mixture of metals. This is the case of Pt-Ru nanoparticles (Δε° = 0.14 V), which are obtained as a nanoalloy using different microemulsion compositions [18,19,20,21]. In the case that both metals have intermediate differences in reduction potentials, such as Au-Pt nanoparticles (Δε° = 0.26 V), the metal segregation in the final nanoparticle strongly depends on the microemulsion composition. Thus, Au-Pt core-shell structures are obtained using rigid surfactant films [22] but Au-Pt alloys are obtained if the surfactant is flexible [23,24]. Nonetheless, although most bimetallic nanoparticles synthesized in microemulsions obey this trend (see [14] and references therein), it has been observed that mixed structures can still form even when dealing with metals with very different reduction potentials, such as Pd-Ni nanoparticles [25], that were synthesized as alloy in spite of the high difference in reduction potentials (Δε° = 1.15 V). This suggests that the disparity in reduction potential alone does not fully explain such phenomena.
The preparation of bimetallic nanoparticles with specific distribution of the two metals requires advanced control over the preparation method. Despite the great progress in this field in the last decade, resulting in the successful preparation of various bimetallic particle pairs in microemulsions, optimizing strategies to produce bimetallic nanoparticles are still under investigation. Further work is needed to achieve better control over the nanostructure of these materials. Theoretical studies are still limited, requiring a substantial trial-and-error effort to optimize the particle intrastructure. While several computer models have been developed to study the formation of single nanoparticles in microemulsions [26,27,28,29], the mechanism behind the formation of complex structures has been less explored. There are simulation studies of core-shell nanoparticle formation by a post-core method [30,31]. However, the formation of bimetallic nanoparticles in reverse micelles through the simultaneous reduction of two metal precursors (one-pot method) has been less investigated [13,32,33,34]. In several previous studies [33,34,35], we aimed to isolate the influence of the reduction rates of the two metals and their interaction with the interdroplet exchange rate. In these studies, the nucleation rate of both metals was assumed to be equal and very fast. Since both chemical reduction and nucleation occur early in synthesis, when cores are forming, a significant difference in reduction rates could mask the effects of varying critical nucleus sizes. Moreover, the role of critical nucleus size on final nanostructures was studied previously by keeping the two chemical reduction rates equal and instantaneous [36,37]. In this study, our goal is to investigate how the interplay between nucleation rate and reduction rates of the two metals affects the distribution of metals in the final nanoparticle. To this end, we selected three metal pairs, characterized by their chemical reduction rates, and analyzed how changes in the critical nucleus sizes influence the metal distribution. Understanding the influence of nucleation on bimetallic nanostructure considering different metal pairs (different reduction rates) is of major interest, because it could explain different results concerning metal distribution in bimetallic nanoparticles.

2. Simulation Procedure

The model simulates the kinetic course of the chemical reduction of different metal salts within the water-in-oil droplets that make up the microemulsion.

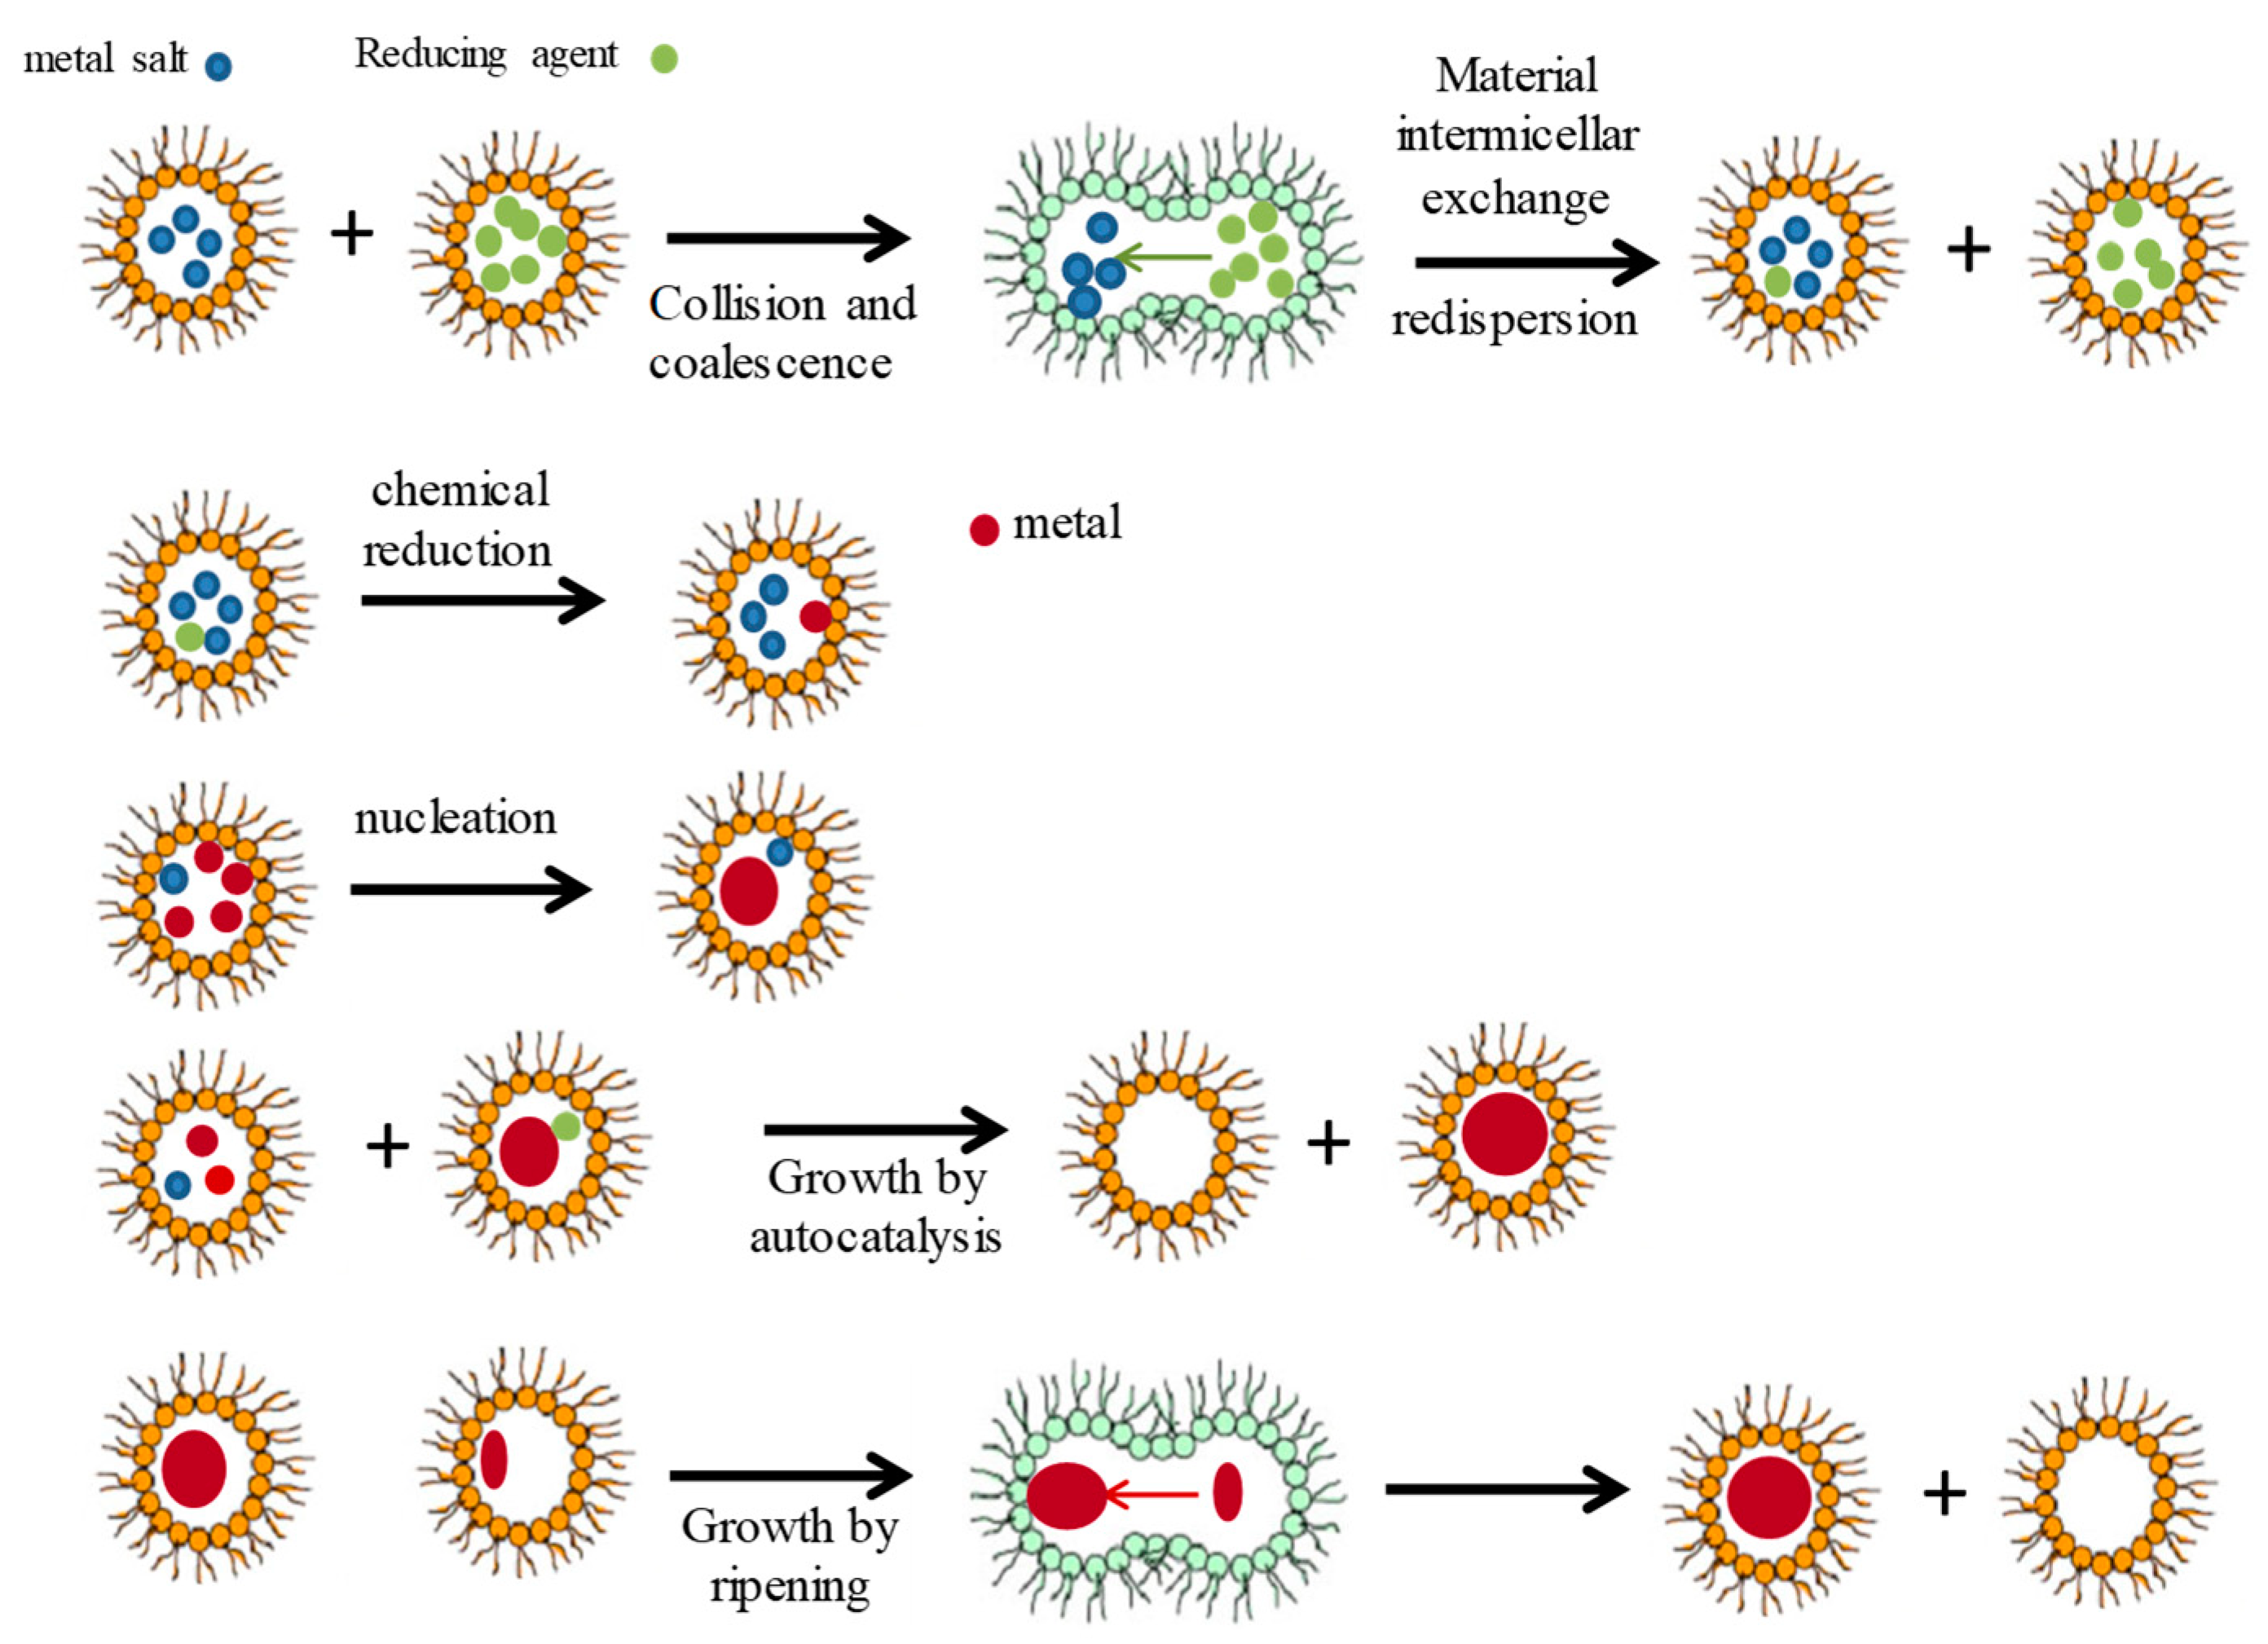
2.1. Microemulsion as Nanoreactor

The reaction medium is a water-in-oil microemulsion, which is a nanodispersion of water in oil, stabilized by a surfactant layer at the oil/water interface. These thermodynamically stable systems act as nanoreactors, within which the chemical reaction necessary to synthesize nanoparticles takes place. The microemulsion structure is represented as a set of spherical micelles in movement. In the one-pot method, equal volumes of three microemulsions, each containing a distinct reactant (metal precursor for each metal and reducing agent) are mixed. To simulate this procedure, the microemulsion is described as containing 15,000 droplets, of which 5000 carry one kind of reactant. Due to the dynamical nature of the microemulsion, micelles move and collide with each other. This motion is assumed to be governed by Brownian motion. When a collision between two micelles is sufficiently energetic, a channel can be established between droplets resulting in a transient dimer. In this situation, material can pass from one droplet to another. The transient dimer then splits into two droplets. In a previous algorithm, micelles moved to neighboring sites in a three-dimensional square lattice by randomly choosing their direction at each step. This random walk was subject to the exclusion principle, meaning only one micelle could occupy a site at any given time. Cyclic boundary conditions were applied at the ends of the network. Micelles occupied a volume fraction of 10%. A collision was defined as two micelles occupying adjacent positions in the lattice. A Monte Carlo step (mcs) was defined as the time taken for all micelles to move towards their nearest neighbor. The model was refined by randomly selecting 10% of micelles to collide in each Monte Carlo step. Upon collision, micelles fused temporarily to form a transient dimer, enabling the exchange of material contents through the water channel between them. After collision, the material inside the colliding droplets was revised (see exchange protocols described below) and micelles separated. One Monte Carlo step was completed after recalculating the material carried by all pairs of colliding micelles according to the material exchange criteria. Both methods of simulating motion and collision produced identical results. The second method was preferred for simulating bimetallic nanoparticle synthesis due to its reduced computational time.

2.2. Feeding Solution (〈c〉 Parameter)

As mentioned, the reactants were dissolved within the aqueous phase. Five thousand micelles carried the metal salt Au+ (the faster reduction metal), another 5000 carried the precursors of the second slower metal (metal salt M+, M = Ag, Pt, Pd), and 5000 carried the reducing agent R. The initial concentrations of the reactants in each micelle were sampled from a Poisson distribution. The number of each reactant per micelle is referred to as ni, where i represents Au+, M+, or R.
P ( n i ) = n i n i n i ! exp n i ;   i = Au + ,   M +   or   R
where P(ni) is the probability that a micelle carries ni reactants (Au+, M+ or R) whose average occupancy is 〈ni〉. We present results using an average concentration of metal precursor: 〈c〉 = 16 metal ions in a droplet, which corresponds to 0.08 M. The mean value of molar concentrations was obtained via an approximation of the hydrodynamic radius of the water droplets, considering a droplet radius r = 4 nm and assuming spherical shape. In this paper we show results for Au as a faster reduction metal, synthesized with a slower reduction metal M (M = Ag, Pt, Pd), using an Au:M molar ratio 1:1. The reducing agent concentration 〈cR〉 was always in a great excess ([R] = 〈cR〉 = 10 〈cAu〉) in order to achieve isolation conditions.
Initially, one droplet can only contain reactants, but as the synthesis advanced, reactants, metal products, seeds of nuclei, and growing nanoparticles could be located in the same droplet. As noted by Niemann et al. [28], a chemical reaction in microemulsions cannot be modeled as an overall rate for the whole reactor. In contrast to the bulk process, each micelle with its own concentration must be considered as a nanoreactor. Moreover, the interdroplet exchange in a transient dimer can modify these concentrations.

2.3. Droplet Size

The size of the droplet is proportional to the water-surfactant molar ratio. In the model, droplet size is represented by a parameter that restricts the maximum number of metallic products (and consequently the maximum particle size) that can be located inside a droplet. It is noteworthy that nanoparticles can grow larger than the initial droplet size [27,38], although there is no clear explanation of how nanoparticles can grow bigger than the droplet size. In this study, the droplet size is large enough to allow for unhinder nanoparticle growth.

2.4. Criteria for Interdroplet Exchange of Reactants and Non-Aggregated Products (Exchange Parameter kex)

Regardless of the presence or absence of product, when both colliding droplets contain the same kind of reactant, redistribution between the daughter droplets is based on a concentration gradient principle, so the reactant (metal salt or reducing agent) transfers from the droplet with the higher concentration to the one with the lower concentration. The parameter kex determines the maximum units of reactant that can be transferred during a collision. If the more concentrated droplet contains a number of reactants greater than kex, only kex units of reactant are exchanged to the droplet with the lower concentration. After collision, the concentrations inside the colliding droplets equalize, provided the transfer amount does not exceed kex. The algorithm allows for different kex values for each kind of reactant, considering the material nature, its size, and electric charge. In this paper we present results using kex,Au+ = kex,M+ = kex,R = kex.
Consider the case where the number of metallic atoms (produced as the result of chemical reductions, Au+ + R→Au or M+ + R→M, see Section 2.5) within the same droplets does not reach the critical nucleus size value (see Section 2.6). In this situation, they remain free (non-aggregated) and can be exchanged during a subsequent collision. The product exchange parameter (kex,Au, kex,M) governs this exchange by determining how many atoms of product could be transferred during a collision. The characteristics of each metal could make it easier or harder to pass through the interdroplet channel, resulting in potentially different interdroplet exchange parameters. In this study we present results using the same value for all free units (reactants and products): kex,Au+ = kex,M+ = kex,R = kex,Au = kex,M = kex. Thus, the exchange criteria for reactants (Au+, M+, R) and non-aggregated products (Au, M = Ag, Pt, Pd) is dictated by kex. The most occupied droplet before the collision transfers matter to the less occupied droplet until both droplets have the same concentration. This exchange is only allowed if the number of atoms/ions transferred is less than or equal to kex (maximum number of atoms exchanged). It can be mathematically described as follows:
If   n j b ( i ) > n k b ( i )   then   n j a ( i ) = n j b ( i ) l n k a ( i ) = n k b ( i ) l l = min n j b ( i ) n k b ( i ) 2 , k e x
where i = Au+, M+, R, Au, M, and j, k the index for the colliding droplets. The superscripts b and a describe droplets’ contents before and after collision, respectively.

2.5. Chemical Reduction Rates (Reduction Rates Parameters, vAu and vM)

After randomly selecting droplets to fuse and redisperse, the redistribution of material between daughter droplets can lead to the localization of reactants (metal salt and reducing agent) within the same droplet. Consequently, chemical reductions can occur. Since two different metals make up a bimetallic nanoparticle, each with potentially different reduction rates, two distinct reaction rate parameters must be considered. Different reduction rates are simulated by adjusting the percentage of metal salts carried by colliding micelles giving rise to products. For the Au precursor, which undergoes instantaneous reduction, 100% of the Au salt in the colliding micelles is reduced (vAu = 100%), provided sufficient reducing agent is present in the same micelle (Au+ + R→Au). This means that one Au atom is obtained from each pair of Au salt and reducing agent. Consequently, the fastest reaction corresponds to vAu = 100%, allowing Au salts to be reduced to their maximum extent. For the second metal, the reduction of the metal salt M+ to obtain metal M (M+ + R→M) is determined by vM, where vM < 100%, resulting in only a percentage being reduced. The reduction rates (expressed as % of reactants that react per collision) are related to the standard reduction potentials according to the Volmer equation. Good agreement between experimental and simulation results was achieved for the synthesis of Au/Pt nanoparticles by simulating Au and Pt reductions with vAu = 100% (standard reduction potential ε°(AuCl42−/Au) = 0.926 V) and vPt = 10% (ε°(PtCl62−/Pt) = 0.742 V) [34]. This indicates that all Au salt inside colliding micelles reacts during an effective collision, whereas only 10% of Pt salt gives rise to products. This approach facilitates the characterization of metal precursors based on their reduction rates, where metals with higher reduction potentials are associated with faster reduction. This correlation supports the general belief that a larger difference in the standard potentials of the two metal salts corresponds to a greater difference in their respective reduction rates. Based on the Buttler-Volmer equation, a linear relationship between log v% versus ε° can be assumed (see reference [39] for details). Therefore, the reduction rate of Ag+ (ε° = 0.7996 V) and PdCl2 (ε° = 0.48 V) can be approximated by a reduction rate 20% and 3%, respectively. When both reactions are possible within the same droplet, the algorithm randomly determines the order in which each reaction occurs.
Thus, if the metal salts (Au+ and/or M+) and reducing agent (R) are in a micelle j, they produce a reduced metal atom (Au or M) if vi is smaller than ξ, where ξ is a random number between 0 and 1. If the reaction takes place, the amount of reactants (k) in droplet j after the collision decreases to the same extent that the product (m) increases. As a result of the reaction, the number of metal atoms produced will be limited by whichever reactant (metal salt or reducing agent) is in the smallest amount (l). It can be mathematically described as follows:
l = min n j ( i ) , n j ( R ) i = Au + , M + i f   ξ v i n j a k = n j b k l k = Au + ,   M + , R n j a m = n j b m + l m = Au ,   M i f   ξ v i n j a k = n j b k n j a m = n j b m
where the superscripts b and a describe micelle contents before and after collision, respectively. The resulting reduced atoms are subject to the criteria defined below. The unreacted reactants remain in the micelle, and may either react or be exchanged in a subsequent collision event according to Section 2.4. This implies that molecules of reactants, including both metal salts and/or reducing agent, can coexist within the same micelle.

2.6. Nucleation (n* Parameter)

Classical nucleation theory establishes that when a new solid phase starts to form from a supersaturated solution, the critical nucleus is defined as the cluster whose size allows it to remain in equilibrium with the mother phase. This equilibrium is unstable, which means that the cluster can either dissolve or grow with equal probability. From a thermodynamic point of view, the critical nucleus must increase in size to overcome the energy barrier, allowing the cluster to grow. In other words, the size of the critical nucleus determines the size at which the growth of the new phase becomes favorable. Thus, if a particle exceeds the critical nucleus size, it will continue to grow. Conversely, if the particle is smaller than the critical size, it will spontaneously dissolve. This is taken into account when formulating the model by introducing a parameter called n*, which is the number of atoms required to form a stable nucleus after the redistribution of material between the two colliding droplets. To check for possible nucleation events, the number of metal atoms in each droplet is compared with n*. If the number is less than n*, these metal atoms will not aggregate and will remain free and isolated. As a result, they can be exchanged between droplets one at a time, with their exchange being governed by the previously defined kex parameter. However, if the number of metal atoms inside a droplet equals or exceeds n*, they aggregate, resulting in the formation of a stable nucleus, which can grow.
The critical nucleus size depends on the nature of the two metals constituting the bimetallic nanoparticle due to their unique metal-metal interactions, which result in variations in the total Gibbs energy. Since the strength of the interactions between two metal atoms in a small cluster depends on composition, site, and structure, the critical nucleus size may differ between homoatomic and heteroatomic nucleation. To improve the characterization of the metals and define better the conditions necessary for the formation of a stable nucleus, the simulation model distinguishes between three distinct critical nucleation sizes: two homoatomic critical nucleus sizes, which characterize a nucleus composed solely of one type of metal (as an example, nAu* and nPt* in an Au/Pt nanoparticle), and a heteroatomic nucleus size, nAu−Pt*, which represents a nucleus composed of both metals. These critical nucleus values indicate the minimum number of metal atoms located within the same droplet required to form a nucleus capable of subsequent growth. For instance, a heteroatomic nucleation with nAu−Pt* = 4 suggests that AuPt3, Au2Pt2, or Au3Pt atomic clusters are sufficient to form a stable nucleus. However, this does not imply that Au4 or Pt4 alone can form a nucleus, since homoatomic nucleation may not necessarily be the same as heteroatomic nucleation. Thus, in the absence of any pre-existing nuclei, if the number of reduced atoms located in micelle j satisfies one of the following conditions:
n j ( A u ) > n A u * n j ( M ) > n M * n j ( A u ) + n j ( M ) > n A u M *
then the atoms come together and form seed nuclei, which are capable of further growth. Due to this aggregation, the growing aggregate can only pass through the interdroplet channel in its entirety. In this case, the exchange is limited by the size of the interdroplet channel, which is regulated by the parameter f described below.
The nucleation theory does not specify the size at which the cluster dissolution probability becomes nearly zero, that is, the value of the critical nucleus size is unknown. In addition, in a confined medium like a microemulsion, it is expected that the critical nucleus sizes would be smaller than in bulk [40,41]. In fact, the values of the critical nucleus size proposed so far are always very small: n* = 2 (Au nanoparticles [26,38]), n* = 5 (titanium dioxide) [42], n* = 9 (Si) [43], n* = 10 (BaSO4 [28], PtBi [13]). In the paper at hand, the study will range from n* = 1 to n* = 20.
In the model, nucleation only takes place in the absence of any pre-existent nuclei. Once the product atoms nucleate, any excess of product atoms present in the same droplet, due to a posterior material exchange between droplets, accumulates on the surface of the nucleus. This accumulation results in an enlargement of the nucleus, leading to its growth. After nucleation, all material within a droplet is considered to be part of a single particle, meaning that each droplet can contain only one particle. The sequence of atom deposition (Au or M) on the growing nucleus surface is recorded to study the final metal composition of each nanoparticle. The size of the critical nucleus is directly related to the rate of nucleation [36], with a smaller critical nucleus size resulting in faster nucleation.

2.7. Growth by Autocatalysis

As the synthesis proceeds, more droplets may contain free species and growing aggregates at the same time. When only one of the colliding droplets contains a growing aggregate, reactant exchange between droplets is systematically directed towards the droplet containing the aggregate. Chemical reduction occurs on the aggregate at twice the reaction rate. However, if both colliding droplets carry an aggregate, the chemical reaction takes place in the micelle containing the larger aggregate. This preference arises because a larger aggregate has a larger surface area, which translates into a higher probability of catalyzing the reaction. This form of growth can be referred to as autocatalytic growth.

2.8. Growth by Ripening

Another mechanism for nanoparticle growth that must be taken into account in microemulsions is the Ostwald ripening. This process involves changes in particle size through the solubilization and condensation of material. Ostwald ripening assumes that larger particles will grow by condensation of material from smaller particles, which solubilize more easily than larger ones. For this to be possible in microemulsions, the two droplets (both containing particles) must first be fused together to form a dimer. The particle can then be transferred between droplets. Once the two particles are in the same droplet, the smaller particle solubilizes and its material condenses onto the larger particle. After collision, the dimer redisperses, and the result is a droplet containing the final bigger particle and another empty droplet. In this way, growth by ripening also brings in fresh material and helps in further growth. This approach to simulate particle growth was used also by Ström et al. [32] and Angelescu et al. [13]. Other approaches include a more significant particle coagulation weight [26,31,38]. This exchange of nuclei may also be referred to as coagulation [31].
Therefore, when a droplet i containing ni units of product collides with another droplet with a higher number of products units, the smaller aggregate can be interchanged during a collision from the initial droplet to the droplet carrying the larger one. Thus, when two micelles i and j collide,
i f n i a k + n j a k f k = Au , M n i b k = n i a k + n j a k n j a m = 0
where the superscripts b and a describe droplet contents before and after collision, respectively. In this way, the ripening implies nuclei coagulation, whenever the size of the interdroplet channel (given by the film flexibility f) allows the exchange of the smaller particle from the initial droplet through the droplet containing the larger one. The time scale of this process is almost the whole synthesis, as these small particles appear at the beginning and can be exchanged at any time during growth. This exchange only depends on the aggregate size, that is, it does not take into account the composition (Au or M metal).
To preserve information about the composition of the growing nanoparticle, once the smaller particle is relocated, it is deposited onto the surface of the larger one while maintaining the original sequence of metals as when the smaller particle was formed. For growth by ripening to be possible, the smaller particle must traverse the interdroplet channel into the droplet containing the larger one. This can only happen if the interdroplet channel size allows such an exchange. This restriction is reflected in the f parameter described below.

2.9. Criteria for Interdroplet Exchange of Growing Particles (Flexibility Parameter f): Interdroplet Channel Size

The condition under which the smaller nucleus can pass through the channel connecting colliding droplets is defined by the f parameter, which represents the size of the interdroplet channel. The f parameter quantifies the maximum aggregate size capable of traversing the channel. The flow direction depends on the size of the aggregates carried by colliding droplets. The smaller aggregate moves to the droplet containing the larger one, provided the channel size (f) is sufficiently large.

2.10. Characterization of the Microemulsion by the Material Interdroplet Exchange Criteria

A key characteristic of a surfactant film is its flexibility, which denotes its capacity to deviate from its optimal curvature. Surfactants can vary in flexibility, depending on the strength of interactions at both sides of the interface. The process of material exchange between droplets involves transiently opening the interfacial layer, which takes place when an energetic collision is able to establish a water channel between droplets, forming a transient dimer [44]. This process is energetically unfavorable because it involves a change in the curvature of the surfactant film [44]. In the formulation of microemulsions, a surfactant that allows curvature fluctuations is required. Surfactants that adsorb strongly at interfaces and effectively reduce interfacial tension have a highly hydrophobic tail (long alkyl chain) and a very hydrophilic head group. These are known as rigid surfactants. The flexibility of the surfactant can be included into our simulation by relating the flexibility of the surfactant film surrounding the droplets and the ease of forming communication channels between the colliding droplets, as well as the sizes of these channels. Thus, on one hand, the flexibility of the surfactant film imposes a limit on the size of the particles that can pass through these interdroplet channels. This influence is accounted for by varying the flexibility parameter (f) that defines the maximum particle size allowed for interdroplet transfer. Therefore, a highly flexible film will facilitate the exchange of larger particles compared to a rigid film. For example, an f value of 30 would imply a minimum section inside the fused dimer of approximately 6–10 Å, assuming that 30 metal atoms are aggregated in a spherical shape. An f value of 5 corresponds to a channel of about 1–2 Å. On the other hand, the surfactant film flexibility is also related to dimer stability, as a more flexible surfactant results in higher dimer stability. Greater dimer stability allows two droplets stay together longer, enabling more material to be transferred during an effective collision. This transfer is governed by the kex parameter (see Section 2.4). Thus, if droplets have a high tendency to stay together, many isolated species can be exchanged, resulting in a high kex. Therefore, the exchange parameter kex increases with dimmer stability, consequently enhancing the rate of intermicellar exchange. In this paper, we present the simulation results using a flexible surfactant (f = 30, kex = 5), which successfully reproduced a water/tergitol/isooctane microemulsion [34].
To summarize, Figure 1 illustrates the schematic events involved in the microemulsion route for the nanoparticle synthesis. In this scheme, the mass change through nucleation is due to a critical value n* = 4, so 4 metallic atoms come together to form a stable nucleus. In the growth by autocatalysis step, the metal salt located in the first micelle can react with the reducing agent in the second one, giving rise to one metallic atom, which will be deposited on the growing particle. In the case of growth by ripening, the small particle crosses the interdroplet channel to be added to the larger one.

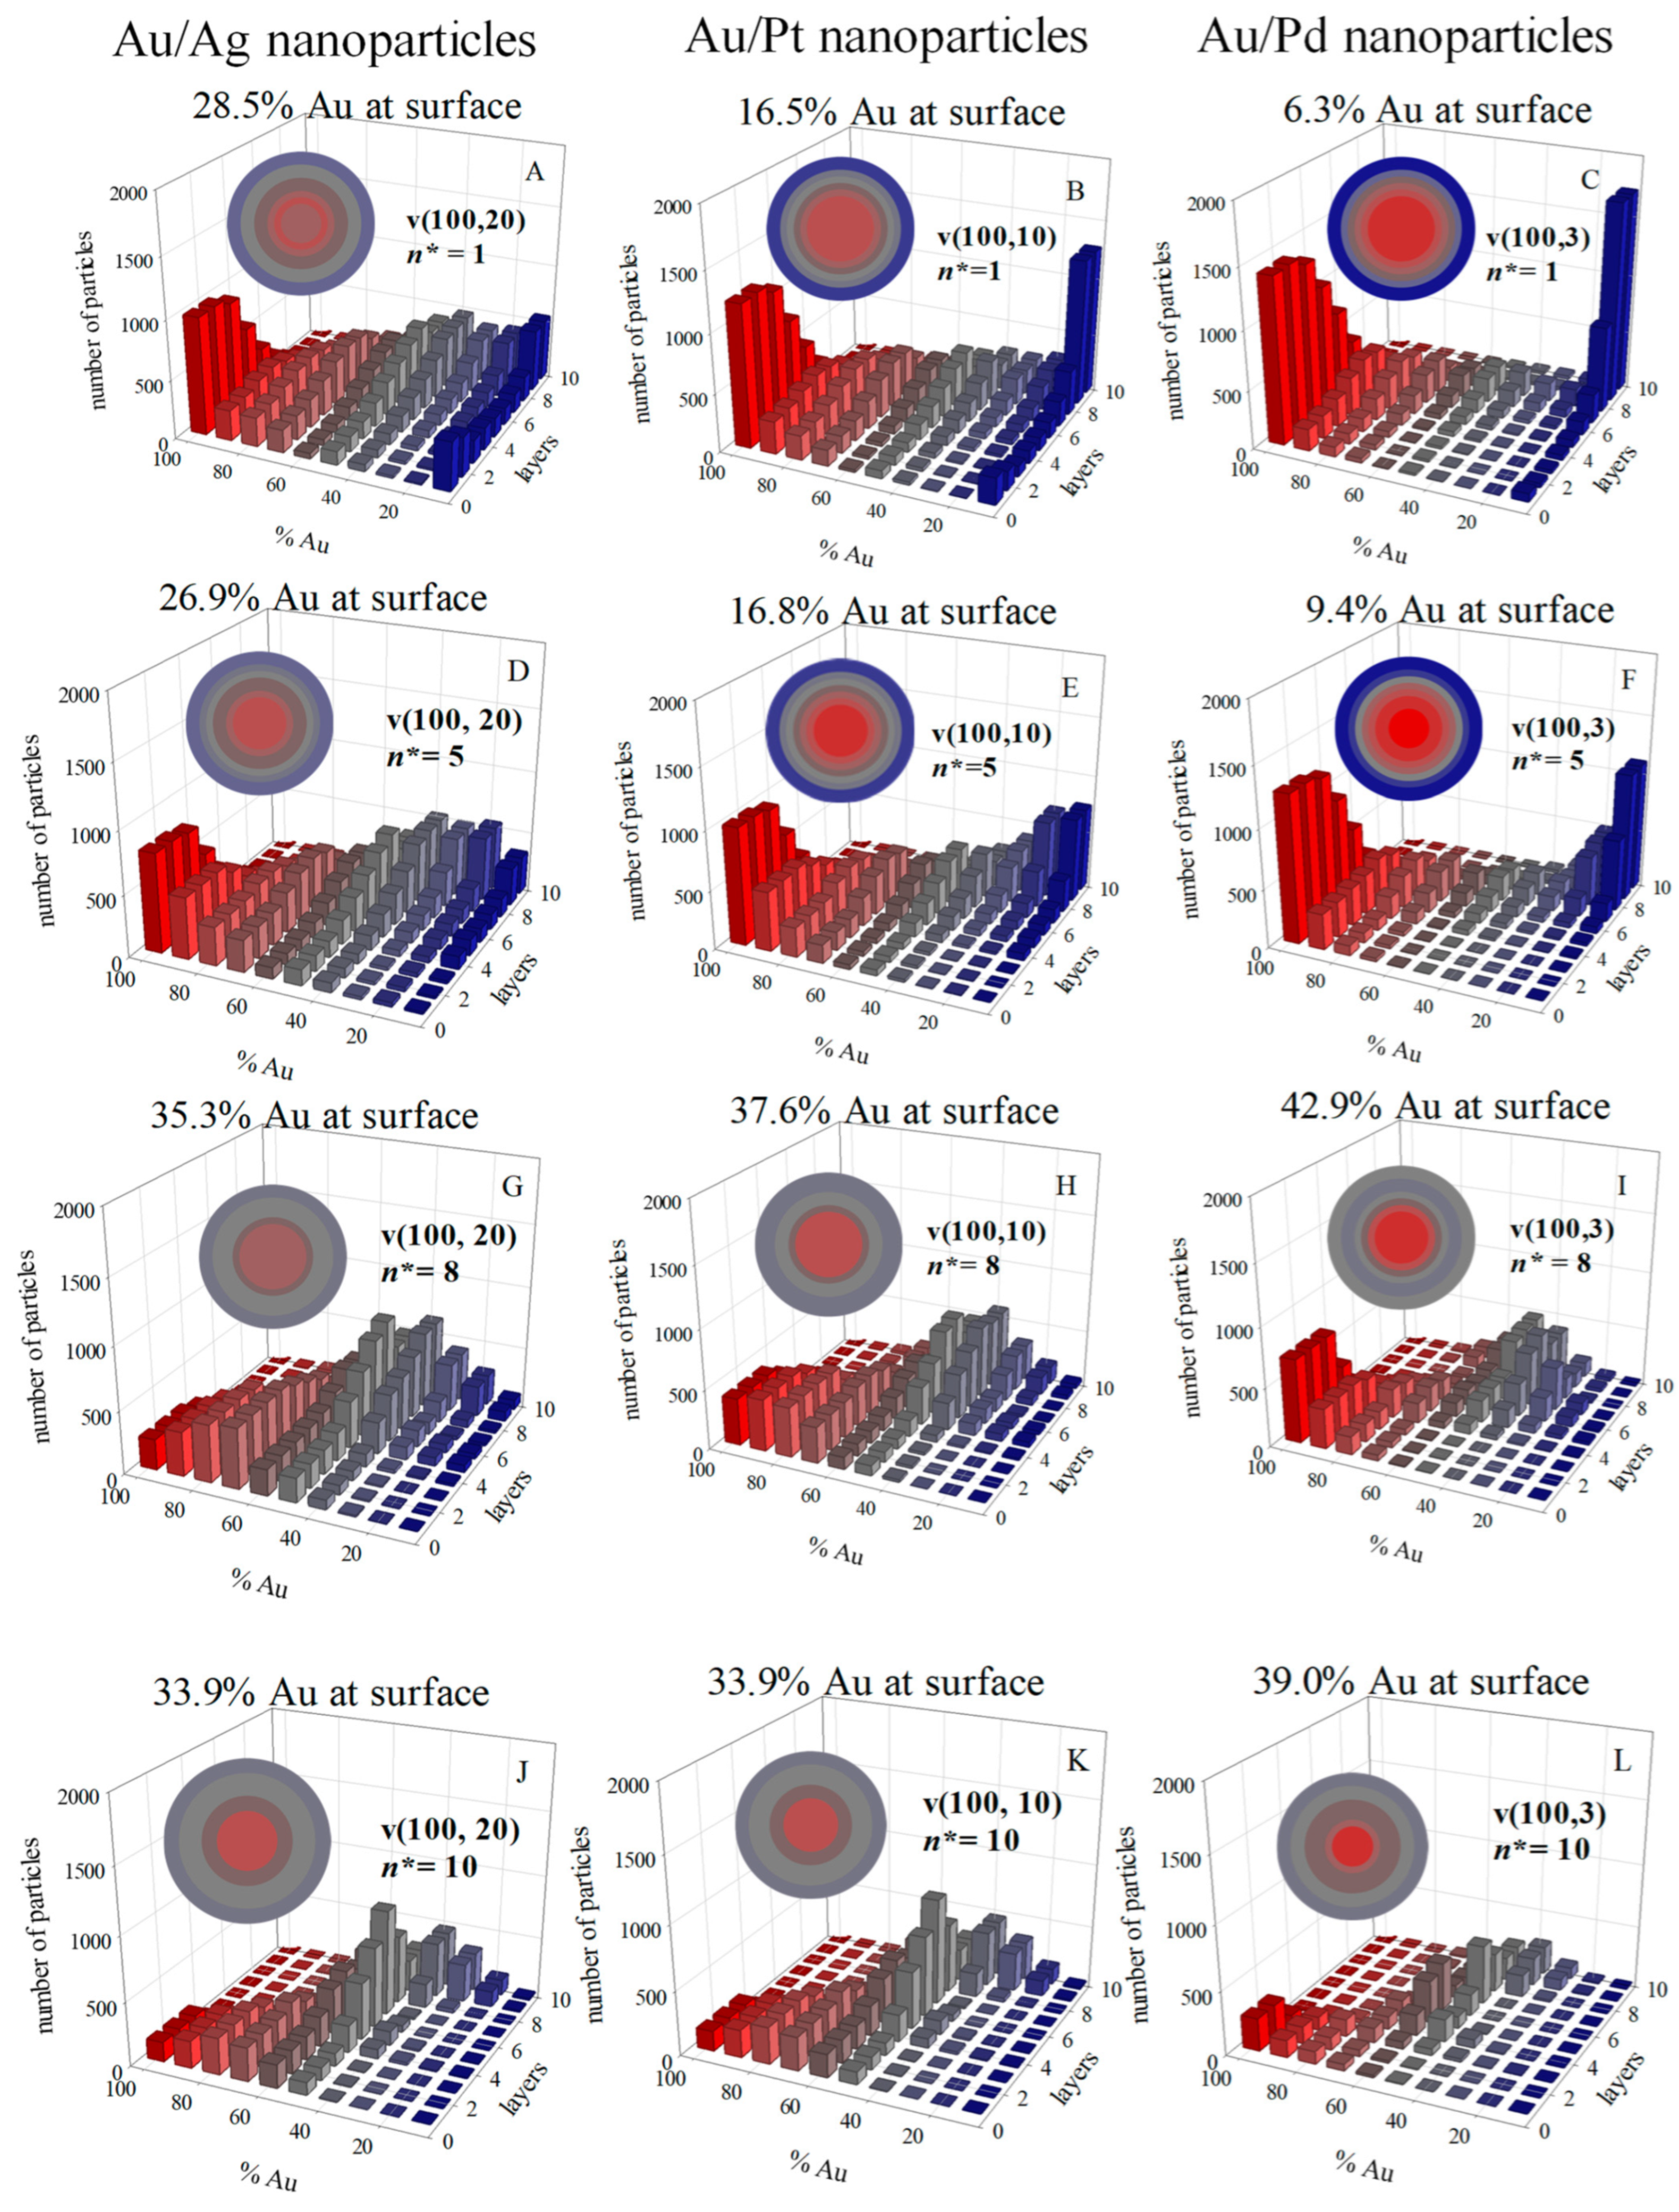
2.11. Nanoparticle Characterization

The small nuclei grow through the deposition of atoms on the surface. The distribution of metals in the final bimetallic nanostructure is determined by the sequence in which the two metals are deposited. To achieve this sequence, each simulation run continues until the material inside each micelle remains unchanged, indicating that the process is complete, all precursors have been reduced, and intermicellar exchange is finished. The result is a set of micelles, each potentially containing a particle whose composition has been recorded in the order of metal deposition. Assuming a spherical arrangement, each nanoparticle is then divided into ten concentric layers. The composition of the nanoparticle (expressed as % Au) and its dispersion are then averaged layer-by-layer. Finally, the results are averaged over 1000 runs.

2.12. Model Validation

The simulation model was validated by direct comparison with experimental results (see Reference [34]). Au/Pt particles were synthesized in a water/tergitol/isooctane microemulsion. The resulting nanoparticles which were studied using HR-STEM (High-Resolution-Scanning Transmission Electron Microscopy) and the nanostructure was examined by analyzing cross-sections scanned with EDX (Energy Dispersive X-ray spectroscopy). A good agreement was observed when comparing both experimental and STEM profiles calculated from the simulated structures.

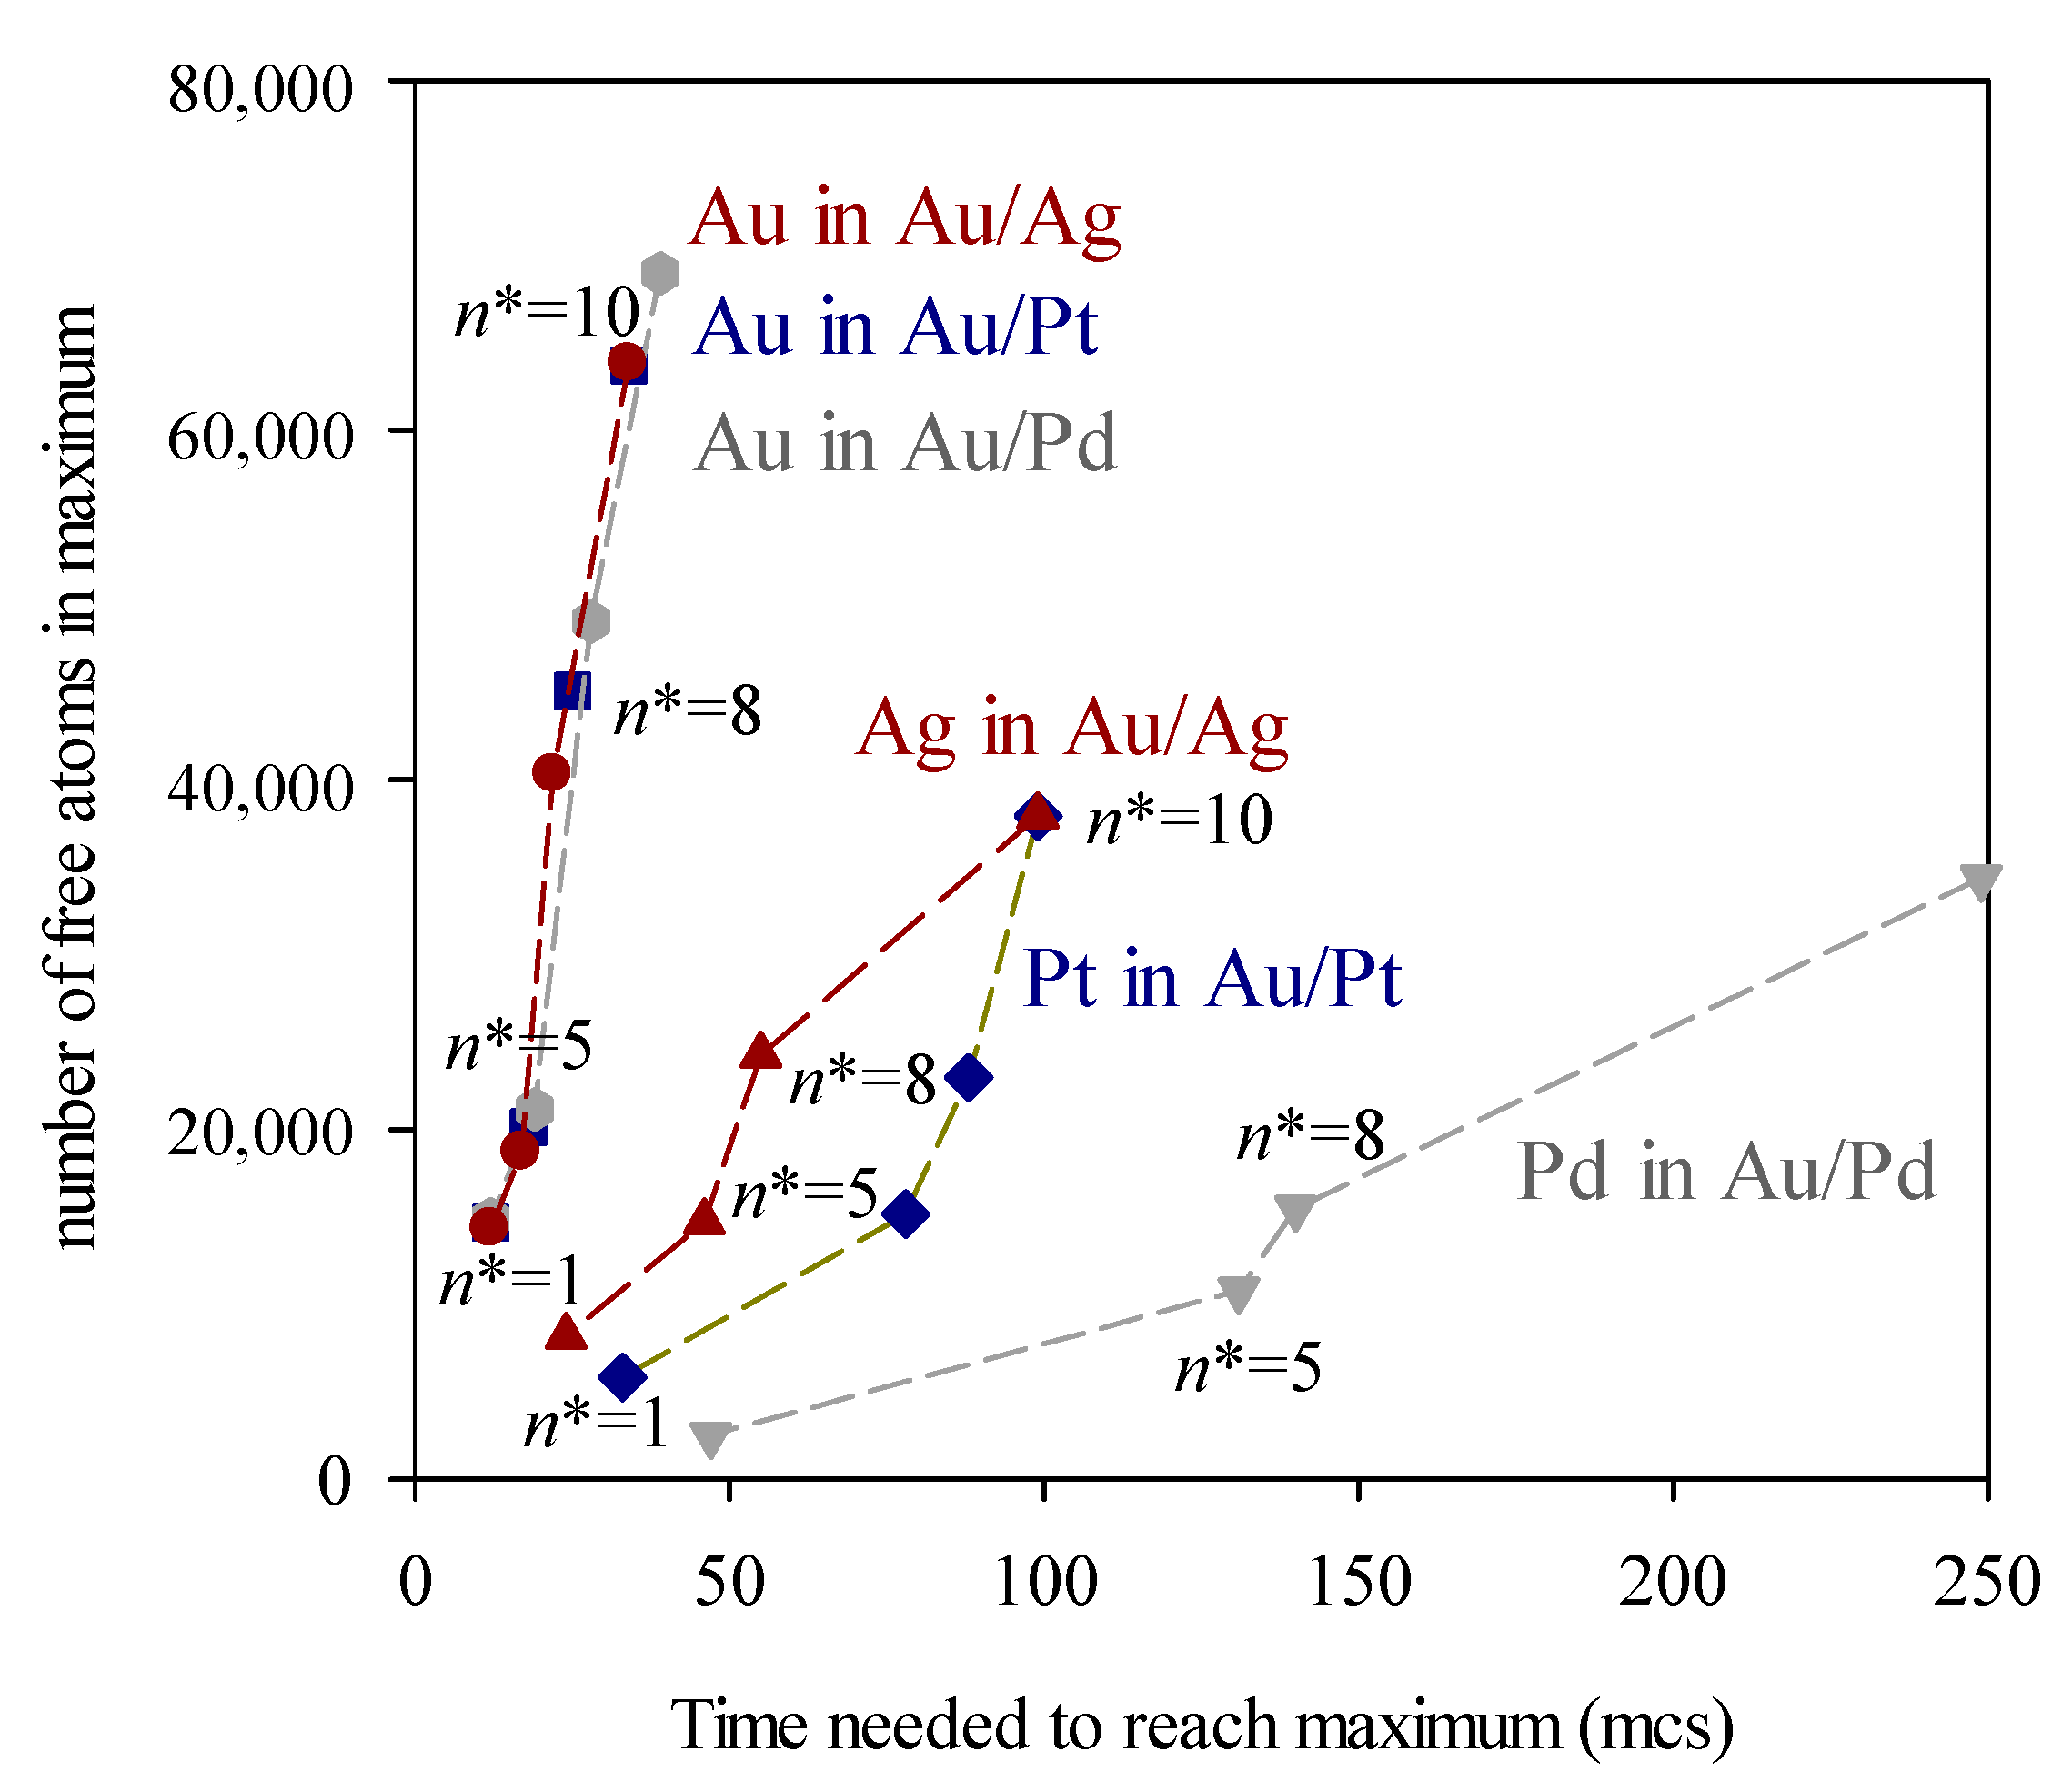
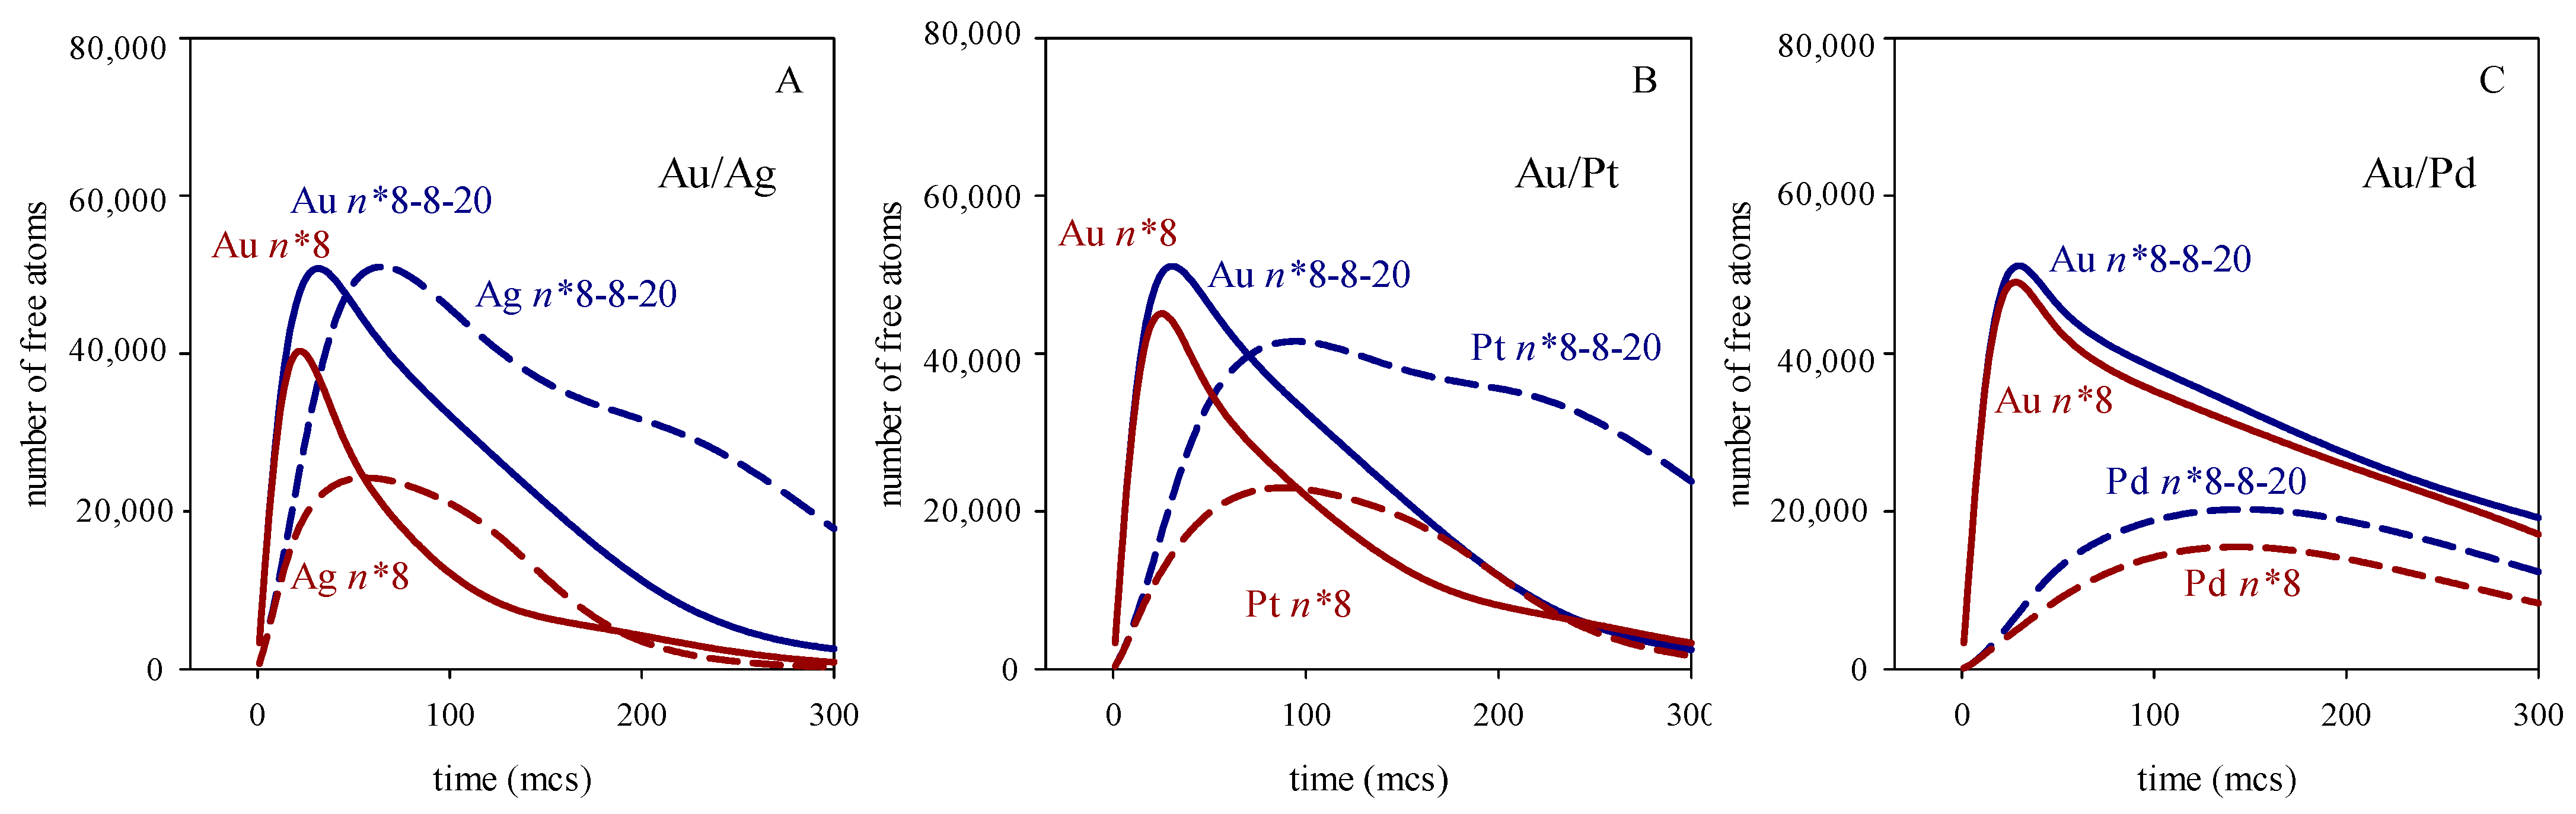
3. Results and Discussion

To illustrate the dependence of the nanostructure on the critical nucleus size, we have performed computer simulations considering different pairs of metals (with varying reduction rates) and different critical nucleus sizes, while keeping the synthesis variables constant (reactant concentration, surfactant flexibility, droplet size). Figure 1 displays the results of simulations, where the number of particles containing a varying percentage of the fastest reduction metal (Au) is monitored layer by layer, from the nanoparticle core to the outside. Each column shows the results for a different metal pair. Rows display nanostructure for different critical nucleus size values. Each histogram shows the percentage of Au in the outermost layer.
First, we will analyze results at fixed n* (n*Au = n*M = n*) and with varying differences in reduction rates. A greater disparity in reduction rates between the two metals typically results in improved metal segregation: when one reaction is faster, the initial nuclei primarily consist of the product from the faster reaction. Subsequently, as the slower reaction product appears, the outer layers gradually become enriched with the slower reacting metal. This effect is more pronounced with increasing differences in reduction rates between the metals. This is the case for low values of n*, where the number of metal precursors initially within the micelle (〈c〉 = 16 precursor/droplet) is high enough not to hinder the nucleation requirements being met. This is illustrated in the top rows of Figure 2 (Figure 2A–C for n* = 1, and Figure 2D–F for n* = 5), where a larger difference between the reduction rates of the metals (see left to right) leads to a higher Au content in the core (see increasing red bars on the left) and a higher content of the slowly reducing metal in the shell (see increasing blue bars on the right). This trend is clearly reflected in the percentage of Au reaching the surface: from 28.5% to 6.3% Au in the surface for n* = 1, and from 26.9% to 9.4% when n* = 5. But, if n* = 8 (see Figure 2G–I, from left to right), although the Au enrichment of the core remains higher (mainly as the difference in reduction rates increases), the outermost layer shows a mixture of both metals, and no trend towards enrichment in the slow metal is observed. A further increase of n* leads to a core slightly enriched in Au covered by a mixed shell for all metal pairs (see Figure 2J–L). One can conclude that the difference in reduction rates is the key parameter determining metal segregation when the critical nucleus size is small compared with the initial concentration in the droplet. But when the n* values approach the number of reactants per droplet, the nucleation rate takes the key role, more mixed structures are obtained, and the three structures are quite similar, regardless the difference in the reduction rates of the two metals.
To better understand this behavior, let us analyze the change in the predicted structures keeping constant the difference in reduction rates and varying n*. An increase in n* results in a higher degree of mixing of the metals in the final nanoparticle, for the three metallic pairs (see each column in Figure 1 from top to bottom). Considering the Au/Ag pair (first row, Figure 2A,D,G,J), the Au-enriched core covered by a slightly Ag-enriched shell obtained at n* = 1 evolves towards a progressively smaller metal separation (less Au in the core and less Ag in the shell) as n* increases. This effect is more noticeable as the difference between the reduction rates increases. Thus, Au/Pd nanoparticles change from a pure core-shell structure at n* = 1, to an Au-enriched core covered with a mixed shell at n* = 8 and n* = 10. As mentioned, as the critical nucleus size increases, the difference in reduction rates becomes irrelevant and all nanostructures are quite similar.
These results can be explained by considering the role of nucleation in the mechanism of nanoparticle formation. An increase in n* implies that more Monte Carlo steps are required to meet the n* criterion. Meanwhile, metallic atoms (products of the reduction reaction) are present in the reaction media, and can be exchanged between droplets as quickly as the surfactant layer allows this exchange. This increase in the number of free (non-aggregated) atoms in the reaction medium is illustrated in Figure 3, which represents the number of free atoms versus time. Regarding Au, whose reduction is instantaneous, a rapid increase in free Au atoms is observed at the beginning of the synthesis, as the metal salt is reduced to Au. The number of Au atoms reaches a maximum, from which it decreases as the Au atoms nucleate. A higher value of n* results in more Au atoms remaining free for longer, so that the maximum is higher and moves at longer times. The maxima for the slower metals appear later due to their slower reduction rates. Furthermore, when comparing the two maxima in each metal pair, it can be seen that they separate more in time as the difference between the two reduction rates increases. Again, this is because the slower metal appears later. To better distinguish how the position of the maximum number of free atoms moves, Figure 4 illustrates the number of free atoms at the maximum versus the time needed to reach the maximum, at different values of the critical nucleus size and for each metal.
To discern how nucleation interacts with the chemical reduction rate, it is of interest to note that the maximum amount of free Au increases slightly as the difference between the two reduction rates grows, and this effect is more pronounced at high values of n*. This means that, under similar conditions, the amount of free Au in the Au/Ag synthesis is lower (resulting in a lower maximum) than in the Au/Pd synthesis. This could be understood by taking into account that the faster reduction of Ag precursor provides free Ag, so Au can meet the n* requirements by nucleating with Ag in a heteroatomic nucleation event. On the contrary, the Au maximum in the Au/Pd synthesis is higher due to the smaller availability of free Pd atoms (caused by its slower reduction rate), which hinders heteroatomic nucleation. The trend for the metal with the slower reduction rate is the opposite: for a given n* value, its maximum decreases as the difference between the two reduction rates increases. This can also be understood by considering heteroatomic nucleation: Ag atoms appear earlier than Pd, allowing Ag to nucleate with Au, so fewer Ag atoms remain in the reaction medium. To test the assumption that heteroatomic nucleation is responsible for the smaller maximum of the slower metal as the difference in reduction rates increases, new experiments were carried out under the same conditions but hindering the heteroatomic nucleation. Figure 5 shows the number of free available atoms in the reaction medium where the homoatomic critical nucleation size is n*Au = n*M = 8, but the heteroatomic one is too high to hinder nucleation requirements: n*Au-M = 20 (see blue lines). For comparison, the previous case (n* = n*Au = n*M = n*Au-M = 8) is represented in red. The following points may be highlighted: In relation to Au, an increase in the heteroatomic nucleation critical size leads to an increase in free Au at the beginning of the synthesis (compare the blue and red continuous lines), because heteroatomic nucleation is not possible if n*Au-M = 20, resulting in more free Au. But, as the process advances, free Au takes longer to disappear when n*Au-M = 20 (see blue lines) because it cannot be combined with Pt in a heteroatomic nucleation event. This is the case for Au/Ag and Au/Pt, but almost no difference is observed for Au/Pd. In this case, due to the slower Pd reduction, Pd atoms appear very slowly and later, making their participation in heteroatomic nucleation irrelevant. In summary, the impact of heteroatomic nucleation varies depending on the reduction rate of the second metal, which determines the metal’s availability to participate in a heteroatomic nucleation event. Regarding the slower reduction metal (see discontinuous lines), once again, the heteroatomic nucleation value affects Au/Pd less than Au/Ag or Au/Pt. This is due to the slower reduction rate of Pd, which appears later, when Au nucleation is almost finished. It can be seen that, although the Ag maximum appears a bit later than that of Au at nAu*-nM*-nAu-M* = 8-8-20 (due to the slower reduction rate of Ag), this maximum reaches very high values because there is a lot of Ag in the reaction medium that cannot aggregate with Au (see discontinuous blue line in Figure 5A). It can be observed that there is much more free Ag when heteroatomic nucleation is forbidden (n*Au-M = 20) than if n*Au-M = 8, demonstrating that heteroatomic nucleation plays an important role in the kinetics. In the case of AuPt, a quite similar behavior is observed. Comparing the maximum for Pt and Ag at nAu*-nM*-nAu-M* = 8-8-20, that of Pt one is lower and appears later than that of Ag, due to the slower reduction rate of Pt. That is, the maximum of the second metal is lower and appears later as the reduction rate of the slower metal decreases. By comparing the curves with and without heteroatomic nucleation, one can conclude that the impact of heteroatomic nucleation is greater when the difference between the two reduction rates is smaller. Thus, Au/Pd curves are very similar (compare blue and red lines in Figure 5C) because heteroatomic nucleation occurs to a very small extent even when n*Au-M = 8.
A hindered heteroatomic nucleation has significant repercussions in the mechanism of nanoparticle formation, and, consequently in the metal distribution in final nanoparticle. Figure 6 shows the predicted histograms for the case n* = n*Au = n*M = 8 with n*Au-M = 20 (nAu*-nM*-nAu-M* = 8-8-20). By comparing these histograms to the ones showing n* = n*Au = n*M = n*Au-M = 8 (n* = 8, Figure 2), one can observe that better segregation is achieved for nAu*-nM*-nAu-M* = 8-8-20, due to the hindrance of heteroatomic nucleation. Thus, the mixed cores observed initially (see inner layers in histograms Figure 2) evolve to pure Au cores in Figure 6, because only Au can nucleate (heteroatomic nucleation is hindered, and there is not yet enough second metal for its homoatomic nucleation to be possible). Ag, Pt, or Pd appear later, and are deposited on the growing particle by autocatalytic growth, leading to the formation of mixed intermediate layers. Another point to note in Figure 6 is the better segregation obtained for Au/Ag, which shows an almost pure Ag shell, compared to Au/Pd, whose shell is a mix (see spheres in Figure 6). This surface composition is counterintuitive, considering the differences in reduction rates. This result can be understood by examining Figure 5A,B, which show the low availability of Au at advanced stages of the synthesis, contrary to the Au/Pd case. After the formation of middle layers, there is no more Au, so only Ag (or Pt) can be deposited on the growing nanoparticle forming a pure metal shell. On the contrary, Pd appears later, due to its slower reduction rate, and there is still gold in the reaction medium, so both metals can be deposited in the external layers, giving rise to a mixed shell.
Finally, it is interesting to note that, for the three pairs studied, a lower number of particles is obtained as n* increases, as expected. This trend is clearly observed for n* = 8 and n* = 10 (see Figure 2). The challenge in forming the initial seed nuclei at higher n* values results in fewer seeds being formed. Consequently, the growth of these seeds leads to the formation of fewer but larger nanoparticles.

4. Conclusions

This study of the interaction between nucleation and the rate of the two chemical reductions involved in the formation of a bimetallic nanoparticle leads to three main conclusions. First, nucleation rate strongly affects the bimetallic nanostructure. For all three metal pairs studied, high values of n* lead to a higher degree of mixing of the two metals, resulting in quite similar nanoarrangements, independent of the reduction rate values. Thus, even when the difference in reduction rate is very pronounced, as in the Au/Pd pair, the characteristic core-shell structure obtained at low n* is lost, and a structure with an Au-enriched core, covered by a mixture of the two metals, is obtained. In conclusion, high values of n* (n* approaches to the number of atoms within the droplet in the feed solution), n* becomes the main factor in determining the final nanostructure. Second, when the critical nucleus size is small (quick nucleation rate), the nanoparticle structure is mainly determined by the difference between the chemical reduction rates of the two metals. Thirdly, the relevance of the heteroatomic nucleation on the formation mechanism of nanoparticles depends on the difference between the reduction rates of the two metals. For smaller differences, such as in the Au/Ag or Au/Pt pairs, heteroatomic nucleation has a greater impact on the final nanostructure. In these cases, a mixed nanostructure tends to become more segregated when heteroatomic nucleation does not take place. However, in the Au/Pd pair, the heteroatomic nucleation becomes less important due to the low availability of Pd until late stages of the synthesis, making it difficult for heteroatomic nucleation to occur. As a result, the impact of the heteroatomic nucleation on the final nanoparticle structure is minimized. This study provides deeper insight into the complex mechanisms that govern reactions in microemulsions.

Funding

This work was supported by the University of Vigo (Spain).

Data Availability Statement

The raw data supporting the conclusions of this article will be made available by the author on request.

Conflicts of Interest

The author declares no conflicts of interest.

References

  1. Suntivich, J.; Xu, Z.; Carlton, C.E.; Kim, J.; Han, B.; Lee, S.W.; Bonnet, N.; Marzari, N.; Allard, L.F.; Gasteiger, H.A.; et al. Surface composition tuning of Au-Pt bimetallic nanoparticles for enhanced carbon monoxide and methanol electro-oxidation. J. Am. Chem. Soc. 2013, 135, 7985–7991. [Google Scholar] [CrossRef] [PubMed]
  2. Chen, X.; Qian, D.; Xu, G.; Xu, H.; Dai, J.; Du, Y. Magnetic Fe3O4 supported PdAu bimetallic nanoparticles with the enhanced catalytic activity for Heck and Suzuki cross-coupling reactions. Colloids Surf. A 2019, 573, 67–72. [Google Scholar] [CrossRef]
  3. Boutonnet, M.; Lögdberg, S.; Svensson, E.E. Recent developments in the aplication of nanoparticles prepared from w/o microemulsions in heterogeneous catalysis. Curr. Opin. Colloid Interface Sci. 2008, 13, 270–286. [Google Scholar] [CrossRef]
  4. Sinfelt, J.H. Catalysis by alloys and bimetallic clusters. Acc. Chem. Res. 1977, 10, 15–20. [Google Scholar] [CrossRef]
  5. König, R.Y.G.; Schwarze, M.; Schomäker, R.; Stubenrauch, C. Catalytic activity of mono- and bi-metallic nanoparticles synthesized via microemulsions. Catalysts 2014, 4, 256–275. [Google Scholar] [CrossRef]
  6. Sun, S.; Murray, C.B.; Weller, D.; Folks, L.; Moser, A. Monodisperse FePt nanoparticles and ferromagnetic FePt nanocrystal superlattices. Science 2000, 287, 1989–1992. [Google Scholar] [CrossRef] [PubMed]
  7. Kamat, P.V. Quantum Dot Solar Cells. Semiconductor Nanocrystals as Light Harvesters. J. Phys. Chem. C 2008, 112, 18737–18753. [Google Scholar] [CrossRef]
  8. Chung, Y.-M.; Rhee, H.-K. Dendrimer-templated AgPd bimetallic nanoparticles. J. Colloid Interface Sci. 2004, 271, 131–135. [Google Scholar] [CrossRef]
  9. Boutonnet, M.; Sánchez-Domínguez, M. Microemulsion droplets to catalytically active nanoparticles. How the application of colloidal tools in catalysis aims to well designed and efficient catalysts. Catal. Today 2017, 285, 89–103. [Google Scholar] [CrossRef]
  10. Gustafsson, H.; Isaksson, S.; Altskaer, A.; Holmberg, K. Mesoporous silica nanoparticles with controllable morphology prepared from oil-in-water emulsions. J. Colloid Interface Sci. 2016, 467, 253–260. [Google Scholar] [CrossRef]
  11. Feng, J.; Zhang, C. Preparation of Cu-Ni alloy nanocrystallites in water-in-oil microemulsions. J. Colloid Interface Sci. 2006, 293, 414–420. [Google Scholar] [CrossRef]
  12. Ferrando, R.; Jellinek, J.; Johnston, R.L. Nanoalloys: From theory to applications of alloy clusters and nanoparticles. Chem. Rev. 2008, 108, 845–910. [Google Scholar] [CrossRef] [PubMed]
  13. Angelescu, D.G.; Magno, L.; Stubenrauch, C. Monte Carlo simulation of the size and composition of bimetallic nanoparticles synthesized in water in oil microemulsions. J. Phys. Chem. C 2010, 114, 22069–22078. [Google Scholar] [CrossRef]
  14. Tojo, C.; Buceta, D.; López-Quintela, M.A. On metal segregation of bimetallic nanocatalysts prepared by a one-pot method in microemulsions. Catalysts 2017, 7, 68. [Google Scholar] [CrossRef]
  15. Xia, L.; Hu, X.; Kang, X.; Zhao, H.; Sun, M.; Cihen, X. A one-step facile synthesis of Ag-Ni core-shell nanoparticles in water-in-oil microemulsions. Colloids Surf. A 2010, 367, 96–101. [Google Scholar] [CrossRef]
  16. Szumelda, T.; Drelinkiewicz, A.; Kosydar, R.; Góral-Kurbiel, M.; Gurgul, J.; Duraczynska, D. Formation of Pd-group VIII bimetallic nanoparticles by the “water-in-oil” microemulsion method. Colloids Surf. A 2017, 529, 246–260. [Google Scholar] [CrossRef]
  17. Szumelda, T.; Drelinkiewicz, A.; Kosydar, R.; Gurgul, J. Synthesis of carbon-supported bimetallic palladium-iridium catalysts by microemulsion: Characterization and electrocatalytic properties. J. Mater. Sci. 2020, 56, 392–414. [Google Scholar] [CrossRef]
  18. Solla-Gullón, J.; Vidal-Iglesias, F.J.; Montiel, V.; Aldaz, A. Electrochemical characterization of platinum-ruthenium nanoparticles prepared by water-in-oil microemulsion. Electrochim. Acta 2004, 49, 5079–5088. [Google Scholar] [CrossRef]
  19. Rojas, S.; García-García, F.J.; Jaeras, S.; Martínez-Huerta, M.V.; García Fierro, J.L.; Boutonnet, M. Preparation of carbon supported Pt and PtRu nanoparticles from microemulsion. Appl. Catal. A 2005, 285, 24–35. [Google Scholar] [CrossRef]
  20. Kim, T.; Koboyashi, K.; Nagai, M. Preparation and characterization of platinum-ruthenium bimetallic nanoparticles using reverse microemulsions for fuel cell catalyst. J. Oleo Sci. 2007, 56, 553–562. [Google Scholar] [CrossRef]
  21. Zhang, X.; Chan, K.Y. Water-in-oil microemulsion synthesis of platinum-ruthenium nanoparticles, their characterization and electrocatalytic properties. Chem. Mater. 2003, 15, 451–459. [Google Scholar] [CrossRef]
  22. Wu, M.; Chen, D.; Huang, T. Preparation of Au/Pt bimetallic nanoparticles in water-in-oil microemulsions. Chem. Mater. 2001, 13, 599–606. [Google Scholar] [CrossRef]
  23. Hernández-Fernández, P.; Rojas, S.; Ocón, P.; Gómez de la Fuente, J.L.; San Fabián, J.; Sanza, J.; Peña, M.A.; García-García, F.J.; Terreros, P.; Fierro, J.L.G. Influence of the preparation route of bimetallic Pt-Au nanoparticle electrocatalyst for the oxygen reduction reaction. J. Phys. Chem. B 2007, 111, 2913–2923. [Google Scholar] [CrossRef]
  24. Pal, A. Gold–platinum alloy nanoparticles through water-in-oil microemulsion. J. Nanostruct. Chem. 2015, 5, 65–69. [Google Scholar] [CrossRef]
  25. Heshmatpour, F.; Abazari, R. Formation of dispersed palladium-nickel bimetallic nanoparticles in microemulsions: Synthesis, characterization, and their use as efficient heterogeneous recyclable catalysts for the amination reactions of aryl chlorides under mild conditions. RSC Adv. 2014, 4, 55815–55826. [Google Scholar] [CrossRef]
  26. Ethayaraja, M.; Bandyopadhyaya, R. Population balance models and Monte Carlo simulations for nanoparticle formation in water-in-oil microemulsions: Implications for CdS synthesis. J. Am. Chem. Soc. 2006, 128, 17102–17113. [Google Scholar] [CrossRef]
  27. Niemann, B.; Veit, P.; Sundmacher, K. Nanoparticle Precipitation in Reverse Microemulsions: Particle Formation Dynamics and Tailoring of Particle Size Distributions. Langmuir 2008, 24, 4320–4328. [Google Scholar] [CrossRef]
  28. Niemann, B.; Rauscher, F.; Adityawarman, D.; Voigt, A.; Sundmacher, K. Microemulsion-assisted precipitation of particles: Experimental and model-based process analysis. Chem. Eng. Process. 2006, 45, 917–935. [Google Scholar] [CrossRef]
  29. Bagwe, R.P.; Khilar, K.C. Effects of the Intermicellar Exchange Rate and Cations on the Size of Silver Chloride Nanoparticles formed in Reverse Micelles of AOT. Langmuir 1997, 13, 6432–6438. [Google Scholar] [CrossRef]
  30. Viswanadh, B.; Tikku, S.; Khilar, K.C. Modeling core–shell nanoparticle formation using three reactive microemulsions. Colloids Surf. A 2007, 298, 149–157. [Google Scholar] [CrossRef]
  31. Jain, R.; Shukla, D.; Mehra, A. Coagulation of Nanoparticles in Reverse Micellar Systems: A Monte Carlo Model. Langmuir 2005, 21, 11528–11533. [Google Scholar] [CrossRef]
  32. Ström, L.; Ström, H.; Carlsson, P.; Skoglundh, M.; Härelind, H. Catalytically active Pd-Ag Alloy nanoparticles synthesized in microemulsion template. Langmuir 2018, 34, 9754–9761. [Google Scholar] [CrossRef] [PubMed]
  33. Tojo, C.; Buceta, D.; López-Quintela, M.A. On the minimum reactant concentration required to prepare Au/M core-shell nanoparticles by the one-pot microemulsion route. Phys. Sci. Rev. 2019, 5, 20180045. [Google Scholar] [CrossRef]
  34. Buceta, D.; Tojo, C.; Vukmirovik, M.; Deepak, F.L.; López-Quintela, M.A. Controlling bimetallic nanostructures by the microemulsion method with sub-nanometer resolution using a prediction model. Langmuir 2015, 31, 7435–7439. [Google Scholar] [CrossRef] [PubMed]
  35. Tojo, C.; de Dios, M.; López-Quintela, M.A. On the structure of bimetallic nanoparticles synthesized in microemulsions. J. Phys. Chem. C 2009, 113, 19145–19154. [Google Scholar] [CrossRef]
  36. Barroso, F.; Tojo, C. Modelling of nano-alloying and structural evolution of bimetallic core-shell nanoparticle obtained via the microemulsion route. J. Colloid Interface Sci. 2011, 363, 73–83. [Google Scholar] [CrossRef]
  37. Barroso, F.; Tojo, C. Designing Bimetallic Nanoparticle Structures Prepared from Microemulsions. J. Phys. Chem. C 2013, 117, 17801–17813. [Google Scholar] [CrossRef]
  38. Rajapantulu, A.; Bandyopadhyaya, R. Formation of Gold Nanoparticles in Water-in-Oil Microemulsions: Experiment, Mechanism, and Simulation. Langmuir 2021, 37, 6623–6631. [Google Scholar] [CrossRef]
  39. Tojo, C.; Buceta, D.; López-Quintela, M.A. Synthesis of Pt/M (M = Au, Rh) Nanoparticles in Microemulsions: Controlling the Metal Distribution in Pt/M Catalysts. Ind. Eng. Chem. Res. 2019, 58, 2503–2513. [Google Scholar] [CrossRef]
  40. Towey, T.F.; Khan-Lodhi, A.; Robinson, B.H. Kinetics and mechanism of formation of quantum-sized cadmium sulfide particles in water-aerosol OT-oil microemulsions. J. Chem. Soc. Faraday Trans. 1990, 86, 3757–3762. [Google Scholar] [CrossRef]
  41. Palomares-Baez, J.-P.; Panizon, E.; Ferrando, R. Nanoscale Effects on Phase Separation. Nano Lett. 2017, 17, 5394–5401. [Google Scholar] [CrossRef] [PubMed]
  42. Hirai, T.; Sato, H.; Komasawa, I. Mechanism of formation of Titanium dioxide ultrafine particles in reverse micelles by hydrolysis of Titaniumtetrabutoxide. Ind. Eng. Chem. Res. 1993, 32, 3014–3019. [Google Scholar] [CrossRef]
  43. Rauscher, H.; Braun, J.; Behm, R.J. Direct Identification of Critical Clusters in Chemical Vapor Deposition. J. Phys. Rev. Lett. 2006, 96, 116101. [Google Scholar] [CrossRef] [PubMed]
  44. Zana, R.; Lang, J. Dynamics of microemulsions. In Microemulsions: Structure and Dynamics; Freiberg, S.E., Bothorel, P., Eds.; CRC Press: Boca Raton, FL, USA, 1987; p. 153. [Google Scholar] [CrossRef]
Figure 1. Scheme of the formation of nanoparticles in reverse microemulsions.
Metals 14 00987 g001
Figure 2. Number of particles versus % Au in each layer, from the core to the shell, obtained for three different couples of metals at different critical nucleus sizes and keeping constant the initial concentration (〈c〉 = 16 reactant/micelle), reactants proportion (Au:M = 1:1), and film flexibility (kex = 5, f = 30). Reduction rates: Au, vAu = 100%; Ag, vAg = 20%; Pt, vPt = 10%; Pd, vPd = 3%. (A) Au/Ag, n* = 1; (B) Au/Pt, n* = 1; (C) Au/Pd, n* = 1; (D) Au/Ag, n* = 5; (E) Au/Pt, n* = 5; (F) Au/Pd, n* = 5; (G) Au/Ag, n* = 8; (H) Au/Pt, n* = 8; (I) Au/Pd, n* = 8; (J) Au/Ag, n* = 10; (K) Au/Pt, n* = 10; (L) Au/Pd, n* = 10. Color pattern: Au is represented by red, slower metal by blue, grey indicates 50% Au–M. Lower red intensity corresponds to lower % Au. Colored spheres represent the average composition.
Metals 14 00987 g002
Figure 3. Temporal evolution of the number of free atoms (non-aggregated) of Au (continuous line) and M = Ag, Pt, Pd (discontinuous line) at different values of the critical nucleus size: n* = 1 (blue), n* = 5 (green), and n* = 8 (red). Reduction rates: vAu = 100%, vAg = 20%, vPt = 10%, vPd = 3%, 〈c〉 = 16 reactants/droplet (1:1 reactants ratio in feeding solution), 〈cR〉 = 10 〈c〉; flexible film (f = 30, kex = 5). (A) Au/Ag; (B) Au/Pt; (C) Au/Pd.
Metals 14 00987 g003
Figure 4. Number of free atoms (non-aggregated) at the maximum versus the time required to reach the maximum at different values of n*. Au/Ag in red: number of free Au (red circles), number of free Ag (red triangles up); Au/Pt in blue: free Au (blue squares), free Pt (blue diamonds); Au/Pd in grey: free Au (grey hexes), free Pd (grey triangles down). Reduction rates: vAu = 100%, vAg = 20%, vPt = 10%, vPd = 3%, 〈c〉 = 16 reactants/droplet (1:1 reactants ratio in feeding solution), 〈cR〉 = 10 〈c〉; flexible film (f = 30, kex = 5). Lines are only a guide to the eye.
Metals 14 00987 g004
Figure 5. Temporal evolution of the number of free atoms (non-aggregated) of Au (continuous line) and M = Ag, Pt, Pd (discontinuous line) at different values of the heteroatomic critical nucleus size: n*Au = n*M = n*Au-M = 8 (red) and n*Au = n*M = 8 combined with n*Au-M = 20 (blue). Reduction rates: vAu = 100%, vAg = 20%, vPt = 10%, vPd = 3%, 〈c〉 = 16 reactants/droplet (1:1 reactants ratio in feeding solution), 〈cR〉 = 10 〈c〉; flexible film (f = 30, kex = 5). (A) Au/Ag; (B) Au/Pt; (C) Au/Pd.
Metals 14 00987 g005
Figure 6. Number of particles versus % Au in each layer, from the core to the shell. Initial concentration (〈c〉 = 16 reactants/droplet), reactants ratio Au:M = 1:1, flexible film (kex = 5, f = 30). Reduction rates: vAu = 100%; vAg = 20%; vPt = 10%; vPd = 3%. (A) Au/Ag, n*Au = n*Ag = 8, n*Au-Ag = 20; (B) Au/Pt, n*Au = n*Pt = 8, n*Au-Pt = 20; (C) Au/Pd, n*Au = n*Pd = 8, n*Au-Pd = 20. Color pattern as in Figure 2.
Metals 14 00987 g006
Disclaimer/Publisher’s Note: The statements, opinions and data contained in all publications are solely those of the individual author(s) and contributor(s) and not of MDPI and/or the editor(s). MDPI and/or the editor(s) disclaim responsibility for any injury to people or property resulting from any ideas, methods, instructions or products referred to in the content.

