Article

N-Atom Doping of ω–Fe, α–Fe, and γ–Fe Compounds: A First-Principle Study

1
Shanghai Key Laboratory of D&A for Metal-Functional Materials, School of Materials Science & Engineering, Tongji University, Shanghai 201804, China
2
Biomaterials R&D Center, Zhuhai Institute of Advanced Technology, Chinese Academy of Sciences, Zhuhai 519000, China
3
Wenzhou Institute, University of Chinese Academy of Sciences, Wenzhou 325001, China
4
Key Laboratory of Silicon-Based Materials, School of Materials Science and Engineering, Fuyao University of Science and Technology, Fuzhou 350109, China
*
Authors to whom correspondence should be addressed.
Metals 2025, 15(2), 98; https://doi.org/10.3390/met15020098
Submission received: 10 December 2024 / Revised: 14 January 2025 / Accepted: 19 January 2025 / Published: 21 January 2025

Abstract

:
Recently, a new phase, ω–Fe, has been observed in martensitic substructures, providing a new path for studying the position and evolution of nitrogen in high-nitrogen steels. In this paper, the density functional method was used to investigate the thermodynamic and dynamic stability of N atoms in the phases of ω–Fe, α–Fe, and γ–Fe in martensite, as well as the influence of magnetic order on them. The calculated results show that in the pure Fe phases, ferromagnetic α–Fe is a stable phase both in thermodynamics and dynamics. ω–Fe and γ–Fe are most stable in ferrimagnetism and show dynamic stability, while in ferromagnetic state they are unstable in both thermodynamics and dynamics. N-atom doping of 25% (Fe3N) makes γ–Fe and ω–Fe thermodynamically and dynamically stable in ferromagnetic state. However, a higher N content is not conducive to the stability of ω–Fe and γ–Fe. The electronic structure shows that as the content of N atoms becomes higher than 25%, the 2p orbitals of N atoms move towards the Fermi level and become more dispersed, resulting in a large contribution of the density of states at the Fermi level. In addition, N atoms are not conducive to the stability of α–Fe, as they relax to the structure of γ–Fe at 25% N content (Fe3N), while α–Fe in higher N contents (Fe3N2 and FeN) relaxes to the structure of ω–Fe correspondingly. Obviously, N tends to stabilize in the ω and γ phases in martensite, and our study provides a new clue for the formation mechanism of nitrides and martensitic transformation in Fe–N alloys.

1. Introduction

It is well known that introducing alloying atoms to the host metal lattice could improve the structural and electronic properties of materials, such as the famous structural material Fe–C alloy. Undoubtedly, C atoms are the key component of high-strength steel; as a result, their positions and evolution have been widely studied. Nitrogen has been found to significantly improve hardness and resistance to pitting corrosion [1,2,3,4,5,6,7,8,9] when it partially replaces carbon atoms in high-carbon austenitic and martensitic stainless steel. Nitrogen is a very effective austenite stabilizer and can be used to replace Ni to reduce costs, but keeping desirable mechanical properties [10,11,12]. Thus, developing high-nitrogen steels is recently attractive for steel companies as a new structural material. Nevertheless, the position and evolution of nitrogen in high-nitrogen steels are still unclear, although a lot of microstructural characterization has been carried out [13,14,15,16].
Recently, a new phase, ω–Fe, was observed in martensitic substructures in high-nitrogen martensitic stainless steels [17]. It is well known that the ω structure is widely observed in transition metals and alloys and is supposed to be an intermediate state of a transformation pathway between bcc, fcc, and hcp via collective motion of atoms [18,19,20,21,22,23,24,25]. ω–Fe was also reported to exist at the boundary region of the body-centered cubic (bcc) {112}<111>-type martensitic twin in the Fe–C alloy, stabilized by carbon atoms [26,27,28,29,30]. ω–Fe is similar to the ω phase in other bcc metals and alloys [19,25,31,32,33], and has a primitive hexagonal structure with its lattice parameters: a ω = 2 a b c c and c ω = 3 / 2 a b c c . Such a ω phase has a specific orientation relationship with its bcc partner [25,30].
Theoretically, pure and C-atom doping of ω–Fe have been well studied and it is found that C atoms stabilize the ω–Fe phase and 25% C-atom content is most stable [34,35,36]. ω–Fe was observed in martensitic twinned substructures in high-nitrogen steels, and this substructure is also commonly observed in high-nitrogen martensitic stainless steels [37,38,39,40,41]. However, the theoretical studies on the N-atom doping of ω–Fe is still missing.
Martensitic transformation involves not only the reorganization of Fe atoms from a high-temperature γ phase (face-centered cubic, fcc) to low-temperature α phase (body-centered cubic, bcc), but also the redistribution of N atoms and the forming of nitrides. Systematic comparative study on the distribution and interaction with matrix Fe of N atoms in the γ, ω, and α phases involved in the martensitic phase transition will help us understand the transformation process and the formation mechanism of nitrides. Therefore, by use of the density functional theory we have studied the influences of nitrogen content and magnetic order on the crystal structure, stability, and electronic structure of ω–Fe, α–Fe, and γ–Fe in Fe–N alloys.

2. Materials and Methods

The ω–Fe phase is a hexagonal crystal with the space group of P6/mmm and the lattice parameters depend on bcc α–Fe ( a ω = 2 a b c c , c ω = 3 / 2 a b c c , a b c c set as 2.852 Å) [42]. A primitive unit cell contains three Fe atoms, of which one locates at (0, 0, 0) and two crystallographically equivalent atoms locate at (2/3, 1/3, 1/2) and (1/3, 2/3, 1/2) in fractional coordinates as shown in Figure 1 (Fe1 and Fe2).
For the sake of structural consistency, the same as in studies on the ω phase in Fe–C alloys [34,35,36], we constructed new unit cells (Figure 1) for α–Fe and γ–Fe which have three Fe atoms in one unit cell, the same as ω–Fe, with the details shown in Figure A1 (Appendix A). Taking afcc = 3.59 Å [43], the initial lattice parameters of the new unit cell of γ–Fe are a = b = 4.40 Å, c = 2.54 Å, α = β = 106.78°, and γ = 48.19°, and three Fe atoms locate at (0, 0, 0) (Fe1), (1/3, 1/3, 1/3), and (2/3, 2/3, 2/3) (Fe2). Taking abcc = 2.852 Å [43], the initial lattice parameters of the new unit cell of α–Fe are a = b = 4.03 Å, c = 2.47 Å, α = β = 90°, and γ = 120° for α–Fe3, and three Fe atoms locate at (0, 0, 0) (Fe1), (1/3, 2/3, 1/3), and (2/3, 1/3, 2/3) (Fe2).
Three kinds of nitrogen contents of 25%, 40%, and 75%, with corresponding chemical compositions of Fe3N, Fe3N2, and FeN, were considered for the octahedral interstitial sites. In the newly built γ–Fe and α–Fe unit cells, all Fe atoms are equivalent in crystallography; as the N atoms occupy the octahedral sites, the symmetry is broken and two kinds of Fe named Fe1 and Fe2 (Figure 1) are formed, similar to that of ω–Fe.
The present calculations were carried out by means of the plane-wave pseudopotential Vienna ab initio Simulation Package [44] in the framework of density functional theory (VASP5.4.4). The generalized gradient approximation formulated by Perdew, Burke, and Ernzerhof (GGA–PBE) [45] was used for the exchange–correlation functional. The projector augmented wave (PAW) method, which was proposed by Blöchl [46] and implemented by Kresse and Joubert [47], was employed with a cutoff energy of 500 eV. The complete Brillouin zone was sampled by use of a uniform mesh grid with an actual spacing of 0.02 Å−1 for all the crystal structures, which corresponds to the k-point grid of 14 × 14 × 20 for ω–Fe. Brillouin zone integrations were performed with the Methfessel–Paxton method with a thermal smearing parameter of 0.2 (eV) [48]. The PAW pseudopotentials are 2p63d64s2 for Fe and 2s22p3 for N. All the crystal structures for calculations were optimized without symmetry constraints under zero external stress with the lattice parameters and internal atomic positions relaxed simultaneously, and the corresponding energy and force tolerances of 10−8 eV and 0.001 eV/Å, respectively. Using these parameters, we calculated the Fe–N compounds in the Fe–N phase diagram including FeN in rock-salt (Fm-3m) γ′′′, zinc blende (F-43m) γ″, and ε-Fe3N (P6322) [49]. The calculated results indicate that γ′′′-FeN, γ″-FeN, and ε-Fe3N (P6322) are antiferromagnetic, non-magnetic, and ferromagnetic, respectively, consistent with previous reports [49]. The calculated lattice parameter of γ′′-FeN is a = 4.23 Å, close to 4.3 Å [49], and that of γ′′′-FeN is a = 4.3Å, a little smaller than 4.5 Å [49]. The calculated lattice parameters of ε-Fe3N are a = 4.64 Å and c = 4.32 Å, quite close to 4.60 Å and 4.34 Å, respectively [49]. These prove the accuracy of the calculated parameters.
Phonon frequencies were investigated within the harmonic approximation for a lattice Hamiltonian using the finite-displacement method in the Vienna ab initio Simulation Package (VASP5.4.4) combined with the analysis program PHONOPY [50,51]. In order to calculate the phonon band structure, a supercell structure was used to calculate the force constants, i.e., 2 × 2 × 4 supercell for ω–Fe, α–Fe, and γ–Fe, and their N doping compounds. A total of 101 k-points were used to sample each segment of band paths in order to obtain phonon dispersion relations.

3. Results and Discussion
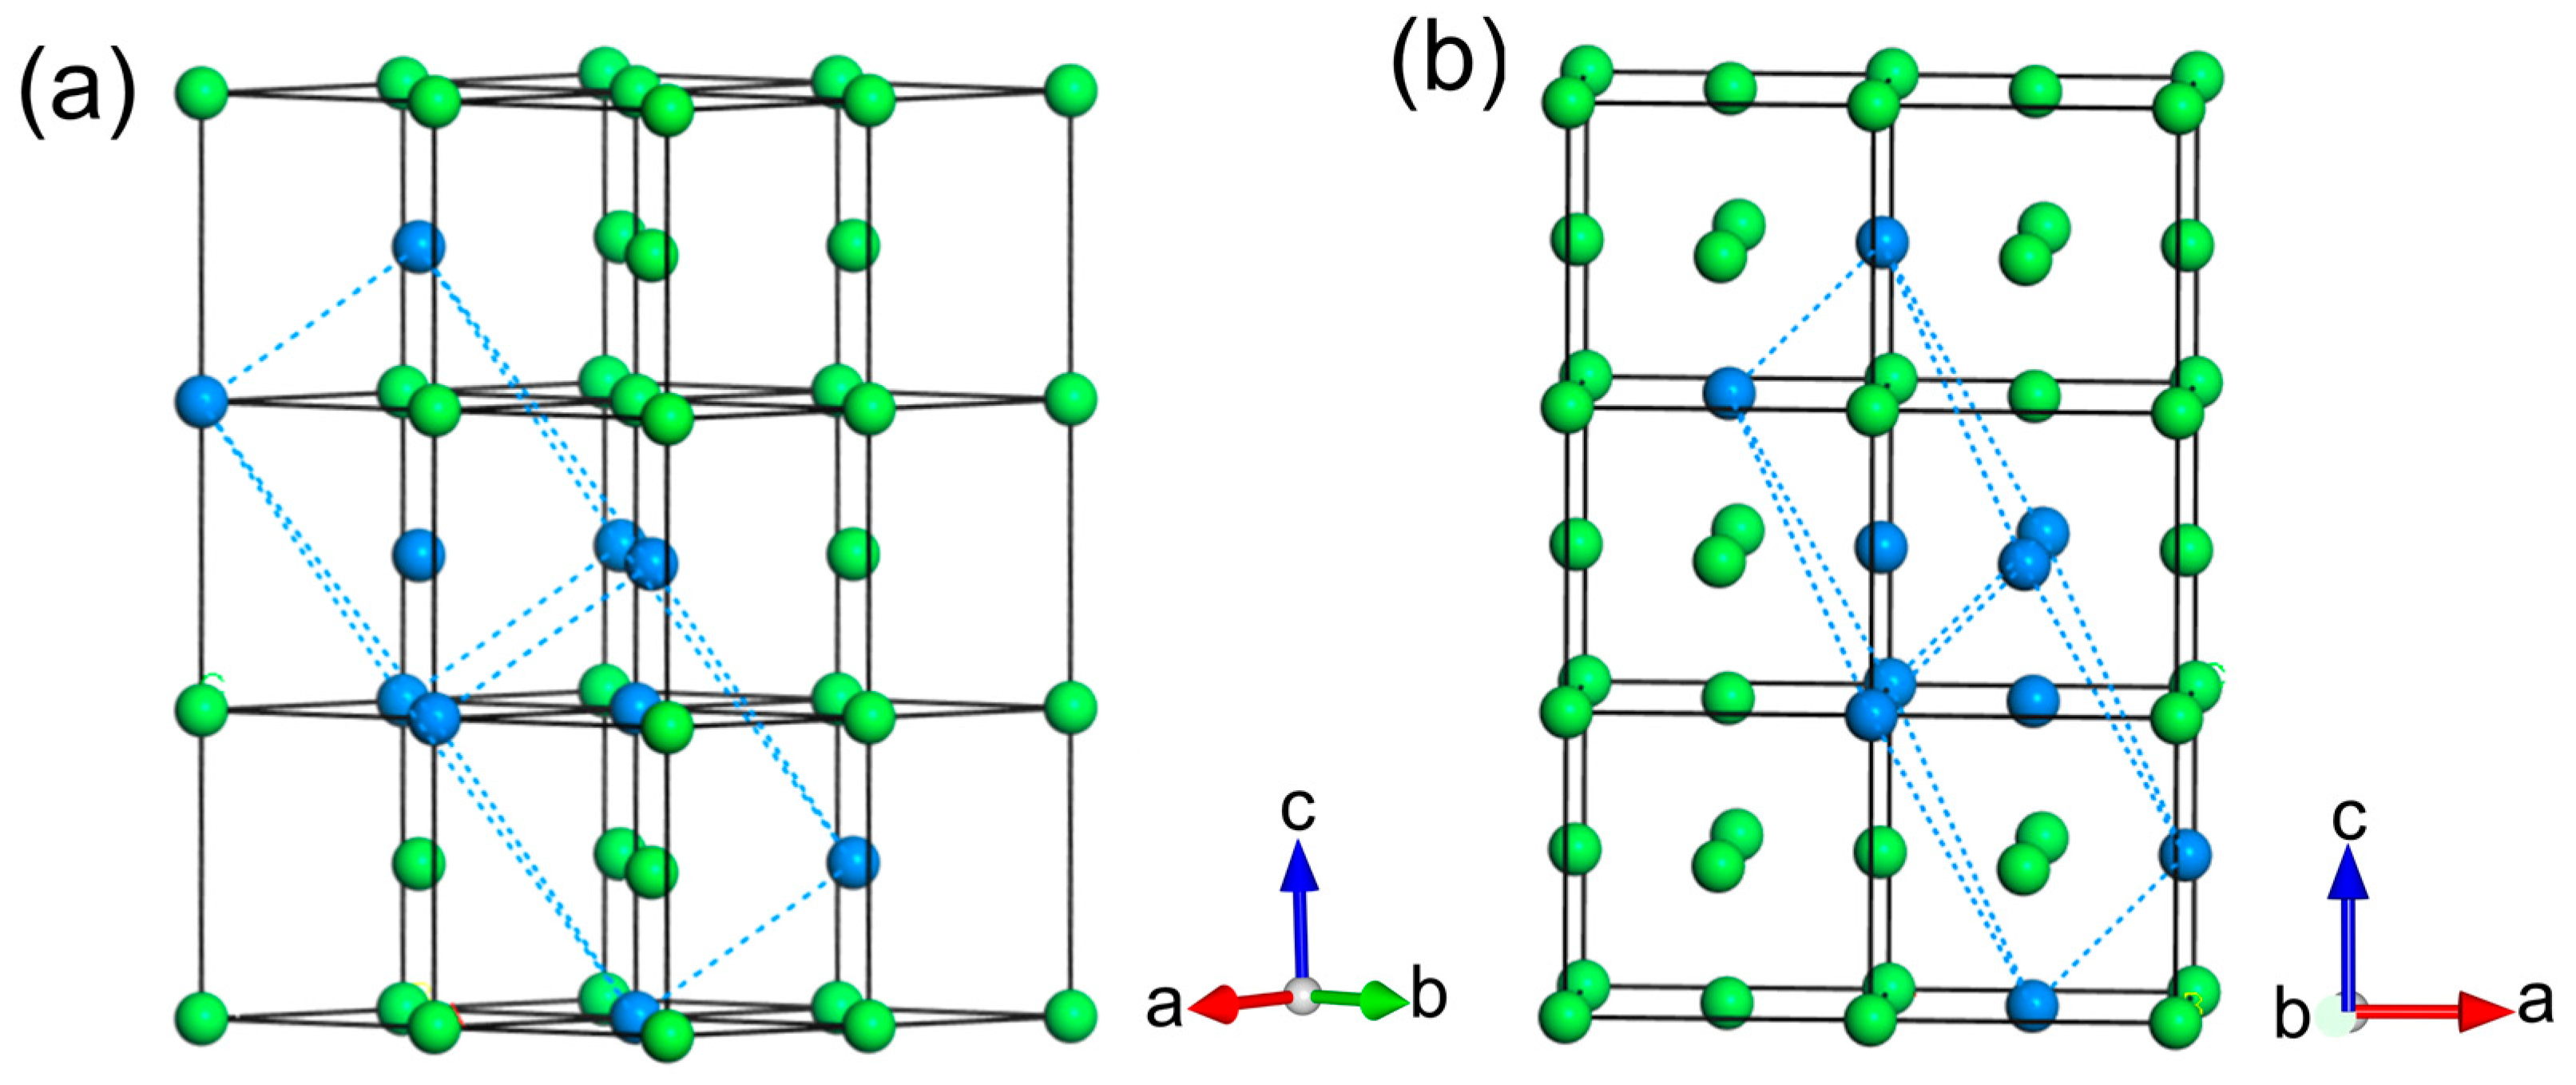
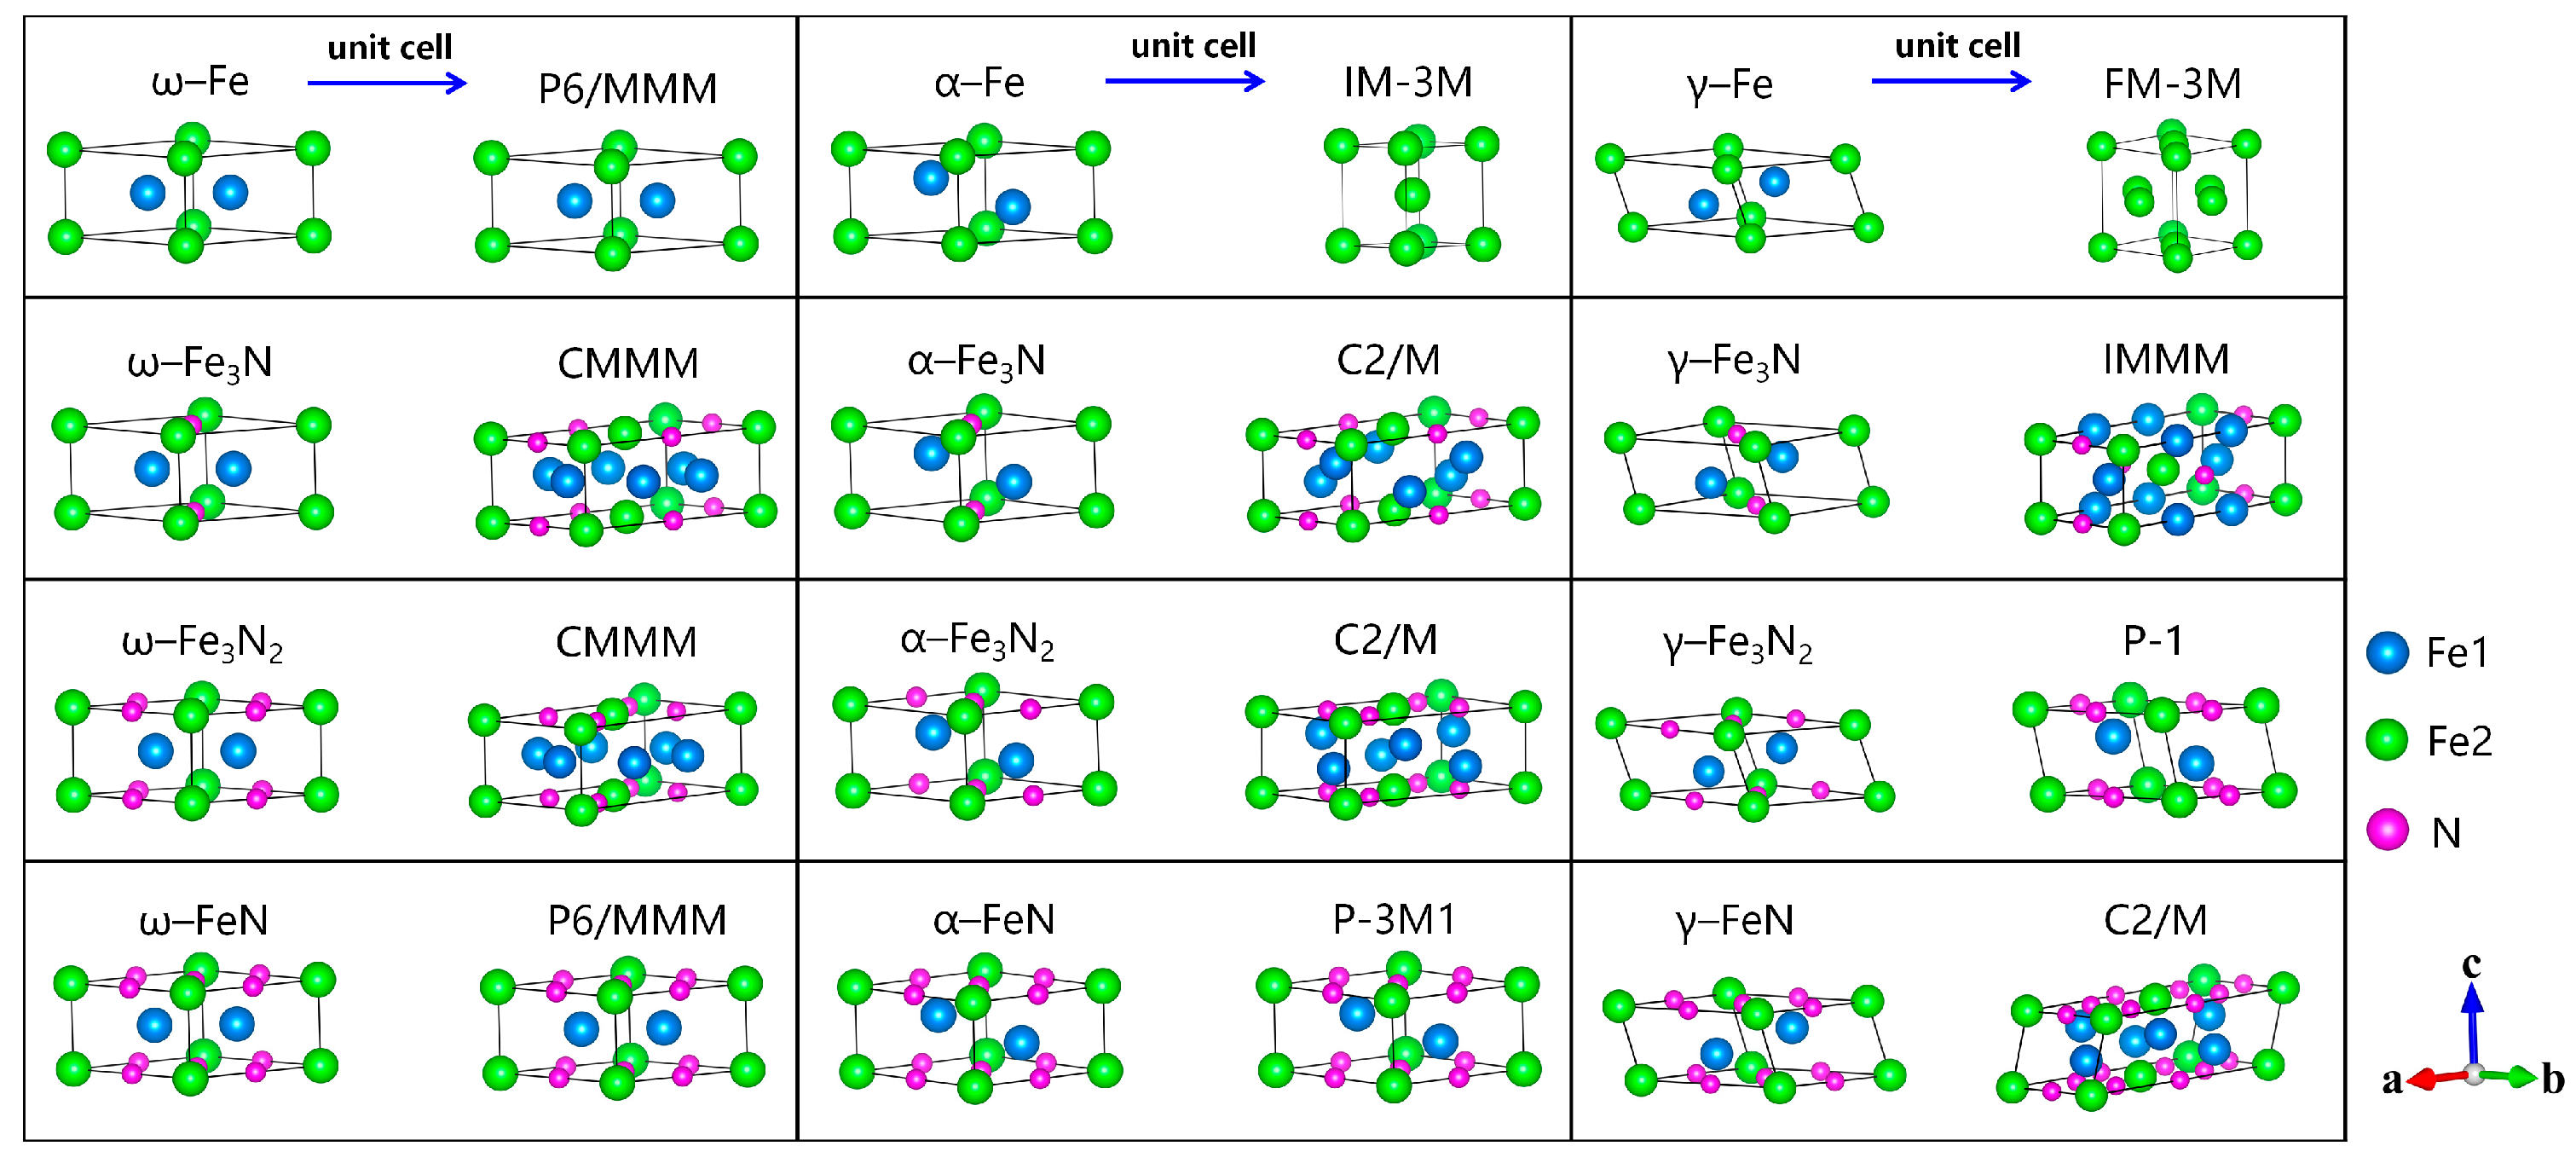
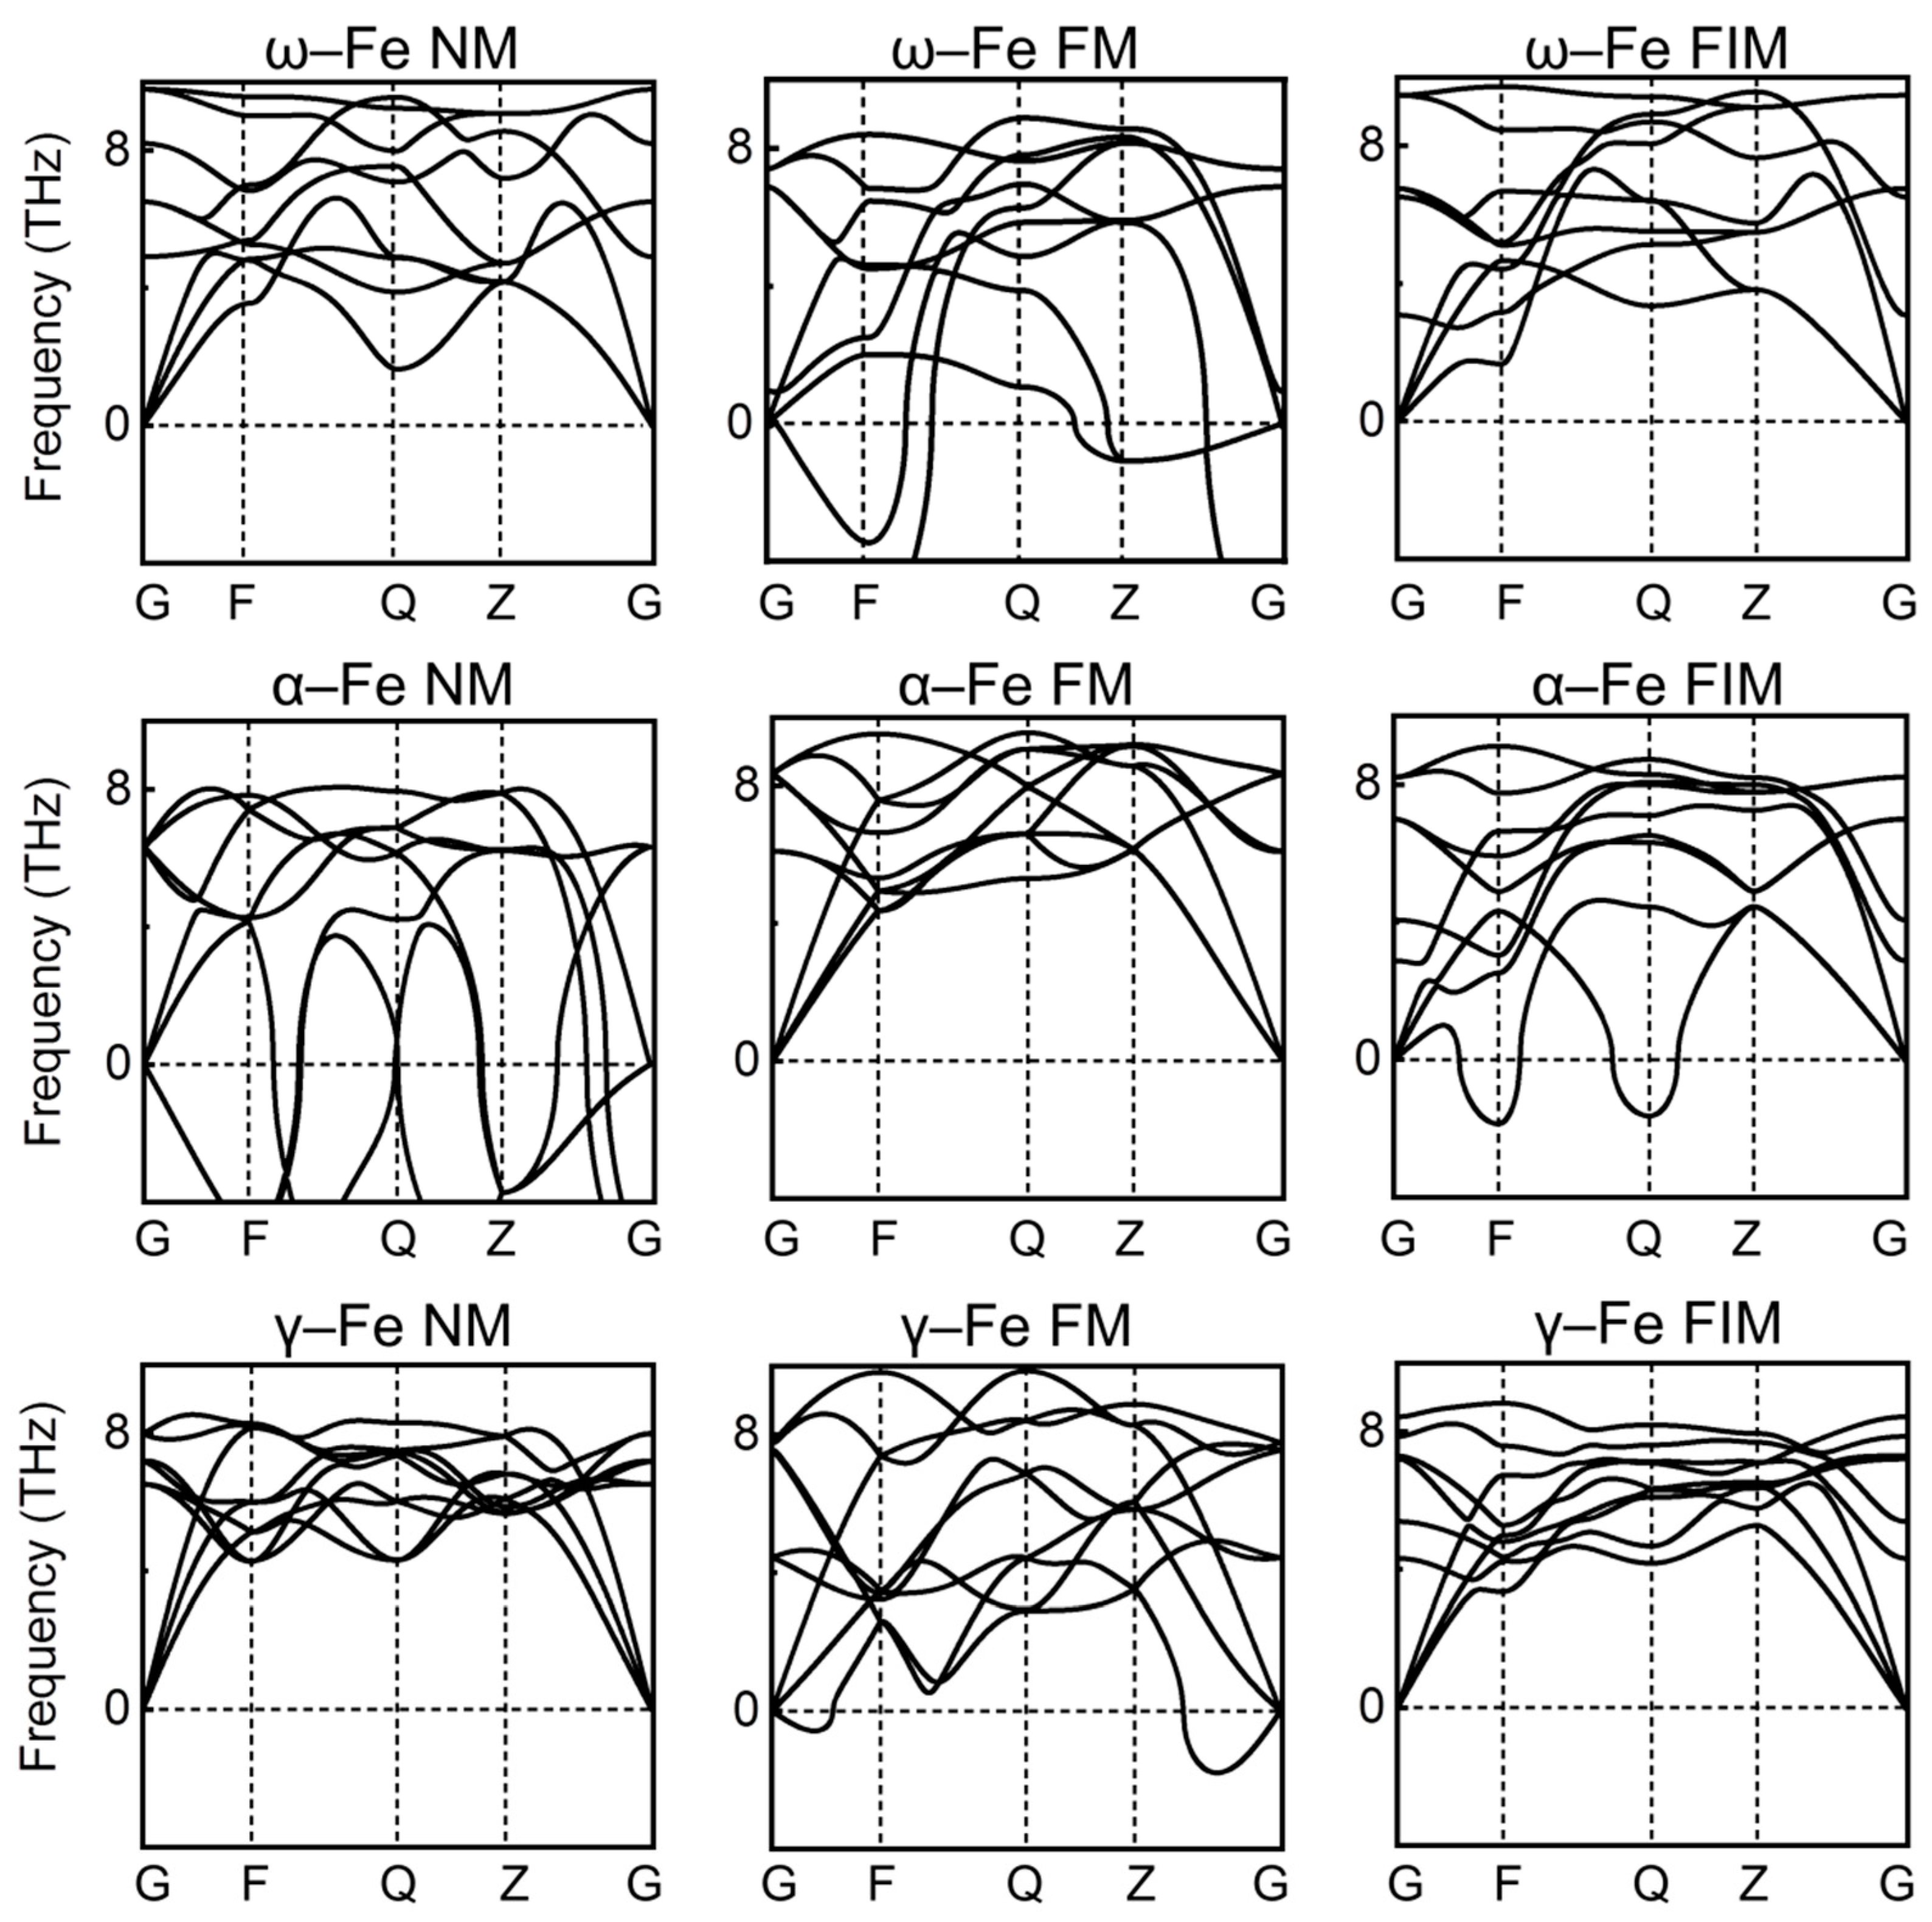
3.1. Pure Fe Phases

According to previous studies on ω–Fe, α–Fe, and γ–Fe in Fe–C alloys [34,35,36], non-magnetic (NM), ferromagnetic (FM) with Fe1 and Fe2 spin parallel arrangement, and ferrimagnetic (FIM) with Fe1 and Fe2 spin antiparallel arrangement structures were considered for pure Fe phases of ω–Fe, α–Fe, and γ–Fe. The lattice parameters, bond lengths, total energies, and atomic magnetic moments of the fully relaxed structures are shown in Table 1.
The total energy display shows that for ω–Fe and γ–Fe, FIM state is the most stable, while for α–Fe, FM state is the most stable. Previous theoretical studies report that the pure Fe ω phase shows ferrimagnetic order [34,35,36]. Experimentally, α–Fe as the low-temperature phase of Fe–N alloy is stable in ferromagnetic state [52,53,54]. As shown in Table 1, the total energy of α–Fe in FM is much lower than those in NM and FIM, with differences of 1422 and 531 meV/f.u., respectively. For γ–Fe, FIM state is most stable, with total energies of 75 and 117 meV/f.u. lower than those at FM and NM. Experimentally, γ–Fe is in paramagnetic state at ahigh temperature, and theoretically is stable in antiferromagnetic state at a low temperature. The pure Fe ω phase is also most stable in FIM, with total energies of 240 and 72 meV/Fe lower than those of NM and FM states, respectively. The crystal structure parameters show that for all three phases, FM has the maximum volume, followed by FIM, and NM has the smallest volume. It can be inferred that increasing the volume is more conducive to the stability of the magnetic order.
The phonon dispersion relations of ω–Fe, α–Fe, and γ–Fe in NM, FM, and FIM were calculated, with the results shown in Figure 2. For ω–Fe and γ–Fe, both NM and FIM states have no phonon modes within the imaginary frequencies and hence are dynamically stable. ω–Fe in FM state has large phonon modes within the imaginary frequencies, indicating strong dynamic instability. γ–Fe in FM state also displays phonon modes within the imaginary frequencies, but quite less. For α–Fe, only FM state is dynamically stable without any imaginary frequency. FIM state has visible imaginary frequencies at the F and Q points and hence is dynamically unstable. NM state has large imaginary frequencies in the whole Brillouin zone, displaying extreme dynamic instability. This is consistent with the results of total energy that FM is most stable with a much lower energy than NM and FIM. This is consistent with previous theoretical reports [34,35]. Obviously, the dynamic stability of ω/α/γ–Fe is highly dependent on its magnetic structure.

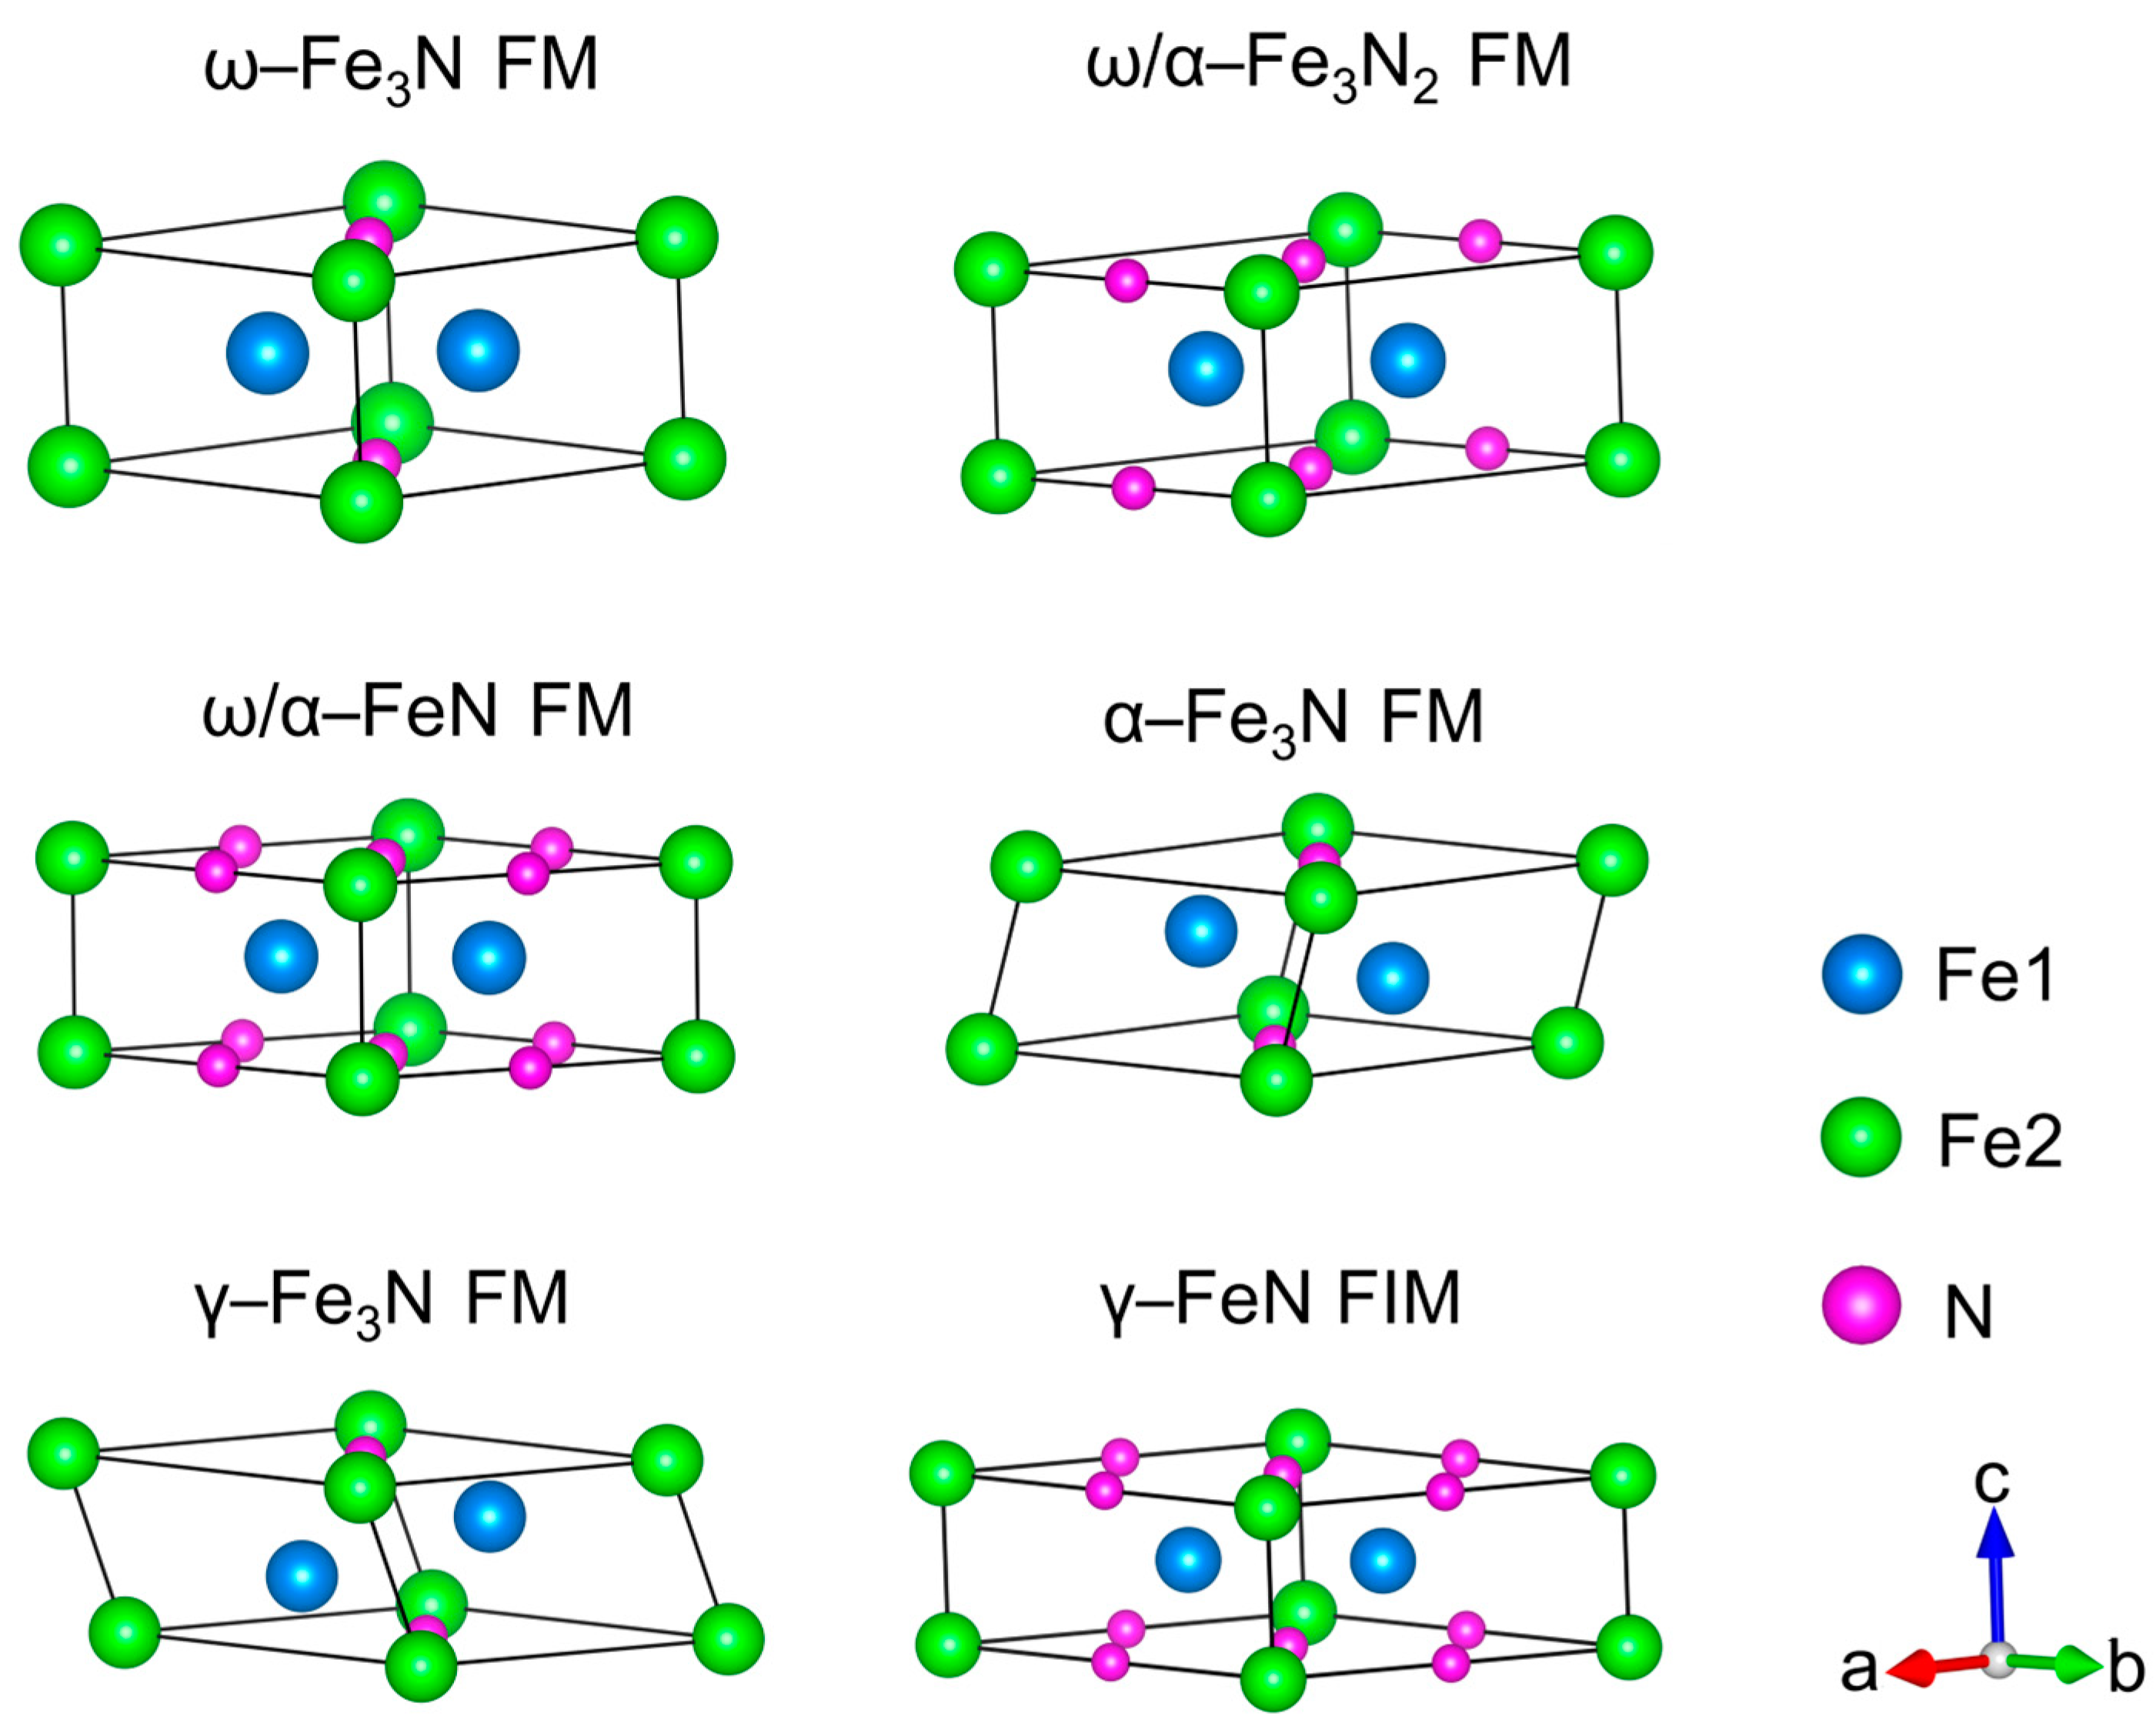
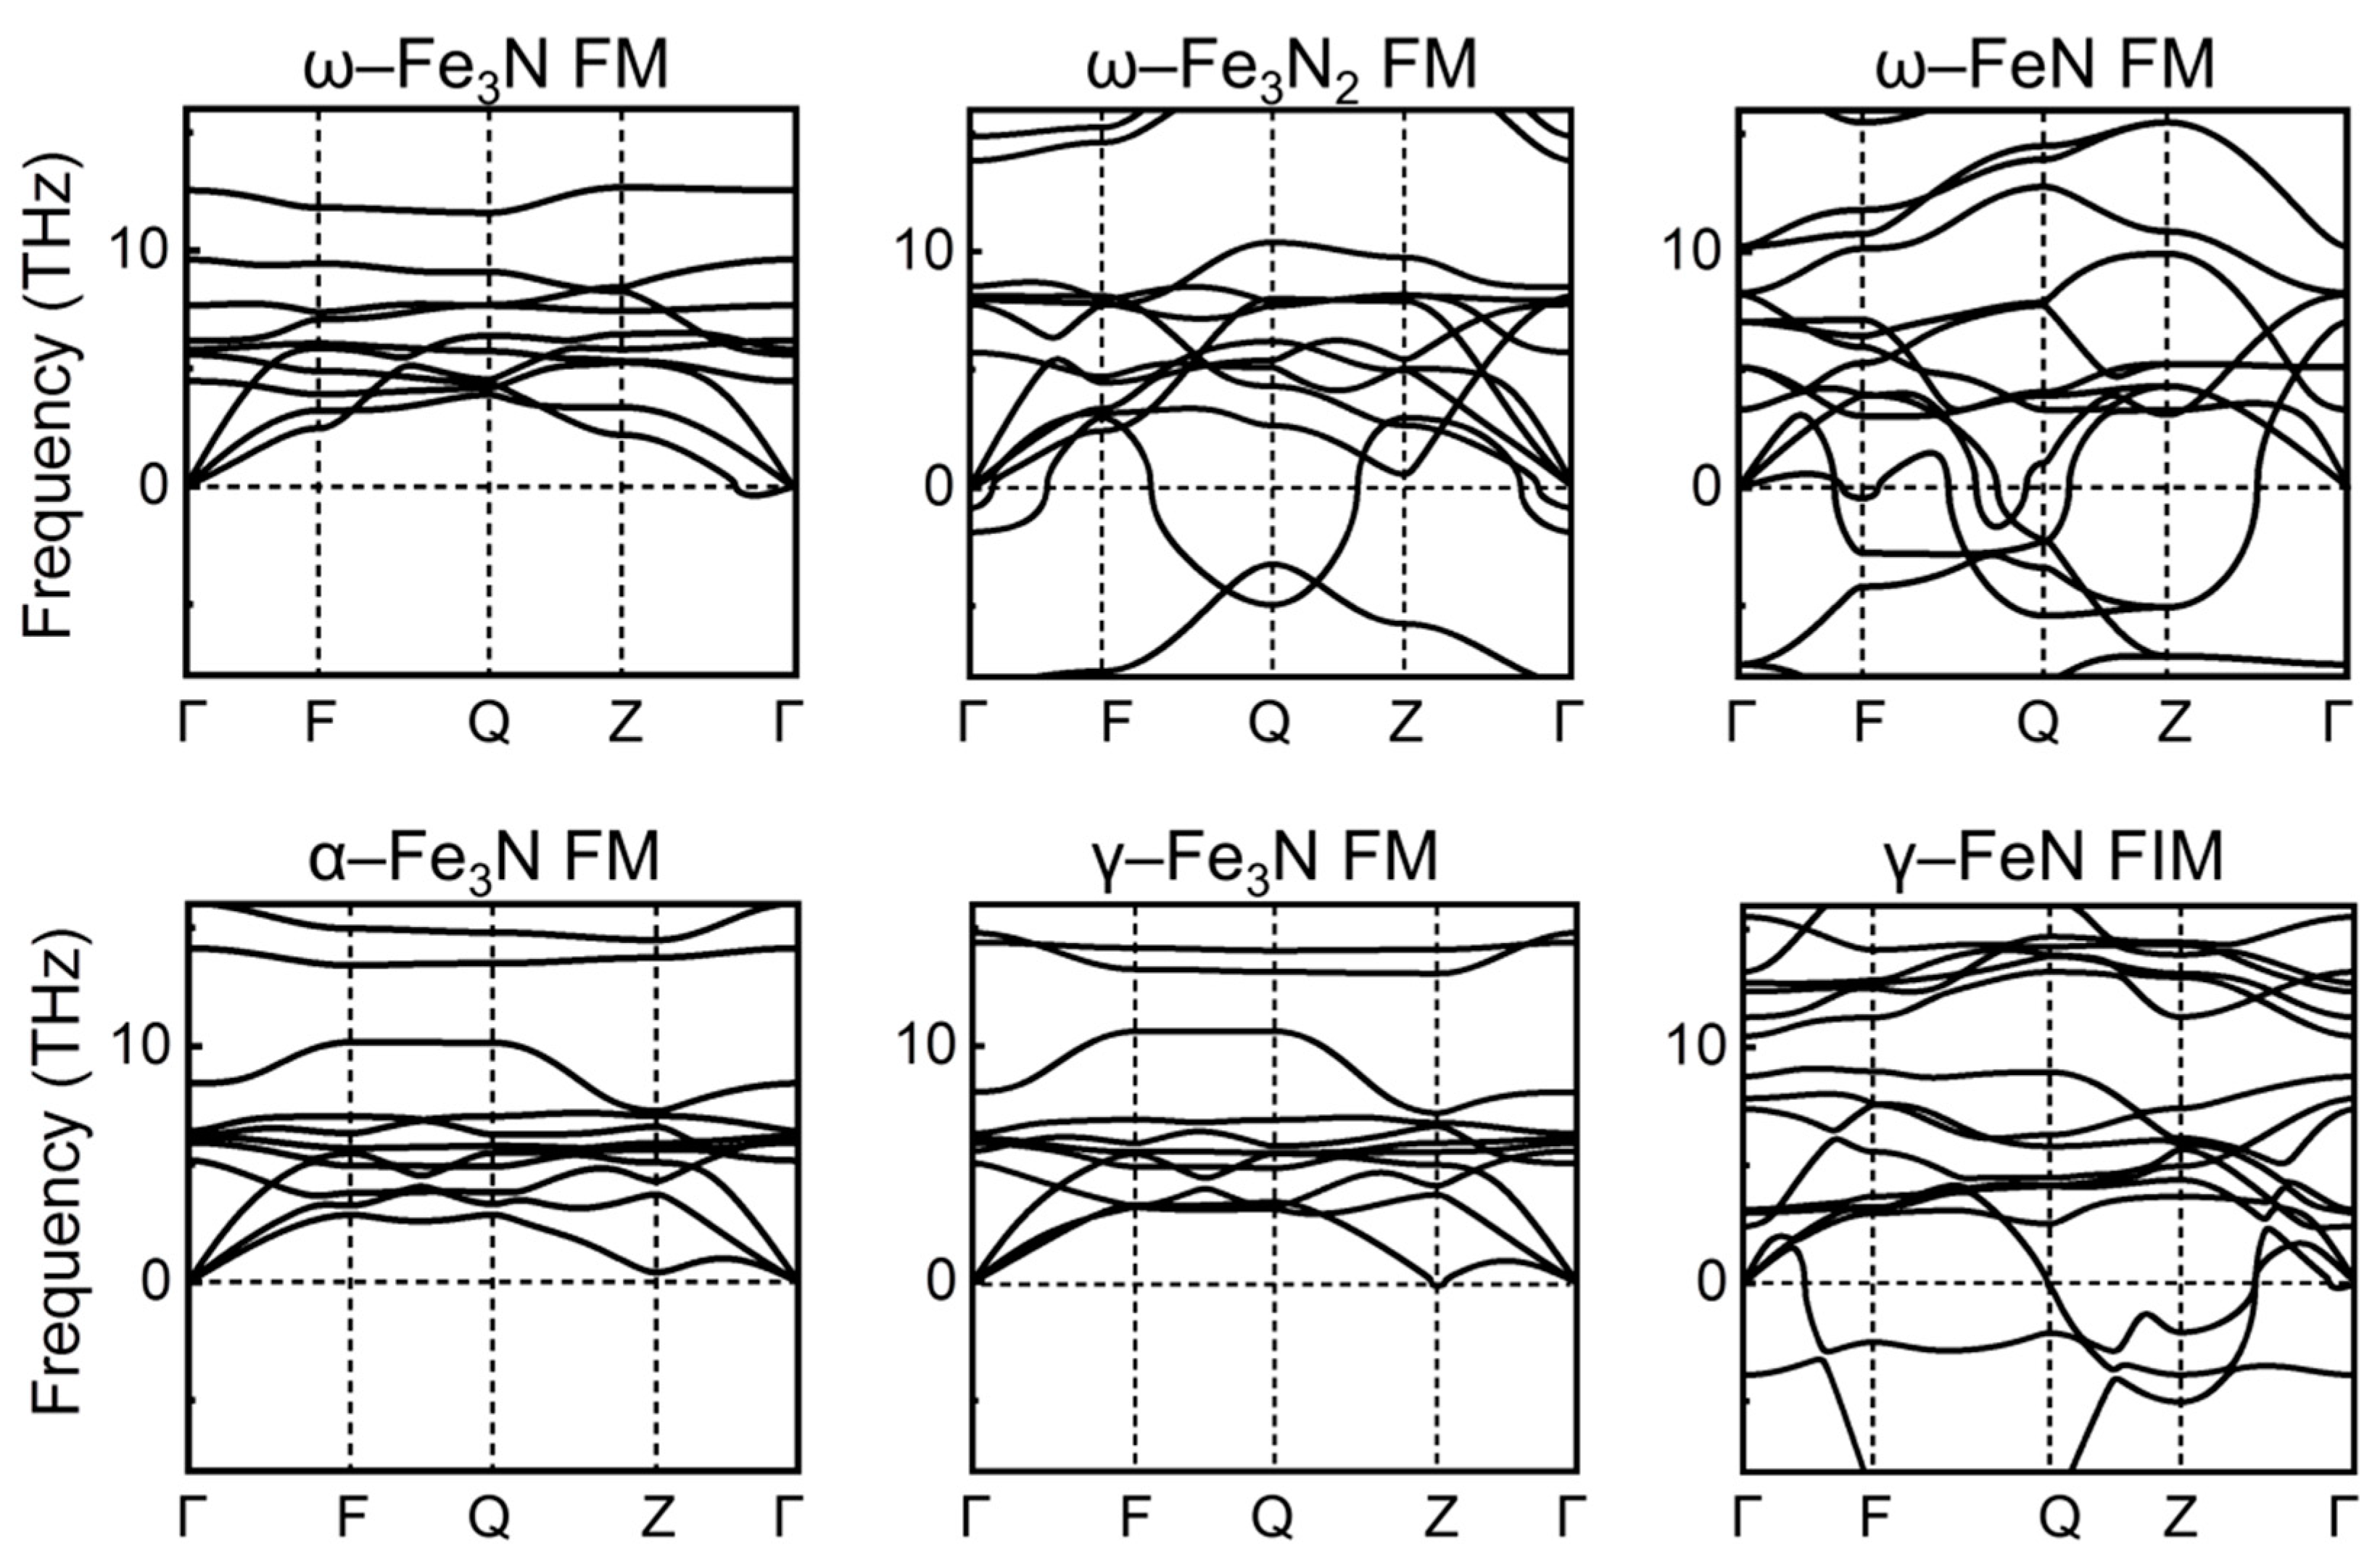
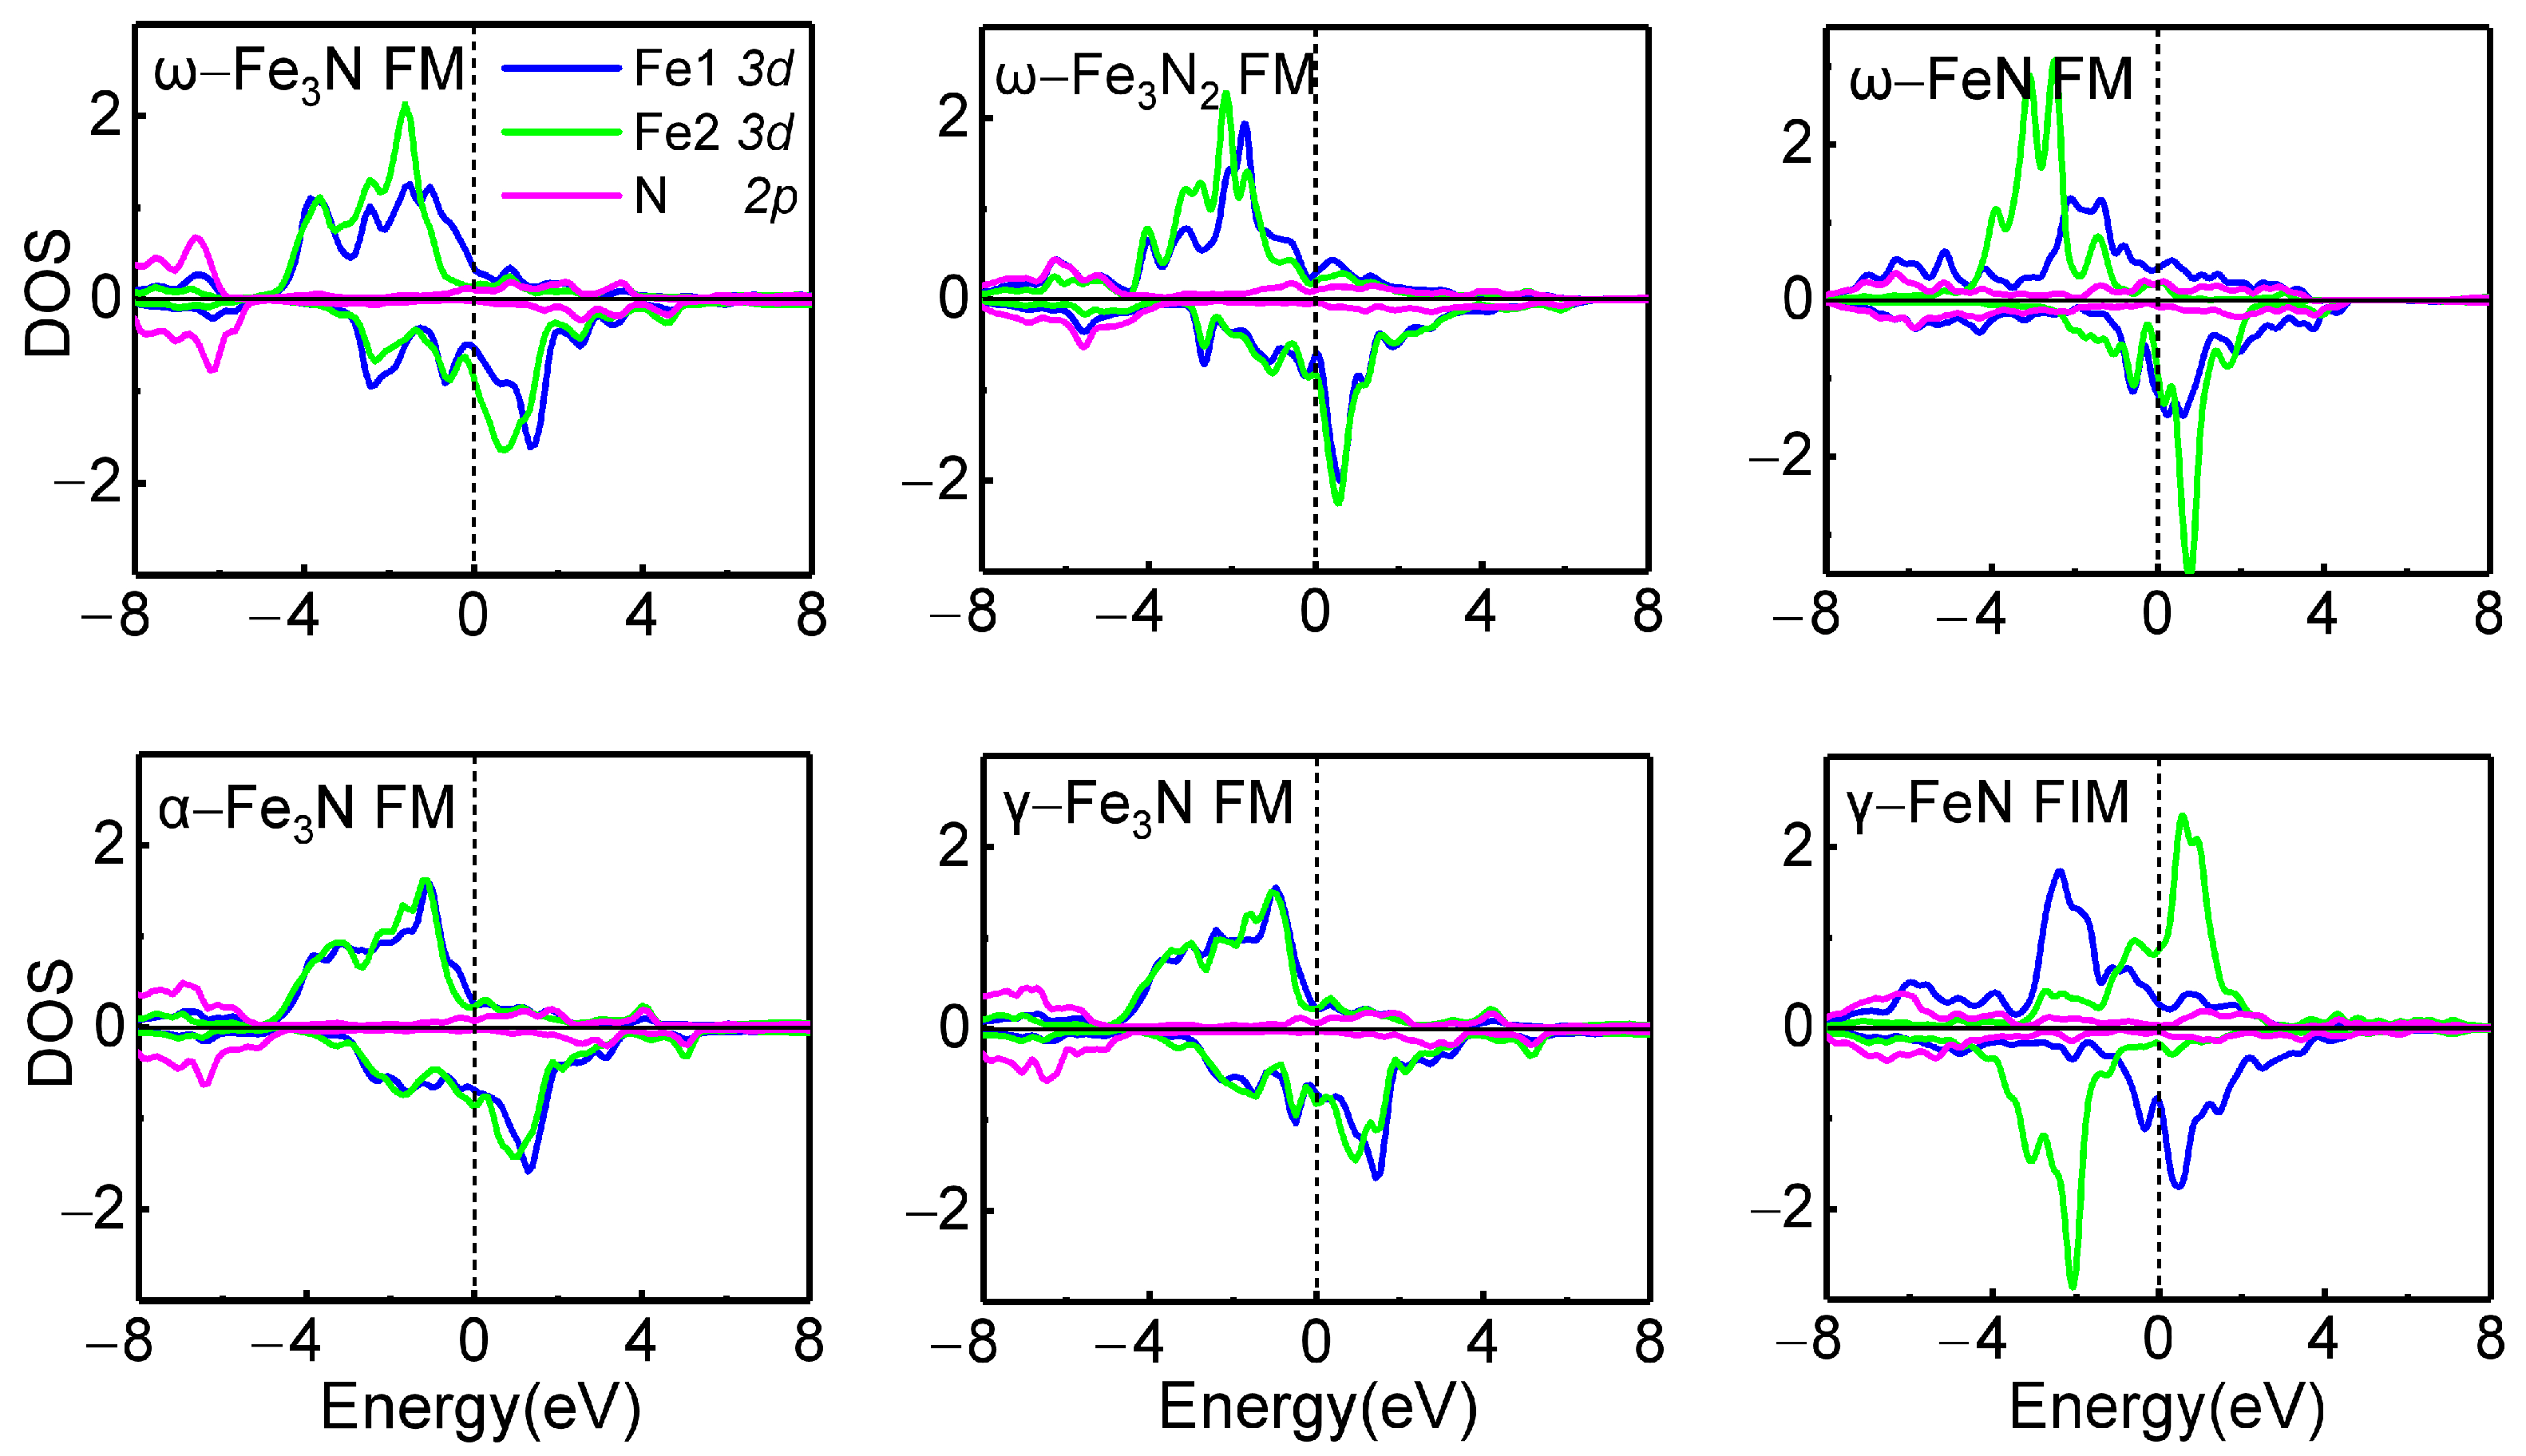
3.2. N-Doping ω–Fe, α–Fe, and γ–Fe Phases

Table 2 lists the calculated lattice parameters, zero-temperature formation energy (ΔHr), and atomic magnetic moments of ω/α/γ–Fe3N, ω/α/γ–Fe3N2, and ω/α/γ–FeN in NM, FM, and FIM states. The formation energy is obtained by the total energy of the sum of products minus the total energy of the sum of the reactants. Here, the reactants are defined according to the most stable phase α–Fe in FM and N2 molecules.
As shown in Table 2, it is interesting to find that only γ–Fe3N in FM has negative values of the reaction enthalpies of −0.04 eV, indicating that it is thermodynamically stable in ambient conditions. Next, α–Fe3N in FM has a very small position value of 0.06 eV for ΔHf, then there is ω–Fe3N in FM at about 0.18 eV. As shown in Table 2, FM is more stable than NM and FIM in the same component phase, except for γ–FeN, for which the optimization in FM fails to converge. Moreover, as the content of N atoms increases, the enthalpy of formation rapidly increases, indicating that too many N atoms are not conducive to the stability of ω/α/γ–Fe. Especially for γ–Fe, many initial structures fail to converge in high N content such as γ–Fe3N2 in NM, FM, and FIM and γ–FeN in FM.
It can be seen from Table 2 that the fully relaxed α–Fe3N in FM lost the original crystal characteristics such as the lattice parameters of α, β, and γ deviating from 90°, 90°, and 120°, respectively, and is similar to the fully relaxed γ–Fe3N in FM in terms of structural parameters and atomic magnetic moments (Table 2), and their ΔHf values are also close, with a difference of 0.1 eV. As shown in Figure 3, the optimized structure of α–Fe3N in FM looks quite similar to that of γ–Fe3N in FM. The same scenario was also observed for the fully relaxed α–Fe3N and γ–Fe3N in NM. In addition, α–Fe3N2 and α–FeN in NM, FM, and FIM have almost the same ΔHf, lattice parameters, and atomic magnetic moments as ω–Fe3N2 and ω–FeN in NM, FM, and FIM, respectively. This indicates that for the same composition and magnetic structure, they shift to the same structure. Figure 3 shows that the optimized structures of ω/α–Fe3N2 and ω/α–FeN are much closer to the original structure of ω–Fe (Figure 1). This means α–Fe3N2 and α–FeN are so unstable that they relax to the structures of ω–Fe3N2 and ω–FeN, respectively. Obviously, N atoms are difficult to stabilize in α–Fe. Obviously, incorporation of the N atoms and metallic atoms highly depends on the structures [55,56].
The phonon dispersion relations of the most stable phase of each component, i.e., ω/α/γ–Fe3N, ω–Fe3N2, and ω–FeN in FM state and γ–FeN in FIM state were calculated, with the results shown in Figure 4. Almost the same phonon bands of α–Fe3N and γ–Fe3N indicate they are the same structure, proving the above point that α–Fe3N is unstable and shifts to γ–Fe3N after full-relaxation optimization. It can be seen from Figure 4 that γ–Fe3N in FM is dynamically stable without any imaginary frequency. ω–Fe3N looks almost stable in FM state, only with a very small imaginary frequency at Г point. As shown in Figure 2 and Figure 4, as 25% N atom is introduced to ω–Fe and γ–Fe to form ω–Fe3N and γ–Fe3N, the dynamic stabilities greatly improve. The higher N content ω–Fe3N2 and ω–FeN in FM state and γ–FeN in FIM state are all strongly dynamically unstable because of the large imaginary frequencies. Obviously, 25% N content is beneficial for the kinetic stability of ω–Fe and γ–Fe, while higher nitrogen content is not.
Quantum-chemical insight into the N-atom introduction is available from analyzing the electronic structures. Figure 5 displays the partial densities-of-states (PDOSs) of Fe1 and Fe2 3d orbitals and N 2p orbitals for ω/α/γ–Fe3N, ω–Fe3N2, and ω–FeN in FM state and γ–FeN in FIM state. α–Fe3N shows a quite similar PDOS to that of γ–Fe3N, which proves once again that they are the same structure. There are some similarities between the PDOS of ω–Fe3N and γ–Fe3N, such as the two separated regions, i.e., from −8 to −4 eV and from −4 eV to the Fermi level (EF), as shown in Figure 4. The PDOS, combining with chemical-bonding analysis, shows that the lower part in energy is generated by Fe–Fe interactions, whereas the higher part near EF goes back to Fe–C interactions. The PDOSs of Fe1 and Fe2 3d orbitals look almost superimposable for γ–Fe3N, with only minute differences. The situation is different for ω–Fe3N, where Fe1 and Fe2 differ more in character. This means the interaction between Fe1 and Fe2 is weaker in ω–Fe3N, consistent with lower formation energy than γ–Fe3N.
For the higher N content ω–Fe3N2 and ω–FeN in FM state, N 2p orbitals move to the Fermi level and become more dispersed, resulting in a higher hybridization with Fe1 and Fe2 3d orbitals. The same scenario was also observed for γ–FeN in FIM state. In addition, the antiparallel spin alignment of Fe1 and Fe2 leads to a large DOS distribution at EF for both majority and minority spin. This makes for less stability for γ–FeN in FIM state, consistent with the results of dynamic stability.

4. Conclusions

Using the first-principle density function method, we calculated the effects of nitrogen content and magnetic order on the crystal structure, thermodynamic and dynamic stability, and electronic structure of ω–Fe, α–Fe, and γ–Fe in Fe–N alloys. For α–Fe only, ferromagnetic structure shows dynamic stability, which is also much more stable than non-magnetic and ferrimagnetic structures in total energy. ω–Fe and γ–Fe in both ferrimagnetic and non-magnetic structures are dynamically stable, and the ferrimagnetic structure is more stable thermodynamically. However, their ferromagnetic structures have the highest total energy and show dynamic instability. Nitrogen atom doping of 25% is beneficial for the thermodynamic stability of γ–Fe and ω–Fe in ferromagnetic structures, reflected by the negative enthalpy of formation and phonon spectra without imaginary frequencies. Electronic structure calculations show that the weaker Fe1–Fe2 interactions result in the lower stability of ω–Fe3N compared to γ–Fe3N. Higher N content is not conducive to the thermodynamic stability of ω–Fe and γ–Fe, because of rapidly increasing enthalpy of formation and imaginary frequency. The electronic structure results show that as the N content increases, the 2p orbitals of N move towards the Fermi level, becoming more dispersed and increasing the distribution of electrons at the Fermi level, thereby reducing stability. The crystal structure, phonon spectrum, and electronic structure show that N atoms are not good for the stability of α–Fe. At 25% N content, it relaxes to the γ–Fe structure, while at higher N content, it relaxes to the ω–Fe structure. Obviously, N tends to stabilize in the ω and γ phases rather than α phase. Our results probably provide a theoretical basis for the martensitic transformation and formation process of nitrides in Fe–N alloys.

Author Contributions

Conceptualization, H.X., L.X. and A.F.; methodology, J.T. and H.X.; software, J.T. and H.X.; validation, H.X., S.Q., N.L. and D.P.; formal analysis, H.X., L.X., S.Q. and A.F.; investigation, J.T. and H.X.; resources, H.X. and N.L.; data curation, J.T., H.X., L.X., S.Q., A.F. and N.L.; writing—original draft, H.X. and L.X.; writing—review and editing, H.X., N.L. and D.P.; visualization, J.T. and H.X.; supervision, H.X. and D.P.; project administration, H.X. and L.X.; funding acquisition, L.X. All authors have read and agreed to the published version of the manuscript.

Funding

This research was funded by the National Natural Science Foundations of China (Grant Nos: 51971159, 22473032), Zhuhai Science Technology Department Project (2420004000003).

Data Availability Statement

Data are contained within the article.

Conflicts of Interest

The authors declare no conflicts of interest.

Appendix A

Figure A1. The schemes of reconstructing the unit cells (in blue) of (a) α–Fe and (b) γ–Fe based on ω–Fe (three Fe atoms in the unit cell) from the bcc (2 × 2 × 3 supercell) and fcc (2 × 1 × 3 supercell) Fe phases.
Metals 15 00098 g0a1

References

  1. Byrnes, M.L.G.; Grujicic, M.; Owen, W.S. Nitrogen strengthening of a stable austenitic stainless steel. Acta Metall. 1987, 35, 1853–1862. [Google Scholar] [CrossRef]
  2. Stein, G.; Menzel, J. Nitrogen alloyed steels—A new generation of materials with extraordinary properties. Int. J. Mater. Prod. Technol. 1995, 10, 290–302. [Google Scholar]
  3. Simmons, J.W. Overview: High–nitrogen alloying of stainless steels. Mater. Sci. Eng. 1996, 207, 159–169. [Google Scholar] [CrossRef]
  4. Berns, H. Manufacture and application of high nitrogen steels. ISIJ Int. 1996, 36, 909–914. [Google Scholar] [CrossRef]
  5. Li, C.X.; Bell, T. Corrosion properties of plasma nitride AISI 410 martensitic stainless steel in 3.5% NaCl and 1% HCl aqueous solutions. Corros. Sci. 2006, 48, 2036–2049. [Google Scholar] [CrossRef]
  6. Lopez, D.; Falleiros, N.A.; Tschiptschin, A.P. Corrosion erosion behavior of austenitic and martensitic high nitrogen stainless steels. Wear 2007, 263, 347–354. [Google Scholar] [CrossRef]
  7. Ono, A.A.; Alonso, N.; Tschiptschin, A.P. The corrosion resistance of nitrogen bearing martensitic stainless steels. ISIJ Int. 1996, 36, 813–817. [Google Scholar] [CrossRef]
  8. Lee, T.H.; Oh, C.S.; Kim, S.J.; Takaki, S. Deformation twinning in high–nitrogen austenitic stainless steel. Acta Mater. 2007, 55, 3649–3662. [Google Scholar] [CrossRef]
  9. Ma, X.P.; Wang, L.J.; Qin, B.; Liu, C.M.; Subramanian, S.V. Effect of N on microstructure and mechanical properties of 16Cr5Ni1Mo martensitic stainless steel. Mater. Des. 2012, 34, 74–81. [Google Scholar] [CrossRef]
  10. Onomoto, T.; Terazawa, Y.; Tsuchiyama, T.; Takaki, S. Effect of grain refinement on tensile properties in Fe–25Cr–1N alloy. ISIJ Int. 2009, 49, 1246–1252. [Google Scholar] [CrossRef]
  11. Mitsui, H.; Kurihana, S. Solution nitriding treatment of Fe–Cr alloys under pressurized nitrogen gas. ISIJ Int. 2007, 47, 479–485. [Google Scholar] [CrossRef]
  12. Oshima, T.; Habara, Y.; Kuroda, K. Efforts to save nickel in austenitic stainless steels. ISIJ Int. 2007, 47, 359–364. [Google Scholar] [CrossRef]
  13. Kaluba, W.J.; Kaluba, T.; Taillard, R. The austenitizing behavior of high–nitrogen martensitic stainless steels. Scr. Mater. 1999, 41, 1289–1293. [Google Scholar] [CrossRef]
  14. Beneteau, A.; Aeby–Gautier, E.; Geandier, G.; Weisbecker, P.; Rediaimia, A.; Appolaire, B. Tempering of a martensitic stainless steel: Investigation by in situ synchrotron X–ray diffraction. Acta Mater. 2014, 81, 30–40. [Google Scholar] [CrossRef]
  15. Behjati, P.; Kermanpur, A.; Najafizadeh, A.; Baghbadorani, H.S.; Karjalainen, L.P.; Jung, J.G.; Lee, Y.K. Effect of nitrogen content on grain refinement and mechanical properties of a reversion–treated Ni–free 18Cr–12Mn austenitic stainless steel. Metall. Mater. Trans. A 2014, 45A, 6317–6328. [Google Scholar] [CrossRef]
  16. Sun, J.; Zhang, Y.T.; Wang, P.; Ye, Z.F.; Li, D.Z. Effect of N on the microstructure and mechanical properties of high Si martensitic heat–resistance steels. Acta Metall. Sin. 2014, 27, 573–584. [Google Scholar] [CrossRef]
  17. Ping, D.H.; Ohnuma, M. ω–Fe particle size and distribution in high–nitrogen martensitic steels. J. Mater. Sci. 2018, 53, 5339–5355. [Google Scholar] [CrossRef]
  18. Wang, S.; Wu, M.; Shu, D.; Zhu, G.; Wang, D.; Sun, B. Mechanical instability and tensile properties of tizrhfnbta high entropy alloy at cryogenic temperatures. Acta Mater. 2020, 201, 517–527. [Google Scholar] [CrossRef]
  19. Sikka, S.K.; Vohra, Y.K.; Chidambaram, R. Omega phase in materials. Prog. Mater. Sci. 1982, 27, 245–310. [Google Scholar] [CrossRef]
  20. Trinkle, D.R.; Hennig, R.G.; Srinivasan, S.G.; Hatch, D.M.; Jones, M.D.; Stokes, H.T.; Albers, R.C.; Wilkins, J.W. New mechanism for the α to ω martensitic transformation in pure titanium. Phys. Rev. Lett. 2003, 91, 025701. [Google Scholar] [CrossRef]
  21. Togo, A.; Tanaka, I. Evolution of crystal structures in metallic elements. Phys. Rev. B 2013, 87, 184104. [Google Scholar] [CrossRef]
  22. Ping, D.H. Review on ω phase in body–centered cubic metals and alloys. Acta Metall. Sin. 2014, 27, 1–11. [Google Scholar] [CrossRef]
  23. Natarajan, A.R.; Dolin, P.; Van der Ven, A. Crystallography, thermodynamics and phase transitions in refractory binary alloys. Acta Mater. 2020, 200, 171–186. [Google Scholar] [CrossRef]
  24. Zhang, P.; Chen, Y.; Xiao, W.; Ping, D.H.; Zhao, X. Twin structure of the lath martensite in low carbon steel. Prog. Nat. Sci. Mater. Int. 2016, 26, 169–172. [Google Scholar] [CrossRef]
  25. Liu, T.W.; Ping, D.H.; Ohmura, T.; Ohnuma, M. Electron diffraction analysis of quenched fe–c martensite. J. Mater. Sci. 2018, 53, 2976–2984. [Google Scholar] [CrossRef]
  26. Ping, D.H.; Geng, W.T. A popular metastable omega phase in body–centered cubic steels. Mater. Chem. Phys. 2013, 139, 830. [Google Scholar] [CrossRef]
  27. Ping, D.H. Understanding solid–solid (fcc → ω + bcc) transition at atomic scale. Acta Metall. Sin. 2015, 28, 663. [Google Scholar] [CrossRef]
  28. Song, Y.; Cui, J.; Rong, L. In situ heating TEM observations of a novel microstructure evolution in a low carbon martensitic stainless steel. Mater. Chem. Phys. 2015, 165, 103–107. [Google Scholar] [CrossRef]
  29. Li, S.J.; Hu, G.J.; Jing, B.; Zhao, Q.; Su, S.L.; He, M.Y.; Wei, Z.Y.; Tian, Y.; Wang, C.D.; Ping, D.H. Dependence of {112}<111>–type twin density on carbon content in Fe–C martensite. J. Mater. Res. Technol. 2022, 18, 5045. [Google Scholar] [CrossRef]
  30. Ping, D.H.; Singh, A.; Guo, S.Q.; Ohmura, T.; Ohnuma, M.; Abe, T.; Onodera, H. A simple method for observing ω–Fe electron diffraction spots from < 112> α–Fe directions of quenched Fe–C twinned martensite. ISIJ Int. 2018, 58, 159–164. [Google Scholar]
  31. Silcock, J.M. An X–ray examination of the omegaphase in TiV, TiMo and TiCr alloys. Acta Metall. 1958, 6, 481–493. [Google Scholar] [CrossRef]
  32. Sass, S.L. Omega phase in a Zr–25 at.% Ti alloy. Acta Metall. 1969, 17, 813–820. [Google Scholar] [CrossRef]
  33. De Fontaine, D. Mechanical instabilities in the B.C.C. lattice and the beta to omega phase transformation. Acta Metall. 1970, 18, 275–279. [Google Scholar] [CrossRef]
  34. Ikeda, Y.; Tanaka, I. Stability of the ω structure of transition elements. Phys. Rev. B 2016, 93, 094108. [Google Scholar] [CrossRef]
  35. Ikeda, Y.; Tanaka, I. ω structure in steel: A first-principles study. J. Alloy. Comp. 2016, 684, 624–627. [Google Scholar] [CrossRef]
  36. Devi, A.A.S.; Pallaspuro, S.; Cao, W.; Somani, M.; Alatalo, M.; Huttula, M.; Kömi, J. Density functional theory study of ω phase in steel with varied alloying elements. Int. J. Quantum. Chem. 2020, 120, e26223. [Google Scholar] [CrossRef]
  37. Bahrami, F.; Hendry, A. Microstructure and mechanical–behavior of nitrogen alloyed martensitic stainless steel. Mater. Sci. Technol. 1995, 11, 488–497. [Google Scholar] [CrossRef]
  38. Gavriljuk, V.G.; Berns, H. High Nitrogen Steels; Springer: Berlin/Heidelberg, Germany, 1999; p. 1. [Google Scholar]
  39. Toro, A.; Misiolek, W.Z.; Tschiptschin, A.P. Correlations between microstructure and surface properties in a high nitrogen martensitic stainless steel. Acta Mater. 2003, 51, 3363–3374. [Google Scholar] [CrossRef]
  40. Mola, J.; De Cooman, B.C. Quenching and partitioning (Q&P) processing of martensitic stainless steels. Metal Mater. Trans. A 2013, 44, 946–967. [Google Scholar]
  41. Böttger, A.; Van Genderen, M.J.; Sijbrandij, S.J.; Mittemeijer, E.J.; Smith, G.D.W. Atom–probe and X–ray diffraction analysis of the composition and structure of precipitates formed on tempering of ternary iron–carbon–nitrogen martensites. ISIJ Int. 1996, 36, 764–767. [Google Scholar] [CrossRef]
  42. Ping, D.H.; Xiang, H.P. Simulated electron diffraction patterns of ω–Fe in Fe–C martensite. J. Appl. Phys. 2019, 125, 045105. [Google Scholar] [CrossRef]
  43. Zhou, Y.; Zhang, W.; Zhong, L.; Nie, X.; Wang, D. Electronic structure of fcc iron in metastable magnetic phases. J. Magn. Magn. Mater. 1997, 167, 136–148. [Google Scholar] [CrossRef]
  44. Kresse, G.; Furthmuller, J. Efficient iterative schemes for ab initio total–energy calculations using a plane–wave basis set. Phys. Rev. B 1996, 54, 11169–11186. [Google Scholar] [CrossRef] [PubMed]
  45. Perdew, J.P.; Burke, K.; Ernzerhof, M. Generalized gradient approximation made simple. Phys. Rev. Lett. 1996, 77, 3865–3868. [Google Scholar] [CrossRef]
  46. Blöchl, P.E. Projector augmented–wave method. Phys. Rev. B 1994, 50, 17953–17979. [Google Scholar] [CrossRef]
  47. Kresse, G.; Joubert, D. From ultrasoft pseudopotentials to the projector augmented–wave method. Phys. Rev. B 1999, 59, 1758–1775. [Google Scholar] [CrossRef]
  48. Methfessel, M.; Paxton, A.T. High–precision sampling for brillouin–zone integration in metals. Phys. Rev. B 1989, 40, 3616–3621. [Google Scholar] [CrossRef] [PubMed]
  49. Wojciechowski, P.; Lewandowski, M. Iron nitride thin films: Growth, structure, and properties. Crys. Growth Des. 2022, 22, 4618–4639. [Google Scholar] [CrossRef]
  50. Togo, A.; Tanaka, I. First principles phonon calculations in materials science. Scr. Mater. 2015, 108, 1–5. [Google Scholar] [CrossRef]
  51. Togo, A.; Oba, F.; Tanaka, I. First–principles calculations of the ferroelastic transition between rutile–type and CaCl2–type SiO2 at high pressures. Phys. Rev. B 2008, 78, 134106. [Google Scholar] [CrossRef]
  52. Cerny, M.; Pokluda, J.; Sob, M.; Friák, M.; Sandera, P. Ab initio calculations of elastic and magnetic properties of Fe, Co, Ni, and Cr crystals under isotropic deformation. Phys. Rev. B 2003, 67, 035116. [Google Scholar] [CrossRef]
  53. Eisenbach, M.; Nicholson, D.M.; Rusanu, A.; Brown, G. First principles calculation of finite temperature magnetism in Fe and Fe3C. J. Appl. Phys. 2011, 109, 07E138. [Google Scholar] [CrossRef]
  54. Soulairol, R.; Fu, C.C.; Barreteau, C. Structure and magnetism of bulk Fe and Cr: From plane waves to LCAO methods. J. Phys. Condens. Matter. 2010, 22, 295502. [Google Scholar] [CrossRef] [PubMed]
  55. Filho, M.A.M.; Hsiao, C.L.; Santos, R.B.; Hultman, L.; Birch, J.; Gueorguiev, G.K. Self-induced core–shell InAlN nanorods: Formation and stability unraveled by ab initio simulations. ACS Nanosci. Au. 2023, 3, 84–93. [Google Scholar] [CrossRef] [PubMed]
  56. Filho, M.A.M.; Farmer, W.; Hsiao, C.L.; Santos, R.B.; Hultman, L.; Birch, J.; Ankit, K.; Gueorguiev, G.K. Density functional theory-fed phase field model for semiconductor nanostructures: The case of self-induced core–shell InAlN nanorods. Cryst. Growth Des. 2024, 24, 4717–4727. [Google Scholar] [CrossRef] [PubMed]
Figure 1. Crystal structures of pure and N-atom doping of ω–Fe, α–Fe, and γ–Fe. Here, we constructed new unit cells for γ–Fe and α–Fe which have three Fe atoms in one unit cell, the same as ω–Fe. Blue and green balls represent the two sites of Fe atoms, i.e., Fe1 inside the unit cell and Fe2 at the vertex, and the purple ball is the N atom.
Metals 15 00098 g001
Figure 2. Calculated phonon dispersion relations of ω–Fe, α–Fe, and γ–Fe in non-magnetic (NM), ferromagnetic (FM), and ferrimagnetic (FIM) states, with imaginary frequencies shown in negative values.
Metals 15 00098 g002
Figure 3. The fully relaxed crystal structures of ω/α/γ–Fe3N, ω/α–Fe3N2, and ω/α/γ–FeN in ferromagnetic (FM) state and γ–FeN in ferrimagnetic (FIM) state. ω–Fe3N2 and ω–FeN in FM have the same structures as in α–Fe3N2 and α–FeN.
Metals 15 00098 g003
Figure 4. Calculated phonon dispersion relations of ω/α/γ–Fe3N, ω–Fe3N2, and ω/γ–FeN in ferromagnetic (FM) state and γ–FeN in ferrimagnetic (FIM) state, with imaginary frequencies shown in negative values.
Metals 15 00098 g004
Figure 5. The partial densities-of-states (PDOSs) of Fe1 3d (green), Fe2 3d (blue), and N 2p (purple) orbitals for ω/α/γ–Fe3N, ω–Fe3N2, and ω/γ–FeN in ferromagnetic (FM) state and γ–FeN in ferrimagnetic (FIM) state, with the spin-up and spin-down electrons given to the up and down in each frame. The energy at zero indicates the Fermi energy level.
Metals 15 00098 g005
Table 1. The calculated total energies ΔE/f.u. (meV), lattice parameters (Å), volume (Å3), and magnetic moments (μB) of Fe1 (µFe1) and Fe2 (µFe2) for ω–Fe, α–Fe, and γ–Fe in non-magnetic (NM), ferromagnetic (FM), and ferrimagnetic (FIM) states. The total energies are relative to the most stable phase of FM α–Fe.
ω–Fe α–Fe γ–Fe
NMFMFIMNMFMFIMNMFMFIM
ΔE76259452214220531486444369
α909090909090107107106
β909090909090107107106
γ120120120120120120484950
a3.854.183.973.894.004.014.224.434.31
b3.854.183.973.894.004.014.224.434.31
c2.422.372.402.382.452.402.432.582.41
V31.1136.0532.8031.3934.0633.5030.6935.9932.49
µFe12.591.662.191.922.601.57
µFe22.47−1.592.19−1.952.60−1.79
Table 2. The calculated formation energies ΔHf (eV), lattice parameters (Å), volume (Å3), and bond lengths (Å) of Fe1–Fe2 and Fe2–Fe2, and atomic magnetic moments (µB) of Fe1 (µFe1), Fe2 (µFe2), and N (µN) of ω/α/γ–Fe3N, ω/α/γ–Fe3N2, and ω/α/γ–FeN in non-magnetic (NM), ferromagnetic (FM), and ferrimagnetic (FIM) states.
ω–Fe3N ω–Fe3N2 ω–FeN
NMFMFIMNMFMFIMNMFMFIM
ΔHf0.950.180.532.001.201.275.694.474.73
α909090909090909090
β909090909090909090
γ125124127127127128120120120
a4.144.254.395.025.085.104.714.944.95
b4.144.254.394.184.174.174.714.944.95
c2.822.762.692.642.822.842.732.662.61
V39.4741.4841.7044.4947.5647.9452.7556.3555.56
µFe11.951.941.902.191.740.88
µFe22.38−2.372.35−2.393.09−3.11
µN−0.04−0.010.030.040.05−0.02
α–Fe3N α–Fe3N2 α–FeN
NMFMFIMNMFMFIMNMFMFIM
ΔHf0.740.060.062.001.201.275.694.474.68
α105102103909090909090
β105103103909090909090
γ485050127127128120120120
a4.514.484.484.184.174.174.714.944.92
b4.514.484.485.025.085.104.714.944.92
c2.542.672.672.642.822.842.742.662.71
V37.1940.1940.1944.4947.5647.9452.7556.3457.00
µFe12.052.051.902.191.742.01
µFe22.082.082.35−2.393.09−3.07
µN−0.05−0.050.030.040.050.01
γ–Fe3N γ–Fe3N2 γ–FeN
NMFMFIMNMFMFIMNMFMFIM
ΔHf0.65−0.040.244.714.04
α1061071069090
β1061071069090
γ4848474041
a4.564.604.665.505.57
b4.564.604.665.505.57
c2.552.682.652.642.70
V37.4540.4340.4151.8255.24
µFe12.112.042.21
µFe21.99−2.03−2.51
µN−0.05−0.0030
Disclaimer/Publisher’s Note: The statements, opinions and data contained in all publications are solely those of the individual author(s) and contributor(s) and not of MDPI and/or the editor(s). MDPI and/or the editor(s) disclaim responsibility for any injury to people or property resulting from any ideas, methods, instructions or products referred to in the content.

