Article

The Influence of Process Parameters on the Density, Microstructure, and Mechanical Properties of TA15 Titanium Alloy Fabricated by Selective Laser Melting

1
Henan Provincial Key Laboratory of Intelligent Manufacturing of Mechanical Equipment, Zhengzhou University of Light Industry, Zhengzhou 450002, China
2
Zhengzhou RuiFei Biotechnology Co., Ltd., Zhengzhou 450001, China
3
College of Engineering, Mathematics and Physical Sciences, University of Exeter, North Park Road, Exeter EX4 4QF, UK
*
Authors to whom correspondence should be addressed.
Metals 2025, 15(3), 233; https://doi.org/10.3390/met15030233
Submission received: 20 January 2025 / Revised: 17 February 2025 / Accepted: 19 February 2025 / Published: 21 February 2025

Abstract

:
With superior manufacturing freedom capability, Selective Laser Melting (SLM) technology is capable of fabricating high-strength Ti-6Al-2Zr-1Mo-1V (TA15) complex titanium alloy parts, thereby finding extensive applications in the aerospace sector. This paper primarily investigates the influence of process parameters on the relative density, microstructure, and mechanical properties of SLMed TA15 under conditions of similar laser linear energy density. The results indicate that the laser linear energy density significantly affects the single-track morphology of SLMed TA15; excessive energy density leads to keyhole defects, while insufficient energy density causes balling phenomena, resulting in discontinuous clad tracks. When the laser linear energy density is appropriate, the scanning spacing affects the forming density of the parts, with both excessively large and small spacings having adverse effects. With a fixed scanning spacing of 100 μm, high-density samples can be produced within a suitable range of linear energy density. However, when the laser linear energy density is comparable, a lower scanning speed leads to heat accumulation, causing in situ decomposition of the α’ martensite and the formation of coarser α + β phases, which reduces strength and hardness but improves plasticity. At a laser power of 90 W, a scanning speed of 400 mm/s, and a scanning spacing of 100 μm, the specimen exhibits a tensile strength of 1233 MPa and an elongation of 8.4%, achieving relatively excellent comprehensive properties.

1. Introduction

Titanium alloys are extensively applied in aerospace, automotive, chemical, medical, and other fields as they have low density, high specific strength, high thermal strength, extraordinary corrosion resistance, and excellent biocompatibility. Capable of sustained operation at 500 °C for up to 3000 h, the TA15 titanium alloy is a near-α titanium alloy with a maximum short-term operating temperature of 800 °C for up to 5 min. Its primary applications include large integral parts, load-bearing structures, and welded components for aircraft, missiles, launch vehicles, and satellites [1,2]. The traditional processing methods for TA15 structural components mainly include casting, forging, and mechanical processing [1,3,4]. Substantial challenges in the processing and manufacturing of the TA15 alloy arise from its high reactivity, low thermal conductivity, and considerable deformation resistance [5]. One of the primary methods for metal additive manufacturing is SLM technology, which overcomes the drawbacks of traditional technologies by fully melting the metal powder with excellent forming precision and manufacturing flexibility.
In recent years, several studies have begun to investigate the SLMed TA15 alloy. Wu et al. [6] prepared TA15 samples using SLM and found that the room-temperature and high-temperature tensile properties of the TA15 samples were visibly higher than those of TA15 fabricated by conventional manufacturing techniques and of other near-α titanium alloys, due to the effect of refined α’ martensitic grains and nanoscale twins. The author conducted preliminary research on the mechanical properties and microstructure evolution of the SLMed TA15 alloy before and after annealing and found that the annealed TA15 sample inherited a martensitic hierarchical structure and precipitated nanoscale-sized β phase. In addition, the samples before and after annealing exhibited weak textures, resulting in inconspicuous anisotropy of mechanical properties [7]. Huang et al. [8] also studied the influence of heat treatment on SLMed TA15 and found that, with the increase in heat-treatment temperature, the martensitic structure of the morphologically formed TA15 sample gradually transformed into an α + β structure, and the tensile properties decreased while the plasticity increased. Cai et al. [9] studied the influence of changes in laser power and scanning speed on the microstructure and mechanical properties of TA15 formed by SLM under fixed scanning spacing. The research results showed that different process parameters would affect the relative density of the TA15 alloy, thereby affecting its mechanical properties. In addition, the author conducted a preliminary study on the influence of process parameters and scanning strategies on the surface quality of SLMed TA15 parts [10]. Yin et al. [11] investigated the effects of dual shot peening on the residual stress and microstructure of SLMed TA15 alloys and analyzed the thermal relaxation behavior post-peening. Wei et al. [12,13] studied the differences in the performance of TA15 formed by SLM and Laser Metal Deposition (LMD). The study found that the microstructure of the SLMed sample was α’ martensite, which is isotropic, while the microstructure of the LMDed sample was α + β basket-weave microstructure and anisotropic. At the same time, the SLMed sample presented higher tensile strength and lower plasticity.
Evident from the studies above is the fact that current research on SLMed TA15 predominantly focuses on the microstructural and mechanical properties following forming and post-heat treatment, with limited investigations into the effects of process parameter variations on TA15 properties. It is well known that modifying process parameters to increase the forming density of titanium alloys is a mainly effective strategy, based on studies of SLMed titanium alloys [14,15,16,17,18]. For instance, Wei et al. [19] analyzed the quality of single-track formations and, considering forming efficiency, selected continuous clad tracks free from balling, warping, and defects. They then achieved a Ti-5Al-2Sn bulk with a density of 99.95% by choosing an appropriate scanning spacing. Zhou et al. [14] fixed the scanning spacing and varied the laser power and scanning speed to obtain Ti-13Nb-13Zr titanium alloy parts with the highest density. Similar methodologies have been reported in references [14,18]. Additionally, Sun et al. [15] and Khorasani et al. [16] employed the Taguchi method to determine the SLM process parameters for Ti6Al4V that yield the optimal density. These studies reveal that, under the premise of consistent single-track formation quality, dense entities can be formed by matching the appropriate scanning spacing. However, the influence of the laser power, scanning speed, and scanning spacing on formability is not consistent. Regrettably, scant research has focused on the impact of changing process parameters on the microstructure and properties of SLMed specimens under consistent single-track formation quality. This study concentrates its focus precisely on this aspect.
Therefore, this study aims to analyze the influence of SLMed process parameters on the single-track morphology and the characteristic size of the TA15 alloy, reveal the single-track-forming mechanism, and determine the optimization process interval for single-track-forming. The focus is on studying the effects of changes in scanning spacing and laser power scanning speed on the microstructure and mechanical properties of SLMed TA15 alloys under similar single-track-forming quality to achieve real-time control of the microstructure and properties of SLMed TA15 alloys during the processing by changing the process parameters.

2. Experimental Details

2.1. Powder Material

TA15 titanium alloy powder was provided by Beijing Zhonghang Maite Powder Metallurgy Technology Co., Ltd. (Beijing, China), and its chemical composition is listed in Table 1. The surface morphology and particle size distribution of the powder are shown in Figure 1. It can be observed that the TA15 powder exhibits good overall sphericity with smooth surfaces, although there are a small number of irregularly shaped powder particles and satellite particles present. It can be found from Figure 1b that the powder particle size presents a normal distribution, and the powder particle size is from 11.2 μm to 76 μm; the average size is 34.3 μm. Additionally, D10 and D90 are 20.4 μm and 55.7 μm, respectively.
The apparent density of the TA15 powder measured by the Hall flowmeter was 2.365 g/cm3, and the density of the TA15 alloy was 4.45 g/cm3 [20]; the loose specific weight calculated to 53.13%. The powder fluidity test showed that the average time for 50 g TA15 powder to flow through the standard funnel (aperture 2.5 mm) was 40.87 s. It is usually accepted that a liquidity evaluation is better if the repose angle is less than 30°, and the TA15 powder’s was 27°. It may be said that the experiment’s TA15 powder had high spreadability and fluidity. Figure 2 displays the result of the experiment.

2.2. SLM Experimental Platform

The SLM experimental platform used in this apparatus was EOSINT M280 (EOS GmbH, Krailling, Germany).

2.3. Experimental Characterization Method

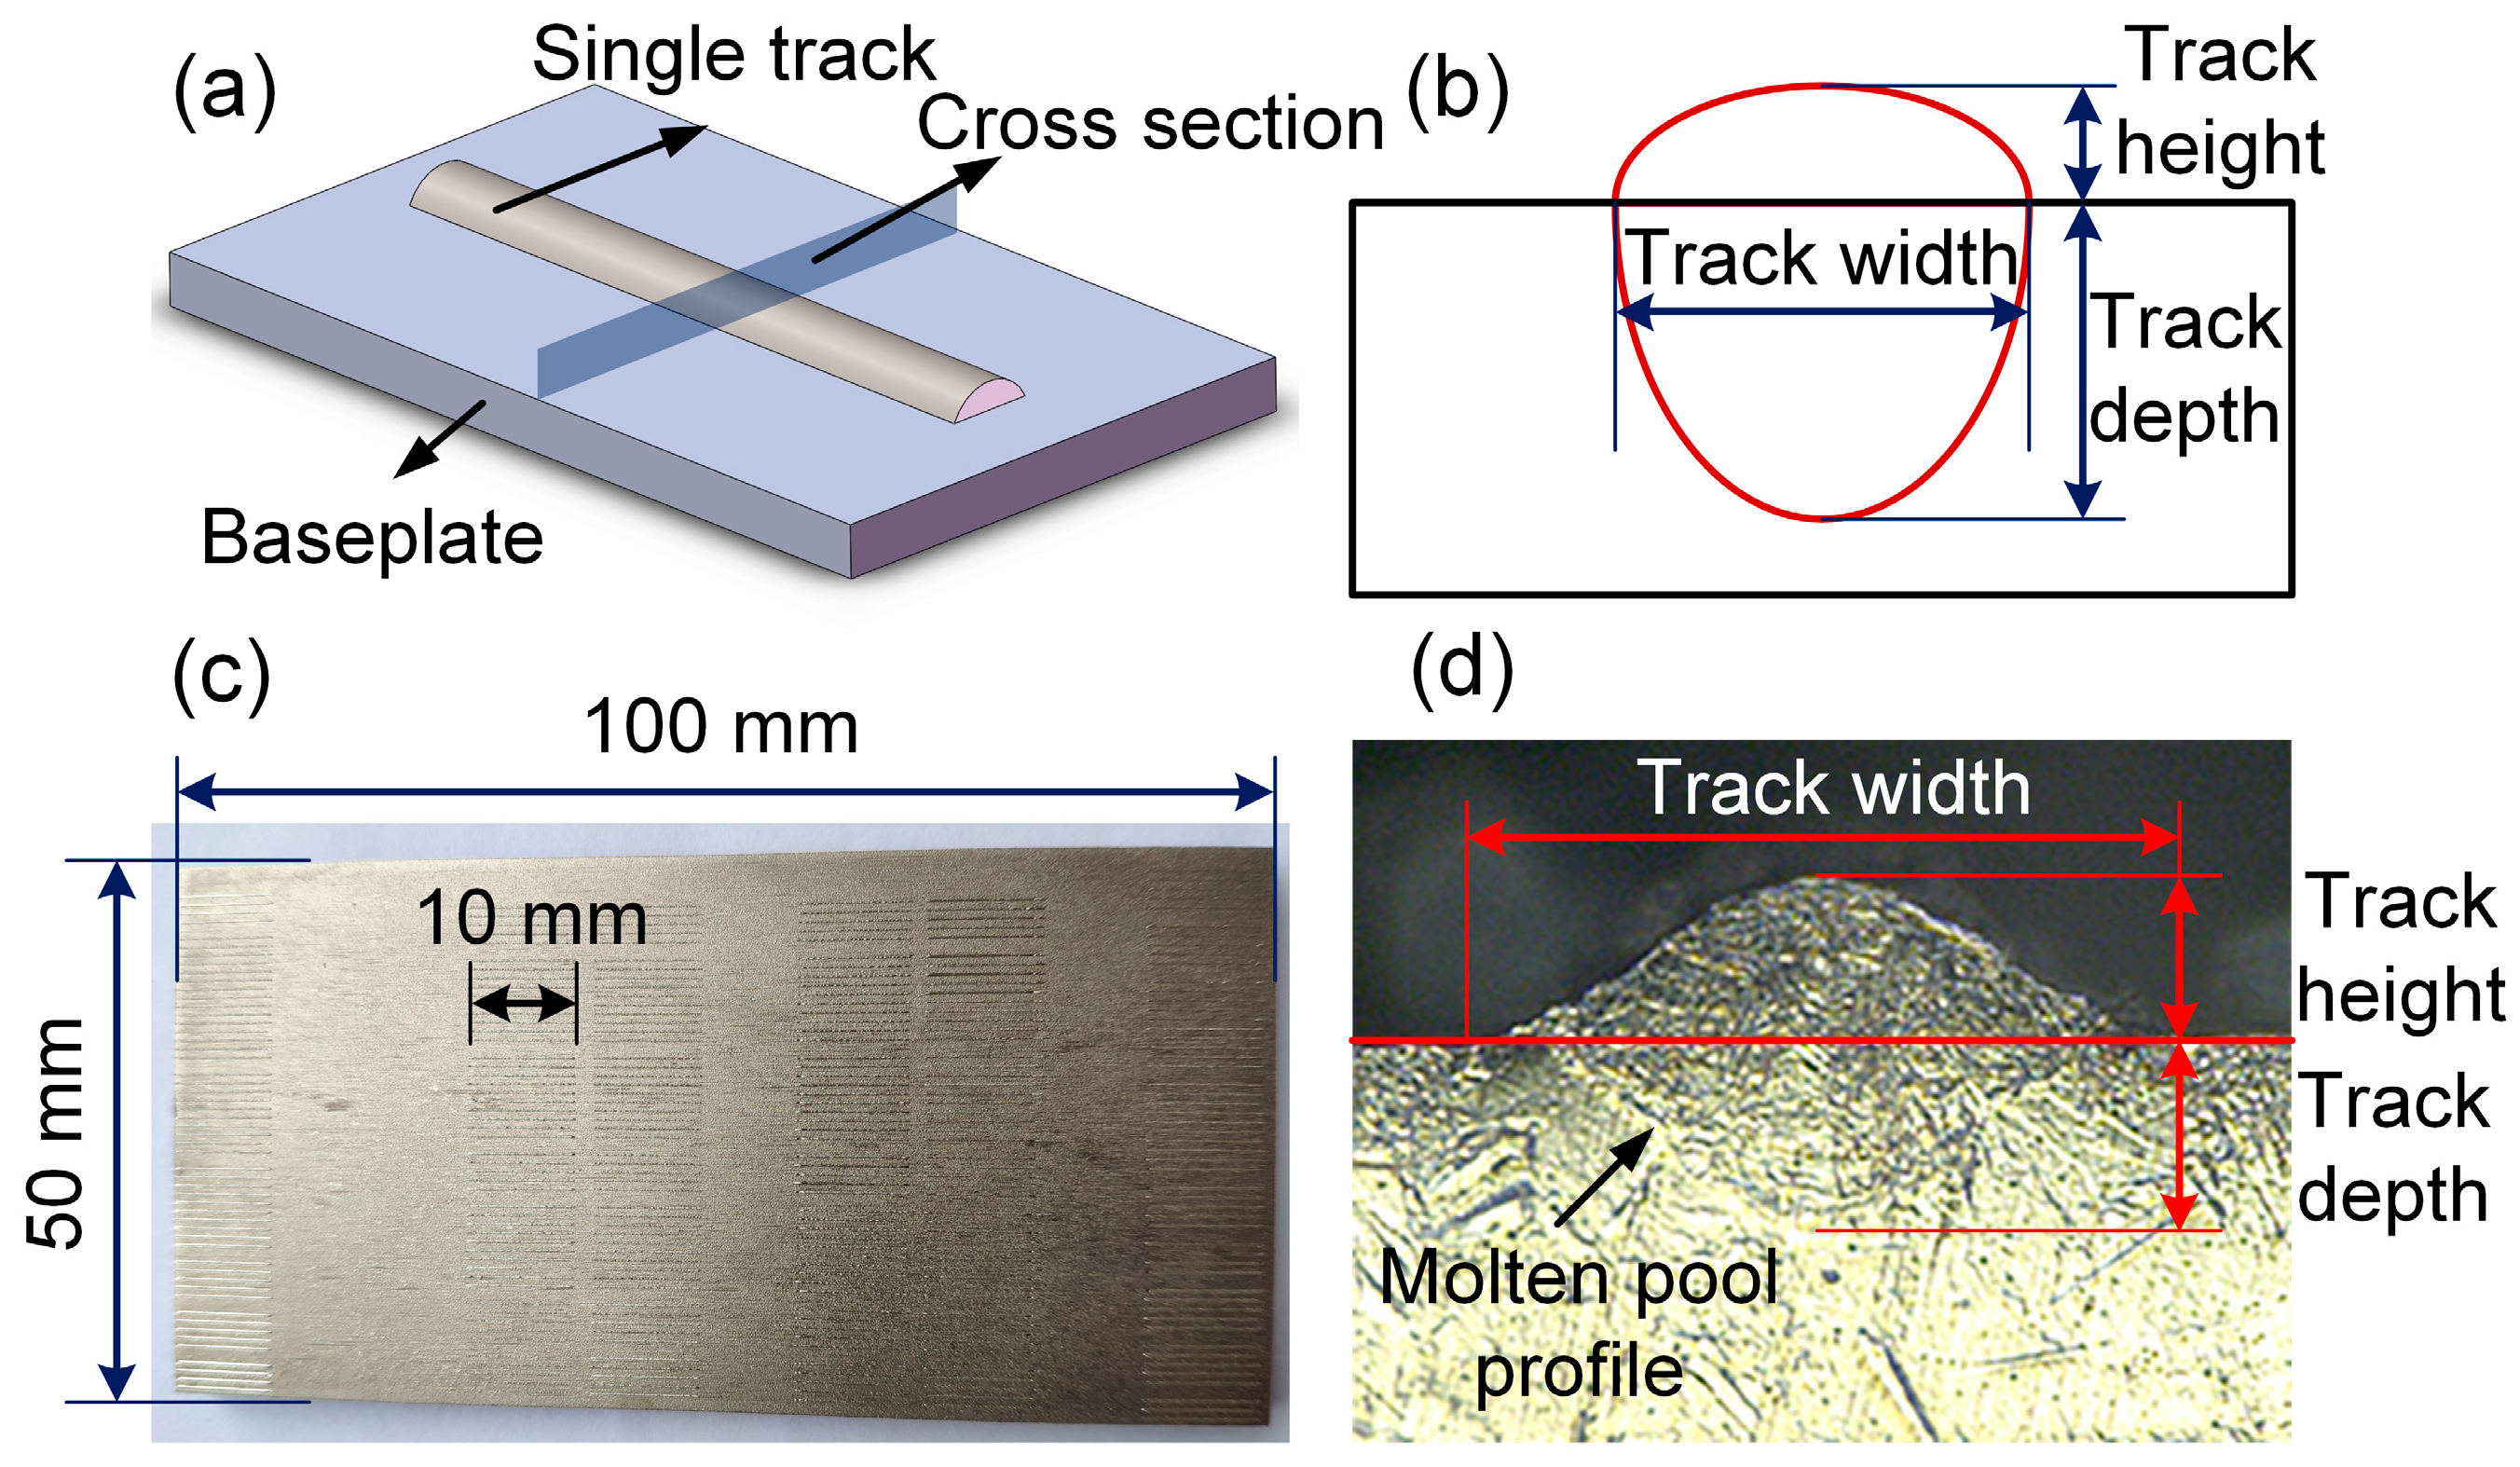
2.3.1. Surface Morphology Observation

A digital microscope (VHX-1000, Keyence (China) Co., Ltd., Shanghai, China) was used to examine the surface morphology of SLMed samples.

2.3.2. Single-Track Morphology Observation and Characteristic Size Testing

The schematic diagram of the SLMed single-track is shown in Figure 3a. The results of the single-track formation are depicted in Figure 3c. The single-track was formed on a TC4 titanium alloy baseplate with dimensions of 100 × 50 × 5 mm, and the length of each single-track was 10 mm. The macro morphology of a single-track was observed and photographed by VHX-1000. Then, a single longitudinal section was cut along the vertical direction, and the morphology of the molten pool was observed and photographed under the microscope. Digimizer was used to measure the width, height, depth, and other single-track characteristic sizes of the molten pool, as shown in Figure 3b. The characteristics of the melt pool are depicted in Figure 3d, wherein the boundary of the melt pool represents the microstructural demarcation between the TA15 single-track and the TC4 baseplate. To circumvent the impact of errors, three clad tracks were fabricated for each set of process parameters for the purpose of statistical measurement.

2.3.3. Relative Density Testing

We measured the density of SLMed parts using the Archimedes method. The measuring instrument was an electronic analytical balance with a density measurement component, model 2204, manufactured by Shanghai Zhuojing Electronic Technology Co., Ltd. (Shanghai, China). The calculation formula for sample density ρs is as follows:
ρ s = m 1 × ρ w m 1 m 2
where m1 is the mass of the sample in air, m2 is the mass of the sample in distilled water, and ρw is the density of distilled water in the measurement environment. The formula for calculating the relative density of the sample, θ, is as follows:
θ = ρ s ρ m t h
where ρmth represents the standard density of the sample. The standard density used in this study is the density of the rod used in the production of TA15 powder (4.451 g/cm3).

2.3.4. Microstructure Characterization Methods

  • Observation of microstructure
Following electropolishing, the metallographic structure was corroded with Kroll’s reagent, which is composed of 3% HF + 6% HNO3 + 91% H2O. It takes 30 to 40 s for rust to occur. During the process, a magnetic stirrer was used to stir the corrosion solution. We used the VHX-1000 to examine and take pictures of the corroded sample.
2.
EBSD analysis
The EBSD experiment was carried out using a field emission scanning electron microscope (FESEM) (JSM-7800F, JEOL Co., Ltd., Tokyo, Japan). The acceleration voltage was set at 20 kV with a scanning area of approximately 40 × 40 μm2 and a scanning step size of 0.2 μm. Using HKL Channel 5, we proceeded with data analysis after completing data collection.

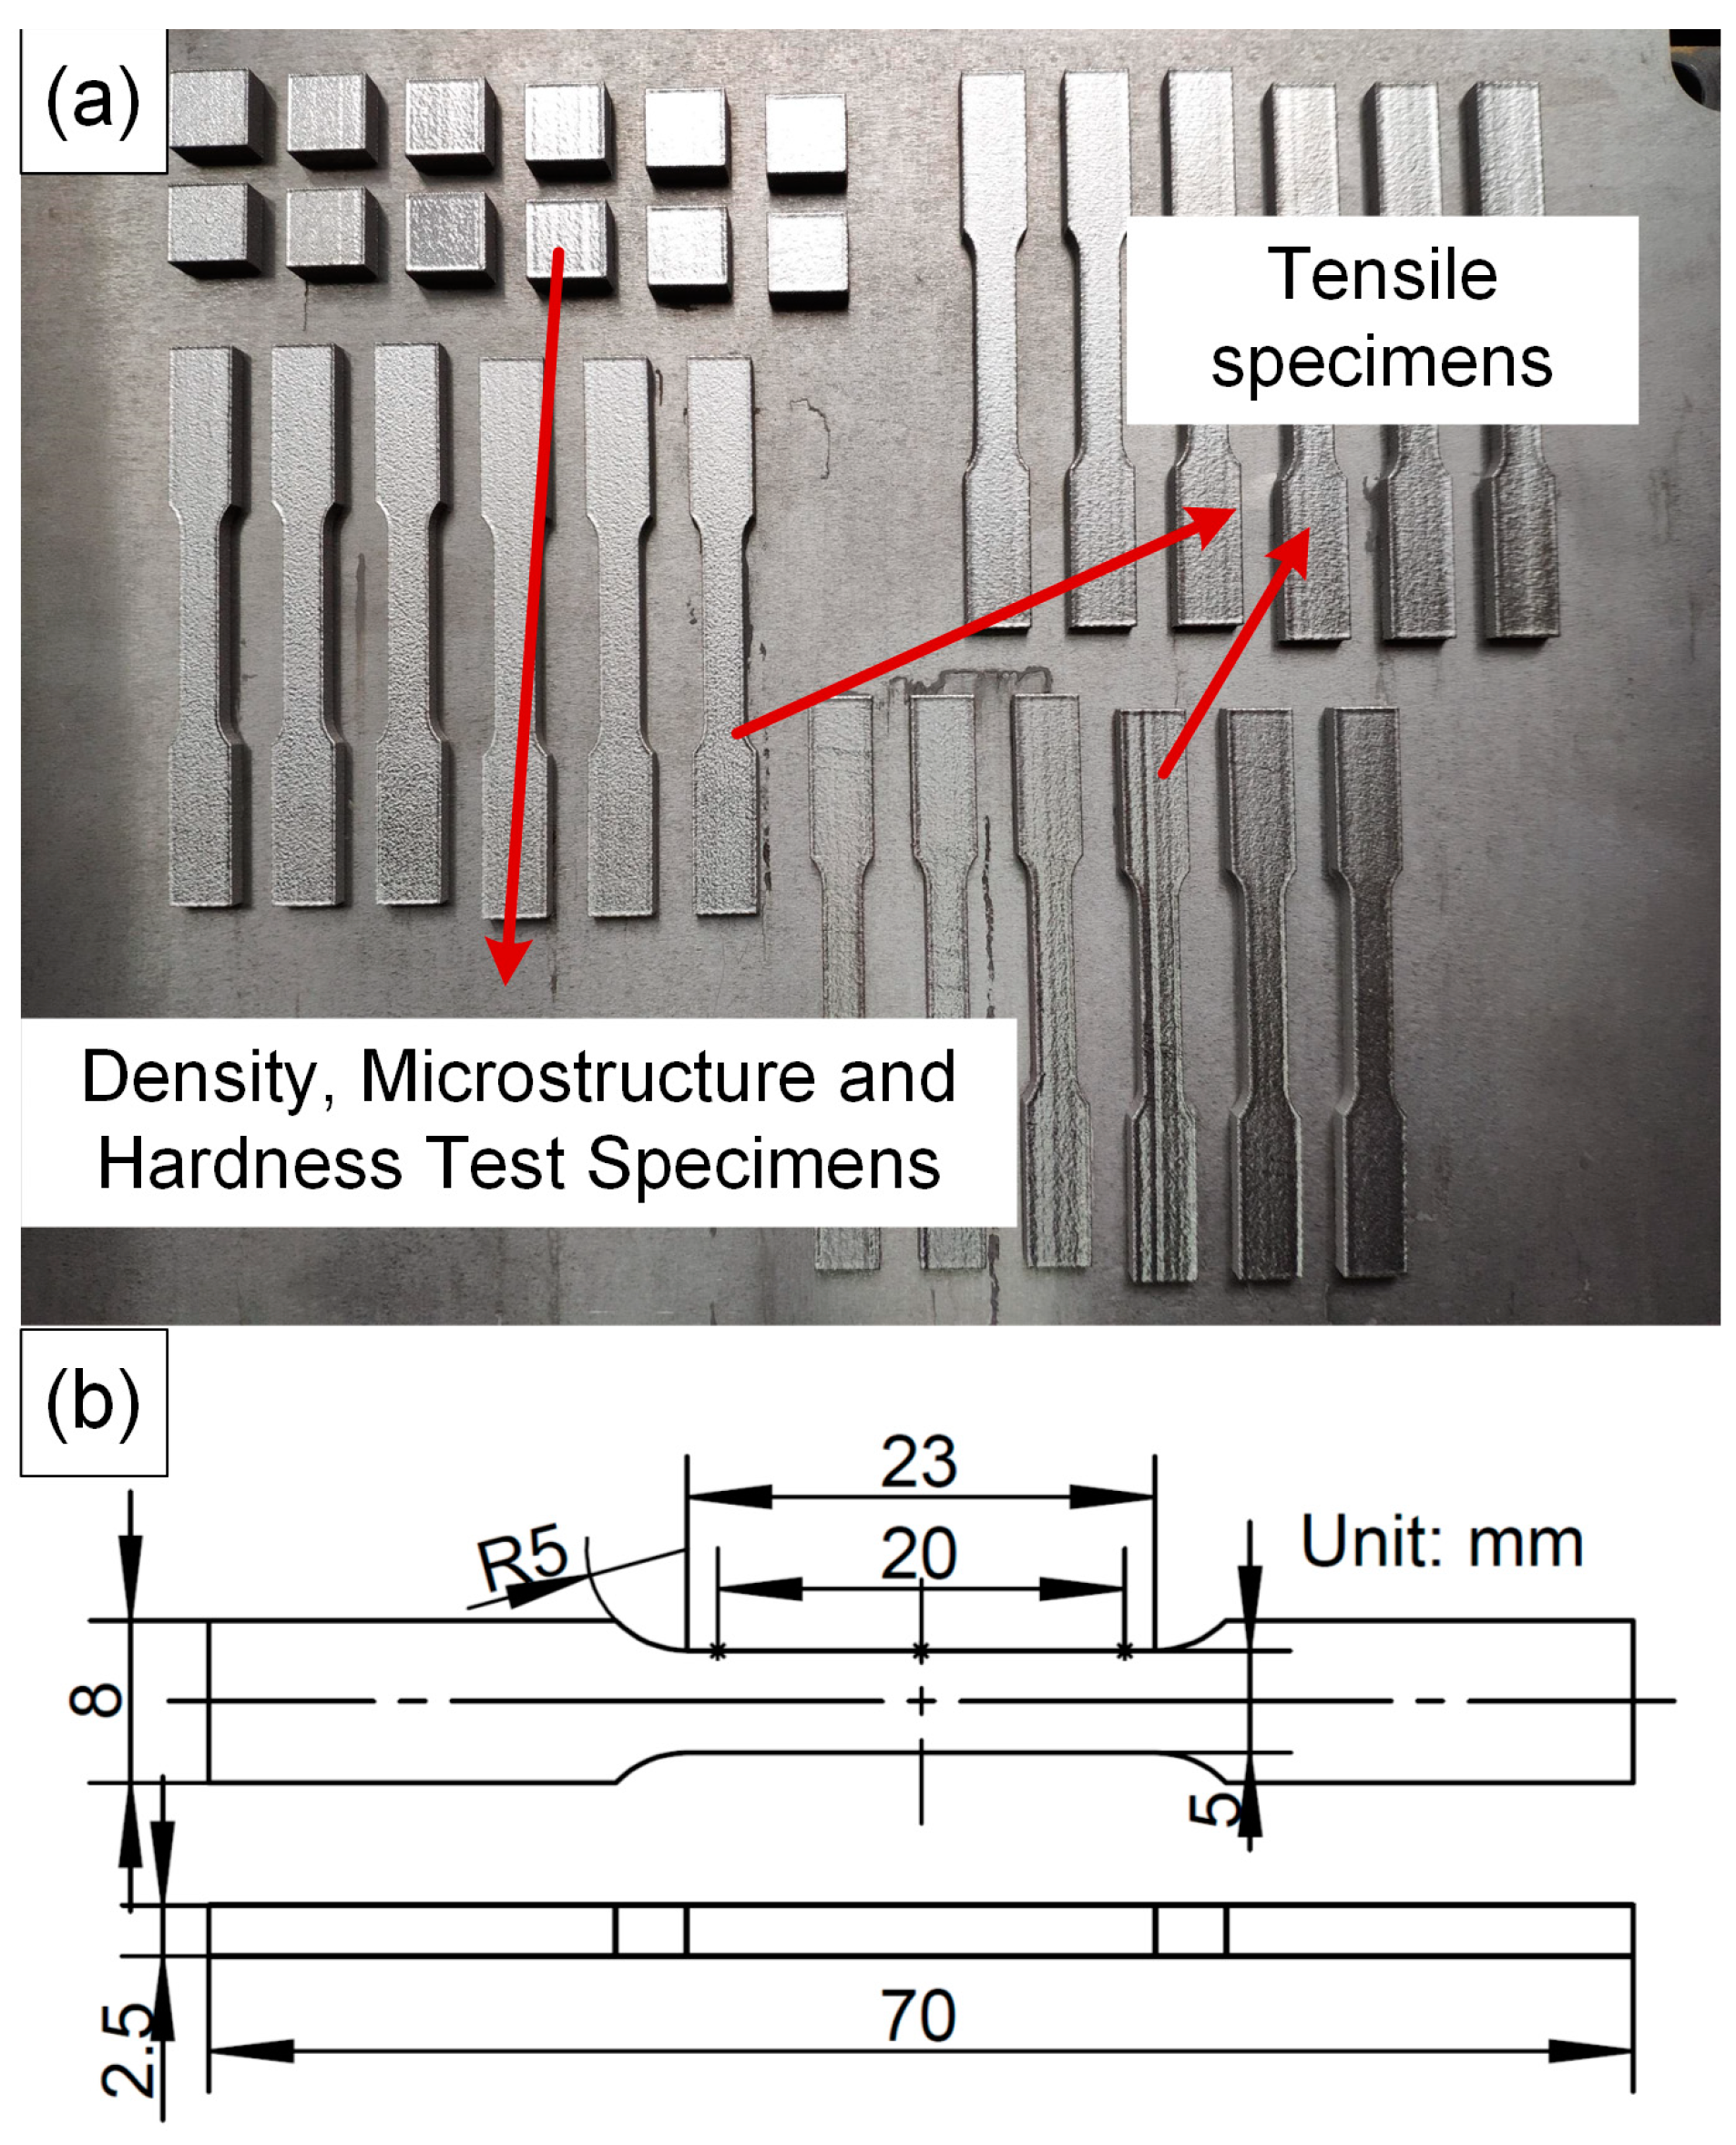
2.3.5. Mechanical Performance Characterization Methods

  • Hardness test
The dimensions of the hardness test specimen were 10 × 10 × 5 mm, as shown in Figure 4a. The surface for hardness testing was the polished top face of the specimen. The hardness test was performed on a Vickers hardness tester (310HVS-5, Laizhou Huayin Testing Instrument Co., Ltd., Laizhou, China). Every sample was tested at least ten times, with a test load of 9.807 N and a loading time of 15 s. The average value was obtained by subtracting the greatest and lowest values.
2.
Tensile test
Figure 4 displays the finished photograph of the tensile specimen and its dimensions. The dimensions of the tensile components used in this experiment were designed by the standard GB/T 228.1-2010 [21]. The tensile specimens were polished to a smooth finish prior to tensile testing to avoid the influence of surface defects. The tensile test adopted an electronic universal testing machine (SANS CMT5105, MTS Co., Ltd., Eden Prairie, MN, USA), with a tensile rate of 1 mm/min. Each sample underwent three tensile tests. The observation of the fracture morphology of the tensile specimen was performed on a ESEM (MIRA3, TESCAN Co., Ltd., Brno, Czech Republic).

3. Results and Analysis

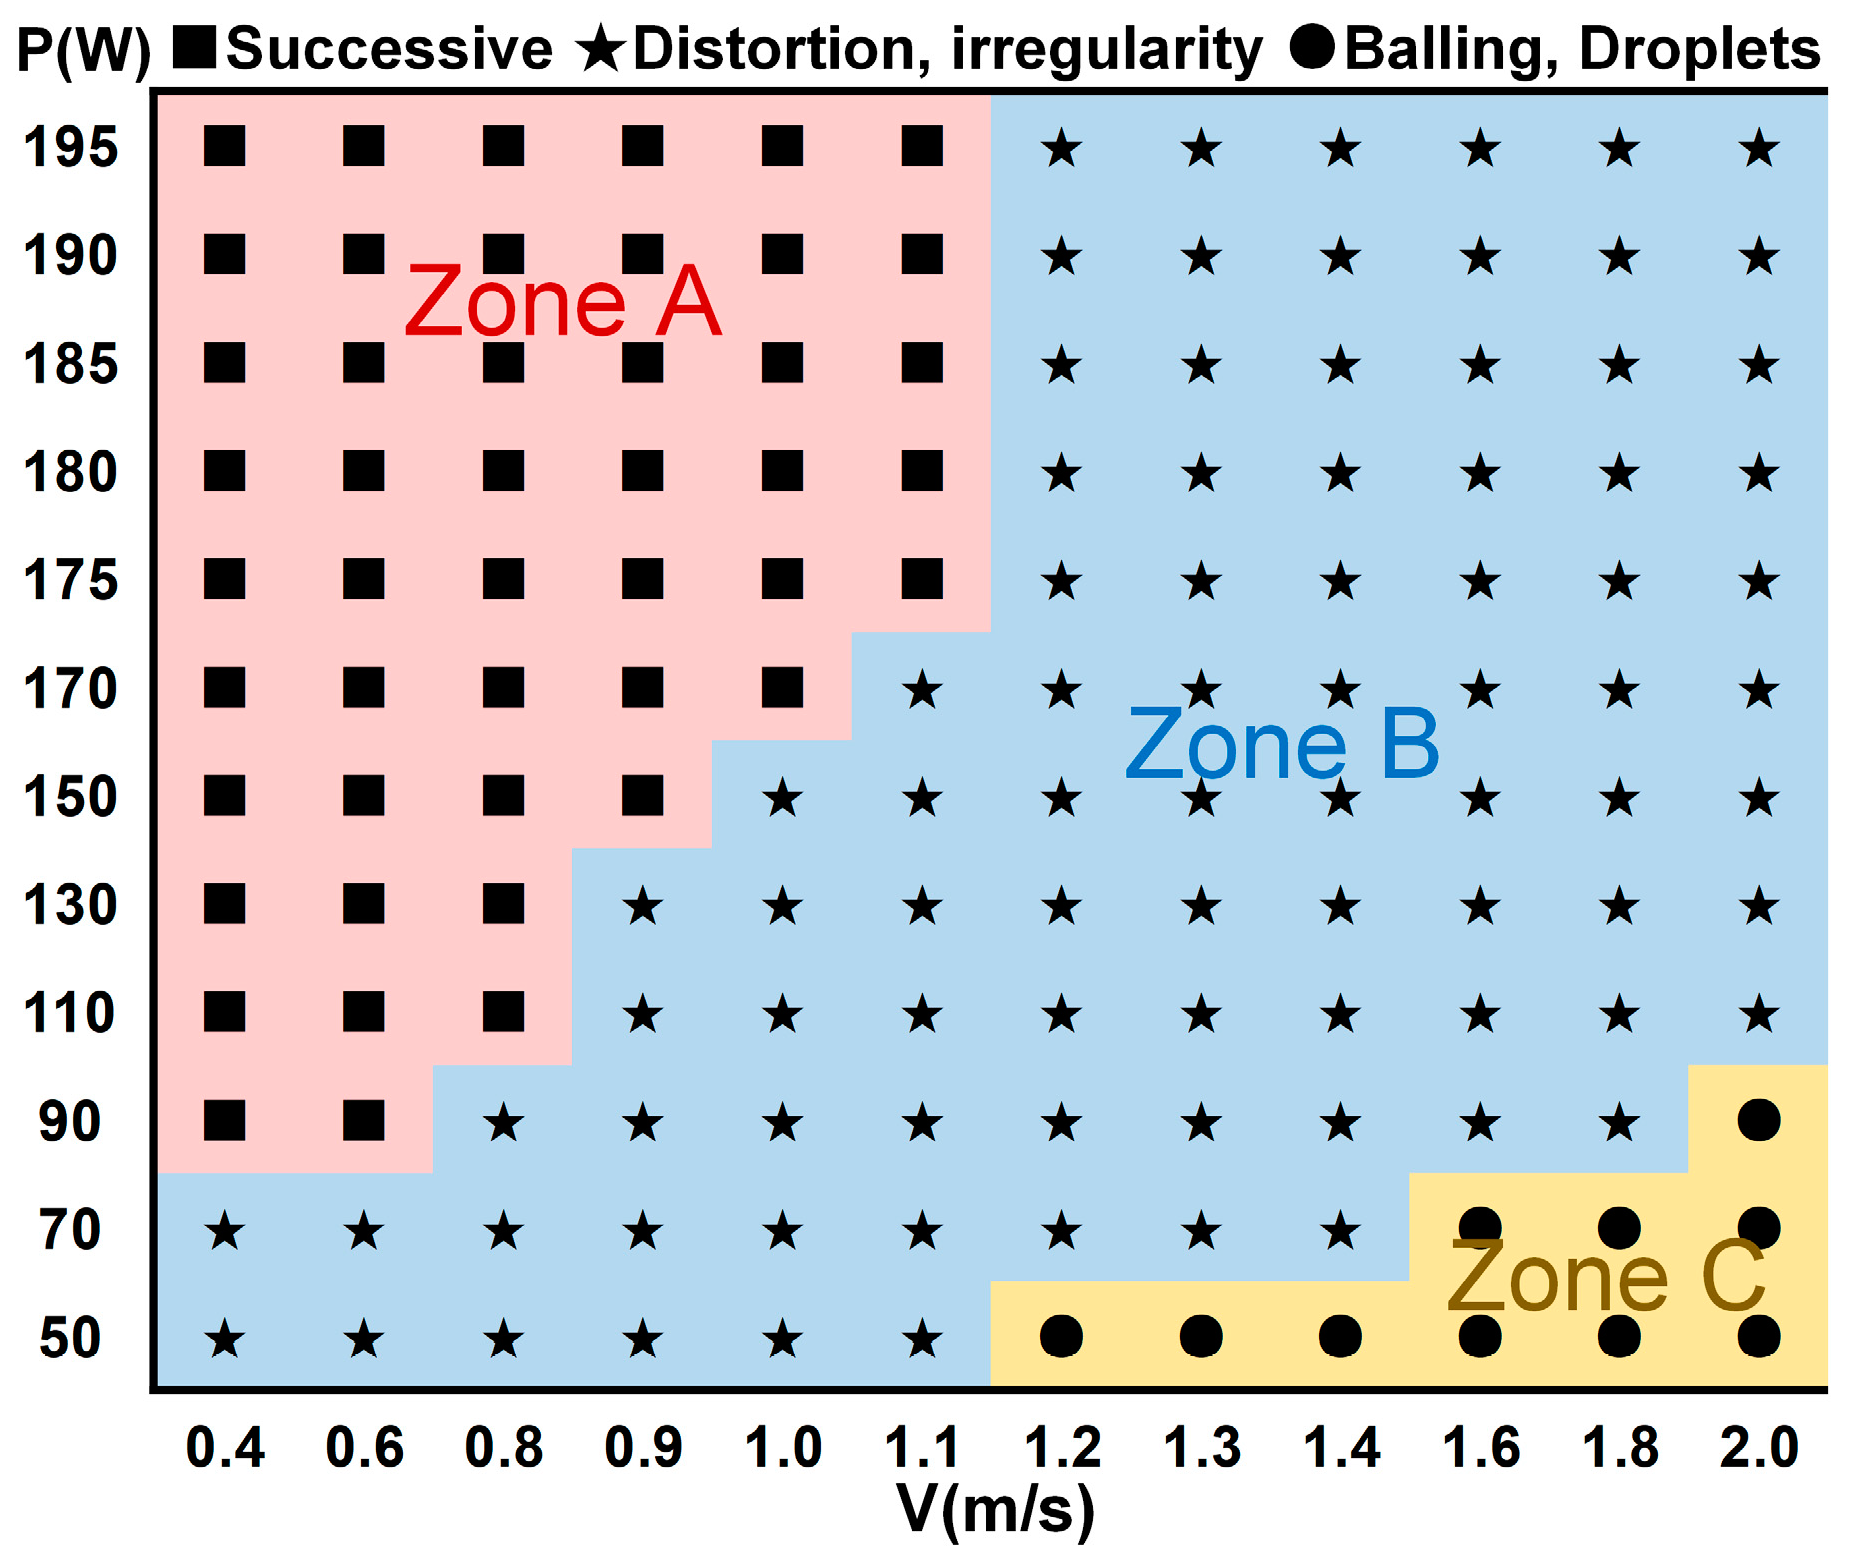
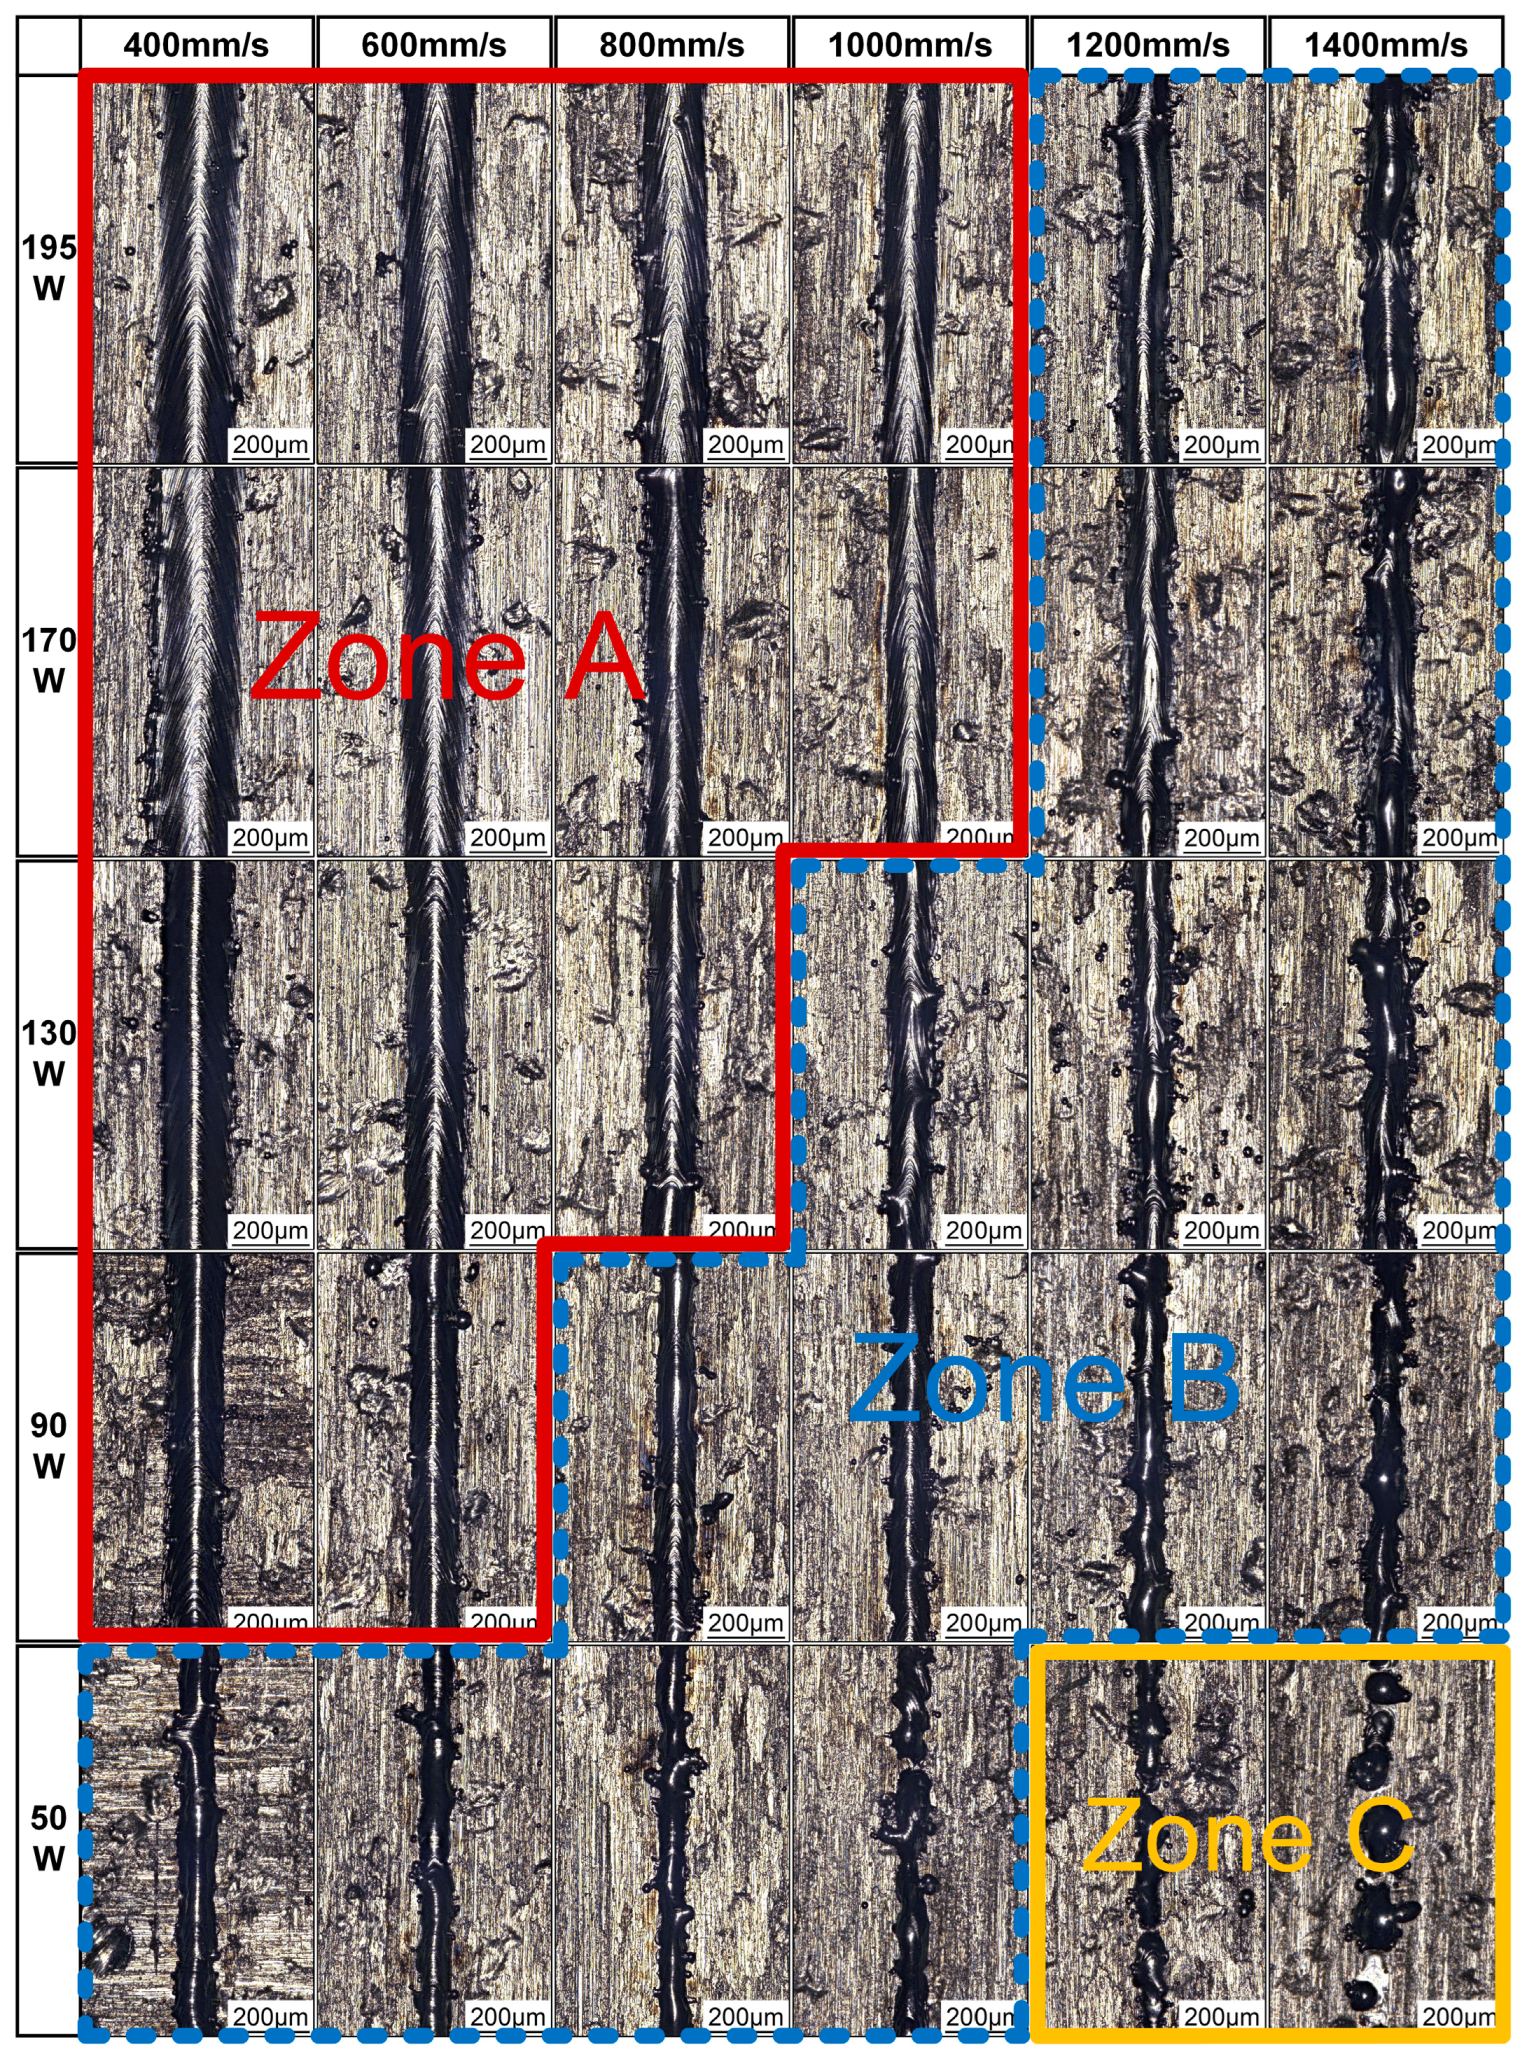
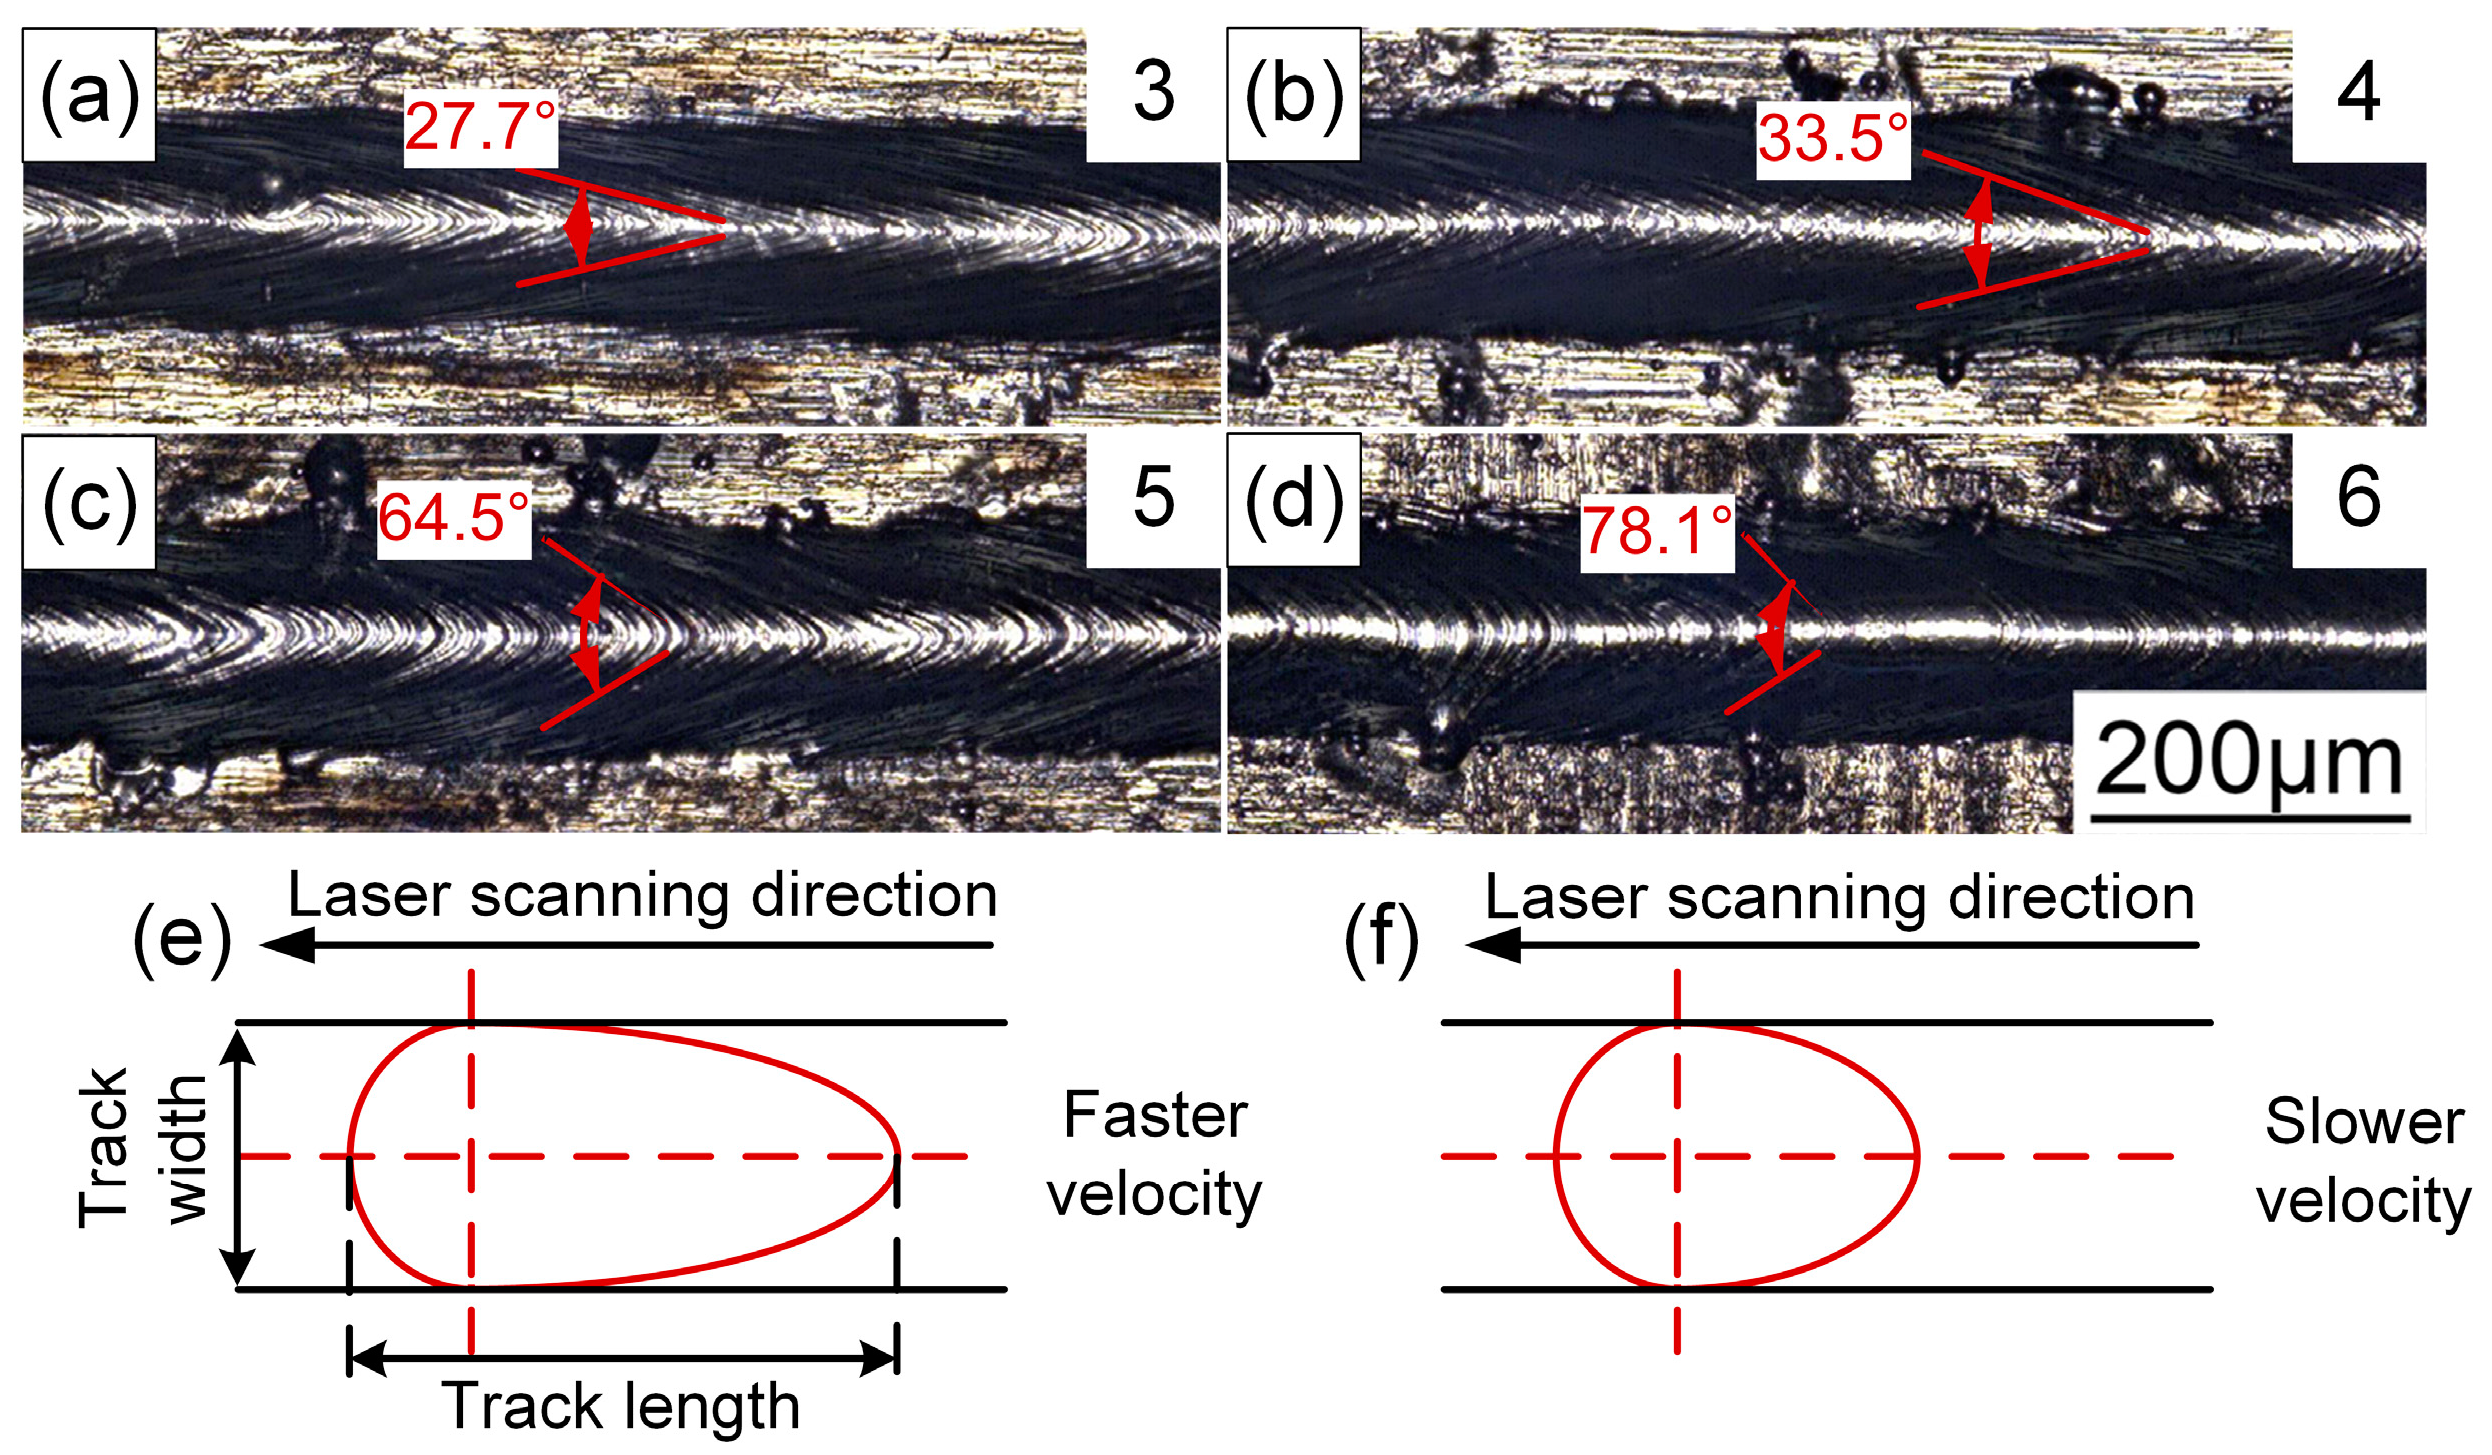
3.1. SLM Forming TA15 Single-Track Experiment

The formability of SLM is largely determined by single-track-forming, which is the basis of SLM forming [22]. To investigate the impact of process parameters on single-track characteristics, single-track-forming experiments were first conducted on a TA15 alloy. Under stable equipment parameters such as smoke extraction, oxygen content, laser, and fixed powder layer thickness, single-track-forming is mainly affected by the laser power P (W) and laser scanning speed V (mm/s). Set different laser powers (50–195 W) and scanning speeds (200–2000 mm/s) to form the TA15 single-track.
The type statistics of every single-track morphology are displayed in Figure 5. The horizontal axis in the figure represents the laser scanning speed, and the vertical axis represents the laser power. Laser power and scanning speed significantly affect the quality of a single-track, as shown in Figure 6. Increasing the scanning speed will progressively result in cladding track distortion, balling phenomena, and even discontinuity while the laser power is fixed. The cladding’s quality will gradually decline while the scanning speed stays the same and the laser power decreases. Divided into three types, corresponding to the three zones in the figure, is the single-track morphology by observation and analysis.
Zone A: Stable forming zone. The cladding track is uniformly wide, straight, and successive. The regular-shaped “fish scale” ripples that were left over when the melt solidified are apparent.
Zone B: Unstable forming zone. Despite being continuous, the cladding track’s varied width causes distortion and even balling phenomena. As the laser power decreases or the laser scanning speed increases, the distortion and balling phenomena of the cladding track become more pronounced.
Zone C: Discontinuous zone. The balling phenomenon of the cladding track is severe, presenting a discontinuous “droplet like” appearance.
The single-track width exhibits a diminishing trend as the laser power decreases and laser scanning speed increases, as shown in Figure 7, reduced to about 50 μm from a maximum of 250 μm.
The morphology of the molten pool above the substrate gradually shifts from a semi-elliptical shape to a spherical shape with increasing scanning speed when the laser power is 195 W, as illustrated in Figure 8, and the depth of the molten pool below the baseplate shows a sharp downward trend. The morphology of the molten pool also gradually changes from a “V” shape to a “circular arc” shape. Additionally, at a scanning speed of 200–600 mm/s, large holes appear in the middle and lower parts of the melt pool. At a scanning speed of 200 mm/s, the size of the holes reaches around 120 μm. As the speed continues to increase, the size of the hole gradually decreases. The hole disappears when the speed surpasses 800 mm/s.
When the laser power is 195 W, as Figure 9 shows, the height of the molten pool exhibits a trend of first descending and then growing as the scanning speed increases. The height decreases from 74 μm at 200 mm/s to 46 μm at 800 mm/s and then increases to between 80–90 μm and tends to stabilize. As the scanning speed increases, the molten pool’s depth decreases sharply from 455 μm to about 30 μm before stabilizing.
The large holes in the molten pool are similar to keyholes in laser welding [23]. When the aspect ratio of the melt pool exceeds 0.5, it is usually a “keyhole mode” melt pool [22,24,25]; otherwise, it is a “conduction mode” melt pool. From Figure 9, as the depth of the molten pool decreases sharply, the aspect ratio of the molten pool also decreases sharply, from 1.3 to around 0.3, and then it tends to stabilize. The aspect ratio decreases to within 0.5 at a scanning speed of 1000 mm/s. But when the scanning speed increases to 1400 mm/s, the melt pool’s height rises to 91 μm, indicating a definite balling phenomenon tendency, and its aspect ratio drops to 0.3. The line of change in the height of the molten pool intersects with the line of change in the depth of the molten pool between 1000 mm/s and 1200 mm/s. Within this range, the molten pool’s depth is between 62 μm and 72 μm, its height is from 52 μm to 67 μm, its width is from 142 μm to 155 μm, and its aspect ratio is between 0.43 and 0.46. The single-track has excellent quality and a reasonable characteristic size.
In SLM research, it is customary to use the laser linear energy density EL to describe the combined effect of laser power and scanning speed. The calculation formula is as follows [26]:
E L = P V
Figure 10 shows how the single-track width rises nonlinearly as the laser linear energy density increases, suggesting that changes in laser power and scanning speed also have an impact on the single-track width. Set up a fixed linear energy density of 0.195 J/mm in a single-track experiment.
From Table 2 and Figure 11, when the laser linear energy density remains constant and the scanning speed is within the range of 1000–500 mm/s, the morphology and width of the cladding are basically consistent, and the morphology characteristics of the melt pool are also quite similar. The aspect ratio is less than 0.5, and no pores are inside the melt pool. However, the single-track width marginally reduces and the molten pool morphological characteristics remain relatively unchanged when the scanning speed falls under 400 mm/s. One track displayed distortion, with its width decreased to 142 μm, at a scanning speed of 300 mm/s.
The inconsistency of the single-track width formed with the same linear energy density also indicates that the influence of laser power and scanning speed on the single-track width is not consistent. By curve fitting the data in Figure 10, the regular relationship between the single-track width W and the laser linear energy density is obtained:
W = 406.85 × E L 0.6311
For a Gaussian laser beam with a fixed spot size heating a metal surface, the formula for calculating the peak temperature T at the center of the beam is as follows [27]:
T = 2 A I σ K π tan 1 2 D t σ
where A is the absorptivity of the material, I is the laser intensity, σ is the diameter of the laser spot, k is the thermal conductivity of the material, D is the thermal diffusivity of the material, and t is the residence time of the laser.
The formula for calculating the laser intensity I is as follows:
I = P 2 π σ 2
For a laser beam with a scanning speed of v, the laser dwell time is approximately σ/v, so the formula for calculating the peak temperature T is as follows:
T = A P σ k π 2 π tan 1 2 D v σ
From the above formula, it can be concluded that a higher laser power or a lower scanning speed results in greater energy input in the localized area. This raises the temperature in the middle of the melt pool, which causes the liquid phase to rise and the cladding track to widen. Furthermore, scanning speed has less impact on the peak temperature than does laser power. While scanning speed mostly influences the energy intake per unit of time, laser power primarily affects the peak temperature. Therefore, even with the same linear energy density, changing the scanning speed will still result in variations in single-track width.
Excessive laser energy density can lead to a “keyhole mode” melt pool, resulting in porosity defects, and the aspect ratio of the melt pool should not exceed 0.5. Conversely, low energy density reduces melting capability, leading to insufficient molten material and causing distortion and a balling phenomenon of the cladding track. Based on the intersection range of the melt pool height and depth variation lines shown in Figure 9, the suitable linear energy density for single-track formation is between 0.165 and 0.195 J/mm. Figure 11 shows that the melt pool width and aspect ratio show similar features at equivalent linear energy densities. Consequently, when the linear energy density is nearly identical, variations in laser power and scanning speed warrant careful consideration due to their significant influence on the formation density and microstructural properties.

3.2. Research on the Formability of TA15 Blocks Formed by SLM

The single-track formation quality is determined by the laser power and scanning speed. The entire surface can be formed through the overlapping of multiple single-tracks. The degree of overlap can be represented by the overlap ratio η, calculated using the following formula:
η = W H W × 100 % = D W W × 100 %
A fixed laser power of 195 W and a moderate scanning speed of 1100 mm/s were used to examine the effect of scanning spacing on the density of the samples while maintaining the quality of single-track formation. Block sizes of 10 × 10 × 5 mm and scanning spacings of 50, 100, 150, and 200 μm were used for fabricating the TA15 samples. The samples’ relative density was measured, and their cross-sectional morphology was observed, as shown in Figure 12.
It is obvious from Figure 12a that a small number of circular holes form at the sample’s edges when the scanning spacing is 50 μm. With a laser power of 195 W and a scanning speed of 1100 mm/s, the single-track melt width and melt depth are 150 μm and 70 μm, respectively, resulting in an aspect ratio of less than 0.5 and no keyholes. As a result, the single-track formation process is not responsible for the holes. A smaller scanning spacing increases the overlap of the clad tracks, leading to an expanded laser remelting area and heat accumulation [28], especially in the edge regions. The shorter laser dwell time results in more pronounced heat, forming a larger melt pool [29]. The increased Marangoni force and recoil pressure within the melt pool cause unstable flow of the molten material [30], which may ultimately entrap gases, leading to pore formation. The sample surface has no porosity and reaches a relative density of up to 99.84% when the scanning space is 100 μm. Unmelted zones result from the overlap width of the clad tracks being almost zero at a scanning interval of 150 μm, as shown in Figure 13. As a result, the sample surface has a few irregular holes, as shown in Figure 12c, which results in a decreased relative density of 99.42%. The size and quantity of the defects resulting from inadequate fusion increase at a scanning spacing of 200 μm, further reducing the sample’s relative density to 99.06%.
Through experimental validation, selecting appropriate process parameters and overlap ratio ensures continuous and smooth single-track formation, with a suitable melt pool aspect ratio and reasonable scanning spacing, thereby achieving high relative density parts. For further verification, a forming process was selected with similar laser linear energy densities and single-track widths around 150 μm but with different scanning speeds, while fixing the scanning spacing at 100 μm to form the TA15 samples. The surfaces of the samples formed at different scanning speeds under similar linear energy densities were smooth, with good overlap of the clad tracks and no significant defects or powder adhesion, as shown in Figure 14. The surface morphologies of samples 1–4 are similar, and as the scanning speed decreases, the surface solidification ripples transition from a conical shape to an arc shape, which is related to the change in the shape of the melt pool [31]. All six sample groups show excellent relative density, as shown in Table 3. With the quality of single-track formation and reasonable scanning spacing ensured, high relative density TA15 samples can be formed. This also confirms that determining single-track formability through single-track experiments and selecting appropriate forming intervals is an effective method for optimizing the SLMed TA15 alloy.

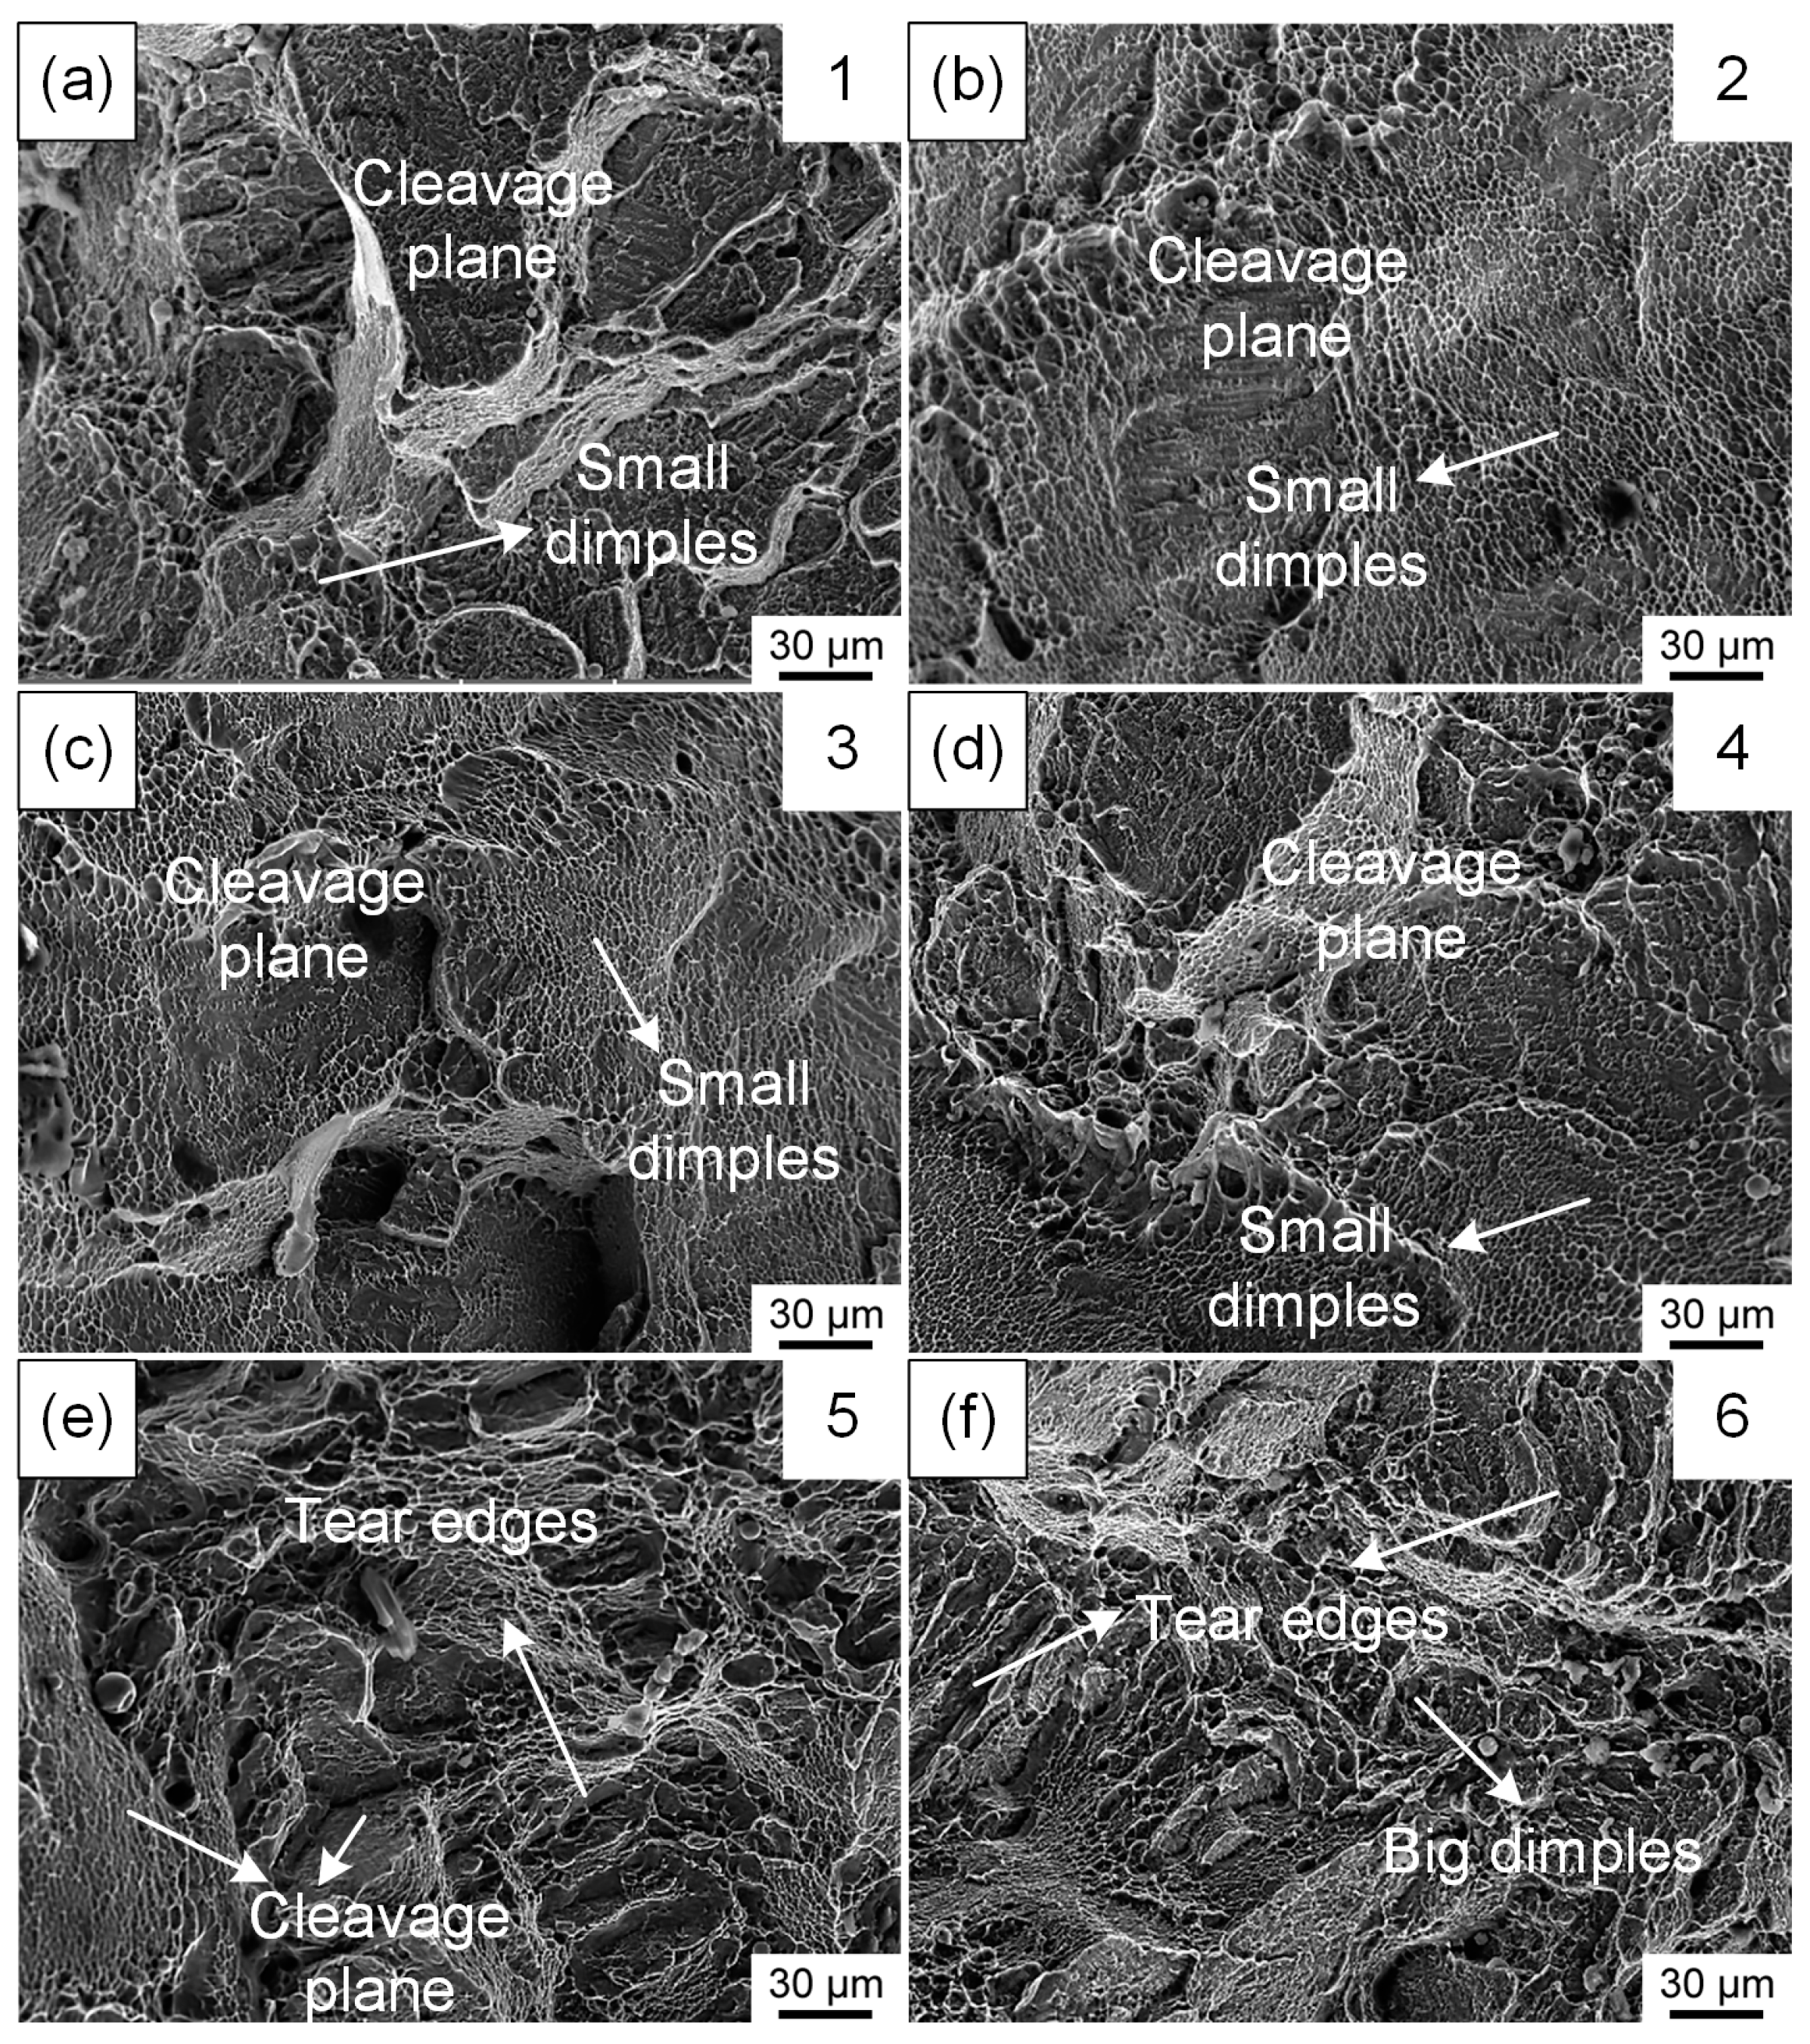
3.3. The Influence of Process Parameters on the Mechanical Properties and Microstructure of SLMed TA15

Figure 15 illustrates the tensile curves and mechanical properties of specimen numbers 1 through 6, with the process parameters of the specimens corresponding to those used for density testing. Table 4 presents the mechanical property data for all specimens. As can be observed from Figure 15a, all specimens exhibit a prolonged yield platform. From Figure 15b, it is evident that within the laser scanning speed range of 900–1050 mm/s, the tensile properties of specimens 1 through 3 show minimal variation, all demonstrating high ultimate tensile strength (1289–1299 MPa) and relatively poor ductility (6.4–6.8%). Table 4 indicates that the hardness values of samples 1–3 range between 385.1 and 389.2, with little variation observed. The strength and hardness of samples 3–6 show a decreasing trend with decreasing scanning speed, while the elongation rate exhibits an increasing trend. Compared with sample 3, sample 6’s ultimate tensile strength, yield strength, and hardness decreased by 58 MPa, 88 MPa, and 21 MPa, respectively, while the elongation rate increased by 2%. Figure 16 displays the fracture morphologies of all tensile specimens, revealing that the fractures of the six specimens exhibit numerous fine dimples, indicative of a mixed ductile-brittle fracture mode. Distinctively, the fractures of specimens 1 through 4 are characterized by extensive flat, large cleavage platforms; the fracture of specimen 4 shows relatively rough dimpled regions; the fractures of specimens 5 and 6 transition to a terraced tearing ridge feature; and the fracture of specimen 6 presents larger dimples. This suggests that specimens 5 and 6 exhibit a tendency toward a ductile fracture mode.
Samples 1, 2, 5, and 6, which show notable performance variations, were chosen for microstructural investigation to examine the causes of the variations in mechanical properties brought about by process parameters. As can be observed from Figure 17, the microstructures of sample 1 and sample 2 exhibit a fine acicular morphology with distinct grain boundaries. The fine acicular structure has been previously identified in related studies on SLMed TA15 [6,7,8,9,12,32] as α’ martensite, with the grain boundaries being those of the primary β phase. Samples 5 and 6 display fine, needle-like α’ martensite structures similar to those in samples 1 and 2, as shown in Figure 17. However, compared with samples 1 and 2, the needle-like structures in samples 5 and 6 appear coarser in certain zones. Additionally, the primary β grain boundaries in samples 5 and 6 are not distinct, requiring differentiation of the primary β grains through the orientation of the α’ martensite lath.
The α’ martensite in the three samples has an obvious size gradation and different grain orientations, as shown in Figure 18a–c. With values of 1.2% and 1.4%, respectively, compared with 0.4% in sample 1, Figure 18d–f shows that the β phase content in samples 5 and 6 is higher than that in sample 1. The average grain sizes for samples 5 and 6 are 1.32 μm and 1.4 μm, respectively, as shown in Figure 18g–i. This represents a minor increase over the average grain size of sample 1, which is 1.14 μm. Due to the presence of the β isomorphous elements V and Mo in the TA15 alloy, the metastable α’ martensite within the SLM-ed TA15 specimens decomposes upon heating in the form of α’ → α + β [5]. During this decomposition process, the β phase nucleates heterogeneously, primarily at the grain boundaries of the α’ martensite and at substructures with high densities of dislocations and twins within the martensite. As solute elements diffuse, the body-centered cubic elements V and Mo gradually dissolve into the β phase, and the composition of the α’ martensite gradually approaches that of the α phase in equilibrium, leading to the nearly homogeneous nucleation of the α phase. The decomposition of the fine acicular α’ martensite results in the formation of fine lamellar α + β phases, and existing research has found that in situ decomposition of α’ martensite occurs during the SLM process [33].
The alterations in the microstructure of the samples are closely related to the thermophysical processes during SLM formation. Although the single-track widths of samples 3–6 are similar, the fish-scale-like “solidification ripples” left on the surface of the single-track after the molten metal cooling is different, as shown in Figure 19. As scanning speed decreases, the ripple structure progressively shifts from conical to circular. It has been established that the form of the “solidification ripples” corresponds to the melt pool profile [34]. At similar energy densities, the width of the melt pool produced by the laser is approximately the same. However, an increase in scanning speed results in changes in heat flow, leading to a more slender melt pool shape [35], transitioning from a “near-spherical” to a “teardrop” shape, as shown in Figure 19e,f. This transition shows that a decrease in scanning speed can result in a decrease in cooling rate even at similar linear energy densities. When the laser repeatedly heats layers that have already been deposited, a slower rate of cooling is more favorable for accumulating temperatures that are appropriate for the in situ breakdown of α martensite [33].
Consequently, in contrast to processes 1 through 4, the SLMed TA15 alloy under processes 5 and 6 undergoes a transformation wherein the α’ martensite decomposes into α + β phases, and the microstructure evolves from a fine acicular to a fine lamellar morphology. The coarsening of the sample microstructure will reduce the effect of fine grain strengthening. Additionally, the body-centered cubic β phase possesses more slip systems compared with the hexagonal, close-packed α/α’ phase [36]. Thus, the higher β phase content helps to improve the samples’ capacity for plastic deformation. The fine, acicular α’ martensite contributes to the specimen’s higher strength but lower plasticity [37], whereas the coarser lamellar α + β phases can enhance the specimen’s plasticity while concurrently reducing its strength [38,39]. This explains why samples 5 and 6 have superior plasticity but comparatively lower strength and hardness.
The experimental results indicate that the SLMed process parameters have a certain influence on the microstructure and properties of the TA15 samples. This also confirms the feasibility of controlling the microstructure of TA15 alloys through process parameter adjustments. The sample’s elongation was 8.4% with a laser power of 90 W and a scanning speed of 400 mm/s, which is comparable to that of conventionally forged TA15. Additionally, the tensile strength was measured at 1233 MPa, significantly surpassing that of forged components. Table 5 shows the room temperature tensile properties of SLMed TA15 from related studies. It can be observed from the table that the microstructure of the TA15 specimens in their fabricated state is generally consistent, predominantly consisting of acicular α′ martensite, with high tensile strength and relatively low elongation. In this study, by employing similar laser linear energy densities and varying the laser power and scanning speed, TA15 specimens with higher elongation were obtained. This also indicates that during the SLM forming of TA15 components, different forming processes can be utilized according to the performance requirements of different parts of the component, thereby achieving parts with varying mechanical properties at different locations.

4. Conclusions

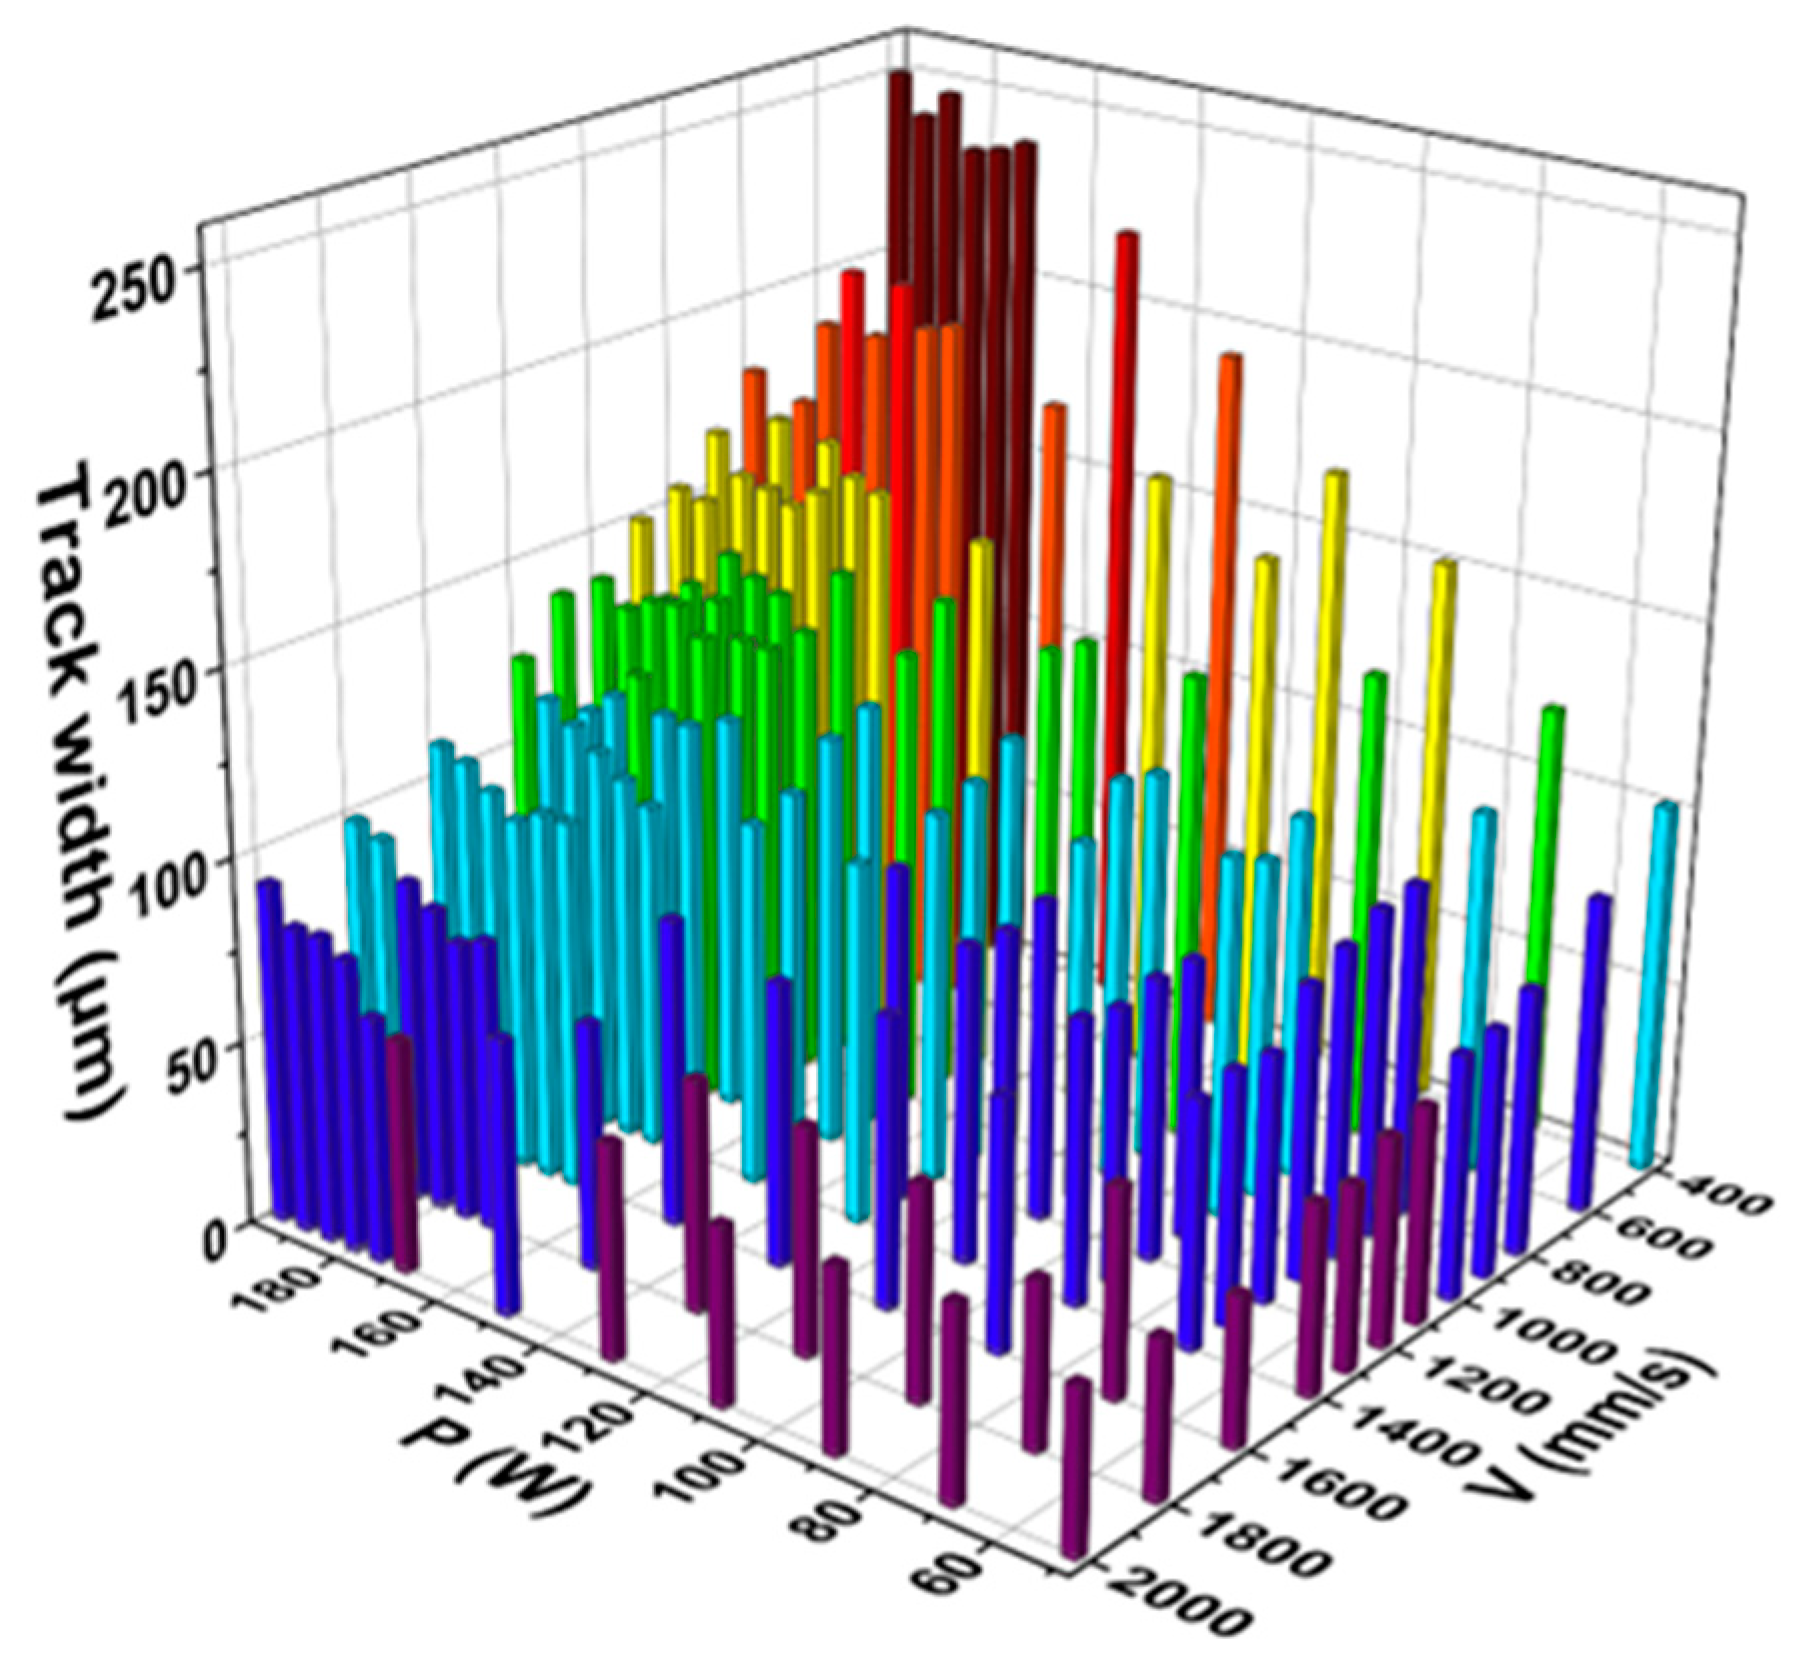
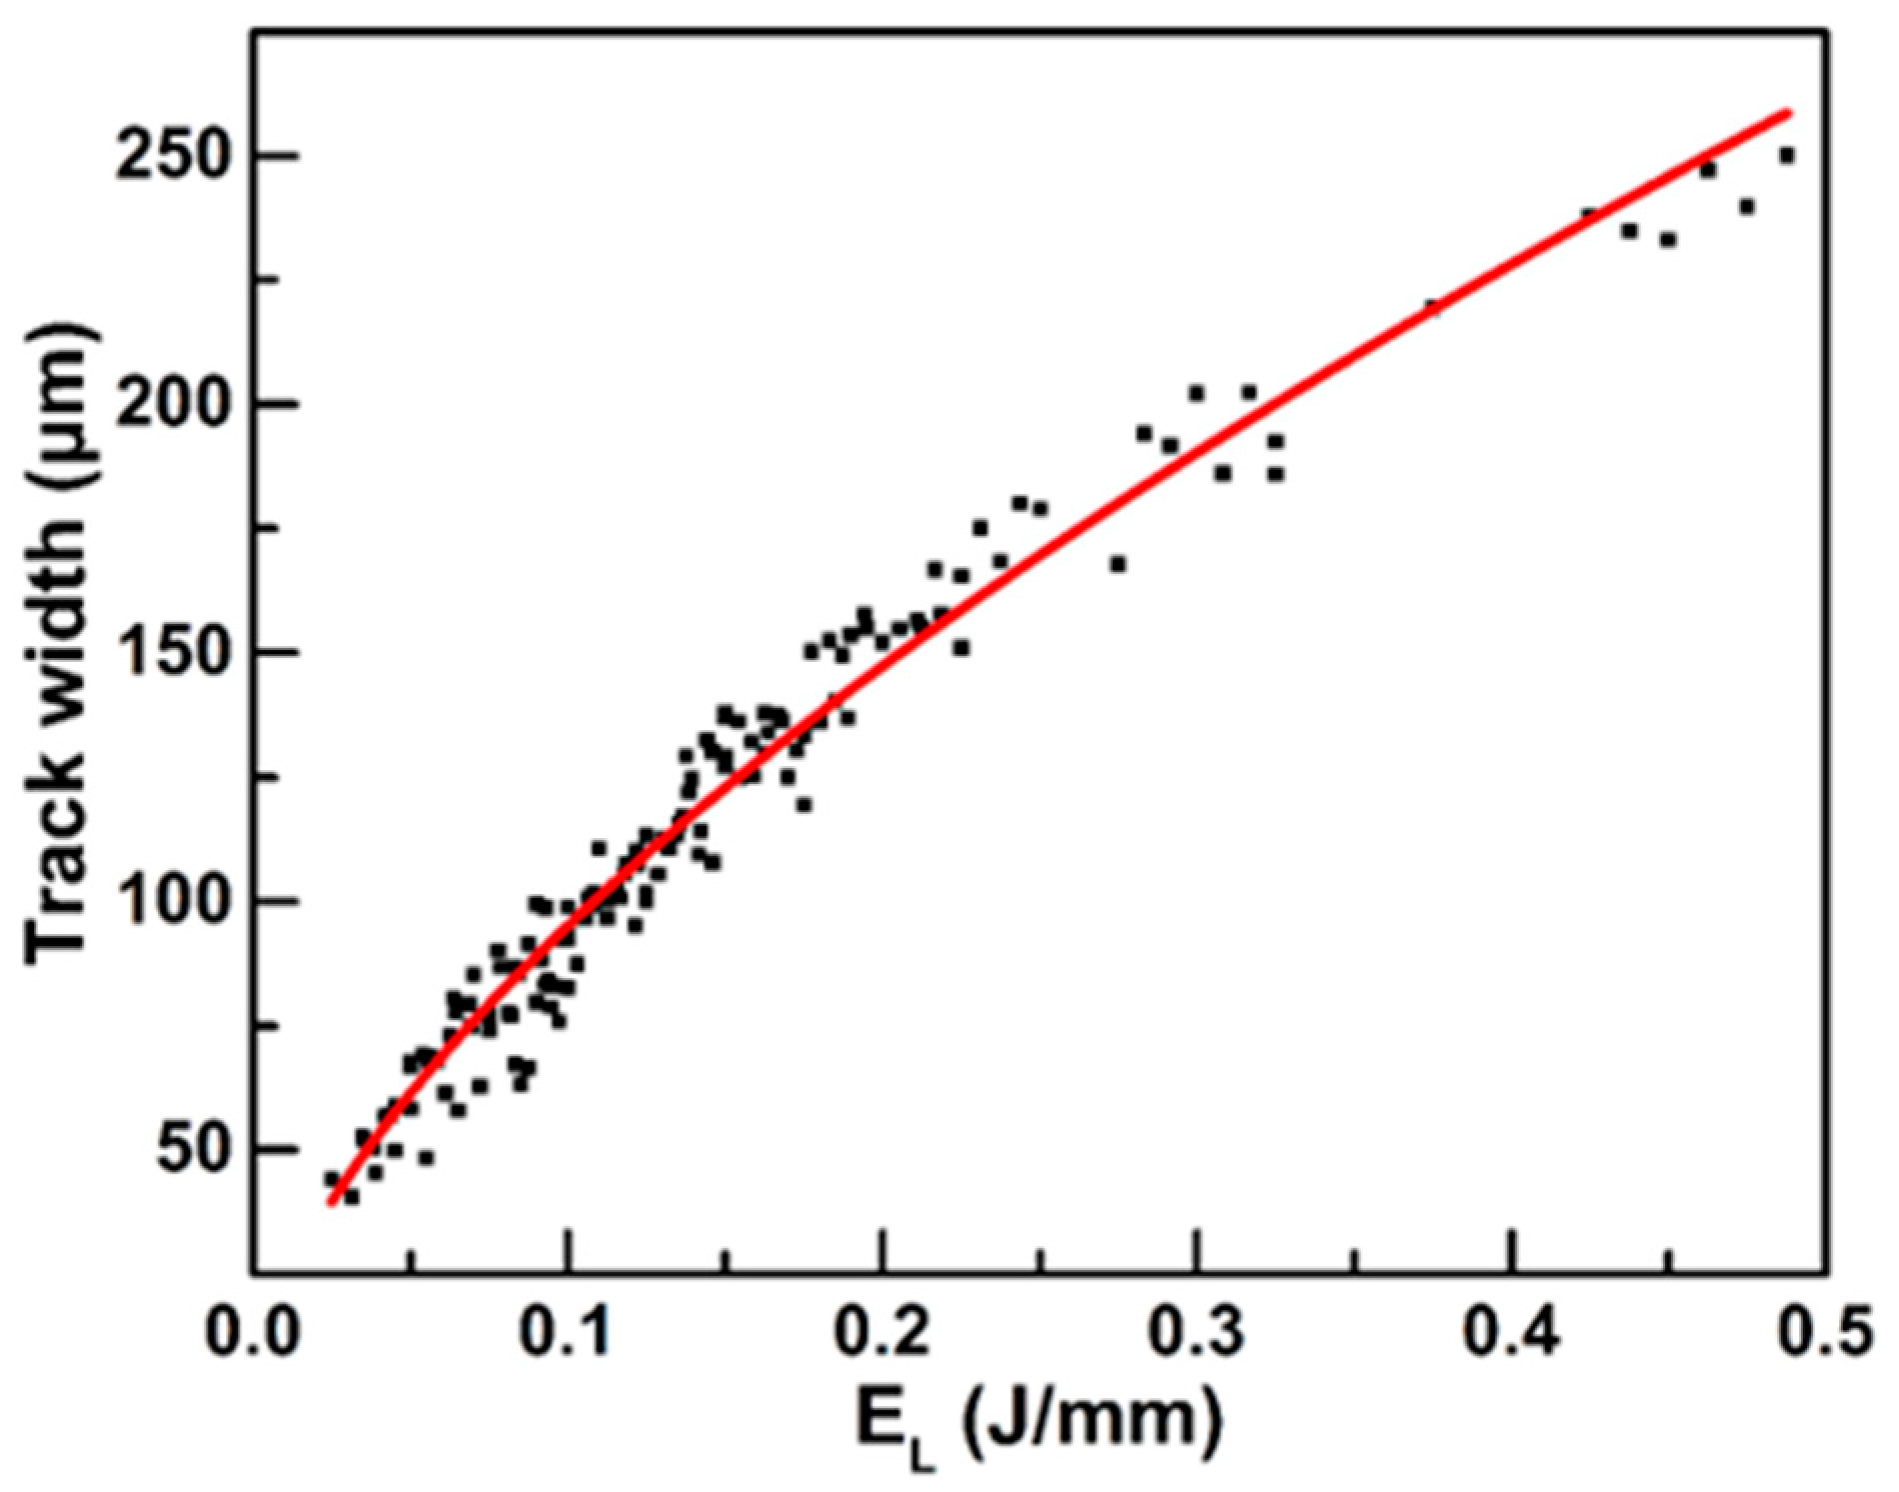
  • The single-track width of SLMed TA15 increases with a higher laser power or lower scanning speed. At the same linear energy density, the single-track width tends to decrease as the laser power decreases, indicating a distinct relationship between linear energy density and single-track width.
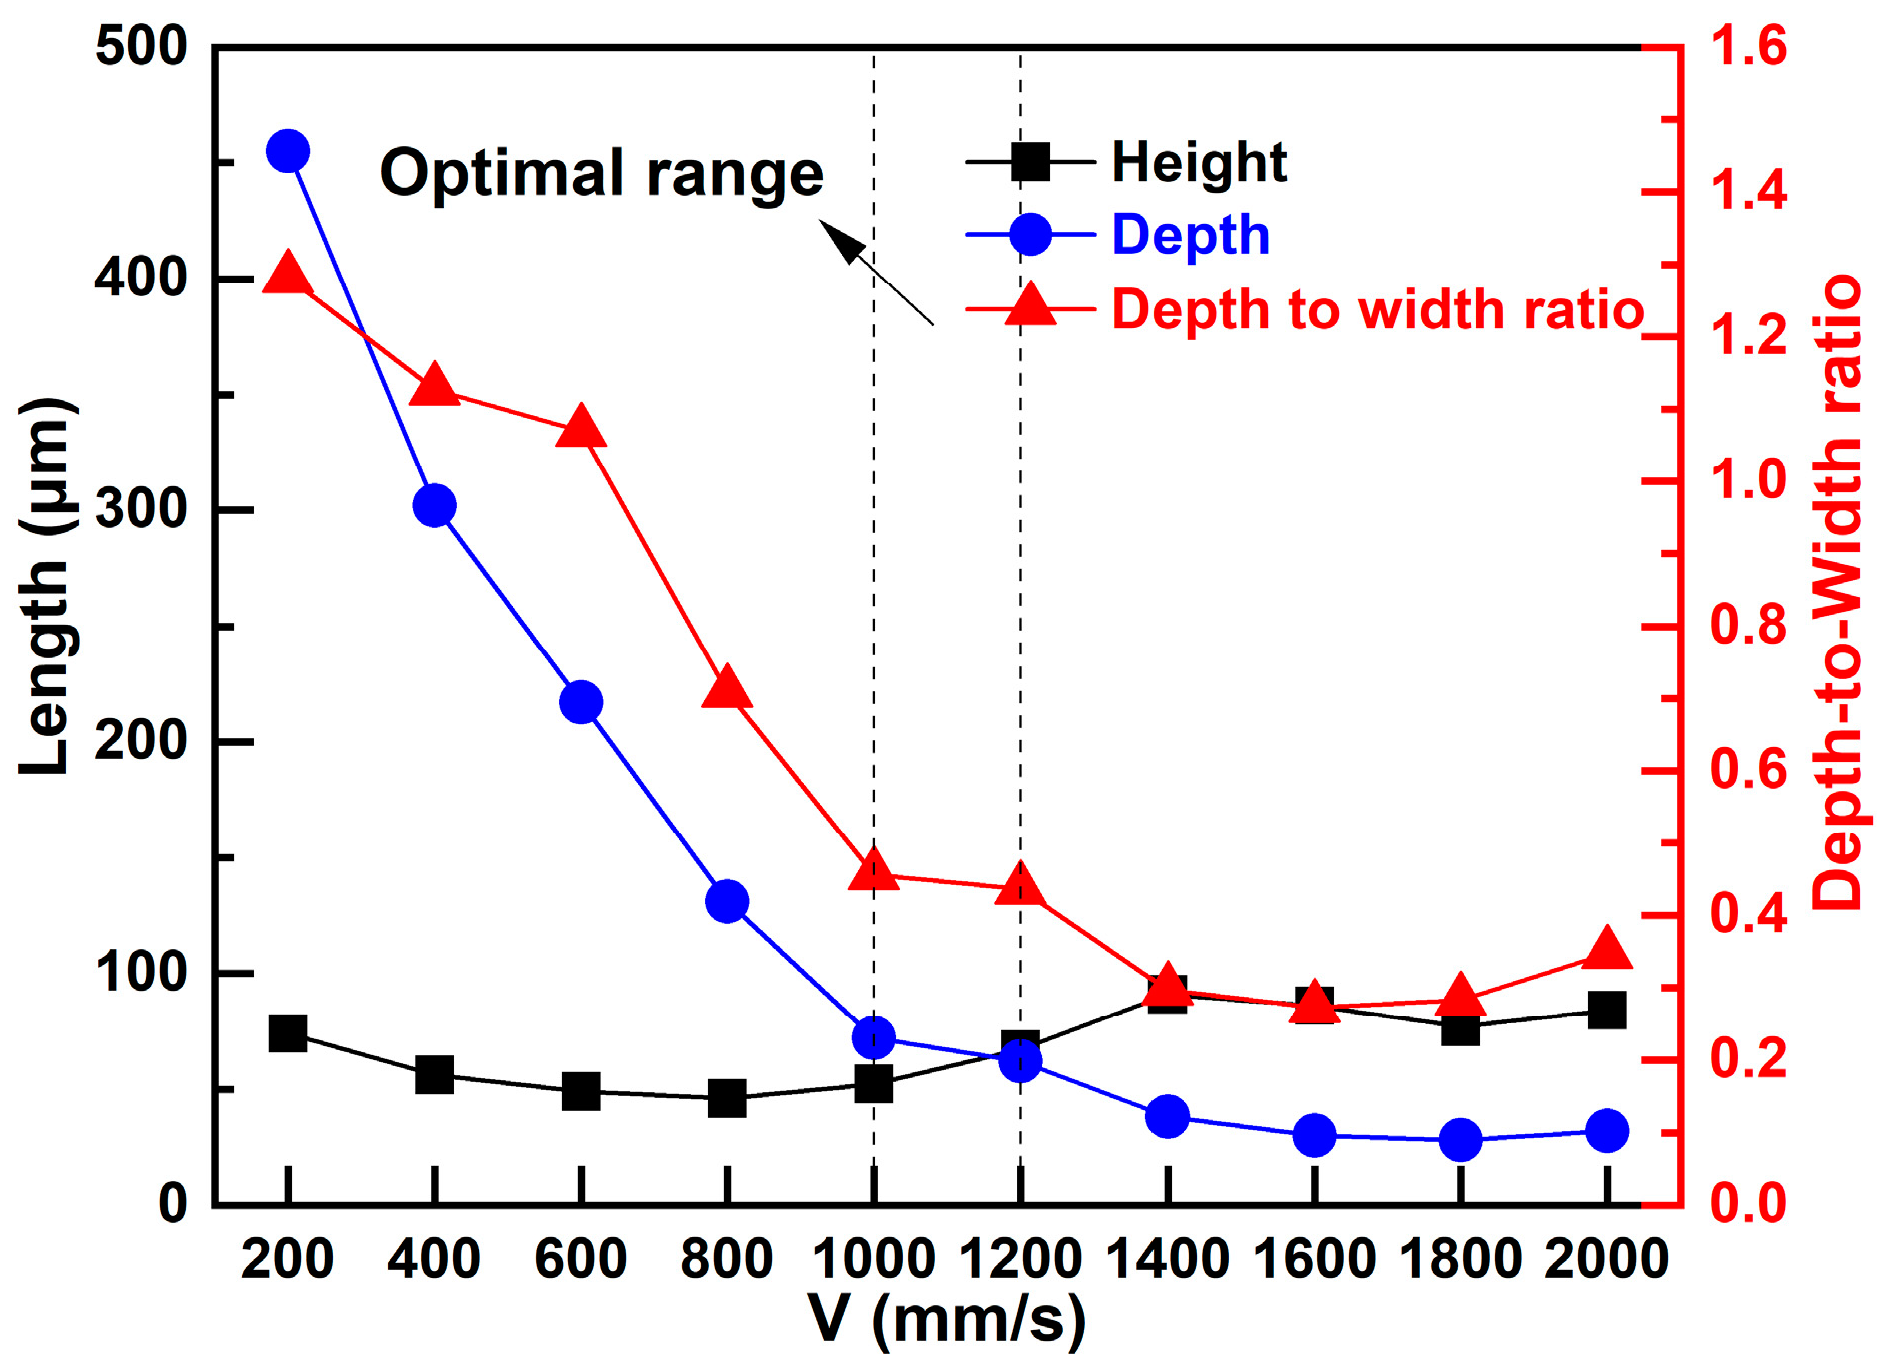
  • At the same laser power, the depth of the melt pool in SLMed TA15 increases as the scanning speed decreases, while the depth-to-width ratio also increases sharply. When the aspect ratio exceeds 0.5, the molten pool transitions from “conduction mode” to “keyhole mode”. When the linear energy density is the same, a single melt pool has a similar aspect ratio.
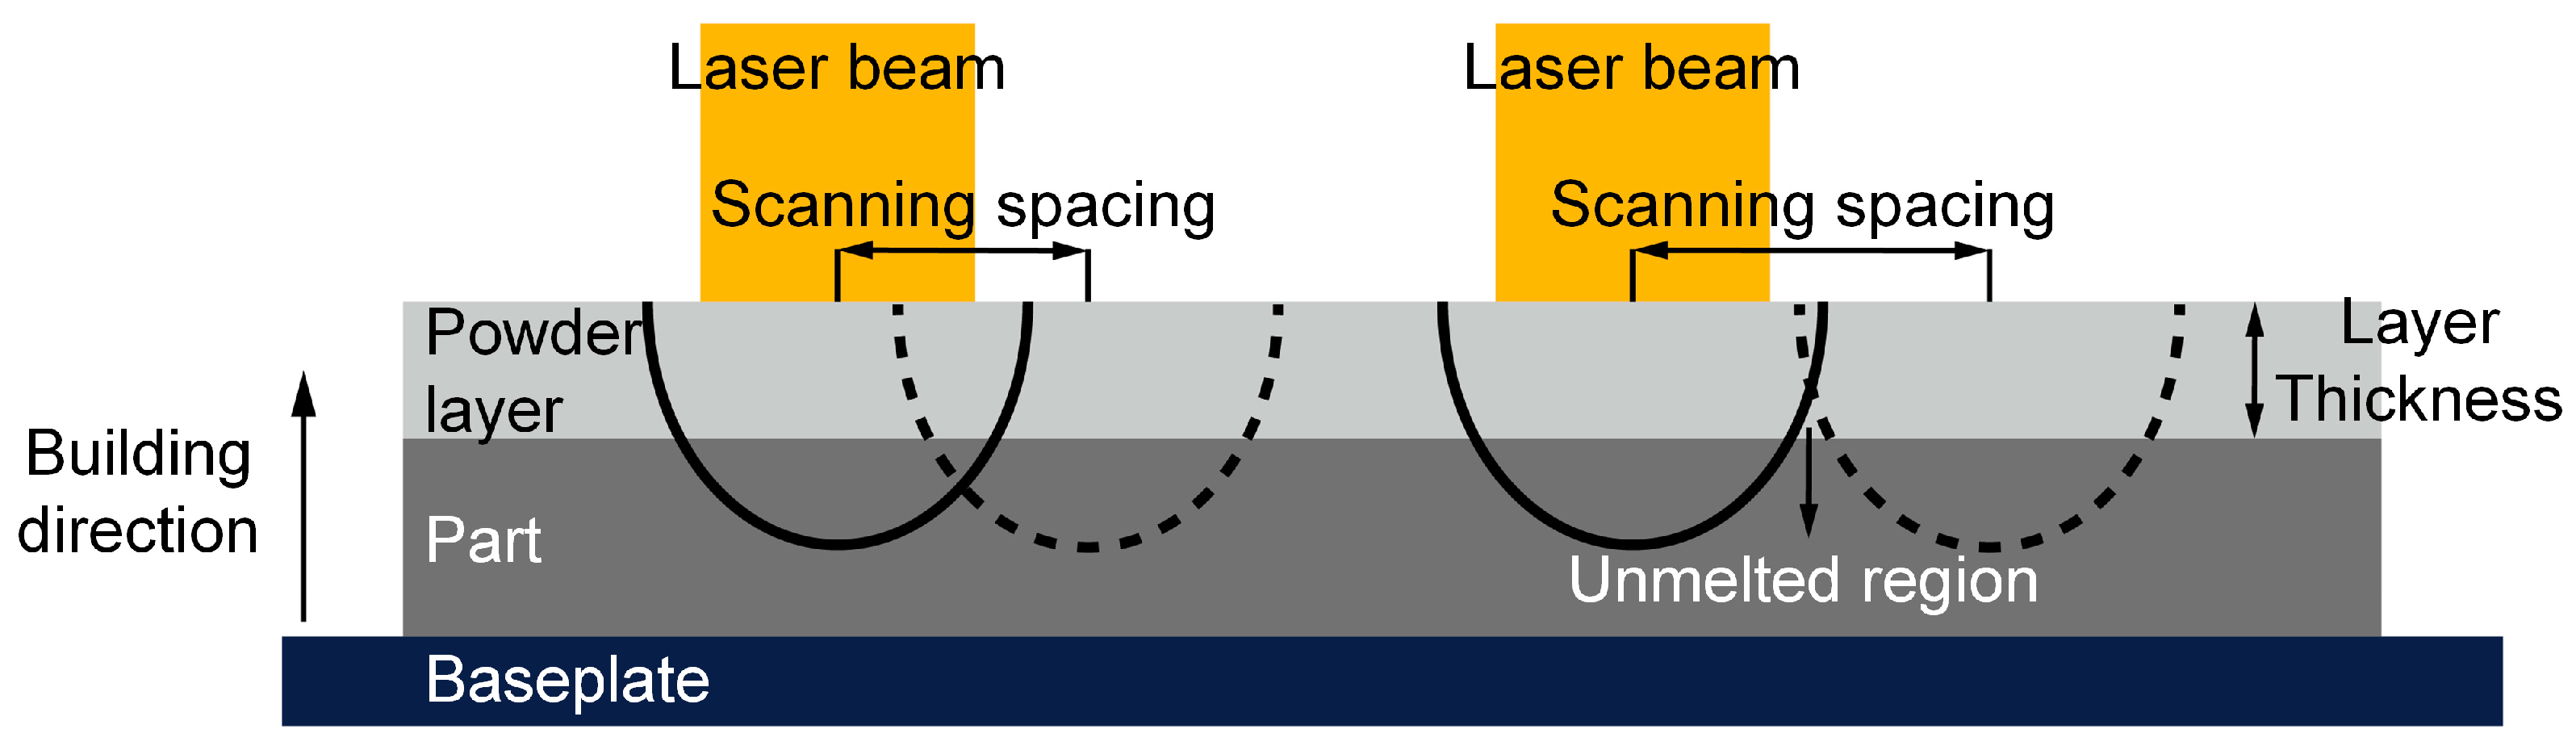
  • When the linear energy density and single-track width are close, combined with an appropriate overlapping rate, high-density TA15 alloy samples can be effectively formed.
  • Under similar laser linear energy density conditions, lower scanning speeds lead to heat accumulation during the SLM process, resulting in the in situ decomposition of α’ martensite. This results in more β phase and coarser α layer lamellar microstructures in the samples, leading to a decrease in strength and hardness while improving plasticity.

Author Contributions

Conceptualization, J.J.; methodology, J.J. and H.C.; formal analysis, J.J. and Y.C.; investigation, Y.W. and H.C.; validation, F.Z. and P.W.; resources, J.J., J.X. and F.Z.; data curation, C.L., J.X. and P.W.; supervision, D.Z.Z.; writing—original draft preparation, J.J., C.L. and Y.C.; writing—review and editing, J.J., Y.W. and D.Z.Z. funding acquisition, J.J. and Y.W. All authors have read and agreed to the published version of the manuscript.

Funding

This research was funded by the Key Research Projects of Higher Education Institutions in Henan Province of China (24A450003, 24A460027), the Natural Science Foundation in Henan province of China (242300421468), and the Henan Provincial Key Laboratory of Intelligent Manufacturing of Machinery and Equipment Open Subjects (IM202308).

Data Availability Statement

The original contributions presented in this study are included in the article. Further inquiries can be directed to the corresponding authors.

Conflicts of Interest

Author Yuanchao Chen was employed by the company Zhengzhou RuiFei Biotechnology Co., Ltd. The remaining authors declare that the research was conducted in the absence of any commercial or financial relationships that could be construed as a potential conflict of interest.

References

  1. Sun, Q.J.; Xie, X. Microstructure and mechanical properties of TA15 alloy after thermo-mechanical processing. Mater. Sci. Eng. A 2018, 724, 493–501. [Google Scholar] [CrossRef]
  2. Wu, H.; Sun, Z.; Cao, J.; Yin, Z. Formation and evolution of tri-modal microstructure during dual heat treatment for TA15 Ti-alloy. J. Alloys Compd. 2019, 786, 894–905. [Google Scholar] [CrossRef]
  3. Huang, D.M.; Wang, H.L.; Chen, X.; Chen, Y.; Guo, H. Influence of forging process on microstructure and mechanical properties of large section Ti–6.5Al–1Mo–1V–2Zr alloy bars. Trans. Nonferrous Met. Soc. China 2013, 23, 2276–2282. [Google Scholar] [CrossRef]
  4. Zhichao, S.; He, Y. Microstructure and mechanical properties of TA15 titanium alloy under multi-step local loading forming. Mater. Sci. Eng. A 2009, 523, 184–192. [Google Scholar] [CrossRef]
  5. Zhang, X.; Zhao, Y.; Bai, C. Titanium Alloy and Its Applications; Chemical Industry Press: Beijing, China, 2005. [Google Scholar]
  6. Wu, X.; Cai, C.; Yang, L.; Liu, W.; Li, W.; Li, M.; Liu, J.; Zhou, K.; Shi, Y. Enhanced mechanical properties of Ti-6Al-2Zr-1Mo-1V with ultrafine crystallites and nano-scale twins fabricated by selective laser melting. Mater. Sci. Eng. A 2018, 738, 10–14. [Google Scholar] [CrossRef]
  7. Jiang, J.; Ren, Z.; Ma, Z.; Zhang, T.; Zhang, P.; Zhang, D.Z.; Mao, Z. Mechanical properties and microstructural evolution of TA15 Ti alloy processed by selective laser melting before and after annealing. Mater. Sci. Eng. A Struct. Mater. Prop. Misrostruct. Process. 2020, 772, 138742. [Google Scholar] [CrossRef]
  8. Huang, S.; Sun, B.; Guo, S. Microstructure and property evaluation of TA15 titanium alloy fabricated by selective laser melting after heat treatment. Opt. Laser Technol. 2021, 144, 107422. [Google Scholar] [CrossRef]
  9. Cai, C.; Wu, X.; Liu, W.; Zhu, W.; Chen, H.; Qiu, J.C.D.; Sun, C.-N.; Liu, J.; Wei, Q.; Shi, Y. Selective laser melting of near-α titanium alloy Ti-6Al-2Zr-1Mo-1V: Parameter optimization, heat treatment and mechanical performance. J. Mater. Sci. Technol. 2020, 57, 51–64. [Google Scholar] [CrossRef]
  10. Jiang, J.; Chen, J.; Ren, Z.; Mao, Z.; Ma, X.; Zhang, D.Z. The Influence of Process Parameters and Scanning Strategy on Lower Surface Quality of TA15 Parts Fabricated by Selective Laser Melting. Metals 2020, 10, 1228. [Google Scholar] [CrossRef]
  11. Yin, A.; Yu, W.; Li, W.; Zhu, W.; Ji, V.; Jiang, C.; Wang, C. Microstructural and thermal relaxation of residual stress in dual peened TA15 titanium alloy fabricated by SLM. Mater. Charact. 2024, 218, 114496. [Google Scholar] [CrossRef]
  12. Xu, W.; Du, Z.; Wang, Z.; Ran, X.; Li, Z.; Chen, R.; Zhu, X.; Zhang, X.; Zhang, J.; Lu, X. A comparative study on the corrosion, wear, and tribocorrosion performances of Ti-6.5Al–2Zr–1Mo–1V (TA15) alloy fabricated by selective laser melting and laser metal deposition. J. Mater. Res. Technol. 2024, 30, 6245–6253. [Google Scholar] [CrossRef]
  13. Xu, W.; Zhu, X.; Wang, Z.; Ran, X.; Li, Z.; Chen, R.; Du, Z.; Zhang, X.; Singh, H.; Zhang, J. Comparative study of Ti-6.5Al-2Zr-1Mo-1V (TA15) alloy fabricated by selective laser melting and laser metal deposition. Opt. Laser Technol. 2024, 176, 111052. [Google Scholar] [CrossRef]
  14. Zhou, L.; Yuan, T.; Li, R.; Tang, J.; Wang, G.; Guo, K.; Yuan, J. Densification, microstructure evolution and fatigue behavior of Ti-13Nb-13Zr alloy processed by selective laser melting. Powder Technol. 2019, 342, 11–23. [Google Scholar] [CrossRef]
  15. Sun, J.; Yang, Y.; Wang, D. Parametric optimization of selective laser melting for forming Ti6Al4V samples by Taguchi method. Opt. Laser Technol. 2013, 49, 118–124. [Google Scholar] [CrossRef]
  16. Khorasani, A.M.; Gibson, I.; Awan, U.S.; Ghaderi, A. The effect of SLM process parameters on density, hardness, tensile strength and surface quality of Ti-6Al-4V. Addit. Manuf. 2019, 25, 176–186. [Google Scholar] [CrossRef]
  17. Zhou, Y.; Wen, S.F.; Song, B.; Zhou, X.; Teng, Q.; Wei, Q.S.; Shi, Y.S. A novel titanium alloy manufactured by selective laser melting: Microstructure, high temperature oxidation resistance. Mater. Des. 2016, 89, 1199–1204. [Google Scholar] [CrossRef]
  18. Song, B.; Dong, S.; Zhang, B.; Liao, H.; Coddet, C. Effects of processing parameters on microstructure and mechanical property of selective laser melted Ti6Al4V. Mater. Des. 2012, 35, 120–125. [Google Scholar] [CrossRef]
  19. Wei, K.; Wang, Z.; Zeng, X. Preliminary investigation on selective laser melting of Ti-5Al-2.5Sn α-Ti alloy: From single tracks to bulk 3D components. J. Mater. Process. Technol. 2017, 244, 73–85. [Google Scholar] [CrossRef]
  20. Hang, B.; Li, C.; Shi, L.; Qiu, G. China Materials Engineering Canon. Volume 4, Nonferrous Metal Materials Engineering. Part One; Chemical Industry Press: Beijing, China, 2006. [Google Scholar]
  21. GB/T 228.1-2010; Metallic Materials—Tensile Testing—Part 1: Method of Test at Room Temperature. Standards Press of China: Beijing, China, 2010.
  22. Yang, J.; Han, J.; Yu, H.; Yin, J.; Gao, M.; Wang, Z.; Zeng, X. Role of molten pool mode on formability, microstructure and mechanical properties of selective laser melted Ti-6A1-4V alloy. Mater. Des. 2016, 110, 558–570. [Google Scholar] [CrossRef]
  23. Rai, R.R.; Elmer, J.; Palmer, T.; Debroy, T. Heat transfer and fluid flow during keyhole mode laser welding of tantalum, Ti–6Al–4V, 304L stainless steel and vanadium. J. Phys. D Appl. Phys. 2007, 40, 5753. [Google Scholar] [CrossRef]
  24. Wei, K.; Wang, Z.; Zeng, X. Effect of heat treatment on microstructure and mechanical properties of the selective laser melting processed Ti-5Al-2.5Sn α titanium alloy. Mater. Sci. Eng. A 2018, 709, 301–311. [Google Scholar] [CrossRef]
  25. King, W.E.; Barth, H.D.; Castillo, V.M.; Gallegos, G.F.; Gibbs, J.W.; Hahn, D.E.; Kamath, C.; Rubenchik, A.M. Observation of keyhole-mode laser melting in laser powder-bed fusion additive manufacturing. J. Mater. Process. Technol. 2014, 214, 2915–2925. [Google Scholar] [CrossRef]
  26. Gu, D.; Shen, Y. Effects of processing parameters on consolidation and microstructure of W–Cu components by DMLS. J. Alloys Compd. 2009, 473, 107–115. [Google Scholar] [CrossRef]
  27. Bäuerle, D. Laser Processing and Chemistry; Springer Science & Business Media: Berlin/Heidelberg, Germany, 2013. [Google Scholar]
  28. Dong, Z.; Liu, Y.; Wen, W.; Ge, J.; Liang, J. Effect of Hatch Spacing on Melt Pool and As-built Quality During Selective Laser Melting of Stainless Steel: Modeling and Experimental Approaches. Materials 2018, 12, 50. [Google Scholar] [CrossRef]
  29. Xia, M.; Gu, D.; Yu, G.; Dai, D.; Chen, H.; Shi, Q. Influence of hatch spacing on heat and mass transfer, thermodynamics and laser processability during additive manufacturing of Inconel 718 alloy. Int. J. Mach. Tools Manuf. 2016, 109, 147–157. [Google Scholar] [CrossRef]
  30. Qiu, C.; Panwisawas, C.; Ward, M.; Basoalto, H.C.; Brooks, J.W.; Attallah, M.M. On the role of melt flow into the surface structure and porosity development during selective laser melting. Acta Mater. 2015, 96, 72–79. [Google Scholar] [CrossRef]
  31. DebRoy, T.; Wei, H.L.; Zuback, J.S.; Mukherjee, T.; Elmer, J.W.; Milewski, J.O.; Beese, A.M.; Wilson-Heid, A.; De, A.; Zhang, W. Additive manufacturing of metallic components–Process, structure and properties. Prog. Mater. Sci. 2018, 92, 112–224. [Google Scholar] [CrossRef]
  32. Wu, X.; Zhang, D.; Guo, Y.; Zhang, T.; Liu, Z. Microstructure and mechanical evolution behavior of LPBF (laser powder bed fusion)-fabricated TA15 alloy. J. Alloys Compd. 2021, 873, 159639. [Google Scholar] [CrossRef]
  33. Xu, W.; Brandt, M.; Sun, S.; Elambasseril, J.; Liu, Q.; Latham, K.; Xia, K.; Qian, M. Additive manufacturing of strong and ductile Ti–6Al–4V by selective laser melting via in situ martensite decomposition. Acta Mater. 2015, 85, 74–84. [Google Scholar] [CrossRef]
  34. Yang, T.; Liu, T.; Liao, W.; MacDonald, E.; Wei, H.; Chen, X.; Jiang, L. The influence of process parameters on vertical surface roughness of the AlSi10Mg parts fabricated by selective laser melting. J. Mater. Process. Technol. 2019, 266, 26–36. [Google Scholar] [CrossRef]
  35. Chen, S.; Guillemot, G.; Gandin, C.-A. Three-dimensional cellular automaton-finite element modeling of solidification grain structures for arc-welding processes. Acta Mater. 2016, 115, 448–467. [Google Scholar] [CrossRef]
  36. Liang, Z.; Sun, Z.; Zhang, W.; Wu, S.; Chang, H. The effect of heat treatment on microstructure evolution and tensile properties of selective laser melted Ti6Al4V alloy. J. Alloys Compd. 2019, 782, 1041–1048. [Google Scholar] [CrossRef]
  37. Kumar, P.; Prakash, O.; Ramamurty, U. Micro-and meso-structures and their influence on mechanical properties of selectively laser melted Ti-6Al-4V. Acta Mater. 2018, 154, 246–260. [Google Scholar] [CrossRef]
  38. Zhang, X.-Y.; Fang, G.; Leeflang, S.; Böttger, A.J.; Zadpoor, A.A.; Zhou, J. Effect of subtransus heat treatment on the microstructure and mechanical properties of additively manufactured Ti-6Al-4V alloy. J. Alloys Compd. 2018, 735, 1562–1575. [Google Scholar] [CrossRef]
  39. Vrancken, B.; Thijs, L.; Kruth, J.-P.; Van Humbeeck, J. Heat treatment of Ti6Al4V produced by Selective Laser Melting: Microstructure and mechanical properties. J. Alloys Compd. 2012, 541, 177–185. [Google Scholar] [CrossRef]
  40. Lu, S.; Li, Y.; Zhen, S.; Yu, D.; Zhang, L.; Chen, R.; Wang, Y.; Li, S. Influence of process parameters on the microstructures, residual stresses and mechanical properties of TA15 titanium alloy fabricated by L-PBF. Mater. Sci. Eng. A 2025, 927, 147990. [Google Scholar] [CrossRef]
Figure 1. (a) Morphology and (b) particle size distribution of TA15 powders.
Metals 15 00233 g001
Figure 2. (a) Flowability and (b) spreading property of TA15 powders.
Metals 15 00233 g002
Figure 3. (a) Schematic diagram of SLM forming single-track, (b) characteristic size, (c) single-track-forming result, and (d) characteristics of the melt pool.
Metals 15 00233 g003
Figure 4. (a) SLMed TA15 specimens and (b) schematic diagram of the tensile specimen dimensions.
Metals 15 00233 g004
Figure 5. Statistics of single-track morphology.
Metals 15 00233 g005
Figure 6. Macroscopic morphologies of TA15 single-tracks with different laser powers and scanning speeds.
Metals 15 00233 g006
Figure 7. Width of TA15 single-tracks with different laser powers and scanning speeds.
Metals 15 00233 g007
Figure 8. Cross-sectional morphologies of single-track molten pools at different scanning speeds.
Metals 15 00233 g008
Figure 9. Variation rule of characteristic size of molten pool with different scanning speeds.
Metals 15 00233 g009
Figure 10. Single-track width with different linear energy densities.
Metals 15 00233 g010
Figure 11. (a) Single-track surface morphologies and (b) molten pool morphologies with different scanning speeds when the linear energy density is 0.195 J/mm.
Metals 15 00233 g011
Figure 12. Surface morphology of the sample when the laser power was 195 W, the scanning speed was 1100 mm/s, and the scanning spacing was (a) 50 μm, (b) 100 μm, (c) 150 μm, and (d) 200 μm, respectively.
Metals 15 00233 g012
Figure 13. Schematic diagram of fusion deficiency defect generation.
Metals 15 00233 g013
Figure 14. The surface morphologies of the samples with different scanning speeds under a similar linear energy density, sample No. 1 (a), sample No. 2 (b), sample No. 3 (c), sample No. 4 (d), sample No. 5 (e), and sample No. 6 (f).
Metals 15 00233 g014
Figure 15. Tensile curves (a) and mechanical properties (b) of TA15 samples with different SLM forming processes.
Metals 15 00233 g015
Figure 16. Fracture morphologies of sample No. 1 (a), sample No. 2 (b), sample No. 3 (c), sample No. 4 (d), sample No. 5 (e), and sample No. 6 (f).
Metals 15 00233 g016
Figure 17. The metallographic diagram of the cross-section of SLM formed TA15: sample No. 1 (a), sample No. 2 (b), sample No. 5 (c), and sample No. 6 (d).
Metals 15 00233 g017
Figure 18. The IPF diagram, phase distribution diagram, and grain size distribution diagram of the cross-section of TA15 formed by SLM, where (a,d,g) are sample No. 1, (b,e,h) are sample No. 5 and (c,f,i) are sample No. 6.
Metals 15 00233 g018
Figure 19. Single-track morphology (ad) and schematic diagram of molten pool formation (e,f) of sample Nos. 3–6.
Metals 15 00233 g019
Table 1. Chemical composition of TA15 powder, wt. %.
ElementTiAlVZrMoSiFeCON
As-received powders Bal.6.372.172.161.30.0170.0720.0290.10.02
Standard [20]Bal.5.5–7.00.8–2.51.5–2.50.5–2.0≤0.15≤0.25≤0.1≤0.15≤0.05
Table 2. Single-track width with different scanning speeds when the linear energy density is 0.195 J/mm.
V (mm/s) 1000900800700600500400300
P (W) 195176156137117987859
Single-track width (μm) 155153156156155153147142
Table 3. The density and relative density of the samples with different scanning speeds under a similar linear energy density.
SampleScanning Speed (mm/s) Laser Power (W) Scanning Space (μm) Linear Energy Density
(J/mm)
Single-Track Width
(μm)
Density (g/cm3) Relative Density (%)
110501901000.181474.45099.98
210001751000.1751474.44699.89
39001601000.1781464.44499.84
48001501000.1891494.44799.91
56001101000.1831524.45099.98
6400901000.2251514.44999.96
Table 4. Mechanical property data of sample Nos. 1–6.
SampleV (mm/s)P (W)H (μm)σU (MPa)σ0.2 (MPa)ε (%)HV1
110501901001299 ± 131170 ± 96.6 ± 0.6389.2 ± 5.3
210001751001289 ± 61169 ± 36.8 ± 0.5387.3 ± 5.3
39001601001291 ± 11171 ± 56.4 ± 0.6385.1 ± 5.2
48001501001273 ± 71157 ± 87.2 ± 0.3382.2 ± 4.5
56001101001251 ± 111095 ± 67.6 ± 0.5373.3 ± 1.9
6400901001233 ± 21083 ± 28.4 ± 0.8364.4 ± 5.1
Table 5. The room temperature tensile properties of SLMed TA15 from previous studies.
ProcessingMicrostructureσU (MPa)ε (%)Ref.
SLMAcicular α′1350 ± 356.0 ± 0.9 [13]
SLMAcicular α′1234.2 ± 53.17.3 ± 0.7 [9]
SLMAcicular α′1214 (XY)
1234 (XY)
9.2 (Z)
34.1 (Z)
[8]
SLMAcicular α′12503.1 [32]
SLMAcicular α′1062.7–1294.9No tests. [40]
Disclaimer/Publisher’s Note: The statements, opinions and data contained in all publications are solely those of the individual author(s) and contributor(s) and not of MDPI and/or the editor(s). MDPI and/or the editor(s) disclaim responsibility for any injury to people or property resulting from any ideas, methods, instructions or products referred to in the content.

